Abstract
We examined the association between changes in swimming velocity, vertical center of mass (CoM) position, and projected frontal area (PFA) during maximal 200-m front crawl. Three well-trained male swimmers performed a single maximal 200-m front crawl in an indoor 25-m pool. Three-dimensional (3D) shape data of the whole body were fitted to 3D motion data during swimming by using inverse kinematics computation to estimate PFA accurately. Swimming velocity decreased, the vertical CoM position was lowered, and PFA increased with swimming distance. There were significant correlations between swimming velocity and vertical CoM position (|r| = 0.797–0.982) and between swimming velocity and PFA (|r| = 0.716–0.884) for each swimmer. These results suggest that descent of the swimmer’s body and increasing PFA with swimming distance are associated with decreasing swimming velocity, although the causal factor remains unclear.
1. Introduction
Water drag has a major influence on swimming performance (i.e., swimming velocity), because the density of water is much greater than that of air [1]. Swimming velocity decreases with swimming distance during maximal 200-m front crawl [2]. Because projected frontal area (PFA) is positively correlated with pressure drag, which is a major component of water drag [3], PFA can be used to evaluate water drag during swimming. Body position (i.e., the vertical position in relation to the water surface) should also be correlated with water drag during swimming, because body position is partly reflected in PFA. Therefore, the question arises as to whether changes in body position and PFA, which are related to water drag, affect swimming velocity during maximal 200-m front crawl. To answer this question, swimming velocity, body position, and PFA need to be evaluated during the course of maximal 200-m front crawl.
The body position of a swimmer is generally evaluated by using the position of the vertical center of mass (CoM). To complement the traditional dryland motion-capture system, an underwater motion-capture system has been developed and can be used to measure limb motion during competitive swimming [4] and vertical CoM position during the course of maximal 200-m front crawl. PFA has been calculated by using underwater cameras [5]. However, calculating PFA during the course of maximal 200-m front crawl is still difficult, because the underwater camera needs to be placed in front of the swimmer. Use of the digital human technology employed in ergonomics research [6] would solve this problem. Our purpose here was to use the underwater motion-capture system and digital human technology to examine the associations between swimming velocity, vertical CoM position, and PFA during maximal 200-m front crawl.
2. Materials and Methods
2.1. Participants
Three male competitive swimmers (age: 22.7 ± 2.9 years; height: 1.69 ± 0.04 m; weight: 63.6 ± 1.96 kg; mean ± SD) participated in the study. All participants were informed about the experimental procedures and the potential risks involved, and gave informed consent. The study was approved by the ethics committee of the National Institute of Fitness and Sports in Kanoya.
2.2. Experimental Design
The experiment was conducted in an indoor 25-m pool. After a routine warm-up, participants performed a single 200-m front crawl at maximal effort. Swimmers were asked to start the swim in the water with a push off from the wall and were emphatically instructed to swim with their maximal effort and without considering race pace throughout the swim.
2.3. Underwater Motion-Capture System
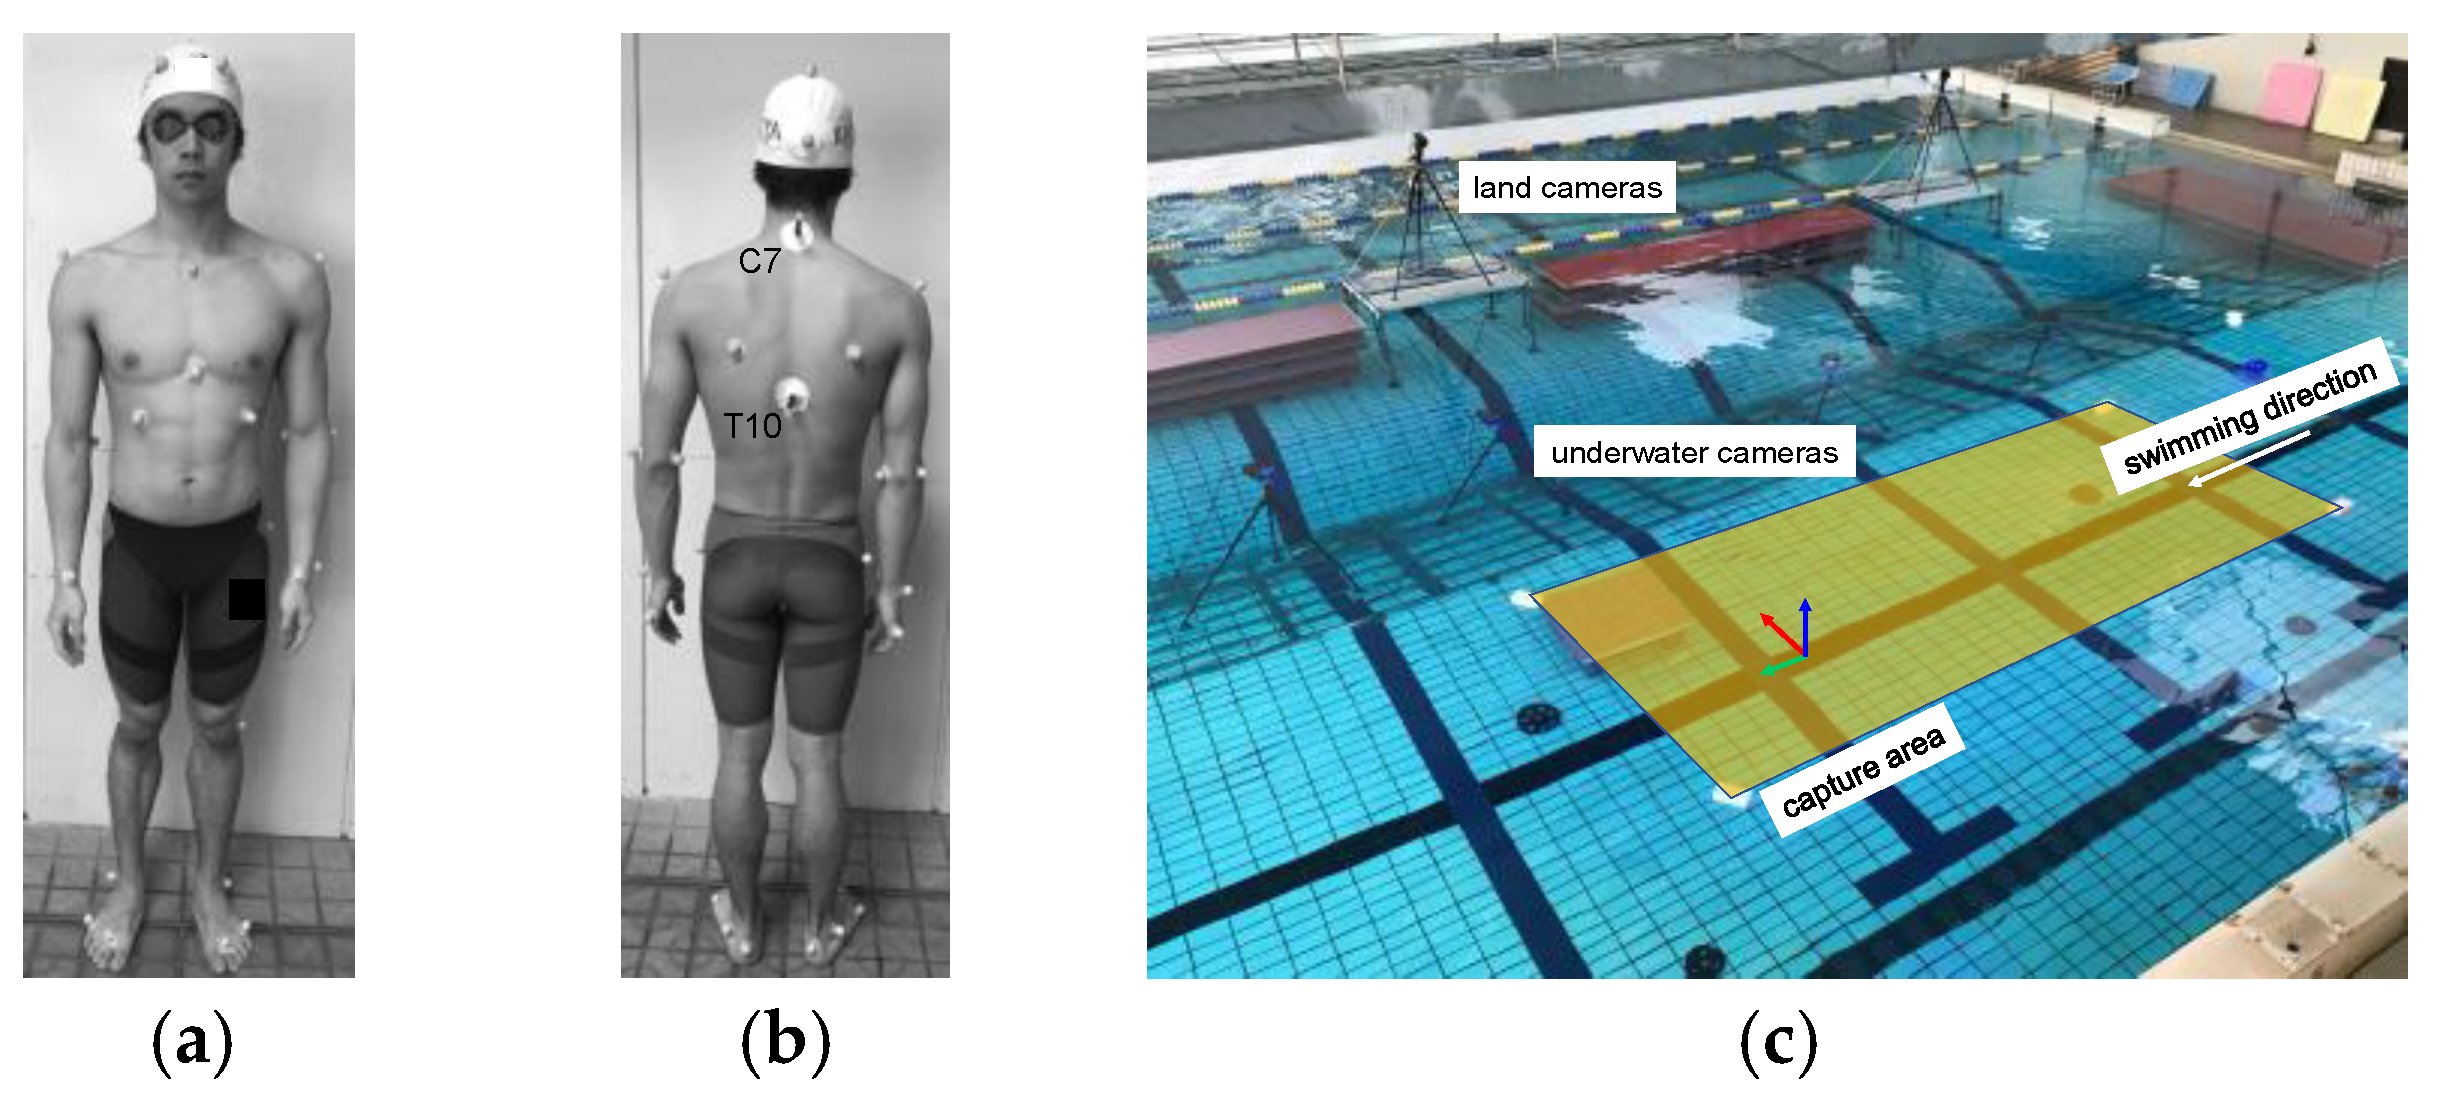
Thirty-four commercially available, spherical reflective markers (diameter 19 mm) purpose-built for underwater motion capture (Qualisys, Göteborg, Sweden) and two reflective tape markers were attached to each participant’s body (Figure 1a,b). The markers were attached to a flat magnetic base (diameter 10 mm, thickness 2 mm), which was attached to either the participant’s skin or his swimwear with adhesive waterproof tape. To minimize the disappearance of markers at the level of the water surface, which would be dead space between the dryland and underwater motion-capture volumes, markers C7 and T10 (Figure 1b) were reflective tape markers attached to the end of the rigid body of 7.0 mm and 10.0 mm, respectively. The buoys (100.0 × 50.0 × 49.2 mm; length × width × height) with three markers were floated on the water surface to detect the water surface (Figure 1c).
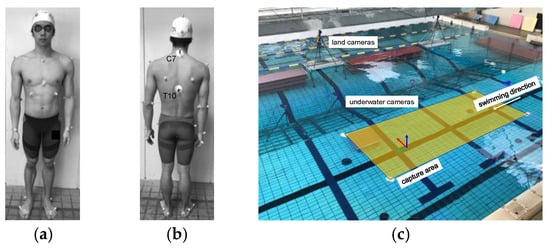
Figure 1.
Experimental setup. (a) Front view and (b) back view of a participant with attachment of the markers; (c) motion-capture camera setup.
The three-dimensional positions of the markers were captured at 100 Hz by using a motion-capture system (Qualisys Track Manager, Qualisys), which incorporated 15 underwater cameras (Oqus300++Underwater, Qualisys) and 10 land cameras (Oqus300+, Qualisys) (Figure 1c). The measurable volume of the system was 2.0 × 8.0 × 2.0 m (length × width × height).
2.4. Body Shape Measurement
On the same day as the swimming trial, we used a 3D photonic image scanner (C9036, Hamamatsu Photonics KK) on dry land to obtain body shape data for each individual in standing posture. We used the same marker position as used in the motion-capture measurements.
2.5. Data Analysis
2.5.1. Individual Models
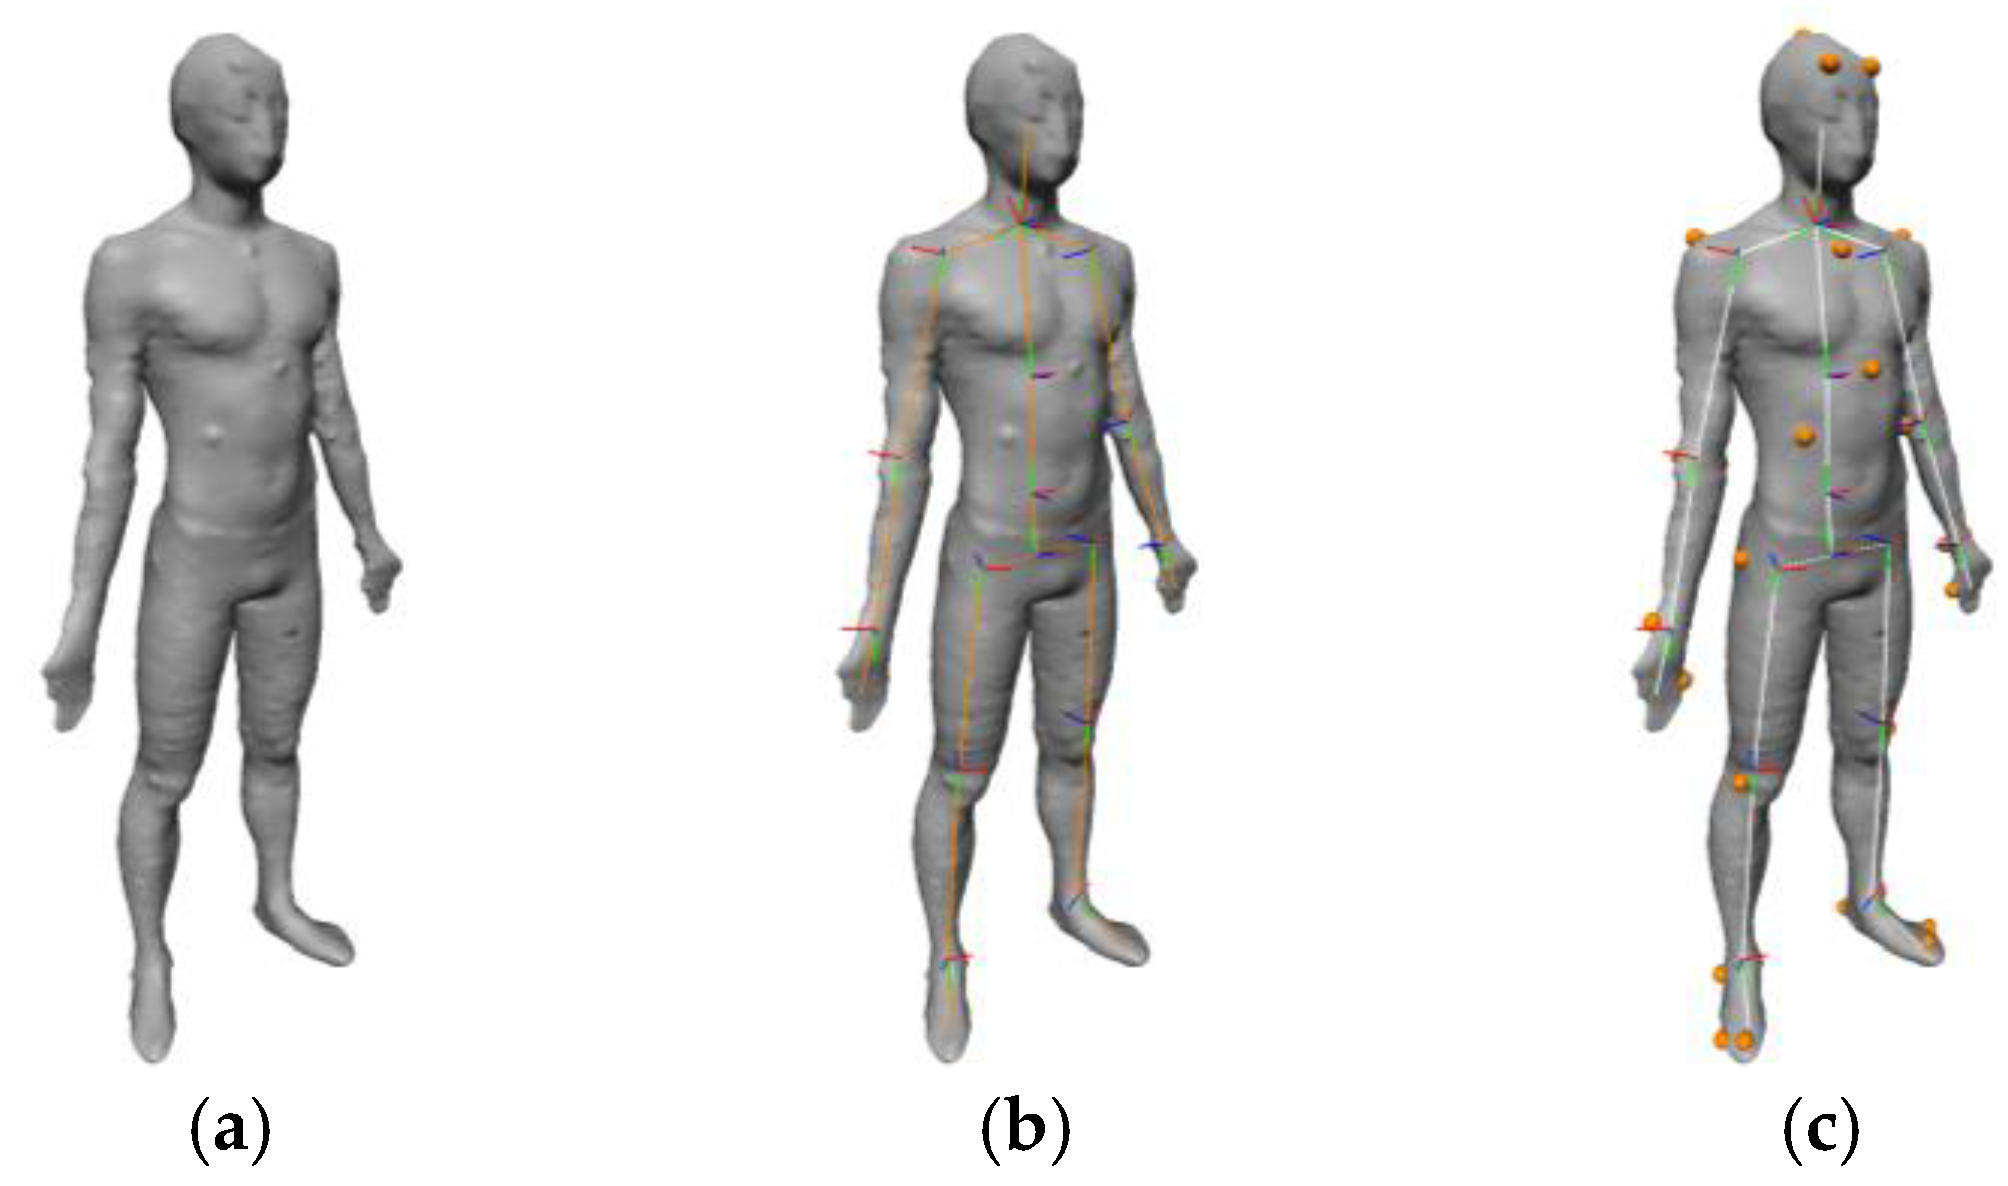
An individual model was constructed to calculate the CoM and PFA accurately. First, body shape data were imported to DhaibaWorks, which is a digital human technology platform software developed by the National Institute of Advanced Industrial Science and Technology (AIST) [7] (Figure 2a). Then, a link segment model was constructed to the body shape model in accordance with each segment length by using the AIST anthropometric database (Figure 2b) [8]. Finally, feature points were added to the individual model to reconstruct the marker position used for swimming motion-capture measurement (Figure 2c).
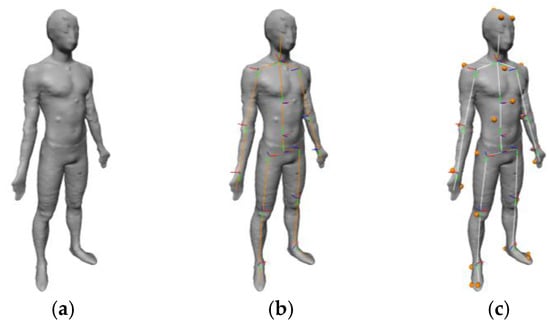
Figure 2.
Process of individual model construction. (a) Import body shape data; (b) construct link segment model; (c) added feature points at the same positions as used for underwater motion-capture measurement.
The feature points of the individual model were fitted to the 3D motion capture data during swimming by using inverse kinematics computation to estimate PFA accurately.
2.5.2. Swimming Velocity and Vertical CoM Position
The CoM of the whole body was calculated from the link segment model, which contained the inertial properties of each segment. Swimming velocity was calculated as a derivative of the horizontal position of the CoM. The vertical CoM position was calculated as the displacement from the water surface, which was detected from the positions of the buoys with reflective markers.
2.5.3. Swimming Kinematics Data
Stroke rate and length were calculated from the vertical CoM position of the swimmer’s right- or left-hand segment. Stroke rate was determined as the inverse of stroke time, which was calculated by averaging the time taken to complete one stroke cycle, as determined from the time of entry of the swimmer’s hand into the water within measurement volume. Stroke length was calculated as the horizontal displacement of the swimmer’s hand during a corresponding stroke cycle. Kick rate and amplitude were calculated from the vertical CoM position of the swimmer’s right- or left-foot segment. Kick rate was determined as the inverse of the time taken to complete three kick cycles during a corresponding stroke cycle. Kick amplitude was determined as the mean value of the vertical displacement of the swimmer’s foot during a complete kick cycle.
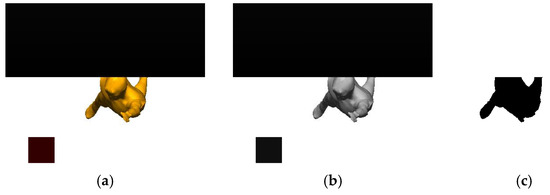
2.5.4. PFA
PFA was calculated by using an image processing technique. The object was set up on DhaibaWorks and masked above the water surface. A reference square (0.20 × 0.20 m) was set up close to the swimmer. Screenshot images of parallel projection from in front of the swimmer were obtained from each frame for a one-stroke cycle (Figure 3a). Then, grayscale processing was performed to simplify the threshold processing (Figure 3b). Finally, binary processing and threshold processing were performed to extract the swimmer’s body and calculate the number of pixels it occupied (Figure 3c). The data obtained were converted from pixels to square meters by using the reference square.
3. Results
Table 1 shows the swimming velocity, vertical CoM position, and PFA throughout the 200-m front crawl. Swimming velocity decreased with swimming distance. The vertical CoM position was lowered with swimming distance. PFA increased with swimming distance. Table 2 shows the swimming kinematics data. Stroke length and rate decreased in the latter part of the swim. Kick amplitude and rate also decreased in the latter part of the swim.

Table 1.
Swimming velocity, vertical center of mass (CoM) position, and projected frontal area (PFA) throughout the 200-m front crawl (n = 3).
Table 2.
Swimming kinematics data throughout the 200-m front crawl (n = 3).
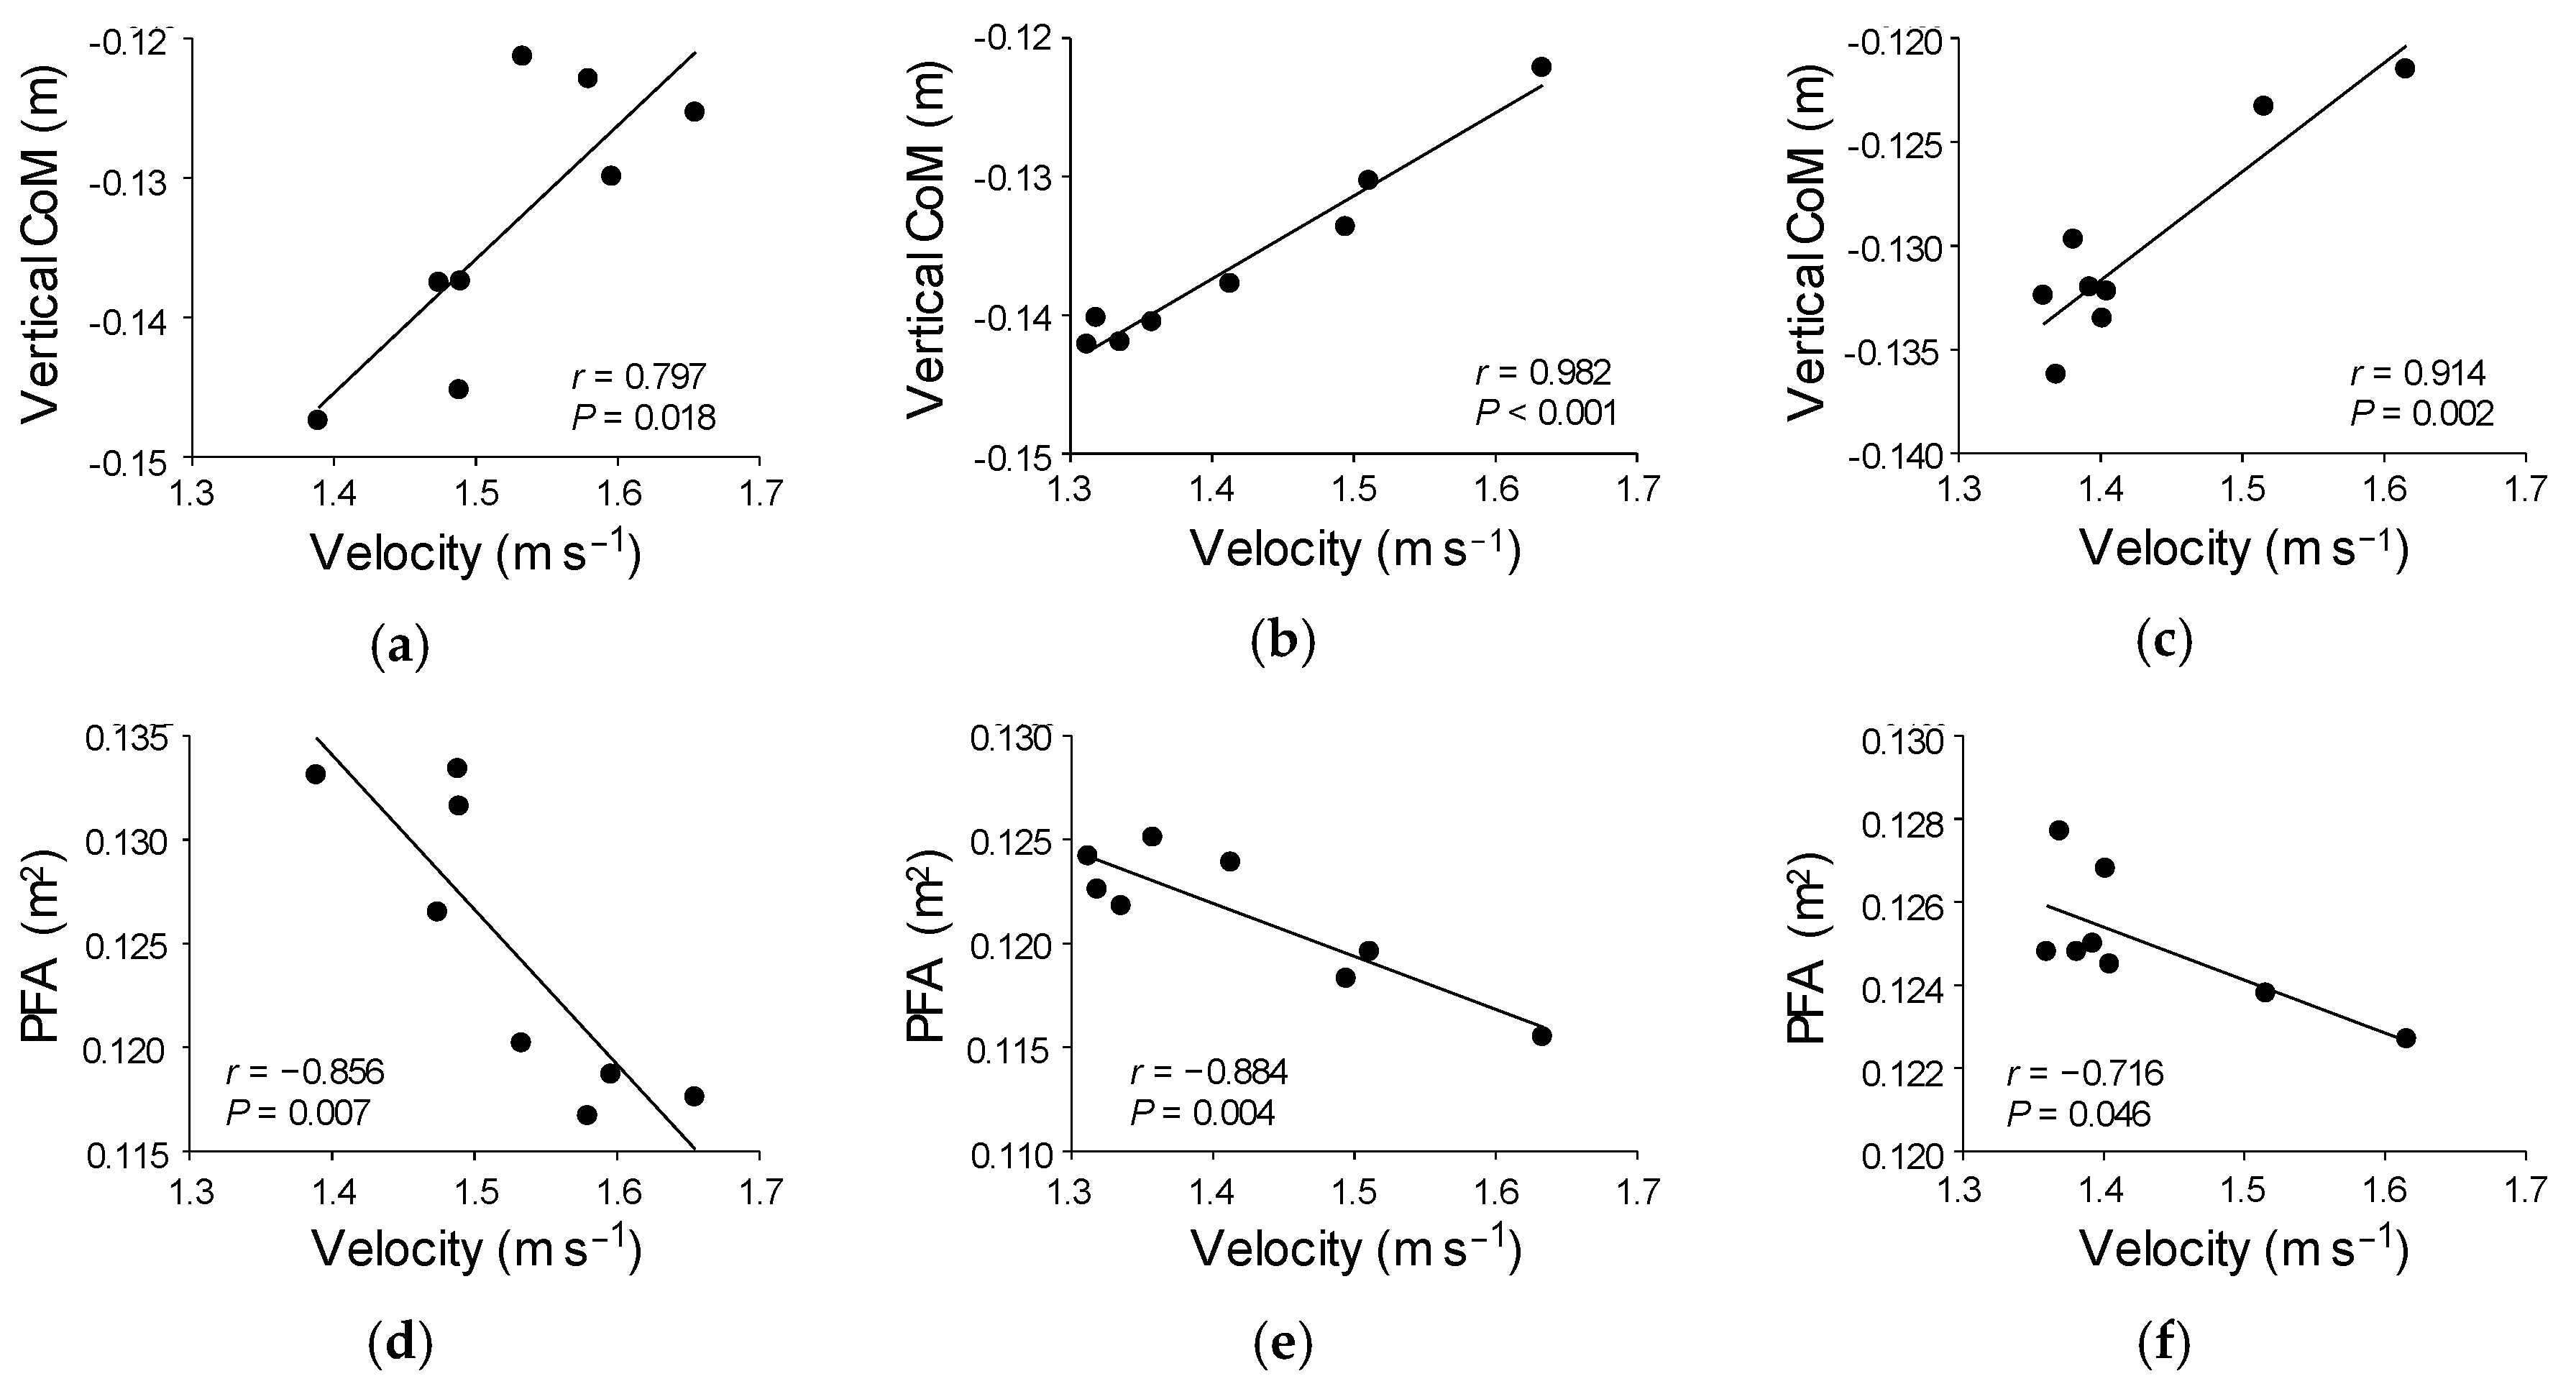
There were also significant correlations between swimming velocity and both vertical CoM position (|r| = 0.797–0.982, P = 0.001‒0.018) and PFA (|r| = 0.716–0.884, P = 0.004‒0.046) for each swimmer (Figure 4).
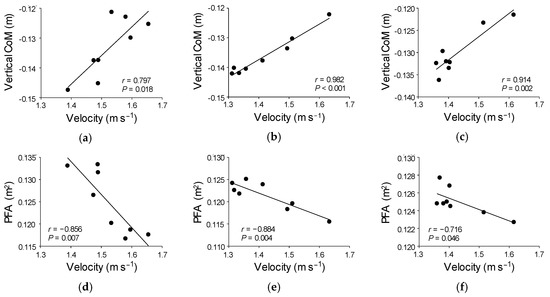
Figure 4.
Relationships between swimming velocity and vertical center of mass (CoM) position (a–c) and between swimming velocity and projected frontal area (PFA) (d–f). (a,d): subject A; (b,e): subject B; (c,f): subject C.
4. Discussion
Our main findings were that (1) vertical CoM position decreased and PFA increased with swimming distance; and (2) swimming velocity was significantly correlated with vertical CoM position and PFA.
The decrease in vertical CoM position and increase in PFA in the latter part of the 200-m swim may have been due to the decrease in swimming velocity. Because lift force is positively correlated with the square of swimming velocity [1], lift force on the swimmer should have decreased with swimming distance in our subjects. Flutter kick motion also affected vertical CoM and PFA. The flutter kick acts to elevate the legs and maintain a hydrodynamic position. We found here that kick amplitude and rate both decreased with swimming distance. Another factor potentially associated with the decreases in vertical CoM and PFA with decreasing swimming velocity is the swimmer’s lung volume. Vertical CoM position decreases with decreasing lung volume of a swimmer [9], and inspiratory muscle fatigue occurs after a 200-m front crawl [10]. However, it is unclear whether lung volume decreased in the latter part of the 200-m front crawl. Thus, the descent in the swimmer’s body and the increase in PFA with swimming distance are associated with decreasing swimming velocity, but the causal factor remains unclear. Further studies need to comprehensively examine this relationship by using lung volume and electromyography data.
Our study had several potential limitations. The first is that the number of strokes analyzed was small. We analyzed only one stroke cycle in every 25 m because of the large volume of measurements required. Therefore, variations between stroke cycles may have affected our results. The second limitation is the experimental design of the swimming trial. For the research purpose, participants were instructed to swim with their maximal effort throughout the 200-m trial, causing rapid muscle fatigue and, consequently, decrease in swimming velocity. At least in subjects B and C, therefore, vertical CoM position and PFA might have been concentrated at lower velocities (Figure 4) throughout the trial. The reason the plot of subject A was more scattered than that of the other subjects may be due to higher endurance capacity in subject A. The third is that a number of reflective markers were attached to the swimmer’s body to analyze swimming kinematics. Attachment of reflective markers reduces the swimming velocity owing to the additional drag in the water [11]. Therefore, it is likely that the experimental conditions were more fatigue-inducing than real race conditions, and this may also have affected the relationships we observed.
In conclusion, the results in the current study suggest that the descent of the swimmer’s body and an increase in projected frontal area with swimming distance were associated with decreasing swimming velocity during maximal 200-m front crawl.
Acknowledgments
This study was supported by grants from Yamaha Motor Foundation for Sports to S.W. and from JSPS KAKENHI (16K13000) to Y.Y.
Conflicts of Interest
The authors declare no conflict of interest.
References
- Toussaint, H.; Truijens, M. Biomechanical aspects of peak performance in human swimming. Anim. Biol. 2005, 55, 17–40. [Google Scholar]
- Figueiredo, P.; Zamparo, P.; Sousa, A.; Vilas-Boas, J.P.; Fernandes, R.J. An energy balance of the 200 m front crawl race. Eur. J. Appl. Physiol. 2011, 111, 767–777. [Google Scholar] [CrossRef] [PubMed]
- Toussaint, H.M.; van Stralen, M.; Stevens, E. Wave drag in front crawl swimming. In Proceedings of the XXth International Symposium on Biomechanics in Sports, Caceres, Spain, 1–5 July 2002; pp. 279–282. [Google Scholar]
- Olstad, B.H.; Vaz, J.R.; Zinner, C.; Cabri, J.M.H.; Kjendlie, P.-L. Muscle coordination, activation and kinematics of world-class and elite breaststroke swimmers during submaximal and maximal efforts swimmers during submaximal and maximal efforts. J. Sports Sci. 2017, 35, 1107–1117. [Google Scholar] [CrossRef] [PubMed]
- Gatta, G.; Cortesi, M.; Fantozzi, S.; Zamparo, P. Planimetric frontal area in the four swimming strokes: Implications for drag, energetics and speed. Hum. Mov. Sci. 2015, 39, 41–54. [Google Scholar] [CrossRef] [PubMed]
- Mochimaru, M. Digital human models for human-centered design. J. Robot. Mechatron. 2017, 29, 783–789. [Google Scholar] [CrossRef]
- Endo, Y.; Tada, M.; Mochimaru, M. Dhaiba: Development of virtual ergonomic assessment system with human models. Digit. Hum. Model. 2014, 3, 1–8. [Google Scholar]
- Kouchi, M.; Mochimaru, M. AIST Anthropometric database. Natl. Inst. Adv. Ind. Sci. Technol. H16PRO 2005, 287, 91–92. [Google Scholar]
- Washino, S.; Mankyu, H.; Yoshitake, Y. Estimation of vertical center of gravity position by underwater motion-capture system with small number of markers during swimming. In Proceedings of the XIIIth International Symposium on Biomechanics and Medicine in Swimming, Tsukuba, Japan, 17–21 September 2018; pp. 182–186. [Google Scholar]
- Lomax, M.E.; McConnell, A.K. Inspiratory muscle fatigue in swimmers after a single 200 m swim. J. Sports Sci. 2003, 21, 659–664. [Google Scholar] [CrossRef] [PubMed]
- Washino, S.; Mayfield, D.L.; Lichtwark, G.A.; Mankyu, H.; Yoshitake, Y. Swimming performance is reduced by reflective markers intended for the analysis of swimming kinematics. J. Biomech. 2019, 91, 109–113. [Google Scholar] [CrossRef] [PubMed]

Publisher’s Note: MDPI stays neutral with regard to jurisdictional claims in published maps and institutional affiliations. |
© 2020 by the authors. Licensee MDPI, Basel, Switzerland. This article is an open access article distributed under the terms and conditions of the Creative Commons Attribution (CC BY) license (https://creativecommons.org/licenses/by/4.0/).