Abstract
Nowadays Off-Grid systems driven by intelligent data analysis, predictive models and real-time optimizations are frequently entitled as Smart Grids. They represent a future step in a sustainable energy supply for applications at various scales, from small household configurations to the systems operating on a scale of larger areas, especially parts of a town or village. One of the key characteristics of such systems is the lower short-circuit power caused by a lower and mostly stochastic nature of their power source, which is represented by a renewable energy source. This phenomenon directly implies the difficulties of sustainable power quality (PQ). Our paper presents an analysis on the lowest possible level, where the impact of household appliances is examined towards a specific kind of response due to PQ parameter variation. The analysis was performed on 120 combinations of appliances. Each combination consisted of three appliances running simultaneously in the microgrid. The measured data were subjected to a statistical analysis. This analysis finds there are several kinds of appliances we need to focus on, in order to express the PQ parameter change of a given parameter. The results show that the microwave, AC heating and drill appliances had a high impact on the total harmonic distortion of voltage (THDV) disturbance. The microwave, AC heating and mower had the highest impact on the total harmonic frequency (FREQ) and the power factor (PF). For the sake of completeness, specific features of the given appliances were examined as for their relevance to the PQ disturbance, which revealed the most relevant features to be taken into account during the development of a predictive model.
1. Introduction
Autonomous energy systems (so called Off-Grid systems) are systems supplied from renewable sources (RESs) and supported by energy storage. Different circumstances need to be considered in such energy source applications, when compared to the standard distribution and transmission systems. The stochastic and unstable character of RES on the part of a source causes the presence of a low short-circuit power, which decreases the stability of power quality (PQ) parameters in the Off-Grid system [1,2]. The frequency (FREQ), voltage disturbance, total harmonic distortion of voltage (THDV) and current (THDC), and flicker severity belong to the most important PQ parameters [3]. It is necessary to keep these parameters within the requested limits to ensure a reliable and safe operation of appliances.
These different circumstances raised an interest in many researchers to develop optimization tools able to detect and backward optimize the PQPs to meet the requested limits according to the internationally defined standards and norms. Relevant algorithms are mentioned in [4,5]. The dominant approaches are machine learning-based algorithms, such as Support Vector Machines (SVM) [6,7], Artificial Neural Networks (ANN) [8,9], Genetic Algorithms (GA) [10] and their combinations. On the other hand, there are studies suggesting the widely known Wavelet Transformations (WT) [11] or Fuzzy based detection [12] to classify the power quality (PQ) failure from the learned patterns. Most of the studies, as it is concluded in [4,5], concentrate on the on-line detection and moderation of the effects of PQ decrease, but they do not focus on the prediction or avoidance of such events in the first place. While most of the available papers deal with the prediction of the total consumption or production [13], this paper examines the separate executions of several appliance combinations in order to examine their impact.2. Experiment Description
The main goal was to find out which appliances (Table 1) have a negative impact on PQ in the Off-Grid system. To test this, each time, we combined 3 different appliances to create a total of 120 combinations. These were switched on and off at defined intervals. The response of the system, in the view of PQ parameters, was measured and stored for statistical evaluations.

Table 1.
Feature values of the applied appliances further used for their relevancy estimation.
They revealed the fact that the appliances were responsible for irregular PQ behaviour, and which of their features were the most relevant for this prediction. This study may be used to design deeper feature engineering procedures in the tasks of PQ parameters, forecasting in order to increase their accuracy.
The selected appliances were combined into triplets resulting in 120 combinations. There were three connected appliances at once because single running appliances in a household are rather uncommon. Appliances were turned on for an equal time (12 min) in our Off-Grid platform to measure the system’s PQ parameters response. To omit the stochasticity produced by RES but keep the low short-circuit power, the system was supplied by charged batteries. Each combination of appliances resulted in a different State of Charge (SoC). The batteries were re-charged using a hybrid inverter to reach the same defined SoC after each triplet was measured. Re-charge lasted for 18 min.
Figure 1 shows the Off-Grid system where 2 photovoltaic panels produce 2 kWp per each under normal conditions. For the reasons mentioned before, all the energy consumed by appliances was supplied from the batteries.
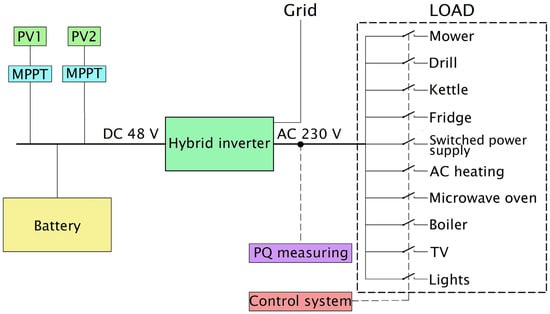
Figure 1.
Scheme of an applied testing platform.
2. Results and Conclusions
The results of the experiments provided in this paper clearly distinguish the negative impact of certain appliances on the PQ parameters. The presence of the microwave significantly affected the behaviour of the frequency parameter. This resulted in a separated cluster that was confirmed and visualized by a Gap statistic-driven K-means algorithm.
A similar situation occurred in the case of the THDV parameter, where the appliances with a negative impact were the microwave, AC heating and drill. The last examined parameter was the power factor, the values of which were disturbed mostly by the mower, microwave and AC heating.
Very similar behaviour was observed in both cases, when batteries were fully and half charged. In the second case, the PQ disturbance was more significant, but the nature and source of the response remained the same.
Load value was estimated as the most relevant appliance feature for the PQP response. This has been directly evaluated by Kraskov MI estimation and later confirmed by the probabilities of the most significant appliances having the largest loads or the loads with the highest standard deviation.
Author Contributions
V.B. and M.P. Experiment design, V.B. Data providing and cleaning, M.P. and T.V. Writing—Original Draft Preparation, T.V. Statistical evaluation, V.B. and M.P. Hardware platform maintenance, S.M. Supervision and funding provider, Z.S. and W.W. Writing—Review & Editing. All authors have read and agreed to the published version of the manuscript.
Acknowledgments
This paper was supported by the following projects: TN01000007 National Centre for Energy, TK02030039 Energy System for Grids, TH02020191 High Density Modular Power Controllers for Automotive and Aerospace Systems, SP2020/129 Research on Smart Grids Technologies and Components III—CENET. The research has been supported also by project WZ/WE-IA/2/2020 of the Bialystok University of Technology and financed from a subsidy provided by the Ministry of Science and Higher Education.
Conflicts of Interest
The authors declare no conflict of interest.
References
- Eckerbert, D.; Larsson-Edefors, P. Interconnect-driven short-circuit power modeling. In Proceedings of the IEEE Euromicro Symposium on Digital Systems Design, Warsaw, Poland, 4–6 September 2001; pp. 414–421. [Google Scholar]
- Saradarzadeh, M.; Farhangi, S.; Schanen, J.L.; Jeannin, P.O.; Frey, D. Combination of power flow controller and short-circuit limiter in distribution electrical network using a cascaded h-bridge distribution-static synchronous series compensator. IET Gener. Transm. Distrib. 2012, 6, 1121–1131. [Google Scholar] [CrossRef]
- Broshi, A. Monitoring power quality beyond en 50160 and iec 61000-4-30. In Proceedings of the IEEE 2007 9th International Conference on Electrical Power Quality and Utilisation, Barcelona, Spain, 9–11 October 2007; pp. 1–6. [Google Scholar]
- Saini, M.K.; Kapoor, R. Classification of power quality events—A review. Int. J. Electr. Power Energy Syst. 2012, 43, 11–19. [Google Scholar] [CrossRef]
- Mahela, O.P.; Shaik, A.G.; Gupta, N. A critical review of detection and classification of power quality events. Renew. Sustain. Energy Rev. 2015, 41, 495–505. [Google Scholar] [CrossRef]
- Biswal, B.; Biswal, M.; Dash, P.K.; Mishra, S. Power quality event characterization using support vector machine and optimization using advanced immune algorithm. Neurocomputing 2013, 103, 75–86. [Google Scholar] [CrossRef]
- De Yong, D.; Bhowmik, S.; Magnago, F. An effective power quality classifier using wavelet transform and support vector machines. Expert Syst. Appl. 2015, 42, 6075–6081. [Google Scholar] [CrossRef]
- Valtierra-Rodriguez, M.; de Jesus Romero-Troncoso, R.; Osornio-Rios, R.A.; Garcia-Perez, A. Detection and classification of single and combined power quality disturbances using neural networks. IEEE Trans. Ind. Electron. 2014, 61, 2473–2482. [Google Scholar] [CrossRef]
- Raptis, T.; Vokas, G.; Langouranis, P.; Kaminaris, S. Total power quality index for electrical networks using neural networks. Energy Procedia 2015, 74, 1499–1507. [Google Scholar] [CrossRef]
- El-Naggar, K.M.; Al-Hasawi, W.M. A genetic based algorithm for measurement of power system disturbances. Electr. Power Syst. Res. 2006, 76, 808–814. [Google Scholar] [CrossRef]
- Nath, S.; Dey, A.; Chakrabarti, A. Detection of power quality disturbances using wavelet transform. World Acad. Sci. Eng. Technol. 2009, 49, 869–873. [Google Scholar]
- Ibrahim, W.R.A.; Morcos, M.M. An adaptive fuzzy self-learning technique for prediction of abnormal operation of electrical systems. IEEE Trans. Power Deliv. 2006, 21, 1770–1777. [Google Scholar] [CrossRef]
- Vantuch, T.; Vidal, A.G.; Ramallo-González, A.P.; Skarmeta, A.F.; Misák, S. Machine learning based electric load forecasting for short and long-term period. In Proceedings of the 2018 IEEE 4th World Forum on Internet of Things (WF-IoT), Singapore, 5–8 February 2018; pp. 511–516. [Google Scholar]

Publisher’s Note: MDPI stays neutral with regard to jurisdictional claims in published maps and institutional affiliations. |
© 2020 by the authors. Licensee MDPI, Basel, Switzerland. This article is an open access article distributed under the terms and conditions of the Creative Commons Attribution (CC BY) license (https://creativecommons.org/licenses/by/4.0/).