Proceeding Paper

Diagnostics and Prognostics of Energy Conversion Processes via Knowledge-Based Systems †

Mechanical Engineering Department, University of Roma 1, 00185 Rome, Italy
*
Author to whom correspondence should be addressed.
Presented at the First World Energies Forum, 14 September–05 October 2020; Available online: https://wef.sciforum.net/.
Proceedings 2020, 58(1), 1; https://doi.org/10.3390/WEF-06937
Published: 14 September 2020
(This article belongs to the Proceedings of The First World Energies Forum—Current and Future Energy Issues)

Abstract

:
This paper presents a critical and analytical description of an ongoing research program aimed at the implementation of an expert system capable of monitoring, through an Intelligent Health Control procedure, the instantaneous performance of a cogeneration plant. The expert system is implemented in the CLIPS environment and is denominated PROMISA as the acronym for Prognostic Module for Intelligent System Analysis. It generates, in real time and in a form directly useful to the plant manager, information on the existence and severity of faults, forecasts on the future time history of both detected and likely faults, and suggestions on how to control the problem. The expert procedure, working where and if necessary with the support of a process simulator, derives from the available real-time data a list of selected performance indicators for each plant component. For a set of faults, pre-defined with the help of the plant operator (Domain Expert), proper rules are defined in order to establish whether the component is working correctly; in several instances, since one single failure (symptom) can originate from more than one fault (cause), complex sets of rules expressing the combination of multiple indices have been introduced in the knowledge base as well. Creeping faults are detected by analyzing the trend of the variation of an indicator over a pre-assigned interval of time. Whenever the value of this ‘‘discrete time derivative’’ becomes ‘‘high’’ with respect to a specified limit value, a ‘‘latent creeping fault’’ condition is prognosticated. The expert system architecture is based on an object-oriented paradigm. The knowledge base (facts and rules) is clustered—the chunks of knowledge pertain to individual components. A graphic user interface (GUI) allows the user to interrogate PROMISA about its rules, procedures, classes and objects, and about its inference path. The paper also presents the results of some simulation tests.

1. Introduction

Modern energy conversion plants are very complex systems from a technological point of view. Any downtime or drop in the energy quality of the output often involves unacceptably high direct and indirect monetary losses, but even more important is the resource destruction that constitutes the end result of the fault. All modern design methods contain procedures that take into due account variable load conditions (off-design operation), availability losses due to scheduled and unscheduled maintenance, and performance degradation due to wear and fouling in the equipment.
To lessen the likelihood of failures, regularly performed preventive maintenance reduces by three to nine times the costs of lost production [1], the higher costs of parts, and other overhaul costs, compared to reactive, unplanned maintenance.
Among the different types of preventive maintenance, condition-based maintenance (CBM) presents several advantages when applied to energy conversion systems. CBM is a maintenance strategy that monitors the actual evolution of the plant operational parameters over time, and reports the cause(s) of any derangement that may be classified as malfunctioning. Therefore, maintenance will only be performed when certain indicators show signs of decreasing performance or upcoming failure. These indicators include non-invasive measurements, performance data and scheduled tests.
Compared with preventive maintenance, CBM thus increases the time between maintenance interventions, because maintenance is done on an as-needed basis [2,3,4].
Condition data can be gathered either at certain intervals or continuously. The sheer size of the data collected from the plant becomes though rapidly overwhelming and makes it difficult to generate a sufficiently accurate and reliable analysis in the usually short time between the warning and the supposed failures. A powerful aid in this task is provided by the implementation of an Expert System, (ES in the following). The choice of a Knowledge-Based ES rather than a deep learning solution is suggested because the unavoidable lack of training data caused by the required short response time means that machine learning approaches fall short. Moreover, the ES works toward explainable AI and expands knowledge through collaborative interactions. All modern ANN-based AI algorithms are like black boxes, resulting in answers and recommendations without any insight into how the system arrived at those answers and which parameters were most significant.
Intelligent process management tools (IPMTs) [5,6] are not only, by definition, capable of producing an intelligent diagnosis of the present state of the plant, but are also able to enact a prognostic action, making intelligent estimates of the future state of the plant under the foreseen boundary conditions [7]. Finally, they can use design, operation and load-scheduling data, together with other relevant external information (such as, for instance, local weather forecasts or projected operating load curves of similar plants in the same ‘‘fleet’’), to provide operators with valuable information about the ‘‘optimal’’ operating curve of the plant in some future period T [8].
The present paper describes the development of a diagnostic and prognostic tool, specifically designed for a gas turbine-based cogeneration system; its development constitutes, though, a useful paradigm for different applications.
Let us define the plant availability factor PF as the ratio of the total equivalent full load operating hours in a year to the total number of hours in the year. It is apparent that no energy conversion plant can operate with a PF equal to 1, due to three orders of reasons:
(a)
plant shutdowns due to scheduled maintenance;
(b)
plant shutdowns due to unscheduled maintenance;
(c)
plant shutdowns due to sudden failures.
It is useful for our purposes to separately account for events of type ‘‘b’’, that imply the replacement of a component for which an early failure has been forecasted, and events of type ‘‘c’’, in which the replacement is done after the failure has forced a plant shutdown.
Our study specifically concentrates on plant shutdowns due to sudden failures. Strictly speaking, ‘‘sudden catastrophic failures’’ rarely happen as such, and when they do, they are obviously, by definition, unforeseeable. However, extensive field studies have conclusively shown that most of the failures we call ‘‘sudden’’ are in reality caused by a series of component-localized phenomena that lead to a (usually very small but still significant) rate of performance deterioration.
Our efforts may thus be redirected to the early detection of these ‘‘performance degradation’’ warning signals. The method to follow is straightforward: a sufficient number of ‘‘critical points’’ in the process are monitored in real time, and a specific series of performance indicators are computed at given (and short) time intervals. Such indicators are defined in such a way that their variation in a certain direction (“increase” or “decrease”, depending on the indicator’s function) constitutes a possible alert about one fault chain being activated. As soon as one of these faults is detected, the operator, working in tight co-operation with the designer and the plant manager, decides whether to execute an immediate shutdown to fix the fault, or to wait until the next scheduled maintenance intervention.

2. The General Conceptual Layout of a Diagnostic/Prognostic System

In the language of Artificial Intelligence we say that a procedure is enacted by an ‘‘Agent’’. In the following description, the agent is our Expert System; but it is easy to recognize a high degree of similarity between the individual steps of the procedure and the actions that a human operator would take when executing the same task. Our scope here is to show that each procedure in its entirety, and each one of its steps, is feasible at the present level of AI technology. We shall separately describe the diagnostic and the prognostic procedures, but will show later that they both admit a meta-procedure, i.e., they can be embedded in a single code.

2.1. A Diagnostic System

A possible procedure for an automatic diagnostic system consists of the following steps:
  • The intelligent agent (IA) must identify in “real time” the operational state of the process. This requires that the IA be endowed with an efficient interface with a data collection system which produces a vector of length N containing an ordered set of measurables, i.e., of process parameters that identify the state (mass flow rates, pressures, temperatures, vibration amplitudes, etc.);
  • At each selected time step, the IA must compare the detected operational state with the expected one. To do this, the IA must have access either to a pre-determined operational process schedule, or, if the latter is not available, to a reliable process simulator that provides the IA with such a reference operating state;
  • If the value of the kth measurable differs from the corresponding design value by more than a preset tolerance, the IA activates a monitoring-and-control procedure on the component this measurable pertains to;
  • The IA verifies whether the ‘‘failure’’ condition just detected appears in one of the ‘’fault chains’’ contained in its Knowledge Base. If it does, then the IA proceeds to step 5 here below. If it does not, the IA activates a sub-procedure to monitor k for a prescribed period of time, and notifies the (human) plant operator of this action;
  • If the event ‘‘kth measurable out of range’’ belongs to one or more fault chains known to the IA, the agent launches a monitoring-and-control procedure on all measurables i, j, , p that appear together with k in the detected fault chains;
  • If a fault chain is indeed identified as ‘‘active’’, the IA will: a—notify the plant operator; b—consult its Knowledge Base to search for remedial actions (e.g., adjustment of other process parameters to compensate for the derangement in k); c—decide whether it is possible to wait for the next scheduled maintenance intervention or a repair/substitution is immediately necessary.

2.2. A Prognostic System

A possible procedure for an automatic prognostic system consists of the following steps:
  • The IA must compare at a pre-determined time step the operational state of the process;
  • The IA projects the detected operational state forward in time, founding this projection on the most recent time history (i.e., extrapolating from two or more previous time steps) of the process;
  • If the projected value of the kth measurable at t + Δt activates one of the known fault signatures, or if it shows an undesirable trend in the time history of xk (e.g., “dxk/dt too high” according to some norm), the IA activates a monitoring-and-control procedure on the component to which this measurable pertains;
  • The IA also launches a monitoring-and-control procedure on all measurables r, s, , z that are related to k (i.e., whose values are known to be functionally linked to the value of xk);
  • Otherwise, the IA continues monitoring xk for a pre-defined time interval, and notifies the plant operator of this action;
  • If the IA estimates that a fault chain may be ‘‘activated’’ by an excessive variation of xk, it will:
    A.
    Notify the plant operator;
    B.
    Consult its Knowledge Base to search for and recommend suitable remedial actions (e.g., adjustment of other process parameters to compensate for the derangement in xk);
    C.
    Decide whether it is possible to wait for the next scheduled maintenance intervention or a repair/substitution is immediately necessary.
Notice the remarkable analogy between the steps of the diagnostic procedure and those of the prognostic procedure.

3. Theoretical and Practical Aspects of the Implementation of the Intelligent Agent

For the intelligent agent to be in fact ‘‘expert’’ and ‘‘intelligent’’ in performing his task, its knowledge base (KB) must be as ‘‘complete’’ and ‘‘exact’’ as possible:
  • ‘‘Complete’’ means that there must exist a one-to-one mapping of all rules and information available to the human operator and this KB.
  • ‘‘Exact’’ means that this mapping must be logically consistent, i.e., that no logical chain of induction correctly derived from the KB contradicts any of the rules and information available to the human operator.

3.1. The Meta-Rules of Failure Detection

It is known from AI theory [9,10] that it is convenient to re-organize, wherever possible, the knowledge bits acquired during the knowledge acquisition phase. Such a systematization goes in favor of the transparency and the accessibility of the ‘‘built-in-logic’’ of the expert system. In the case we are discussing, we are dealing with ‘‘failures’’ of a system, and we have found it useful to construct our KB on the basis of the following seven meta-rules:
  • There exists a finite number of possible types of failure, and for each one of them there exists at least one specific signature, i.e., a unique combination of the process parameters;
  • There are no sudden failures; every possible failure is ‘‘forewarned’’ by a drifting of the point representative of the operational state of the plant, on a path that leads to a specific attractor in the state space (the failure point);
  • Each one of these ‘‘drifting’’ processes has a characteristic time scale that depends both on the component and on the type of failure;
  • A convenient way to represent such a drifting is that of employing a proper set of dimensionless indicators, each defined as the ratio of the instantaneous value of a measurable of interest to its ‘‘design’’ value. Notice that such a design value is in reality a time-dependent quantity; it is the value expected for the same instantaneous operative conditions but without any derangement;
  • The process of ‘‘failure formation’’ is described by at least one ‘‘fault chain’’, i.e., an ordered list of the immediate causes of the failure. The detection of an “indicator derangement” may be related to more than one chain: the same final failure (“effect”) may be caused by different chains of initial derangements (“causes”). Each chain, though, has at least two fuzzy aspects—first, the ‘‘causes’’ it contains are necessary, but not sufficient (for example, for a creep failure in a first row statoric blade in a gas turbine, it is necessary that the gas temperature at the turbine inlet be higher than a certain design limit, but once the temperature exceeds this limit, failures are not certain). Second, even this necessity is affected by some degree of uncertainty (for example, a blade failure may happen even if the gas temperatures are below the design limit);
  • Some of the fault chains may be concurrent. That is, the same failures stem from one or the other, or from a combination of two (or more), fault chains;
  • Many of the fault signatures are non-local—the values of measurables detected at locations physically remote from the point where the failure actually takes place may be affected by the drifting process mentioned in point (2). In this case, we say that these measurables (and the indicators constructed on them) are correlated with the ones immediately affected by the failure.

3.2. Formalization of the Fault Signatures and Choice of the Fault Indicators

Extensive databases are available for the monitoring of most traditional energy conversion plants (e.g., ‘‘efficiency’’, ‘‘mechanical output’’, ‘‘thermal output’’), and for gas turbines and their derivates (combined and cogeneration plants) a specific, well calibrated and very disaggregated database is available. There is a body of international industrial standards, often validated by Public Agencies, which regulates even the fine details of the type and tolerance of the measurables. Our approach here, though, is rather different; we are not interested in the abidance by contractual specifications, but rather in a (continuous) monitoring of whether the system operates within a certain number of admissible states. Therefore, the various sets of measurables defined by the international standards do not suffice for our purpose; in fact, our KB complements them with other knowledge items derived from design handbooks, operator manuals and interviews with field experts. Using as an example a standard gas turbine plant, Table 1 reports a list of failures to be diagnosed/prognosed, and Table 2 the indicators adopted.

3.2.1. The Mathematical Formulation

Define the ‘‘performance function’’ ΠP of an energy conversion process P as the deterministic mathematical relation between the instantaneous process output(s) and a set of N process parameters that we call the measurables. ΠP may be thought of as an operator that, when applied to the vector X of measurables, generates the output vector Y, ΠP(X) = Y. Now, X’ denotes a deranged operational state, in which some of the measurables have taken values slightly, but detectably, different from the design values. The new functional value is assumed by the operator ΠP(X):
ΠP(X’) ~ ΠP(X) + dΠ/dX (XX’)
where dΠ/dX represents the term-by-term derivative of a vector, and not the total differential, and the new vector of the measurable is:
ΠP(X’) = Y’
Since the global process performance is a function of the output vector Y and of the known input vector I, knowledge of the structure of Πp allows to compute the performance parameters for every value of the vector X’ (i.e., at every measurement).

3.2.2. The Knowledge Base Implementation

To complete the transition from the mathematical representation of component failure to the knowledge base construction, it is necessary to create the so-called fault chain diagrams.
The first step is to define the ‘‘performance indicators’’ on which the derangement from ‘‘standard operative conditions’’ is measured. The plant operating manual and the design specifications provided by the designer and by the constructor define only a very limited set of operating points. We must add some form of ‘‘logical extrapolation’’ based on an intelligent comparison between the measured data and a set of proper theoretical operating curves (this step requires the assistance of a Domain Expert). At this point, we can create the fault chains for the knowledge base of the expert system.
An example of the failure detection criteria for compressors is presented in Table 3.
The corresponding failure chain for compressor choking is presented in Figure 1.
The Expert System, Knowledge Base And Inference Engine have been written in CLIPS, an open-source programming environment. The inputs are fed to the Knowledge Base from a pre-processor that receives and elaborates data either from a data acquisition system or from a plant simulation. The code scans all fault indicators, establishes the progression at assigned time steps, and feeds the results to the inference engine of the expert system. That then consults the knowledge base to determine if there is an incipient fault, and its possible causes.
Figure 2 displays an example of the code for the compressor fault chain.

4. Discussion

The possibility of devising and implementing an AI procedure to extend the fault diagnosis into the realm of prognostic is, with the current state of the art, perfectly possible. It requires a shift from the “machine thinking” typical of Artificial Neural Networks and Genetic Algorithms procedures to the “propositional” and “fuzzy” thinking characteristic of real AI (Expert Systems). In the case we are discussing, an application to a real compressor was implemented in [1]. The code also performs satisfactorily in the first stages of condition derangement.

5. Conclusions

The application of Expert Systems in energy conversion systems failure analysis has been proven to be a reliable and effective aid in dealing with large amounts of data and complex fault chains, especially whenever it is essential to understand the consequential process and avoid expensive plant downtimes.

Author Contributions

Conceptualization: E.S.; methodology R.M., E.S.; software development: R.M. All authors have read and agreed to the published version of the manuscript.

Funding

No funding has been received.

Conflicts of Interest

The authors declare no conflict of interest.

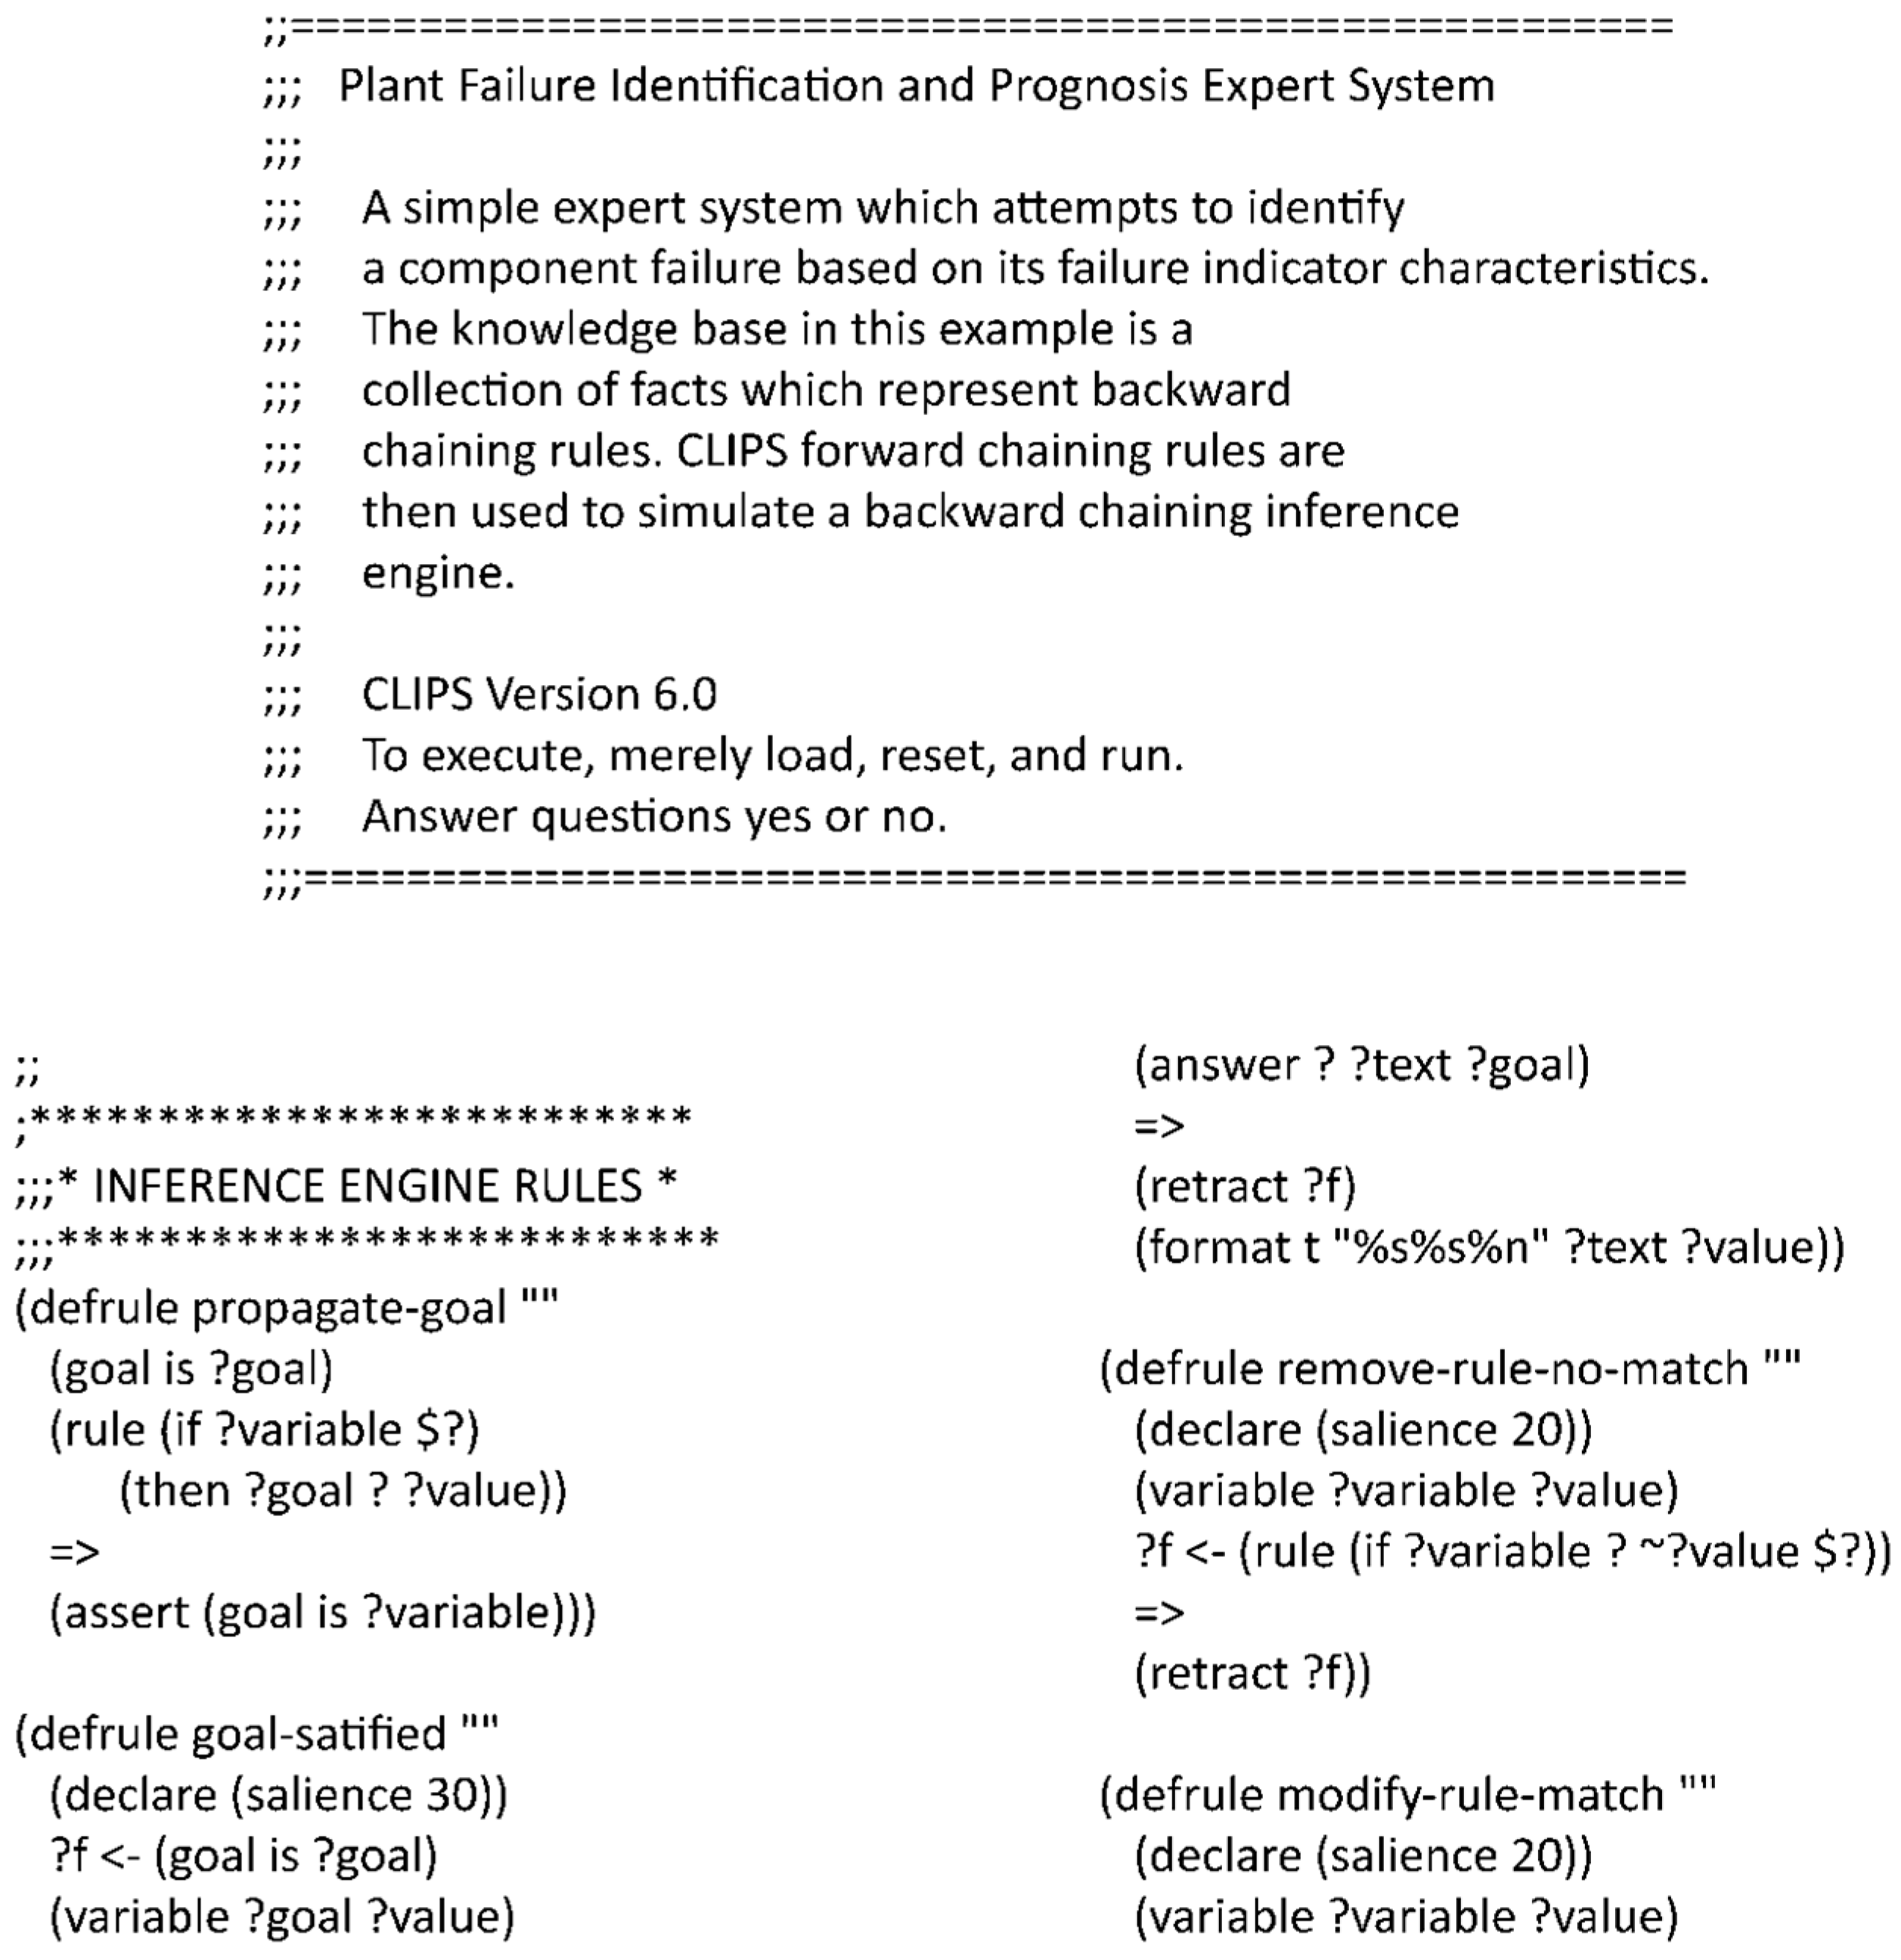
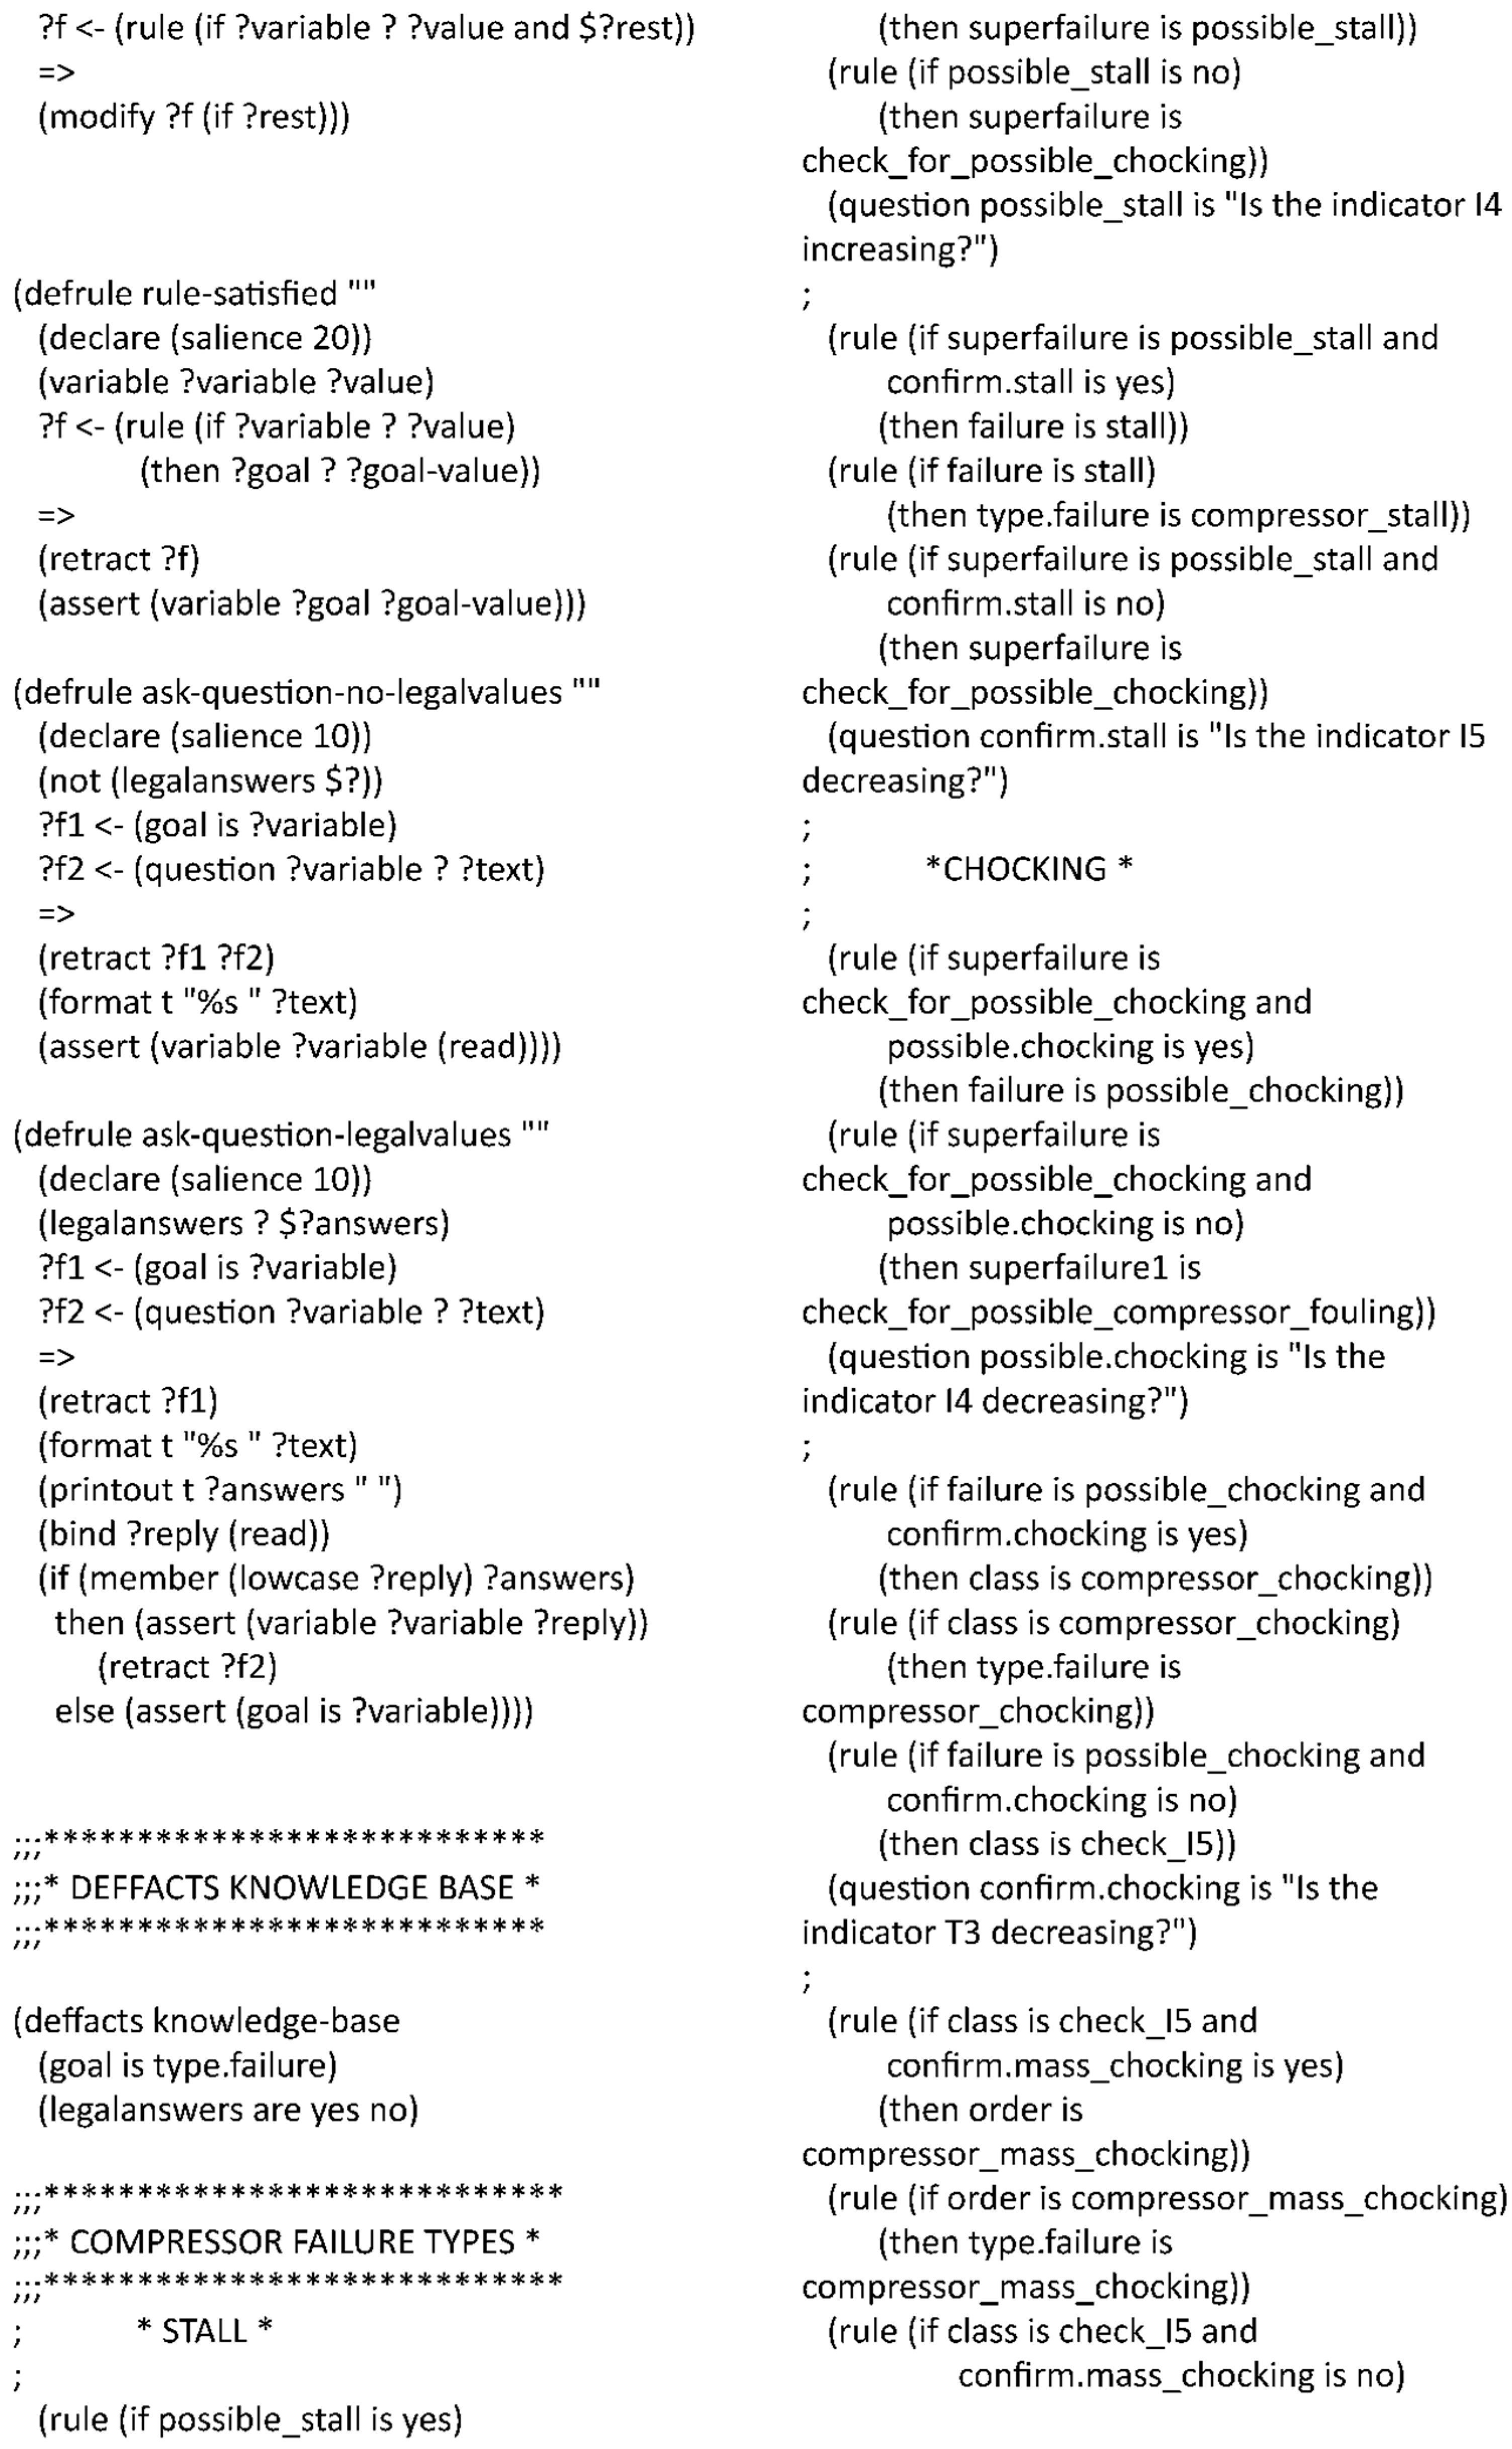
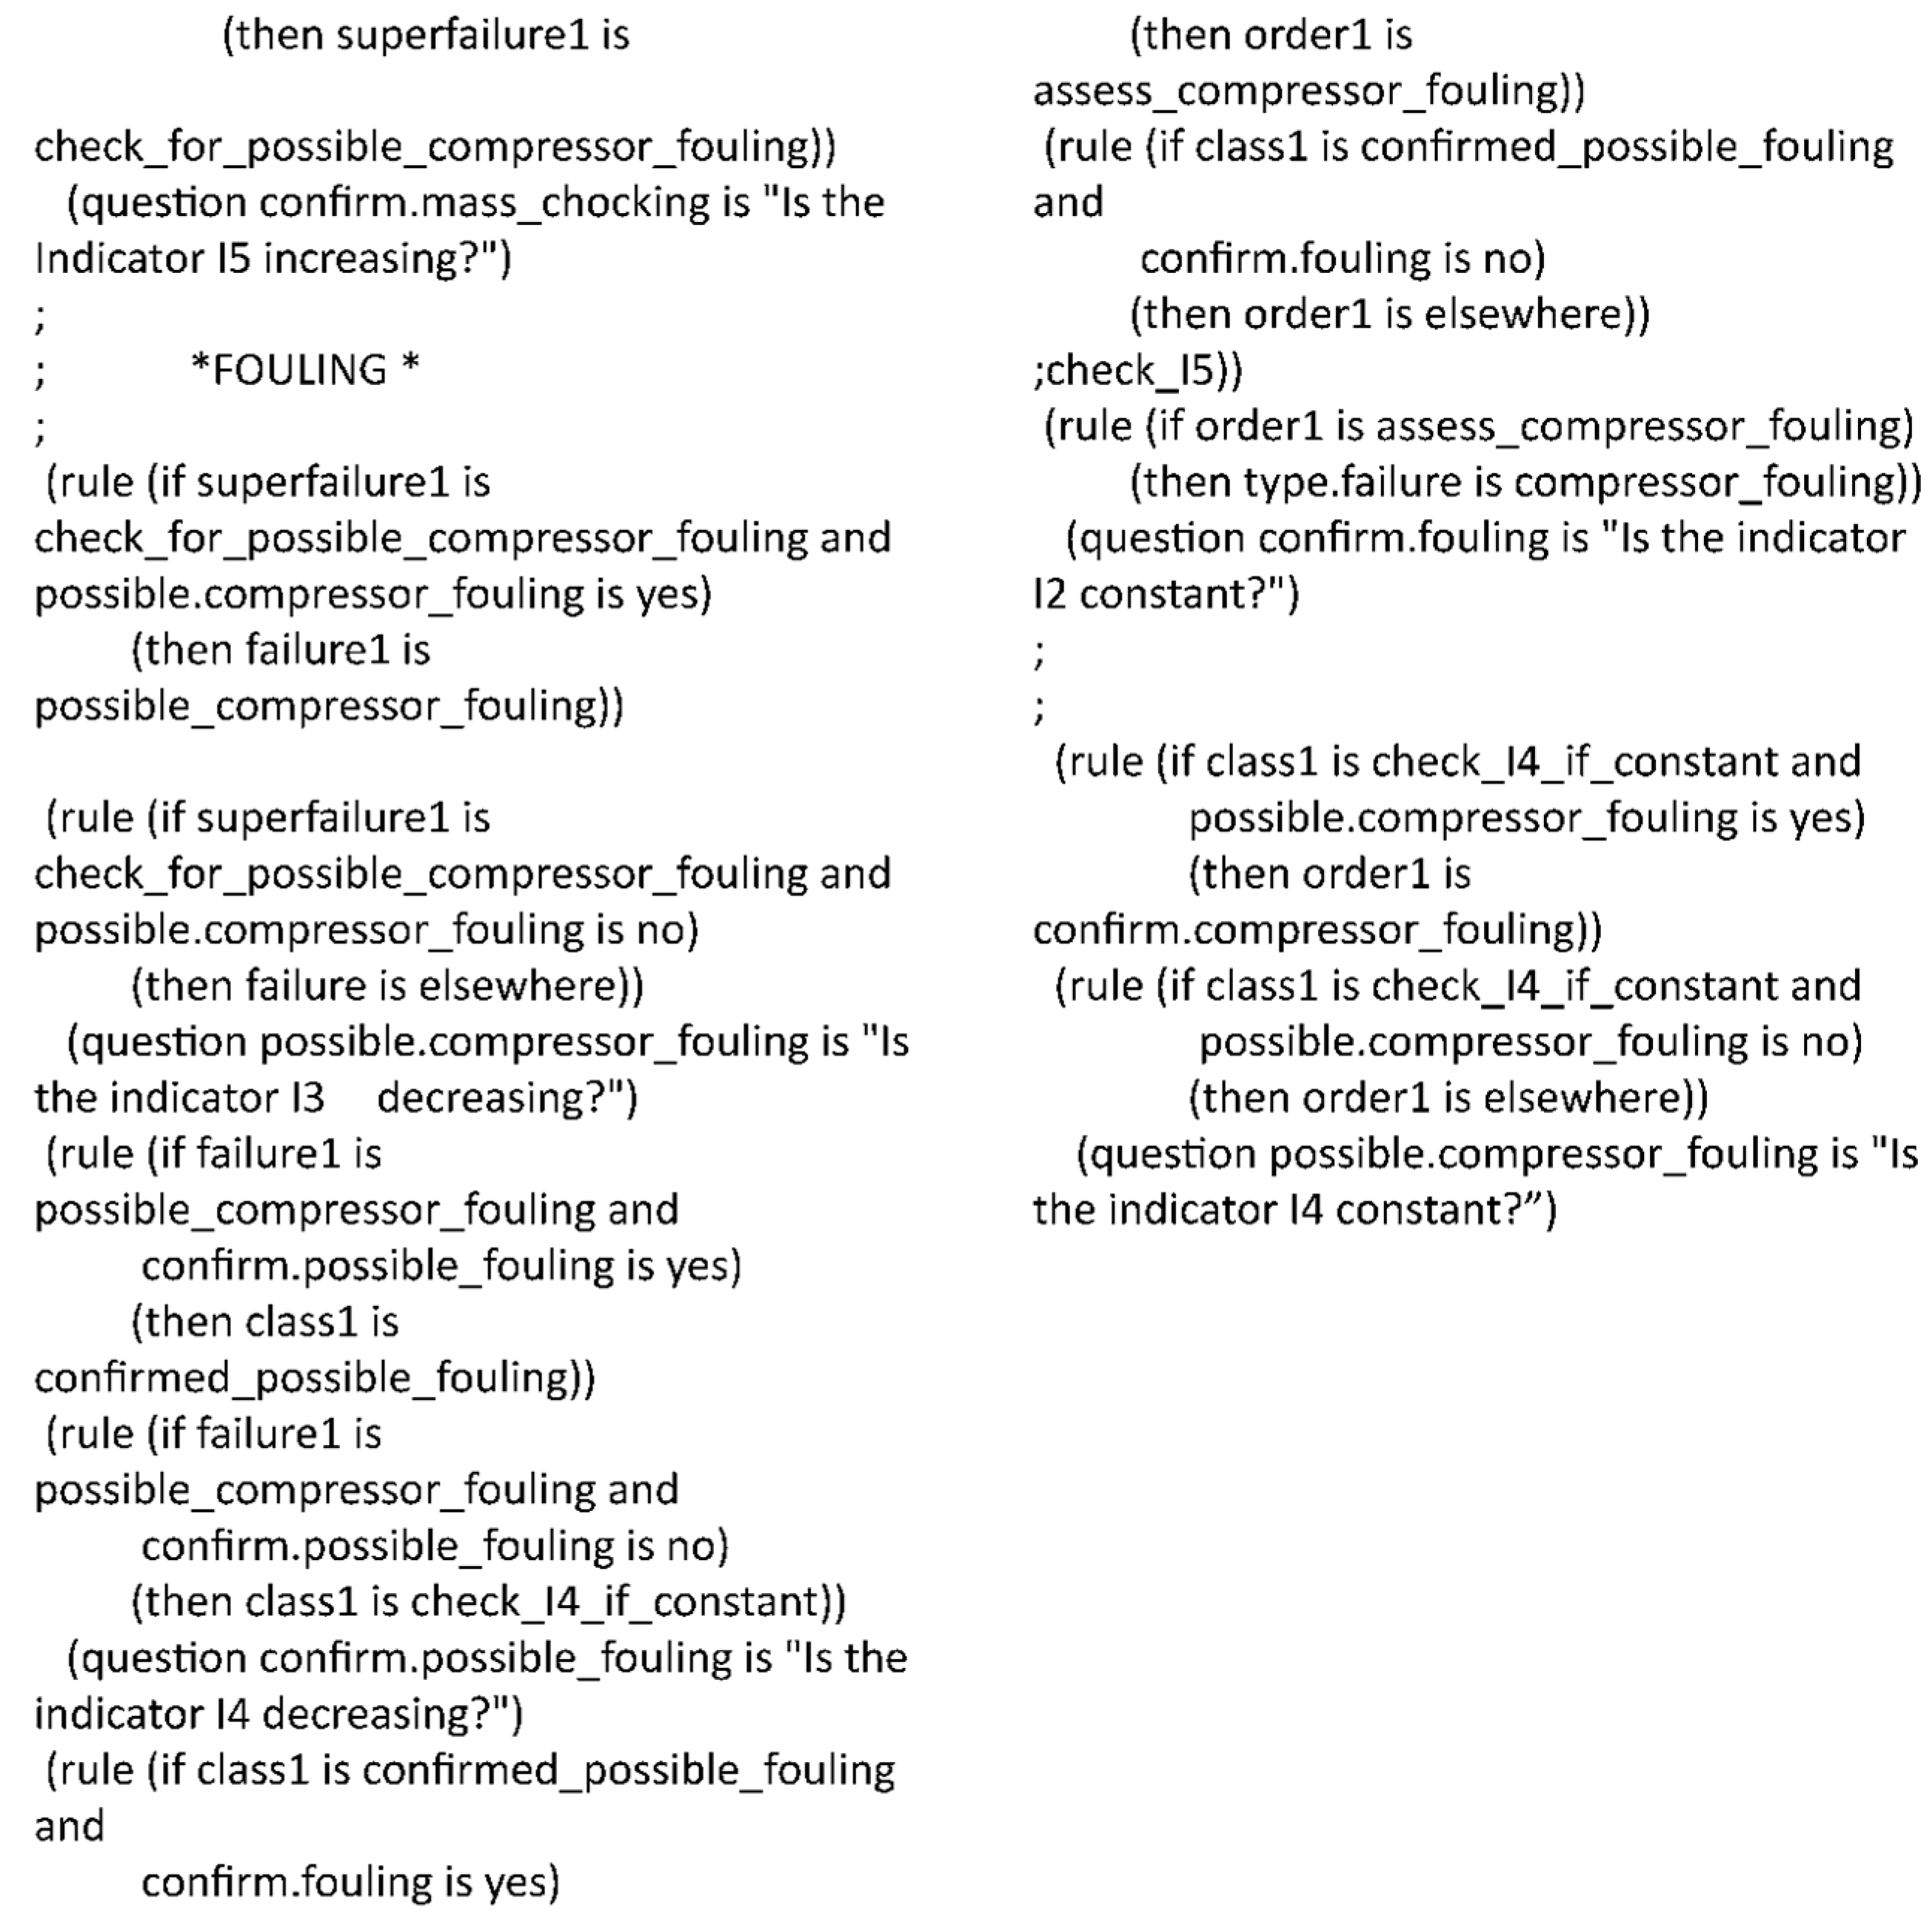
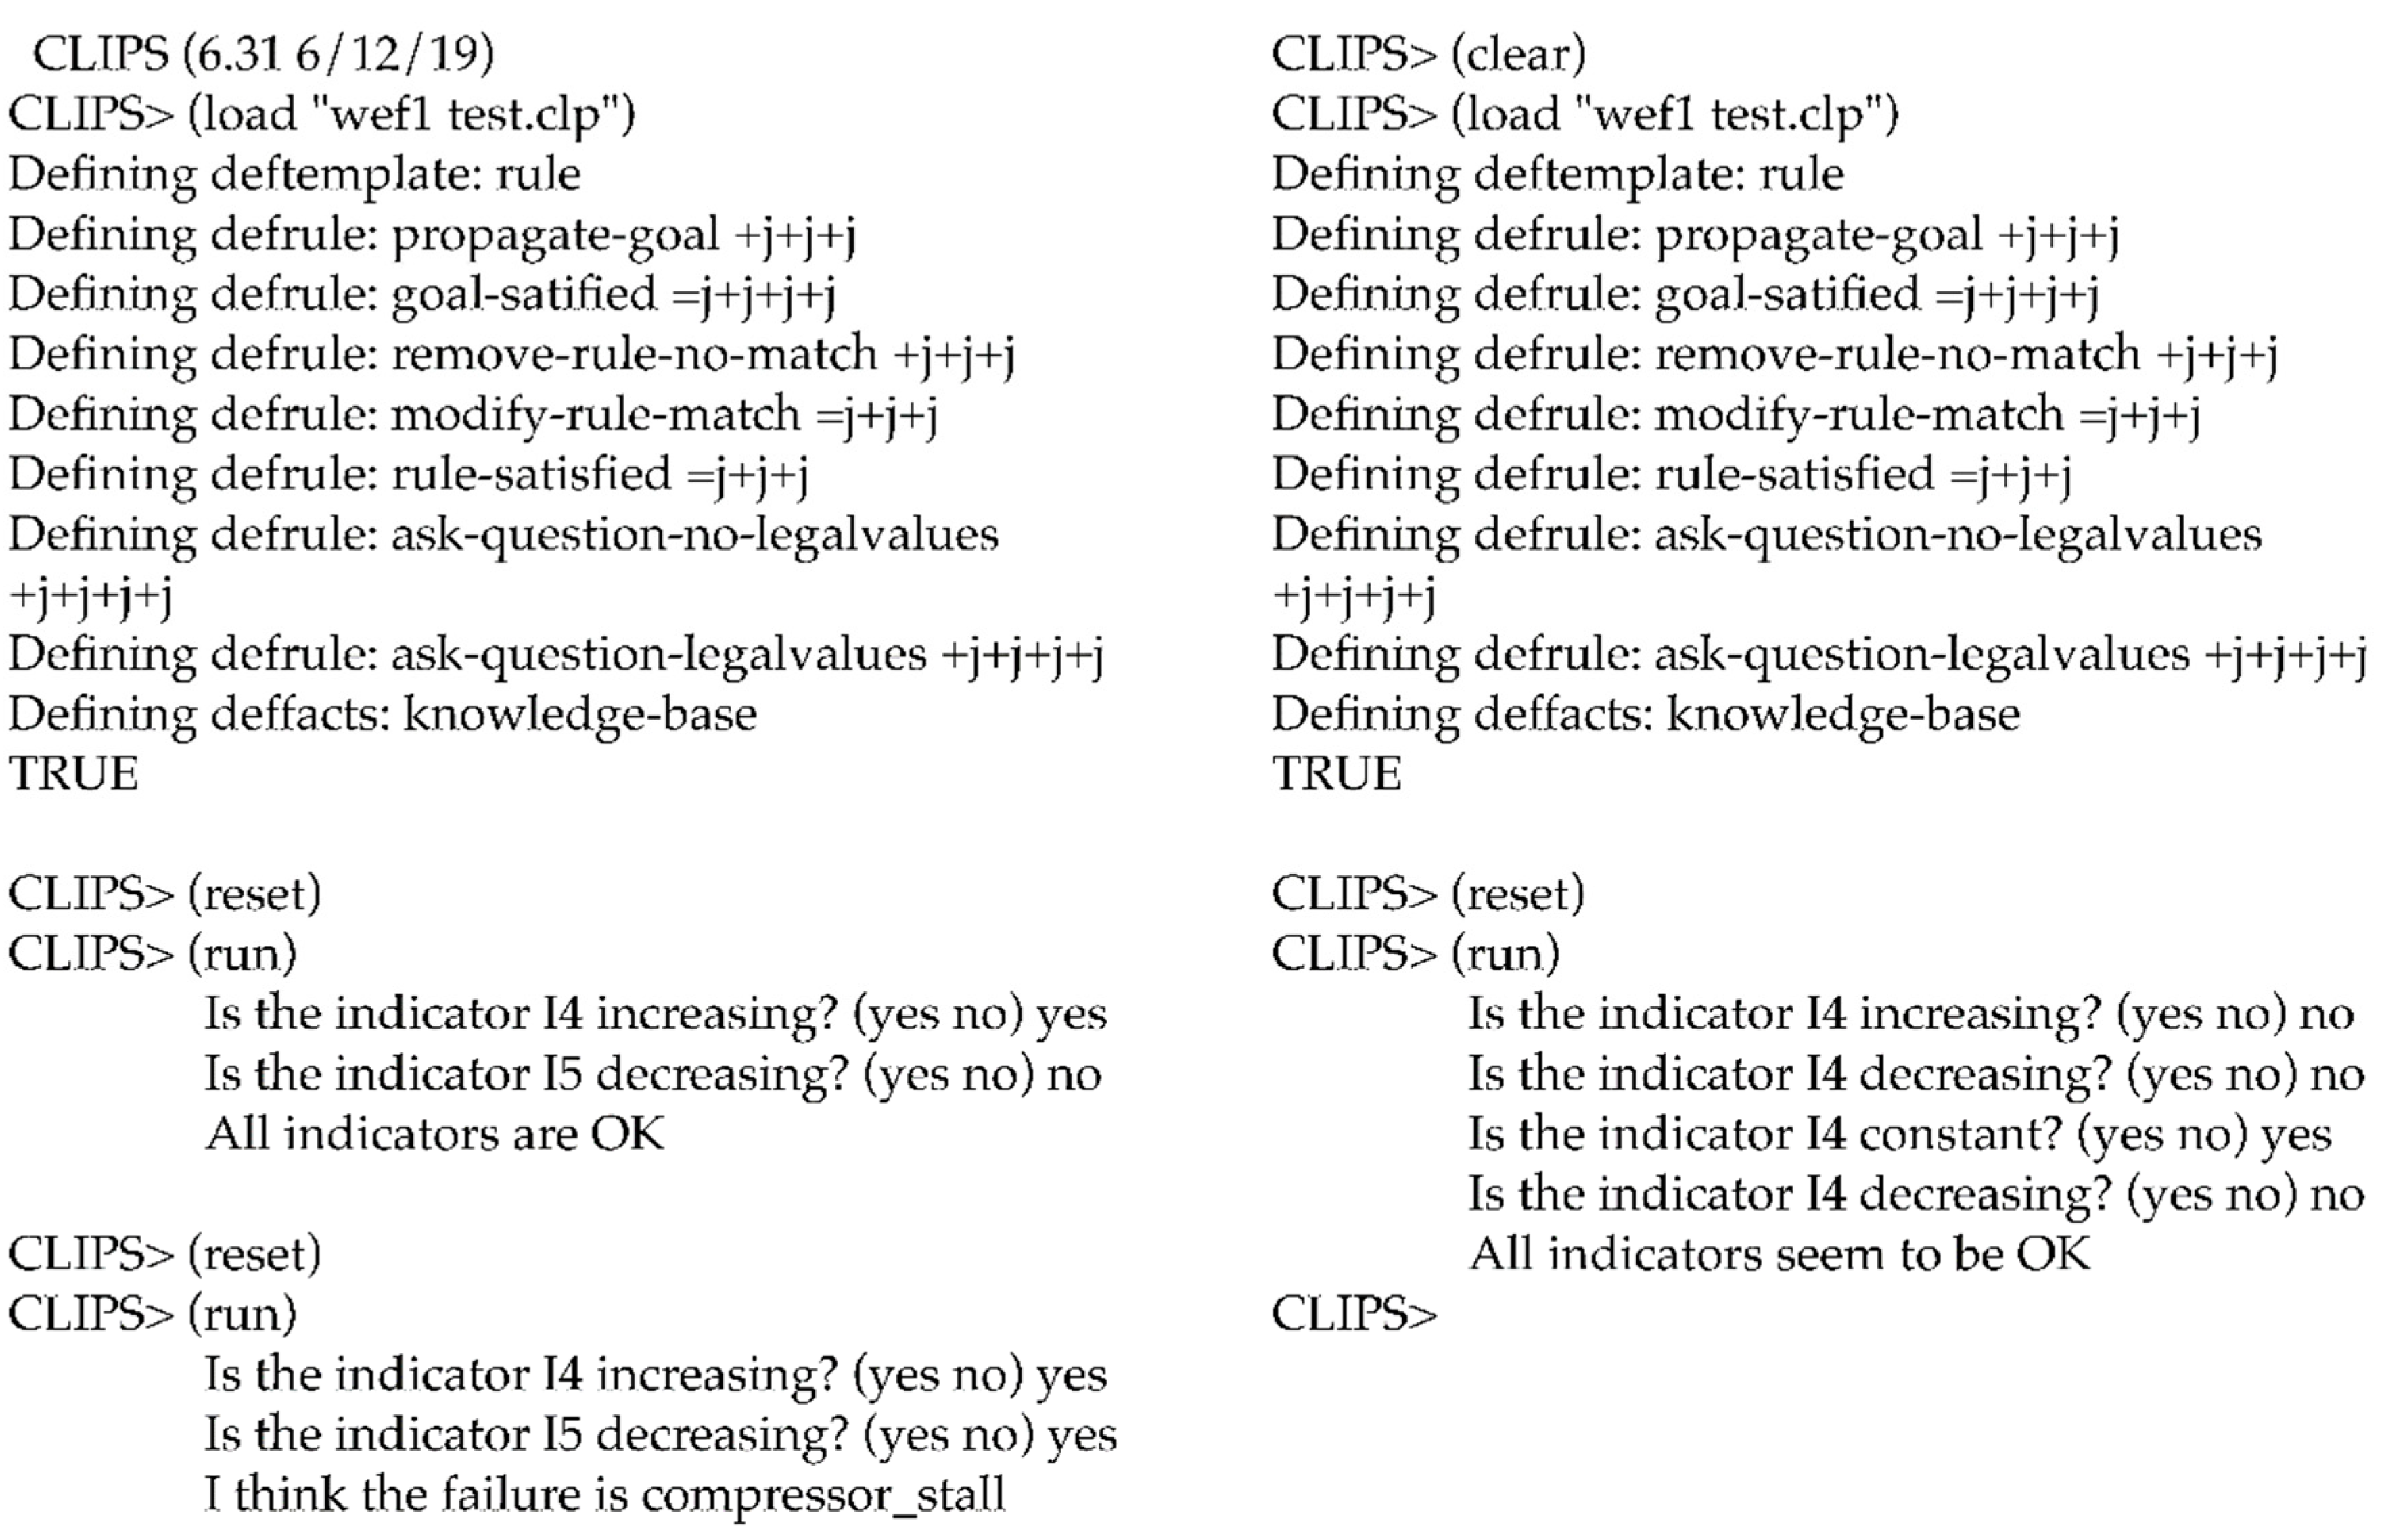
Appendix A. Example of PROMISA CLIPS Code for the Compressor Fault Chain

Proceedings 58 00001 i001Proceedings 58 00001 i002Proceedings 58 00001 i003

References

  1. PARC is turning 50: From Ethernet and Laser Printing to this Wild New Tech; ZDNet April 2020. Available online: https://www.zdnet.com/article/parc-is-turning-50-from-ethernet-and-laser-printing-to-this-wild-new-tech/ (accessed on 27 February 2020).
  2. Biagetti, T.; Sciubba, E. PROMISE: A tool for the on-line intelligent performance prediction of cogeneration plants. In Proceedings of the ECOS02, Berlin, Germany, 3–5 July 2002; pp. 463–471. [Google Scholar]
  3. Biagetti, T.; Sciubba, E. A first step towards unmanned intelligent process management: A procedure for the diagnostics and prognostics of energy conversion plants. Int. J. Appl. Thermodyn. 2002, 5, 85–99. [Google Scholar]
  4. Gülen, S.C.; Griffin, P.R.; Paolucci, S. Real Time On-Line Performance Diagnostics of Heavy-Duty Industrial Gas Turbines; ASME paper 2000-GT-312; American Society of Mechanical Engineers: New York, NY, USA, 2000. [Google Scholar]
  5. Roemer, M.J.; Kacprzynski, G.J. Advanced Diagnostics and Prognostics for Gas Turbine Engine Risk Assessment; ASME Paper 2000-GT-30; American Society of Mechanical Engineers: New York, NY, USA, 2000. [Google Scholar]
  6. Tsalavoutas, A.; Aretakis, N.; Mathioudakis, K.; Stamatis, A. Combining Advanced Data Analysis Methods for the Constitution of an Integrated Gas Turbine Condition Monitoring and Diagnostic System; ASME Paper 2000-GT-34; American Society of Mechanical Engineers: New York, NY, USA, 2000. [Google Scholar]
  7. Forsyth, G.; Delaney, J. Designing Diagnostics Expert Systems for Long-Term Supportability; ASME Paper, 2000-GT-31; ASME: New York, NY, USA, 2000. [Google Scholar]
  8. Ozgur, D.; Lakshminarasimha, A.N.; Rucigay, R.; Morjaria, M.; Sanborn, S. Remote Monitoring and Diagnostics System for GE Heavy-Duty Gas Turbines; ASME Paper, 2000-GT-314; ASME: New York, NY, USA, 2000. [Google Scholar]
  9. Sciubba, E.; Melli, R. Artificial Intelligence in Thermal Systems Design: Concepts and Applications; Nova Science: New York, NY, USA, 1998. [Google Scholar]
  10. Sriram, R.D. Intelligent Systems for Engineering; Springer: New York, NY, USA, 1997. [Google Scholar]
Figure 1. Compressor chocking fault chain.
Proceedings 58 00001 g001
Figure 2. Example of CLIPS output for manual input.
Proceedings 58 00001 g002
Table 1. Examples of possible faults for a gas turbine.
Component Possible Fault(s) Component Possible Fault(s)
Filter Leakage
Fouling
Secondary heat exchanger Fouling
Compressor Stall
Choking
Fouling
Excessive exit temperature Malfunctioning
Lubrication loop Fouling
Leakage
Lubricant deterioration
Primary combustion chamberFouling
Excessive pressure losses
CH4- or H2O valve failure
Cooling loopFouling
Leakage
Primary fuel injector Fouling Main cooling pumpCavitation malfunctioning
Secondary fuel injectorSecondary combustion reactions
Fouling
Leakage
Main shaft Near-critical vibration frequencies
Turbine Fouling
Choking
Excessive inlet temperature
Afterburner CH4 injector fouling
Primary heat exchanger Fouling
Table 2. Example of indicators.
Air filter I1 = Δp/ΔpdTurbine I11 = ηccd
I12 = Tex/Texd
I13 = mex/mexd
CompressorI2 = cp ΔT/cpΔTd
I3 = ηccd
I4 = βccd = pc/pcd
I5 = mc/mcd
Electrical generatorI14 = ωccd
Combustion chamber I6 = Δpcc/Δpccd
I7 = mcc/mccd
Afterburner I14 = ΔT/ΔTd
I15 = m/md
Fuel injector I8 = mfi/mfidMain pump I16 = mp/mpd
I17 = Δpp/Δppd
Boiler main stack I9 = XNOX/XNOXd
I10 = XCO2/XCO2d
Shaft (vibrations) I18 = rms/rmsd
Table 3. Failure detection criteria for compressors.
Compressor Fouling
Malfunctioning
Choking
Excessive T3
Stall
I2 = cp ΔT/cpΔTd
I3 = ηccd
I4 = βccd = pc/pcd
I5 = mc/mcd
(I3 low U I4 low) or (I3 low U I2 high)
(I3 high U Wc high)
(I4 low U I5 high) or (I4 low U T3 low)
I2 high
I4 low U I5 low
Publisher’s Note: MDPI stays neutral with regard to jurisdictional claims in published maps and institutional affiliations.

