2 Chair of Automatic Control Laboratory, D-ITET, Swiss Federal Institute of Technology, ETHZ, 8092 Zürich, Switzerland
1. Introduction
Buildings account for approximately 40% of Europe’s total energy consumption, which is expected to further expand increasing the energy demand. As a result, the building sector plays a vital role in Swiss climate policy. Switzerland attempts to reduce the CO
2 emissions in the building sector by 40% [
1]. This makes it essential to improve the energy efficiency and sustainability in the building sector. Improving energy efficiency in buildings is a step-wise process. According to Xing et al. [
2], the building envelope needs to be retrofitted to reach higher standards as the first step, followed by improving the energy efficiency of equipment installed. Integration of renewable technologies to support on-site generation being connected to smart grids is the final step.
To reduce the dependence on declining fossil fuel supply, renewable energy sources (RES) are planned to replace a large percentage of fossil fuel electricity generation by 2050. The power generation by RES also challenges the local district energy systems. Distributed energy systems such as energy hubs play a vital role when matching the demand and generation in an efficient manner. There are number of recent studies that have focused on integrating renewable energy technologies into communities. For example, Guen et al. [
3] evaluated the potential of renewable energy integration and building renovation scenarios for a Swiss village while Mohajeri et al. [
4] considered the renewable energy integration pathways considering future changes in climate as well as the urban form. However, moving into the urban context brings up many challenges as explained by Perera et al. [
5,
6]. More than one energy hub is required to cater to the distributed energy demands in most of such instances, which makes the design process more challenging. In addition, many other limitations such as limits to installation of on-site renewable energy technologies etc. need to be considered. The present study aims at looking into promising energy solutions for a suburban area in order to improve the energy sustainability. The system configuration of the energy hub at different urban densities to find sustainable energy solutions are studied in this work.
Case Study
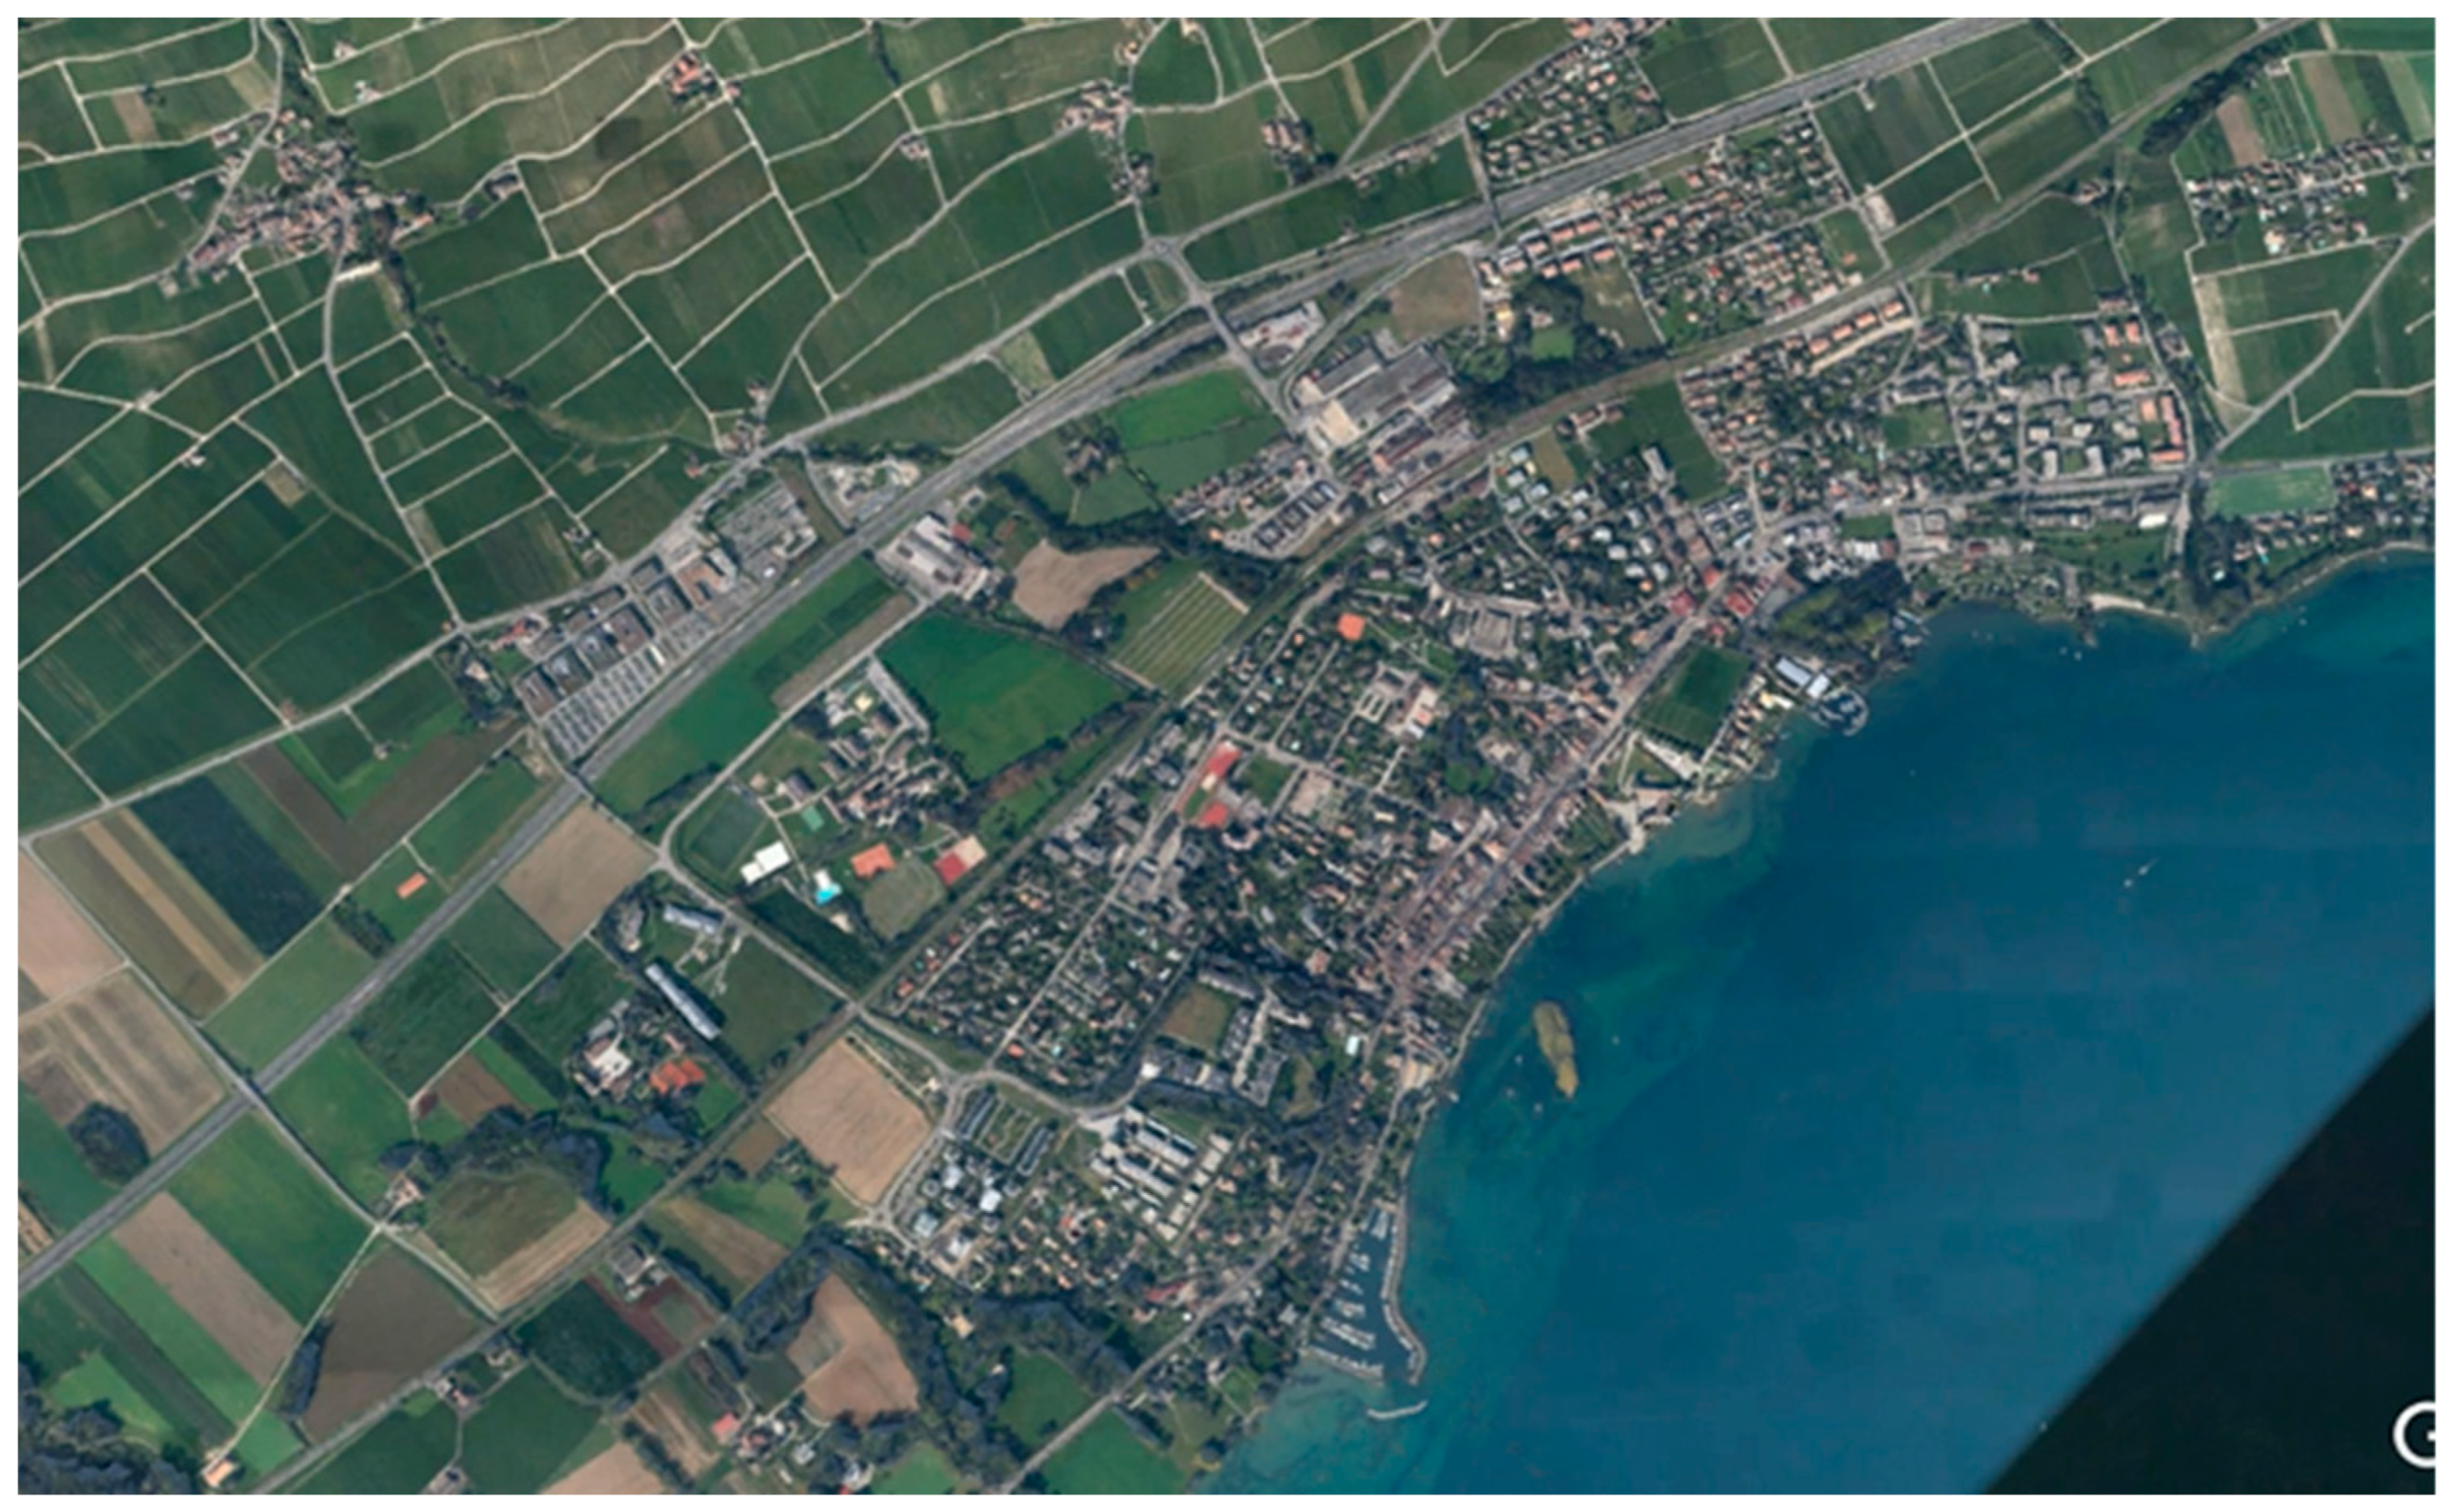
Rolle is a small village on the border of Lake Léman in Switzerland. In 2018, the count of Rolle’s inhabitants amounted to 6259 which makes it a medium sized village in the canton of Vaud (rank 24 compared to all 309 villages of the canton in terms of population). Lausanne, the capital of canton Vaud has up to 140,000 inhabitants, whereas the majority of villages in Vaud have less than 1000 inhabitants [
7]. On the sunny hill side, there exist a couple of small vineyards and a wine cellary. The village also contains a hospital and touristic attractions. New residencies and apartments quarters were built in the north and west of the old town. In the last couple of years, there were a lot of new headquarters built by bigger European companies like Yahoo, Nissan, Cisco and others [
8]. The old town in the center of the village contains a couple of 17th to 19th middle class houses, which paint the well-known image of the village, see
Figure 1 [
9].
2. Materials and Methods
Optimizing the design of a distributed energy system is a lengthy task consisting of several steps [
11]. The building stock in the territory is clustered into several clusters according to Geographic Information System (GIS) data. Subsequently, building simulation models are used to compute the energy demand on an hourly scale, which is followed by energy system optimization as shown in
Figure 2. In this case, the suburban area is divided into 12 clusters and the energy system is optimized for each cluster. Further analysis is conducted to evaluate the sensitivity of input parameters in order to evaluate the robustness of the design solutions obtained. Three clusters with different energy densities are selected and further analyzed in order to obtain a better understanding about the impact of size of the energy system and urban density on the system design.
Energy Hub Optimization Model
Design optimization of distributed energy system couples two optimization problems namely the system sizing problem and the dispatch problem. System sizing problem relates to obtaining the optimal size for system components such as solar Photovoltaic (PV) panels, energy storage heat pumps etc. The dispatch problem relates with optimal operation of the energy system. The Ehub modeling tool, a computational model developed to conduct design optimization of district energy systems, is used for this project. The tool was introduced by Bollinger et al. at the Urban Energy Systems Laboratory in 2017 [
12]. It is based on the energy hub concept by Geidl et al. [
13], which is a conceptual model of multi-carrier energy systems used to represent the interactions of multiple energy conversion and storage technologies. The tool optimizes the selection, sizing and operation of energy conversion and storage technologies at different scales. The model possesses the capacity to consider multiple objective functions in the optimization process. A Pareto optimization considers CO
2 and Net present value of the system.
Figure 3 shows the steps followed during the energy system optimization process. Three different input data sets are required: the case data, the technical data and the parameter specification. The case data involves energy needs e.g., heat and electricity demands. The technical inputs involve all efficiencies, maximum capacities etc. of used energy systems as well as storage technologies. The parameter specifications describe all economic constraints such as investment costs or electricity prices. The input data is translated by the Ehub software into a mixed-integer linear program. Piece-wise linearization is used to consider non-linear parts especially related to the cost of the system components. Finally, the linear program is solved by using GUROBI.
The definition of the experiment includes energy demands, solar irradiance profiles at the project’s location and the specific solar areas that are estimated for each cluster. The irradiance profile for Rolle is taken from the Meteonorm database. The technology data include information that is not case-specific such as: choice of energy carriers, efficiencies and maximum capacities of conversion and storage technologies. In this study, energy sources such as natural gas, diesel, wood, solar roof irradiation are taken as energy input carriers. The electricity grid acts as virtual energy storage. The conversion technologies considered include oil, gas and wood boilers, gas and wood powered combined heat and power (CHP) units, ground source (GSHP) as well as air sourced heat pumps (ASHP), solar PV and Photovoltaic and Thermal (PVT). The parameters related to the cost model are considered under parameter specifications. Python code is used to formulate the objective function, which is solved using the Gurobi solver as shown in
Figure 3.
3. Results
The energy hub is optimized for each cluster using the computational platform developed. Three energy hubs that correspond to different urban densities are considered. The
Figure 4 shows differences between installed technological capacities of Hub one, four and eight which, respectively, present most dense, dense and sparse scenarios. The energy system is optimized considering both fully cooperative and individual grid operation modes. Four Pareto points are taken from fully cooperative and individual grid operation modes and the optimal system design are presented in
Figure 4.
Figure 4a–c presents the design solutions for the individual grid operation mode while
Figure 4d–f presents the fully cooperative scenario. Further, P1 presents the lowest cost solution and P4 presents the lowest emission scenario. Irrespective of the size of the energy system, its operation mode, a clear change in system configuration is observed when moving from P1 to P4. P1 leads to low cost solutions such as boilers while P4 leads to ecofriendly technologies such as solar PVT. In addition,
Figure 4 shows that a notable change in technologies is observed when moving from Hub one to Hub eight. It becomes more attractive for the small hub to use a combination of PV with ground source heat pumps (GSHP) rather than gas boilers. The range of technologies which are used do not change for the bigger hubs as they are able to operate by themselves an efficient GSHP in combination with PVs for the baseload supply and some smaller gas boilers for peak demands. The medium sized hub four though can change to a larger GSHP with bigger capacity and better efficiency, see figure 4b and 4e. In the case of the largest sized hub one, there is no benefit of the PV-grid to detect in terms of energy system technology choices. This clearly reflects the impact of the capacity of the energy hub determined by the density of the sub urban area.
In a next step, the price elasticity of hub one, four and eight are analyzed by varying the price from 0.12 CHF/kWh to 0.05 CHF/kWh and 0.15 CHF/kWh, respectively. The Pareto front of the different scenarios is visualized in
Figure 5.
The
Figure 6 visualizes differences in energy production of Hub one, four and eight if PV electricity export prices vary from 0.12 CHF/kWh to 0.05 CHF/kWh and 0.15 CHF/kWh, respectively.
The sensitivity analysis clearly reflects that the energy hub with a smaller capacity is highly sensitive to the change in prices, followed by the medium-sized hub. The energy hub having the largest capacity does not reflect any changes (
Figure 6a–c). The smallest hub increases its PV-electricity production to its maximum of 2500 kWh/h if electricity prices rise to 0.15 CHF/kWh and are cut in half if the prices fall to 0.05 CHF/kWh from 0.12 CHF/kWh (
Figure 6g–i). The medium-sized hub shows no sensitivity for Pareto point four but is sensitive to changes in prices for the other Pareto points (
Figure 6d–f). The Pareto front (
Figure 5) shows how costs of the total system can be lowered by selling the produced PV-electricity for a higher price and there is less need to import grid electricity. For Pareto point four, this is not possible as PV-electricity production is lowered by an increased PVT installation to minimize greenhouse gas impacts. The installed PVT collectors in pareto point four also greatly increase costs of the system. The costs are increased by a factor of three for the small system of three hubs. This is due to the technology switch to PVT as well as the significant increase in electrical and thermal storage (to be discussed further in future publications). The installation of a PV-grid between the three hubs helps to reduce the need for battery systems as well as decreases the amount of thermal storage needed in the system. This clearly reflects the impact of market changes influence to each hub in a different manner depending upon the size of the energy hub.
4. Conclusions
Improving energy sustainability of building sector plays a vital role in the energy transition. This study evaluates the energy transition in suburban area where building density notably varies. Three representative energy hubs are taken in this study to evaluate the impact of this variation on the energy system design. The study reveals that the energy technologies used for each energy hub are notably influenced by the density of the sub urban area. The energy hubs that are larger in capacity which are to be installed in the compact part of the sub urban area are less vulnerable to the market changes when compared to the systems that are to be installed in the periphery which have lower capacity.

 ,
, 