Proceeding Paper

Gut Microbiota Is Linked to Physical Health Improvements Resulting from Energy-Restricted Diet and Exercise: A Randomized Controlled Trial in Healthy Adults †

1
Precision Health Future Science Platform, Commonwealth Scientific and Industrial Research Organisation (CSIRO), Gate 13, Kintore Avenue, Adelaide 5000, Australia
2
Health and Biosecurity, Commonwealth Scientific and Industrial Research Organization (CSIRO), Canberra ACT 2601, Australia
3
Faculty of Health, Arts and Design, School of Health Sciences, Swinburne University of Technology, 1 Wakefield Street, Hawthorn 3122, Australia
4
Australian Institute for Musculoskeletal Science (AIMSS), The University of Melbourne, Melbourne 3010, Australia
*
Authors to whom correspondence should be addressed.
Presented at the 1st International Electronic Conference on Nutrients—Nutritional and Microbiota Effects on Chronic Disease, 2–15 November 2020; Available online: https://iecn2020.sciforum.net/.
Proceedings 2020, 61(1), 8; https://doi.org/10.3390/IECN2020-06992
Published: 30 October 2020

Abstract

:
Animal studies have demonstrated that energy-restricted diets and exercise affect the gut microbiome and are positively linked to physical health; however, less is known about the impacts of various patterns of dietary restriction combined with exercise on the gut microbiota and associated health outcomes in humans. This study aimed to determine if an energy-restricted diet combined with resistance training altered the gut microbiome, and whether any changes were associated with differences in body composition, dietary intake, or biomarkers of metabolic health. Twenty-six healthy males and females, aged 19–36 years with BMIs of 22–35 kg/m2, were enrolled in a 2-arm parallel, randomized controlled trial and followed either a 5:2 intermittent fasting (IFT, n = 13) or continuous energy restriction (CERT, n = 13) diet combined with supervised resistance training for 12 weeks. Both treatments resulted in decreased body weight and increased lean body mass. Shifts in the abundance of, Faecalibacterium prausnitzii, a high butyrate producer, was positively associated with changes in lean body mass (IFTp = 0.05, CERTp = 0.01) in both the groups. Moreover, in the CERT group, changes in Coprococcus genus were negatively associated with energy (p = 0.009) and fat intake (p= 0.03) and positively associated with body fat (p = 0.02). Overall, the findings indicate that using resistance training paired with either intermittent or continuous energy restriction, result in similar changes in bacterial diversity and shifts in relative abundance of bacterial taxa. The shift in specific bacterial taxa were positively associated with measures of physical health providing further support to the proposed relationship between energy consumption, exercise, gut microbiota, and physical health.

1. Introduction

Gut microbiota coexist within the mammalian intestinal tract and contribute to the host’s health through several processes. These include, but are not limited to, fermentation of indigestible dietary polysaccharides and production of important metabolic by-products, synthesis of essential amino acids and vitamins, and the overall maintenance of the host’s gut homeostasis [1]. As a result, these microbes have been linked to many aspects of human health including immune [2], metabolic [3] and neurobehavioural function [4]. Several factors play a role in shaping the gut microbiota, starting from mode of birth delivery, diet (during infancy to adulthood), and antibiotic use [5]. Recent evidence suggests that energy-restricted diets such as fasting and exercise can have a significant impact on the composition and function of the gut microbiota and changes in both could be mediators of the many health benefits typically observed with these lifestyle practices [6].
Reported benefits of exercise include increased microbiota diversity, improved balance between beneficial and pathogenic bacterial communities and increased production of short chain fatty acids (SCFA) [7,8]. Though the effects of exercise on gut microbial composition are inconsistent, it does appear that Firmicutes and Actinobacteria phylum are most responsive to exercise-induced changes [9]. These findings support the conclusions of a recent systematic review that suggest exercise is likely associated with increased butyrate-producing bacteria, such as Roseburia hominis, Faecalibacterium pausnitzii and Ruminococcaceae [10]. The effects of calorie restriction and/or intermittent fasting are also quite variable due to heterogeneity of study design, population used and type of restricted energy prescription. Notwithstanding, energy-restricted diets have shown to markedly alter the gut microbiota composition, with some studies demonstrating changes in levels of Akkermansia, Firmicutes, Bacteroidetes, and Verrucomicrobia [11,12].
While there is a growing interest in the role of gut microbial populations in the metabolic and health benefits of energy-restricted diets and exercise, further research is needed to better understand the relevant changes in compositional and functional characteristics of the gut microbiota in humans. Therefore, in a secondary analysis of a randomized controlled trial, we compared the effects of intermittent fasting and continuous energy restriction combined with exercise training on gut microbiota diversity and composition as well as reporting associations with body composition, lipid levels and markers of metabolic health.

2. Material and Methods

2.1. Brief Study Design

This study analysed the effects of two different energy-restricted diets combined with a resistance training program on the gut microbiota of 26 generally healthy individuals. Participants were stratified by age, BMI and sex then randomized into either a 5:2 intermittent fasting diet [IFT: 2 non-consecutive ‘fasting’ days per week consuming ~30% energy requirements and 5 days per week consuming ~100% energy requirements (n = 13); or a continuous energy restriction group [CERT: 7 days per week consuming ~80% of energy requirements (n = 13)]. Fasting days for those in the IFT group consisted of high-protein meal replacement shakes, a high-protein soup, and vegetables. Meal plans were provided for both groups for all other days that aimed to achieve a moderate-high protein intake (≥1.4 g of protein per kilogram of body weight per day), and a matched overall energy restriction for both groups (average 20% energy restriction). Participants undertook 2 supervised resistance training sessions per week (~45 min) and 1 unsupervised aerobic/resistance combination session per week (~30 min). This study was approved by the Swinburne University of Technology Human Research Ethics Committee (project #2018/322) and registered with the Australian New Zealand Clinical Trials Registry (ACTRN: ACTRN12620000920998).

2.2. Participants

Current and past university students in Victoria, Australia were recruited for this study. To be eligible, participants were required to: be aged between 18–45 years; have a body mass index (BMI) of 22.0–35.0 kg/m2; have a body fat percentage >18% for males or >25% for females measured by dual X-ray absorptiometry (DXA); have not followed a structured resistance training program in the previous 6 months; have been weight stable (<5% weight loss or gain) for the previous 3 months and; cease taking any dietary supplements not provided by the researchers for the duration of the intervention.

2.3. Body Composition, Diet and Blood Biomarker Assessment Measures

Changes in body composition [lean body mass (LBM), body fat and body fat percentage] were measured using DXA [Hologic Horizon (Bedford, MA, USA)], and strength changes were assessed by measuring participants’ 3-repetition maximum (3RM) for bench press and leg press at baseline and at the end of 12 weeks. Participants recorded their dietary intake via an electronic 3-day food diary (2 non-consecutive weekdays and 1 weekend day; in the IFT group diaries were kept on non-fasting days), at baseline and in weeks 1, 6 and 12 of the intervention using the Easy Diet Diary (Xyris Software, Brisbane, Australia, 2019) smartphone application. Fasting (minimum of 8 h) blood biomarkers [total cholesterol (TC), low-density lipoprotein cholesterol (LDL-C) and high-density lipoprotein cholesterol (HDL-C)] were analyzed at baseline and after 12 weeks by an external pathology lab (Melbourne Pathology, Melbourne, Australia). Analysis was conducted on 22 out of the 26 participants for blood biomarkers due to blood draw failures (n = 3) and exclusion of outliers (n = 1).

2.4. Fecal Sample Collection and Preparation

Participants were asked to supply fecal samples at baseline and after 12 weeks for gut microbiota analysis. Participants collected samples using a collection container (Sarstedt Australia Pty Ltd., Adelaide, Australia) provided by the research team. The sample was immediately placed in a sealable plastic bag (provided to the participant) with an ice pack and stored in home freezer prior (minimum for 24 hrs) to returning for their next visit at the research clinic at Swinburne University, Victoria, Australia. Upon receipt of the fecal sample, the container was stored at −80 °C until DNA extraction.

2.5. Microbiota Analysis Using 16s rRNA High-Throughput Sequencing

Fecal samples were thawed and DNA was extracted in singlet using the Qiagen DNeasy PowerSoil Pro kit (Qiagen, Germantown, MD, USA), as per manufacturer’s instructions. PCR amplification of the variable region (V3-V4) from 16S rRNA gene and subsequent Illumina sequencing on Miseq platform using paired 300-bp reads was performed commercially by the Australian Genome Research Facility (AGRF, Adelaide, Australia). Paired-ends reads were assembled by aligning the forward and reverse reads using PEAR (version 0.9.5). Primers were identified and trimmed. Trimmed sequences were processed using Quantitative Insights into Microbial Ecology (QIIME 1.8.4), USEARCH (version 8.0.1623), and UPARSE software. Using USEARCH tools, sequences were quality filtered, full length duplicate sequences were removed and sorted by abundance. Singletons or unique reads in the data set were discarded. Sequences were clustered and chimeric sequences were filtered using the “rdp_gold” database as a reference. To obtain the number of reads in each Operational Taxonomic Units (OTU), reads were mapped back to OTUs with a minimum identity of 97%. Taxonomy was assigned using QIIME Greengenes database (Version 13.8, August 2013). Samples less than 20K reads were removed and were rarefied to a depth of 20K sequences/sample. One participant from IFT group was removed during quality filtering process.

2.6. Statistical Analysis

Analysis of microbial community composition was conducted using Phyloseq [13] and vegan package in R version 3.6.1 [14] as per-protocol. SPSS (version 25, IBM, Armonk, NY, USA) was used to perform statistical analysis and GraphPad Prism (version 8.2.1, GraphPad Software, San Diego, CA, USA) for data visualization. Differences in baseline characteristics between groups were analyzed using independent t-tests. Linear mixed-models were used to analyse body composition, strength, dietary and blood biomarker variables for main effects for time, group, and time x group interactions. Estimates of α-diversity were calculated using Shannon Index, InSimpson index and the Observed Species Index. With-in group treatment changes in α-diversity (from baseline to post treatment) were assessed by non-parametric Wilcoxon T test. Differences in α-diversity between treatment groups were determined by Mann-Whitney U test. Bray-Curtis Dissimilarity Index was used to quantify the compositional dissimilarity between the treatment groups followed by Permutational Multivariate Analysis of Variance (PERMANOVA) using Adonis function in vegan using R to determine statistical differences. Nonmetric Multi-Dimensional Scaling (NMDS) was used to assess with-in group effects relative to baseline, such that microbial communities that are closer in the ordination space are more similar. The change in relative abundance of the bacterial taxa for each treatment group (effect of intervention relative to baseline) was determined by 2-way repeated measures ANOVA (rANOVA) where statistical significance was considered at p values <0.05. Furthermore, to evaluate treatment-response relationship Spearman correlation and partial correlation were employed.

3. Results and Discussion

3.1. Baseline Characteristics

A total of 26 participants completed the intervention and returned fecal samples (IFT = 6 males and 7 females; CERT = 5 males and 8 females), with 1 outlying female from the IFT group being excluded from the analysis. No differences in baseline characteristics were found for either group (Table 1).

3.2. Changes in Body Composition, Strength, Blood Biomarkers and Dietary Intake

Main effects for group were found for LBM (p = 0.005), 3RM bench press (p = 0.001), leg press (p = 0.001) and carbohydrate intake (p = 0.04), indicating higher amounts of LBM, greater weight lifted for 3RM bench press and leg press and a lower carbohydrate intake in IFT compared to the CERT group (Table 2). Main effects for time were found for weight (p < 0.001), BMI (p < 0.001), LBM (p < 0.001), body fat (p < 0.001), 3RM for bench press and leg press (p < 0.001), TC (p = 0.001), LDL-C (p = 0.001), protein intake (p < 0.001), carbohydrate intake (p = 0.007), fat intake (p = 0.004) and fiber intake (p = 0.04) indicating decreases in weight, BMI, body fat, TC, LDL-C, carbohydrate intake and fat intake, and increases in LBM, 3RM for bench press and leg press, protein intake and fiber intake in both groups over time. No other significant interactions were identified (Table 2).

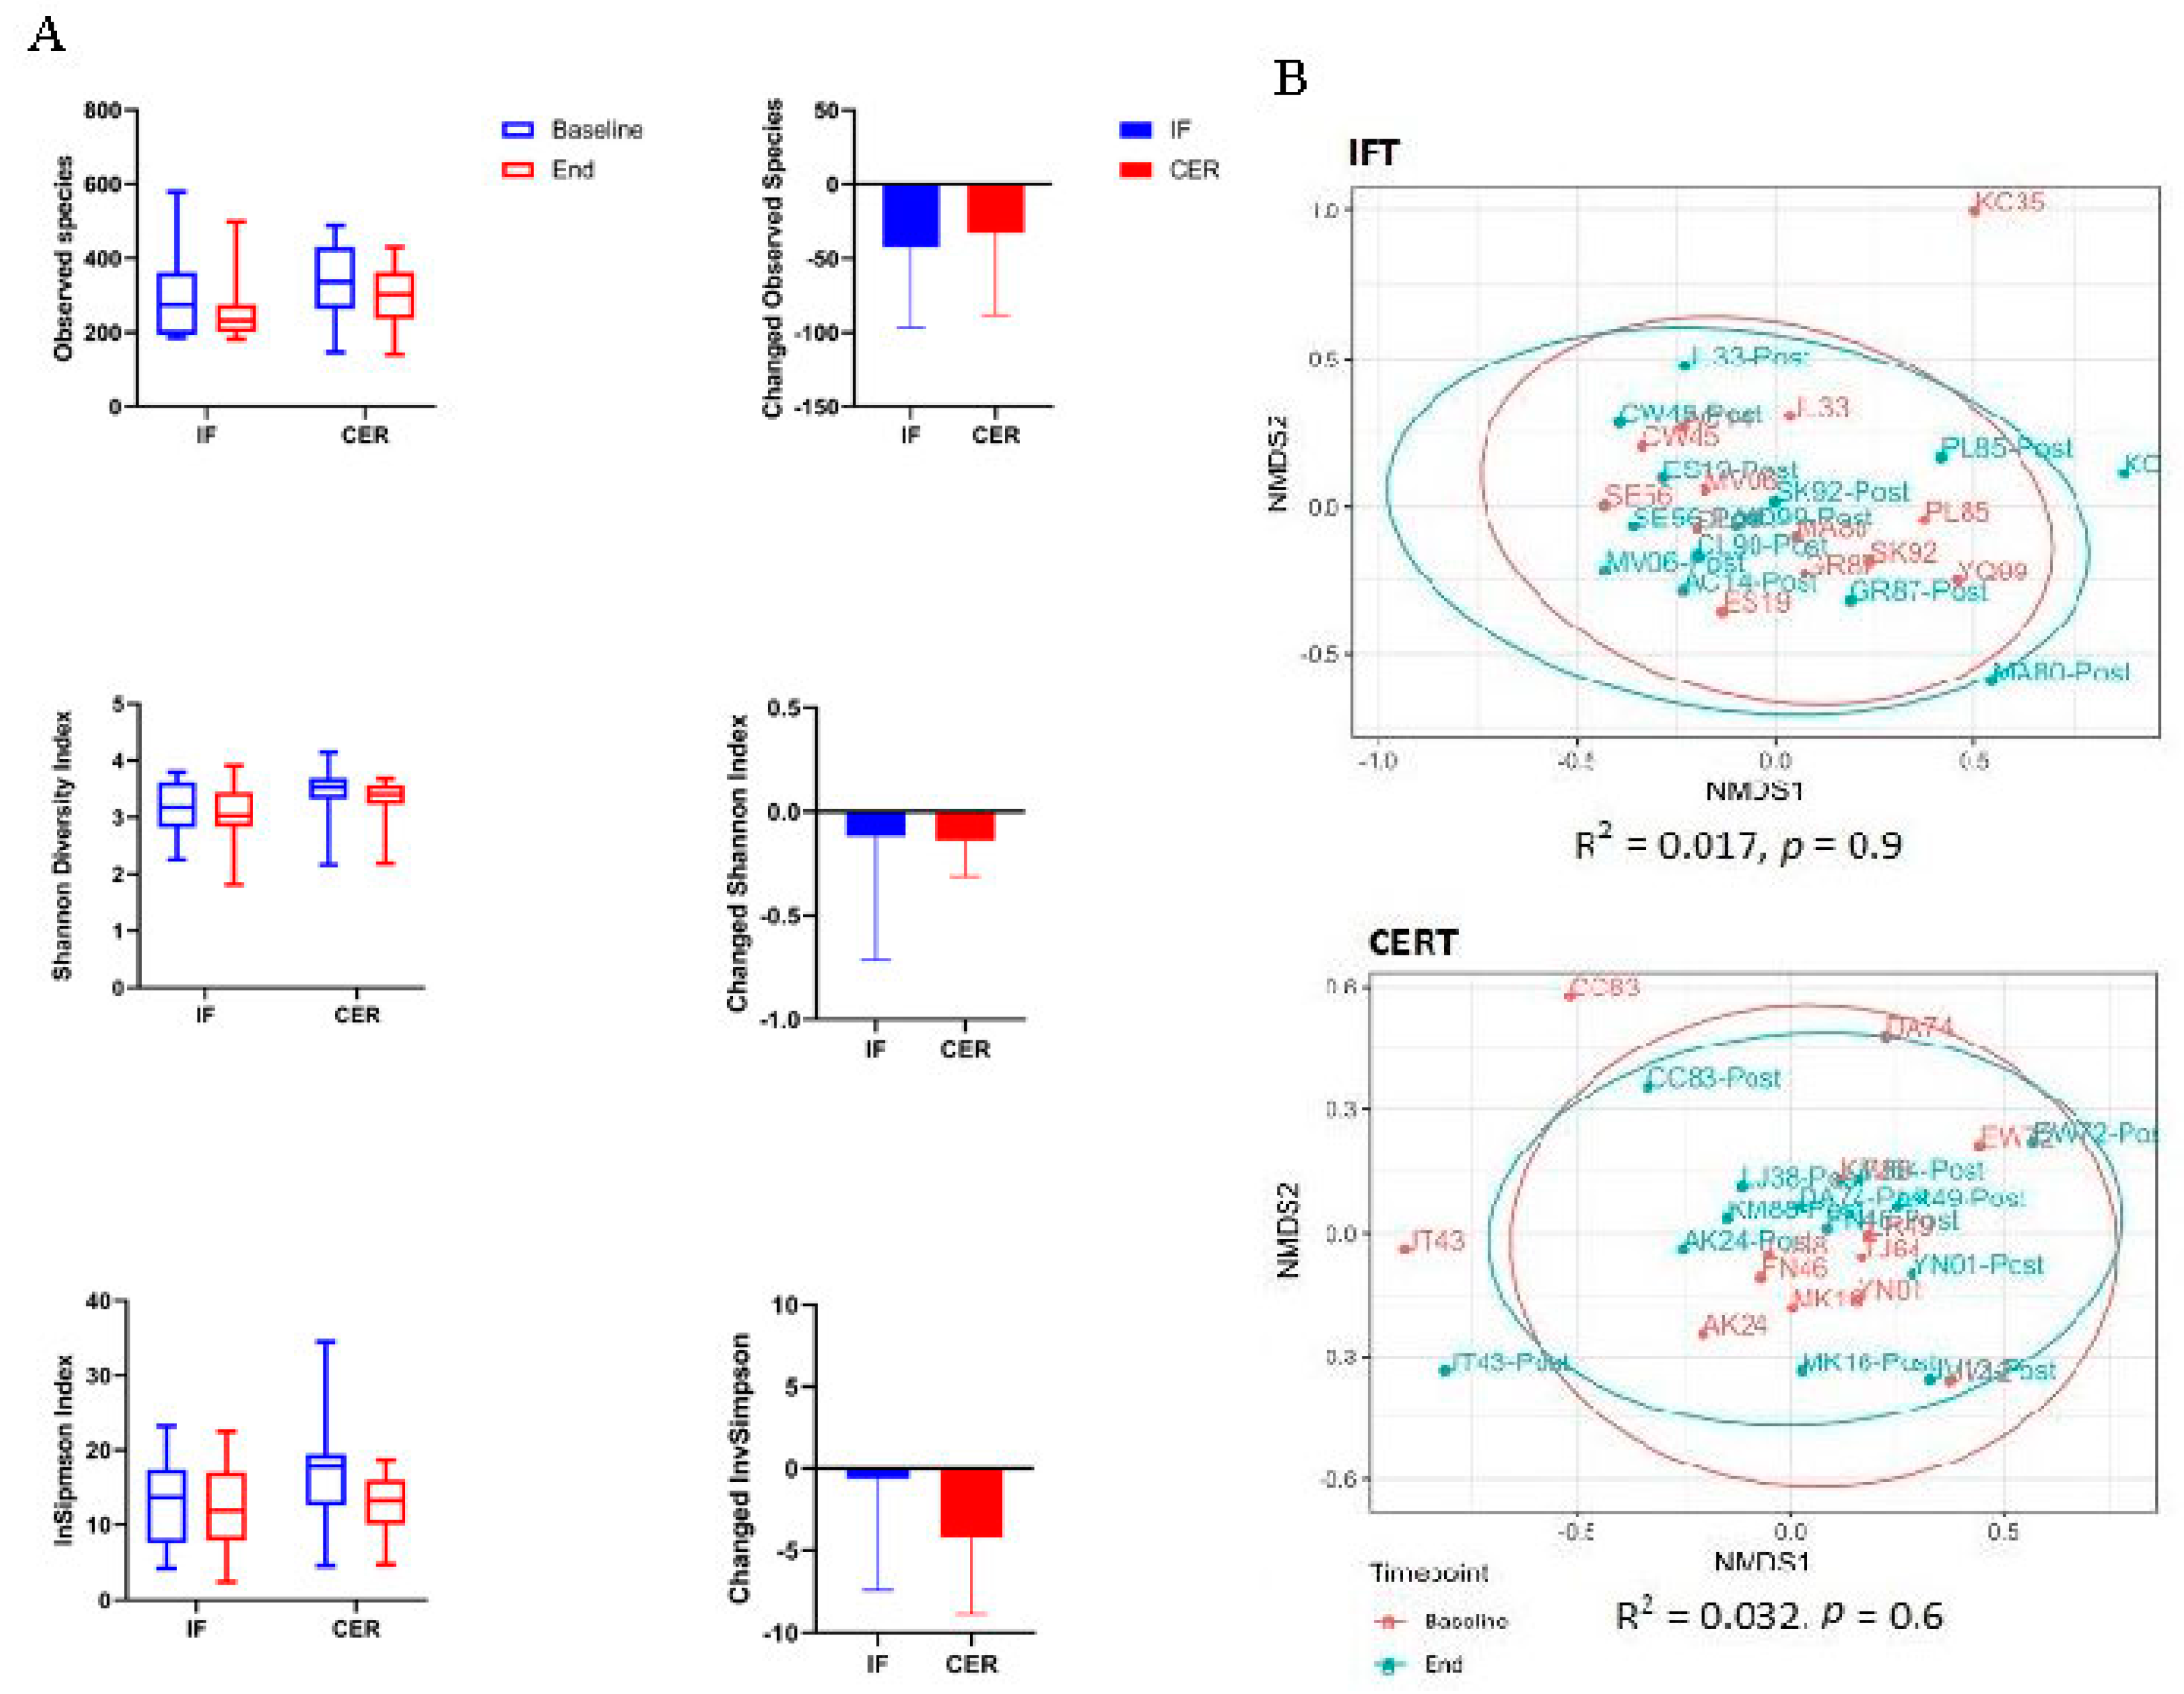
3.3. Effect of Caloric Restriction and Exercise on Fecal Bacterial Diversity

IFT and CERT interventions reduced the fecal measures of microbial α-diversity that included evenness and richness of bacterial species across as measured by the Shannon Diversity Index (IFT; −0.12 ± 0.07 and CERT; −0.14 ± 0.05; ns), InSimpson Index (IFT; −0.62 ± 0.5 and CERT; −4.22 ± 3.07; ns) and Observed Species Index (IFT: −42.61 ± 27.3 and CERT: −32.61 ± 15.5, ns); however the reduction in measures were not significant (Figure 1A).
Variation in the microbial composition between samples (β-diversity), as measured by the Bray-Curtis Dissimilarity Index indicated that there was no significant variation in β-diversity in both the treatment (diet + exercise) groups when compared with pre-treatment (IFT, R2 = 0.017, p = 0.9; CERT, R2 =0.032, p = 0.6). Subsequent Nonmetric Multi-Dimensional Scaling analysis of the Bray-Curtis Index also showed no differences in the fecal bacterial community of individuals from both treatment groups when compared with the pre-treatment (Figure 1B). Reported changes in α-diversity and β -diversity in response to energy-restricted diets are inconsistent in the currently available literature, with some studies demonstrating heterogeneous changes within participants [15], with others reporting no effects [16,17]. Though our data indicates reduction in microbial α-diversity, these changes were non-significant. It is possible that participants demonstrated individual-specific microbial responses to the same energy-restricted diet, but at group comparison this may have masked any significant gut microbial changes [16]. Physical fitness and exercise training have shown to impact gut microbial diversity, with the majority of work undertaken in rodent models [18]. Few studies have investigated the effects of resistance training alone and given our participants combined diet and exercise together, it is difficult to comment on the training effects alone.

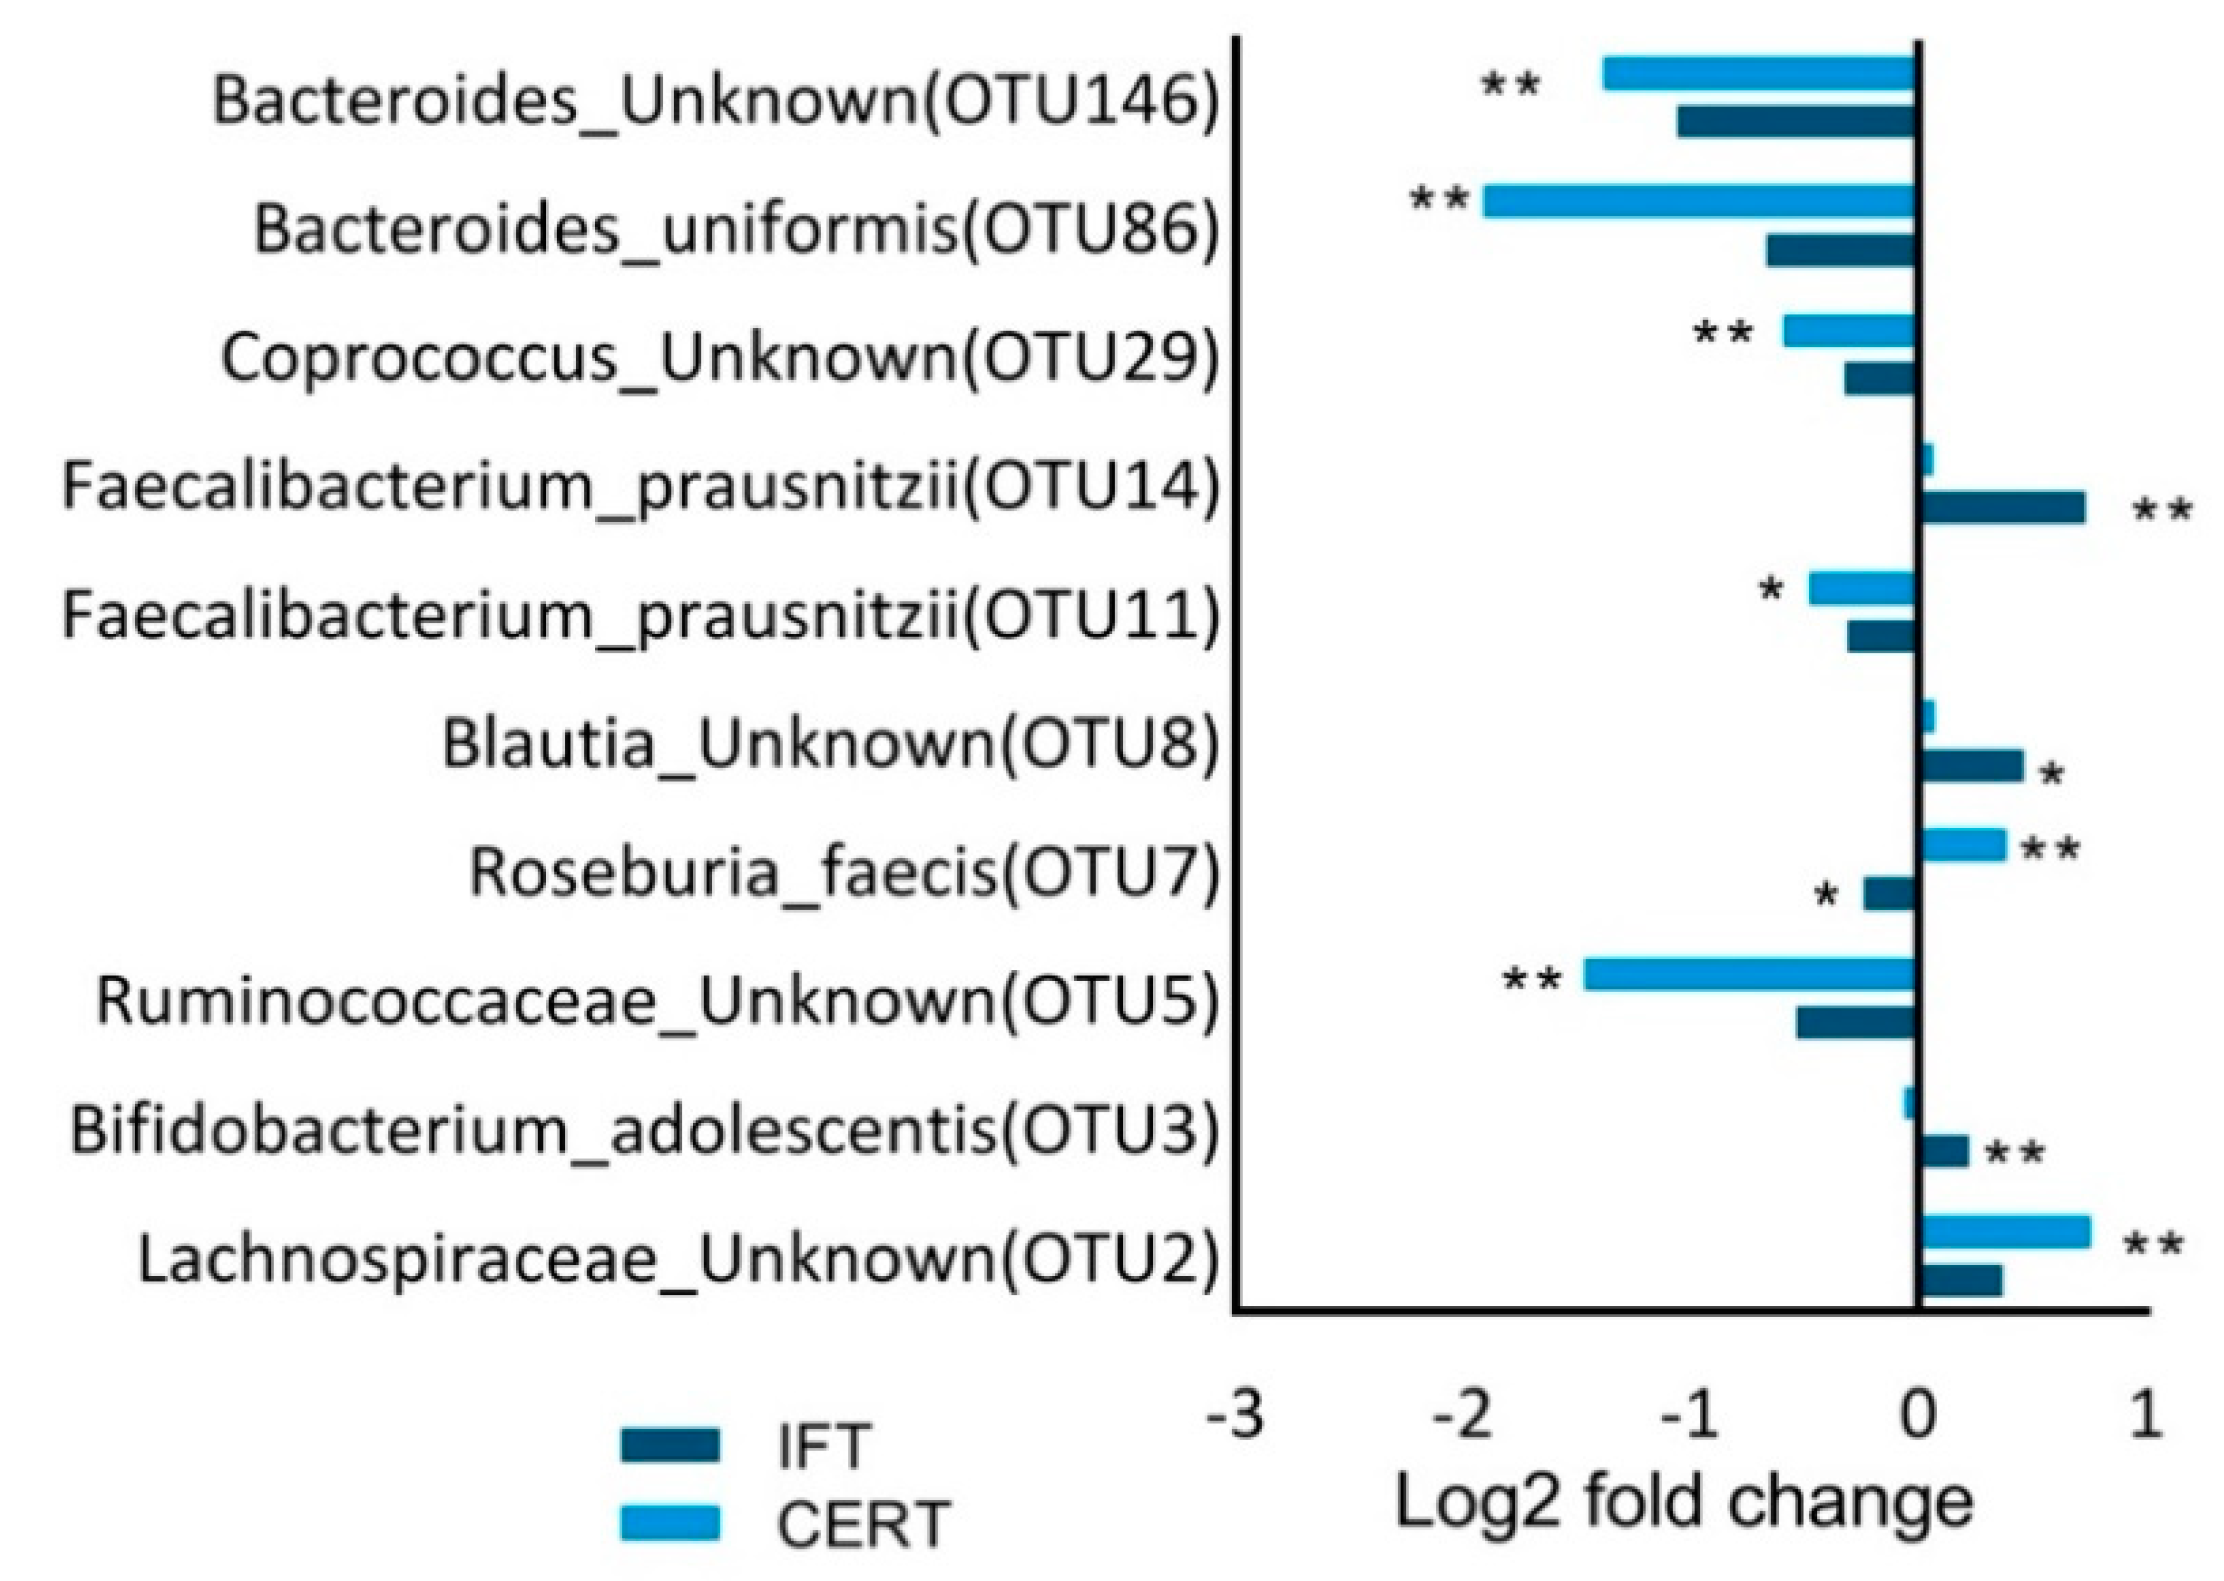
3.4. Taxonomic Composition of the Fecal Microbiota

Changes in relative abundance of certain bacterial taxa (p < 0.05, two-way rANOVA) was observed in both the treatment groups (Figure 2). IFT group enriched Faecalibacterium Prausnitzi (OTU14, 0.73 fold, p < 0.001), Blautia spp. (OTU8, 0.46 fold, p < 0.02), Bifidobacterium adolescentis (OTU3, 0.22, p < 0.01) and OTU with-in Lachnospriaceae family (OTU2, 0.37 fold, p = 0.003). The values are represented as log2 transformed mean fold changed. IFT treatment reduced the relative abundance of Roseburia faecis (OTU7, −0.24 fold, p = 0.006). In contrast, CERT treatment enriched Roseburia faecis (OTU7, 0.39 fold, p < 0.001): as well as Lachnospriaceae (OTU2, 0.76 fold, p < 0.001). CERT treatment reduced the relative abundance of Faecalibacterium prausnitzii (OTU11, −0.479 fold, p = 0.03), OTU with-in Ruminococcaceae family (OTU5, −1.46 fold, p < 0.001), Coprococcus spp (OTU 29, −0.59 fold, p = 0.04), Bacteroides uniformis (OTU86, −1.91 fold, p = 0.02), and Bacteroides spp (OTU146, −1.38 fold, p < 0.001). The changes at OTU level indicate a specific response to the energy-restricted diets and physical activity. Both treatment groups resulted in enrichment of one or more SCFA-producing bacteria such as as Feacalibacterium prausnitzii (OTU14), Rosburia faecis (OTU7), Blauti spp (OTU8), Bifidobacterium adolescentis (OTU3), and species from Lachnospiraceae family (OTU2).
These findings are consistent with previous reports [7,10,11] indicating exercise is likely to be associated with increases in SCFA-producing bacteria. Fasting has also been shown to increase OTU abundance of Firmicutes [19] but less is known about its impact on SCFAs. It is clear that directional changes in OTUs between groups were similar; however, changes in relative abundance between the groups were different and given both groups performed resistance training, it is possible that such differences are a reflection of the different patterns of dietary restriction.

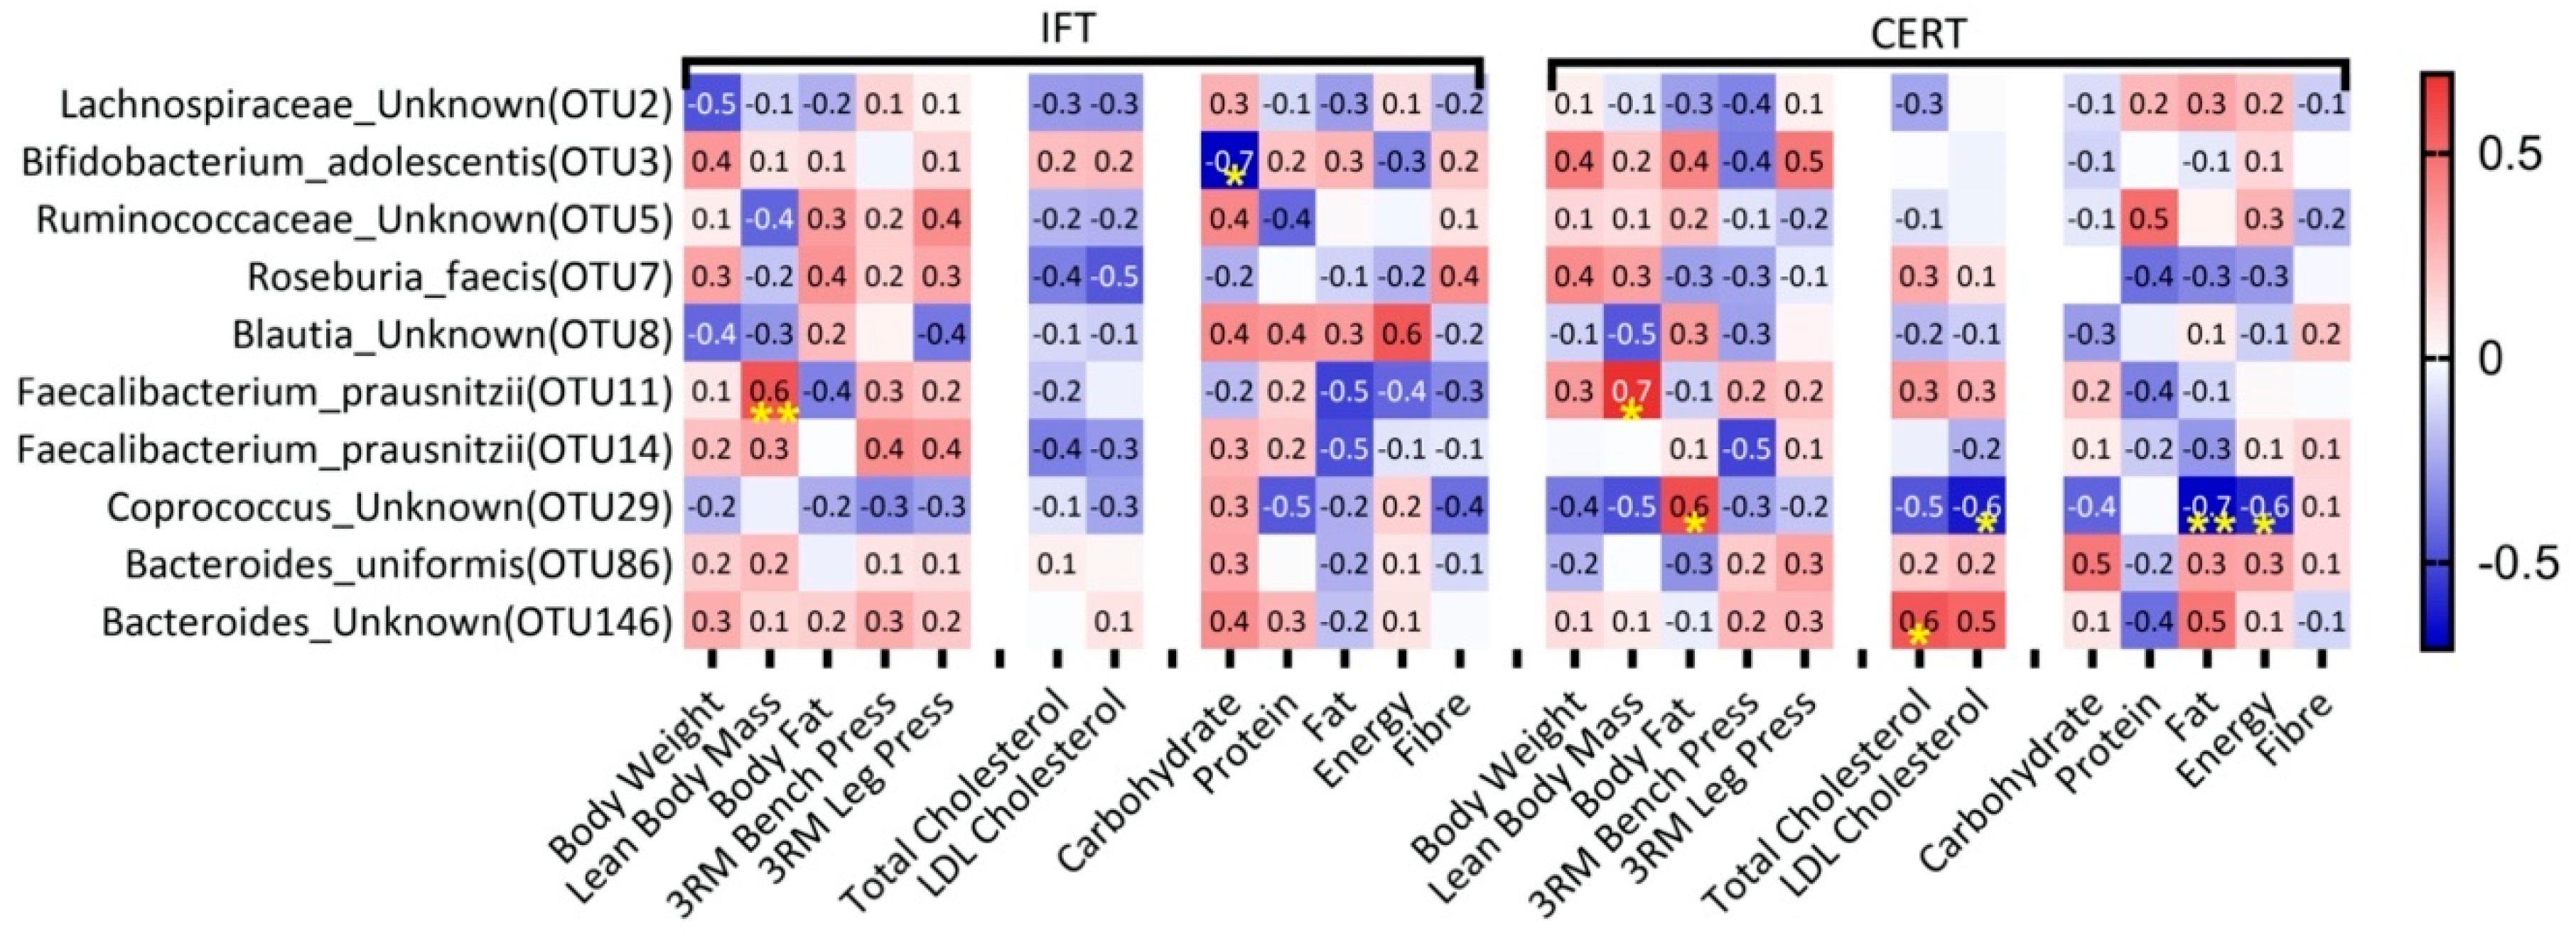
3.5. Correlates between Changes in Diet, Blood Cholesterol and Physical Measures with Changes in Bacterial Abundance

The relationship between treatment and response was evaluated by Spearman’s correlation analysis. Changes from baseline in dietary intake, blood cholesterol and physical measures were correlated with changes in relative abundance of bacterial taxa (Figure 3). Changes in total carbohydrate intake during IFT treatment was negatively correlated with B adolescentis (OTU3, rs = −0.7, p = 0.01); however, this correlation was not observed in the CERT group. In the CERT group, changes in total fat and energy intake were negatively correlated with changes in the abundance of Coprococcus spp (OTU29, rs = −0.7, p = 0.009; rs = −0.6, p = 0.03, respectively). Changes in relative abundance of Faecalibacterium prausnitzii (OTU11) was positively correlated with LBM (IFT, rs = 0.6, p = 0.05; CERT, rs = 0.7, p = 0.01) in both the treatment groups. Finally, changes in Coprococcus (OTU29) within the CERT group was positively correlated with the changes in body fat (rs = 0.6, p = 0.03) and negatively correlated with LDL cholesterol (rs =−0.6, p = 0.02), fat (rs = −0.7, p = 0.009) and energy intake (rs = −0.6, p = 0.03).
A limitation of the study was that fecal and/or blood metabolomics were not analyzed to determine changes in microbial-derived metabolites, specifically SCFAs. As a result, we cannot conclude with confidence that the increase in SCFA bacteria actually increased the SCFA concentration in the fecal samples.

4. Conclusions

Exploratory analysis of the secondary outcome measures of a randomized controlled trial, using resistance training paired with energy restriction, suggests that regardless of the type of energy restriction (intermittent or continuous), similar changes in bacterial diversity and shifts in relative abundance of bacterial taxa occurred. Furthermore, both interventions resulted in the enrichment of SCFA-producing bacteria. Furthermore, F. prausnitzii, a butyrate-producing bacteria was positively and significantly associated with LBM in both the treatment groups. Advance research is needed to determine if the correlations found are causative by undertaking follow-up studies with larger sample sizes and other relevant measures that can help identify possible mechanisms of action.

Funding

SK was supported by a student scholarship from Swinburne University.

References

  1. Li, L.; Su, Y.; Li, F.; Wang, Y.; Ma, Z.; Li, Z.; Su, J. The effects of daily fasting hours on shaping gut microbiota in mice. BMC Microbiol. 2020, 20, 65. [Google Scholar] [CrossRef] [PubMed]
  2. Zhang, H.; Sparks, J.B.; Karyala, S.V.; Settlage, R.; Luo, X.M. Host adaptive immunity alters gut microbiota. ISME J. 2015, 9, 770–781. [Google Scholar] [CrossRef] [PubMed]
  3. Anhê, F.F.; Roy, D.; Pilon, G.; Dudonné, S.; Matamoros, S.; Varin, T.V.; Garofalo, C.; Moine, Q.; Desjardins, Y.; Levy, E.; et al. A polyphenol-rich cranberry extract protects from diet-induced obesity, insulin resistance and intestinal inflammation in association with increased Akkermansia spp. population in the gut microbiota of mice. Gut 2015, 64, 872–883. [Google Scholar] [CrossRef] [PubMed]
  4. Wiley, N.C.; Dinan, T.G.; Ross, R.P.; Stanton, C.; Clarke, G.; Cryan, J.F. The microbiota-gut-brain axis as a key regulator of neural function and the stress response: Implications for human and animal health. J. Anim. Sci. 2017, 95, 3225–3246. [Google Scholar] [CrossRef] [PubMed]
  5. Hasan, N.; Yang, H. Factors affecting the composition of the gut microbiota, and its modulation. PeerJ 2019, 7, e7502. [Google Scholar] [CrossRef] [PubMed]
  6. Mohr, A.E.; Jäger, R.; Carpenter, K.C.; Kerksick, C.M.; Purpura, M.; Townsend, J.R.; West, N.P.; Black, K.; Gleeson, M.; Pyne, D.B.; et al. The athletic gut microbiota. J. Int. Soc. Sports Nutr. 2020, 17, 24. [Google Scholar] [CrossRef] [PubMed]
  7. Allen, J.M.; Berg Miller, M.E.; Pence, B.D.; Whitlock, K.; Nehra, V.; Gaskins, H.R.; White, B.A.; Fryer, J.D.; Woods, J.A. Voluntary and forced exercise differentially alters the gut microbiome in C57BL/6J mice. J. Appl. Physiol. (1985) 2015, 118, 1059–1066. [Google Scholar] [CrossRef] [PubMed]
  8. Evans, J.M.; Morris, L.S.; Marchesi, J.R. The gut microbiome: The role of a virtual organ in the endocrinology of the host. J. Endocrinol. 2013, 218, R37–R47. [Google Scholar] [CrossRef] [PubMed]
  9. Dalton, A.; Mermier, C.; Zuhl, M. Exercise influence on the microbiome-gut-brain axis. Gut Microbes 2019, 10, 555–568. [Google Scholar] [CrossRef] [PubMed]
  10. Mitchell, C.M.; Davy, B.M.; Hulver, M.W.; Neilson, A.P.; Bennett, B.J.; Davy, K.P. Does Exercise Alter Gut Microbial Composition? A Systematic Review. Med. Sci. Sports. Exerc. 2019, 51, 160–167. [Google Scholar] [CrossRef] [PubMed]
  11. Beli, E.; Yan, Y.; Moldovan, L.; Vieira, C.P.; Gao, R.; Duan, Y.; Prasad, R.; Bhatwadekar, A.; White, F.A.; Townsend, S.D.; et al. Restructuring of the Gut Microbiome by Intermittent Fasting Prevents Retinopathy and Prolongs Survival in. Diabetes 2018, 67, 1867–1879. [Google Scholar] [CrossRef] [PubMed]
  12. Rinninella, E.; Cintoni, M.; Raoul, P.; Ianiro, G.; Laterza, L.; Lopetuso, L.R.; Ponziani, F.R.; Gasbarrini, A.; Mele, M.C. Gut Microbiota during Dietary Restrictions: New Insights in Non-Communicable Diseases. Microorganisms 2020, 8, 1140. [Google Scholar] [CrossRef] [PubMed]
  13. McMurdie, P.J.; Holmes, S. phyloseq: An R package for reproducible interactive analysis and graphics of microbiome census data. PLoS ONE 2013, 8, e61217. [Google Scholar] [CrossRef] [PubMed]
  14. R Core Team. R: A Language and Environment for Statistical Computing; R Foundation for Statistical Computing: Vienna, Austria, 2013. [Google Scholar]
  15. He, Y.; Yin, J.; Lei, J.; Liu, F.; Zheng, H.; Wang, S.; Wu, S.; Sheng, H.; McGovern, E.; Zhou, H. Fasting challenges human gut microbiome resilience and reduces Fusobacterium. Med. Microecol. 2019, 1, 100003. [Google Scholar] [CrossRef]
  16. Ott, B.; Skurk, T.; Hastreiter, L.; Lagkouvardos, I.; Fischer, S.; Büttner, J.; Kellerer, T.; Clavel, T.; Rychlik, M.; Haller, D. Effect of caloric restriction on gut permeability, inflammation markers, and fecal microbiota in obese women. Sci. Rep. 2017, 7, 1–10. [Google Scholar] [CrossRef] [PubMed]
  17. Zou, H.; Wang, D.; Ren, H.; Cai, K.; Chen, P.; Fang, C.; Shi, Z.; Zhang, P.; Wang, J.; Yang, H. Effect of Caloric Restriction on BMI, Gut Microbiota, and Blood Amino Acid Levels in Non-Obese Adults. Nutrients 2020, 12, 631. [Google Scholar] [CrossRef] [PubMed]
  18. Ortiz-Alvarez, L.; Xu, H.; Martinez-Tellez, B. Influence of Exercise on the Human Gut Microbiota of Healthy Adults: A Systematic Review. Clin. Transl. Gastroenterol. 2020, 11, e00126. [Google Scholar] [CrossRef] [PubMed]
  19. Li, G.; Xie, C.; Lu, S.; Nichols, R.G.; Tian, Y.; Li, L.; Patel, D.; Ma, Y.; Brocker, C.N.; Yan, T. Intermittent fasting promotes white adipose browning and decreases obesity by shaping the gut microbiota. Cell Metab. 2017, 26, 672–685.e4. [Google Scholar] [CrossRef] [PubMed]
Figure 1. Effect of dietary treatment on fecal bacterial α and β-diversity. (A) α-diversity analysis of microbial composition in two treatment groups at pre (baseline) and post (12 weeks; post-intervention) treatment. Microbial evenness, diversity and richness were determined based on, Shannon Diversity Index, InSimpson index and Observed species. (B) Non-Metric Multidimensional Scaling (NMDS) plots based on Bray-Curtis Distance metrics of IFT and CERT dietary treatment showing pre and post treatment changes. Adonis function was employed to evaluate compare shift in microbiome composition compare to baseline with significance at p < 0.05.
Proceedings 61 00008 g001
Figure 2. Shift in the relative abundance of Bacterial Taxa. Mean fold change (log2 transformed) from baseline of Operational Taxonomic Units (OTUs) that showed significant effect (two-way repeated measure ANOVA, where p < 0.05 considered significant. * p < 0.05, ** p < 0.01).
Proceedings 61 00008 g002
Figure 3. Treatment-response relationships were evaluated on significantly changed OTUs, physical measures, blood cholesterol and dietary component (i.e., baseline to week 12) using spearman’s correlation, data represented are as correlation coefficient, where * p < 0.05 and ** p < 0.01.
Proceedings 61 00008 g003
Table 1. Baseline characteristics.
Baseline VariableIFT (n = 12)
Mean ± SD
CERT(n = 13)
Mean ± SD
IFT vs. CERT (p)
Male/Female6/65/8
Age (years)25.8 ± 5.123.6 ± 4.10.24
Weight80.2 ± 11.478.2 ± 13.80.70
BMI (kg/m2)27.3 ± 2.727.2 ± 3.20.97
LBM (kg)54.0 ± 12.151.4 ± 12.00.59
Body fat (kg)30.4 ± 7.930.6 ± 8.30.96
Bench Press (3RM)42.5 ± 19.237.6 ± 20.20.54
Leg Press (3RM)111.7 ± 57.196.7 ± 64.40.55
TC *4.7 ± 1.04.2 ± 0.60.19
LDL-C *2.7 ± 0.82.3 ± 0.50.09
HDL-C *1.5 ± 0.51.5 ± 0.40.81
Independent t-tests performed to determine differences between baseline variables for each group. * Analysis conducted on n = 22 due to blood draw failures and outlier exclusion.
Table 2. Changes in assessment measures.
VariableGroupBaseline
Mean ± SD
Post-Intervention
Mean ± SD
p (Group)p (Time)p (I)
WeightIFT80.2 ± 11.476.0 ± 10.30.54<0.0010.73
CERT78.2 ± 13.874.5 ± 12.0
BMI (kg/m2)IFT27.3 ± 2.725.9 ± 2.70.97<0.0010.73
CERT27.2 ± 3.226.0 ± 3.0
LBM (kg)IFT54.0 ± 12.155.8 ± 11.40.005<0.0010.97
CERT51.4 ± 12.053.2 ± 11.4
Body fat (kg)IFT30.4 ± 7.922.7 ± 5.90.07<0.0010.73
CERT30.6 ± 8.323.4 ± 8.0
Bench Press (3RM)IFT42.5 ± 19.246.3 ± 17.80.001<0.0010.17
CERT37.6 ± 20.243.5 ± 19.3
Leg Press (3RM)IFT111.7 ± 57.1140.3 ± 60.00.001<0.0010.96
CERT96.7 ± 64.4125.8 ± 58.1
TC *IFT4.7 ± 1.04.1 ± 0.70.300.0010.19
CERT4.2 ± 0.63.9 ± 0.8
LDL-C *IFT2.7 ± 0.82.2 ± 0.50.150.0010.15
CERT2.3 ± 0.52.1 ± 0.5
HDL-C *IFT1.5 ± 0.51.4 ± 0.50.370.120.41
CERT1.5 ± 0.41.4 ± 0.4
Dietary Variable Baseline
Mean ± SD
During-Intervention
Mean ± SD
p (Group)p (Time)p (I)
Energy (kJ)IFT7344 ± 14536581 ± 13360.200.070.99
CERT7511 ± 17636742 ± 1411
Protein (grams/day)IFT89.7 ± 31.0111.9 ± 24.00.05<0.0010.64
CERT86.4 ± 22.5114.2 ± 26.3
Carbohydrates (grams/day)IFT179.6 ± 52.6148.6 ± 35.90.040.0070.83
CERT182.8 ± 40.5155.9 ± 34.4
Fat (grams/day)IFT69.6 ± 16.756.1 ± 11.00.430.0040.89
CERT74.6 ± 26.058.1 ± 11.9
Fiber (grams/day)IFT18.3 ± 7.123.8 ± 6.10.300.040.27
CERT18.2 ± 6.419.9 ± 6.1
Linear mixed model was used to identify main effects for group, time and group × time interactions. Group = main effect for group, I = time x group interaction, time = main effect for time.
Publisher’s Note: MDPI stays neutral with regard to jurisdictional claims in published maps and institutional affiliations.

