Proceeding Paper

Fine Electrolytic Tough Pitch Copper Multistage Wiredrawing Pass Schedule Design by Analytical and Numerical Methods †

by
Oscar Rodríguez-Alabanda
1,*,
Esther Molero
1,
Marius Tintelecan
2,
Guillermo Guerrero-Vaca
1,
Pablo E. Romero
1 and
Gustavo Aristides Santana Martinez
3
1
Department of Mechanical Engineering, University of Cordoba, Medina Azahara Avenue, 5, 14071 Cordoba, Spain
2
Department of Materials Processing Engineering, Faculty of Manufacturing and Materials Engineering, Technical University of Cluj-Napoca, 28 Memorandumului Street, 400114 Cluj-Napoca, Romania
3
Engineering School of Lorena, University of São Paulo-USP, Lorena, SP 12602-810, Brazil
*
Author to whom correspondence should be addressed.
Presented at the 14th International Conference on Interdisciplinarity in Engineering—INTER-ENG 2020, Târgu Mureș, Romania, 8–9 October 2020.
Proceedings 2020, 63(1), 12; https://doi.org/10.3390/proceedings2020063012
Published: 11 December 2020

Abstract

:
Electrolytic tough pitch copper is commonly used in electric and electronic applications while fine copper wires are widely used in electronic conductors. A multi-pass wiredrawing process was designed for the manufacturing of fine pure copper wire, from 0.50 mm to 0.10 mm in diameter. The analytical model and the finite element analysis (FEA) were performed to validate the pass schedule design. The initial wire was mechanically characterized, and the pass schedule design was stablished by the analytical method according to the specific criteria. The sequence of wiredrawing passes was modeled in the finite element method (FEM) software in order to analyze and validate the designed pass schedule. The combination of these methods allowed designing and validating the wiredrawing pass schedule to implement it in a real process with guaranteed results. This work contributes in showing a combined methodology for the design and virtual validation of the pass schedule in the case of multistage wiredrawing of ETP copper fine wires.

1. Introduction

Fine wire is manufactured with metals such as stainless steel, gold, magnesium, tungsten, rhodium and copper by a sequential multi-pass wiredrawing process [1,2,3,4,5,6]. Copper fine wires have a wide range of applications as semiconductors and bonding wire in electronics, medical devices, shielding applications or measurement sensors, as is shown in Figure 1.
Fine round section copper products are manufactured by wiredrawing with polycrystalline or natural single crystal diamond dies [7]. Its good formability allows to easily draw from rod into very fine wire sizes without intermediate annealing treatment. Usually, the area reduction of pure copper is limited to about 90% just before a first annealing. Beyond that level of reduction, metallurgical structure changes dramatically degrade the wire’s mechanical properties. Fine copper wire is often produced by sequential multi-pass wiredrawing, the so-called “in line process”, which involves moderate advancing speed combined with continuous annealing.
The importance of die geometry is crucial in single-step and multi-step wiredrawing process and the influence of the reduction and bearing zones affects directly on the drawing force (Fd), drawing stress (σd) and stress distribution in its radial (σradial) and axial (σaxial) components, among other output variables [6,8,9,10].
On the other hand, analytical methods have long been used for modeling wiredrawing. Rubio et al. demonstrated the feasibility of the combination of the slab method and numerical simulation for the single-step drawing process analysis [11,12,13]. Hassan et al. studied the influence of different process inputs, geometrical and technological, applying the free body equilibrium Equations (1) and (2) obtained by the slab method in the drawing process and evaluating the results by a comparison with those obtained in the numerical simulations [14]. Rodriguez-Alabanda et al. developed a software application for designing and optimization of multi-step wiredrawing processes which is based in the implementation of the slab method [13,15]. The slab method analytical model and the finite element method (FEM) model of the single step process are shown in Figure 2.
Regarding the metal to be drawn, σy corresponds to the yield stress while α is the semi-angle of the drawing die, d0 refers to the initial diameter of the wire and df is the diameter at the exit of the die. In the Figure 2, p is the normal die-wire pressure, L is the contact length of reduction cone, Lc is the bearing length and μ corresponds to the friction coefficient at the die-wire interface.
σ d = σ y · 1 + B B · [ 1 ( d 0 d f ) 2 B ] ,
where
B = μ · c o t α
One of the most advanced analytical models for the calculation of the drawing stress (σd) was developed by Avitzur [16,17] and later approached by Bitkov [6,18] from the implementation of the so-called upper bound method in the drawing process (Equation (3)), where ri and rf indicate the initial and final radius of the wire and f(α) is a function of the die semiangle. Thus, in wiredrawing, the reduction ratio is noted as r and represents the degree of total area reduction possible without intermediate annealing as a function of the composition of the metal to be drawn (Equation (4)).
σ d σ y = σ b a c k σ y + 2 · f ( α ) · l n r 0 r f + 2 3 · ( α s i n 2 α c o t α ) + 2 μ · { c o t α · [ 1 σ b a c k σ y l n r 0 r f ] · l n r 0 r f + L c r f } 1 + 2 · μ · L c r f
r = 1 d f d 0
As denoted from the above models, the friction factor has a great significance in the wiredrawing process. A negative effect of friction in the drawing process can have as a consequence non-uniform distribution of stress intensity on the metal into the reduction zone and may cause non-uniform distribution of mechanical properties on the final wire cross section. The friction coefficient (μ) can be calculated by using the Avitzur’s upper bound model equation [16,17,19], together with the data of the wire drawing force obtained empirically, and the most favorable value obtained under the different lubrication conditions used in the experiment has been used in the multi-step wiredrawing process modelization and FEM analysis.
Computer-aided numerical simulation of the wiredrawing process offers great potential in the sense of analysis and design of this type of process and previous works consulted [1,2,20], which demonstrated its viability for implementation in the case of multi-step wiredrawing case. The finite element method (FEM) has been implemented successfully in many previous research works consulted [5,21,22,23,24].
The present work constitutes an analytical-numerical study concerning the experimental procedure for the initial characterization of the metal and with the aim of determining the best tribological conditions of the wire drawing process object of study. The research is focused on the involvement and combination of both methods for the design and analysis of responses such as the drawing stress or the distribution of radial and axial stresses in the final drawn product in multi-step sequencing. It is a meaningful effort because the good implementation of this combined procedure allows to understand the process conditions leading the way for a specific product quality and functional properties improving the productivity. The structure of the paper is organized as follows: In the Materials and Methods section, we describe the copper properties and characteristics, in addition to all the specific methods and equipment used. The results from analytical as well as finite element method (FEM) simulations are presented in Results section and, finally, concluding remarks are mentioned in the Conclusions section.

2. Materials and Methods

The experimental procedure was applied to determine the plastic deformability of the commercial Cu-ETP (99.94% Cu) wire with 0.5 mm diameter and a length of 200 mm in the annealed condition implemented in the original industrial process. This wire is a semi-elaborated product that is annealed in a continuous induction system, just at the end of the production process. Since our objective was to study the possibilities of processing this material in a subsequent fine wiredrawing process, a tensile test was performed to obtain the mechanical properties of specimens.
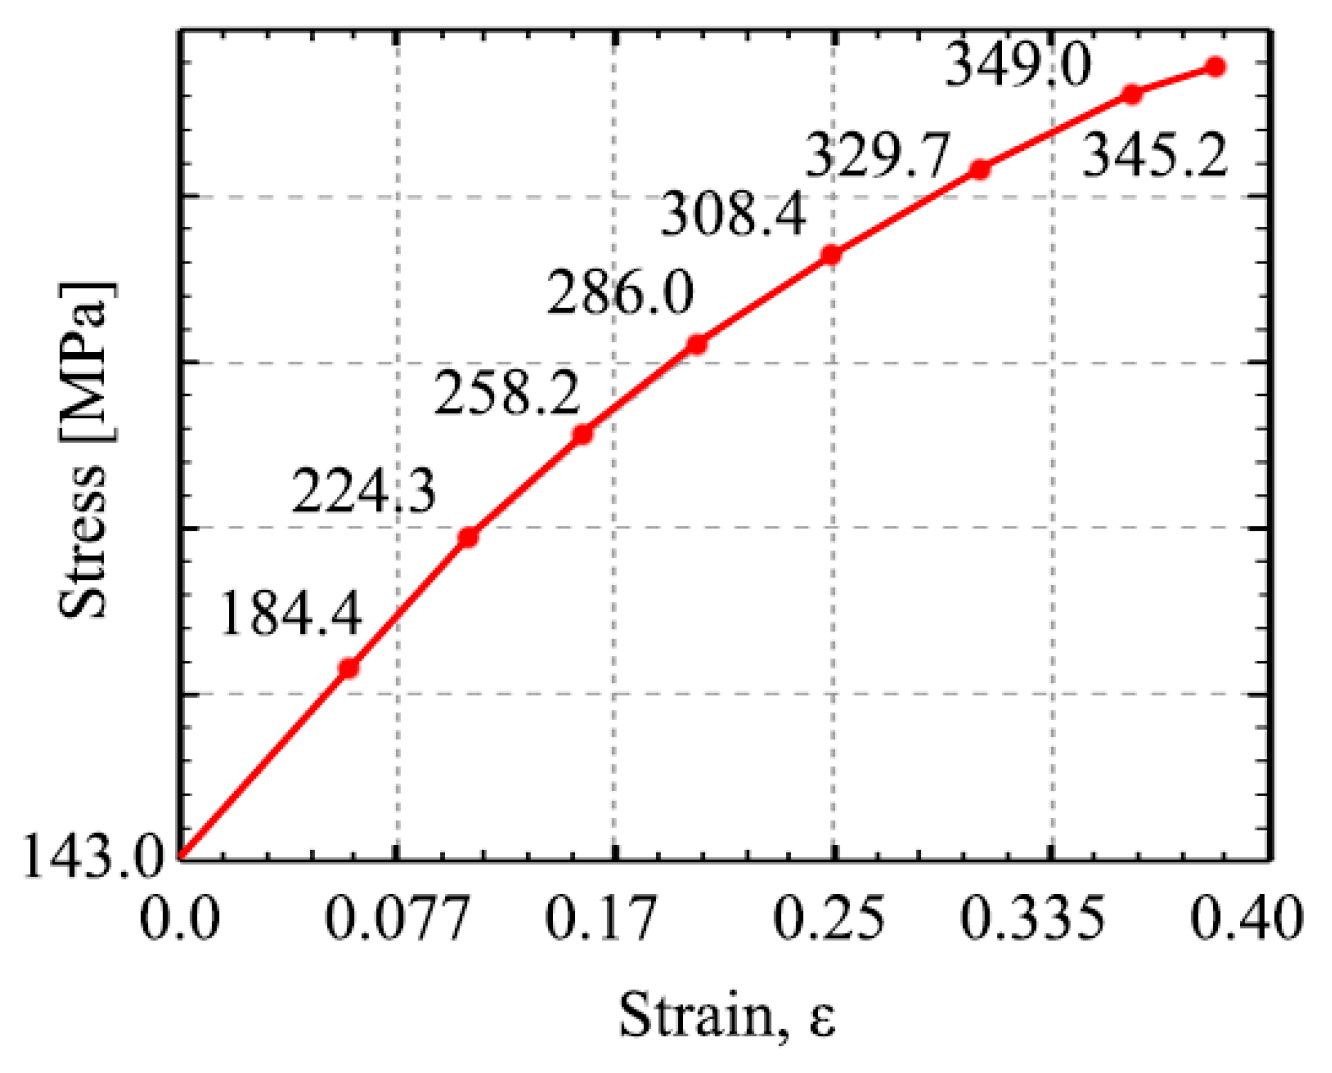
Both Ludwik–Hollomon strain hardening model defined by Equation (5) and multilinear isotropic strain hardening (MLISH) rule were checked to simulate the material behavior in the FEM software. The MLISH was checked assigning a value of stresses equal to σy = 143 MPa at ε = 0 unitary true strain and σUTS = 349 MPa when ε = 0.3706 (Figure 3).
On the other hand, for the initial copper wire tested, the elastic modulus is E = 14001.92 MPa, yield strength σy,0.2% = 143 MPa, break limit σUTS = 349.04 MPa, constant K = 496 MPa and strain hardening coefficient n = 0.34. Finally, the Ludwik–Hollomon strain hardening model was selected to analyze the results in the FEM simulations.
σ ε ( i ) = σ 0 ( i ) + K · ε n
ε is the unitary deformation in the step (i), σ0(i) in the initial yield strength of the metal to be drawn and σε(i) is the yield strength of the drawn metal after this drawing step.
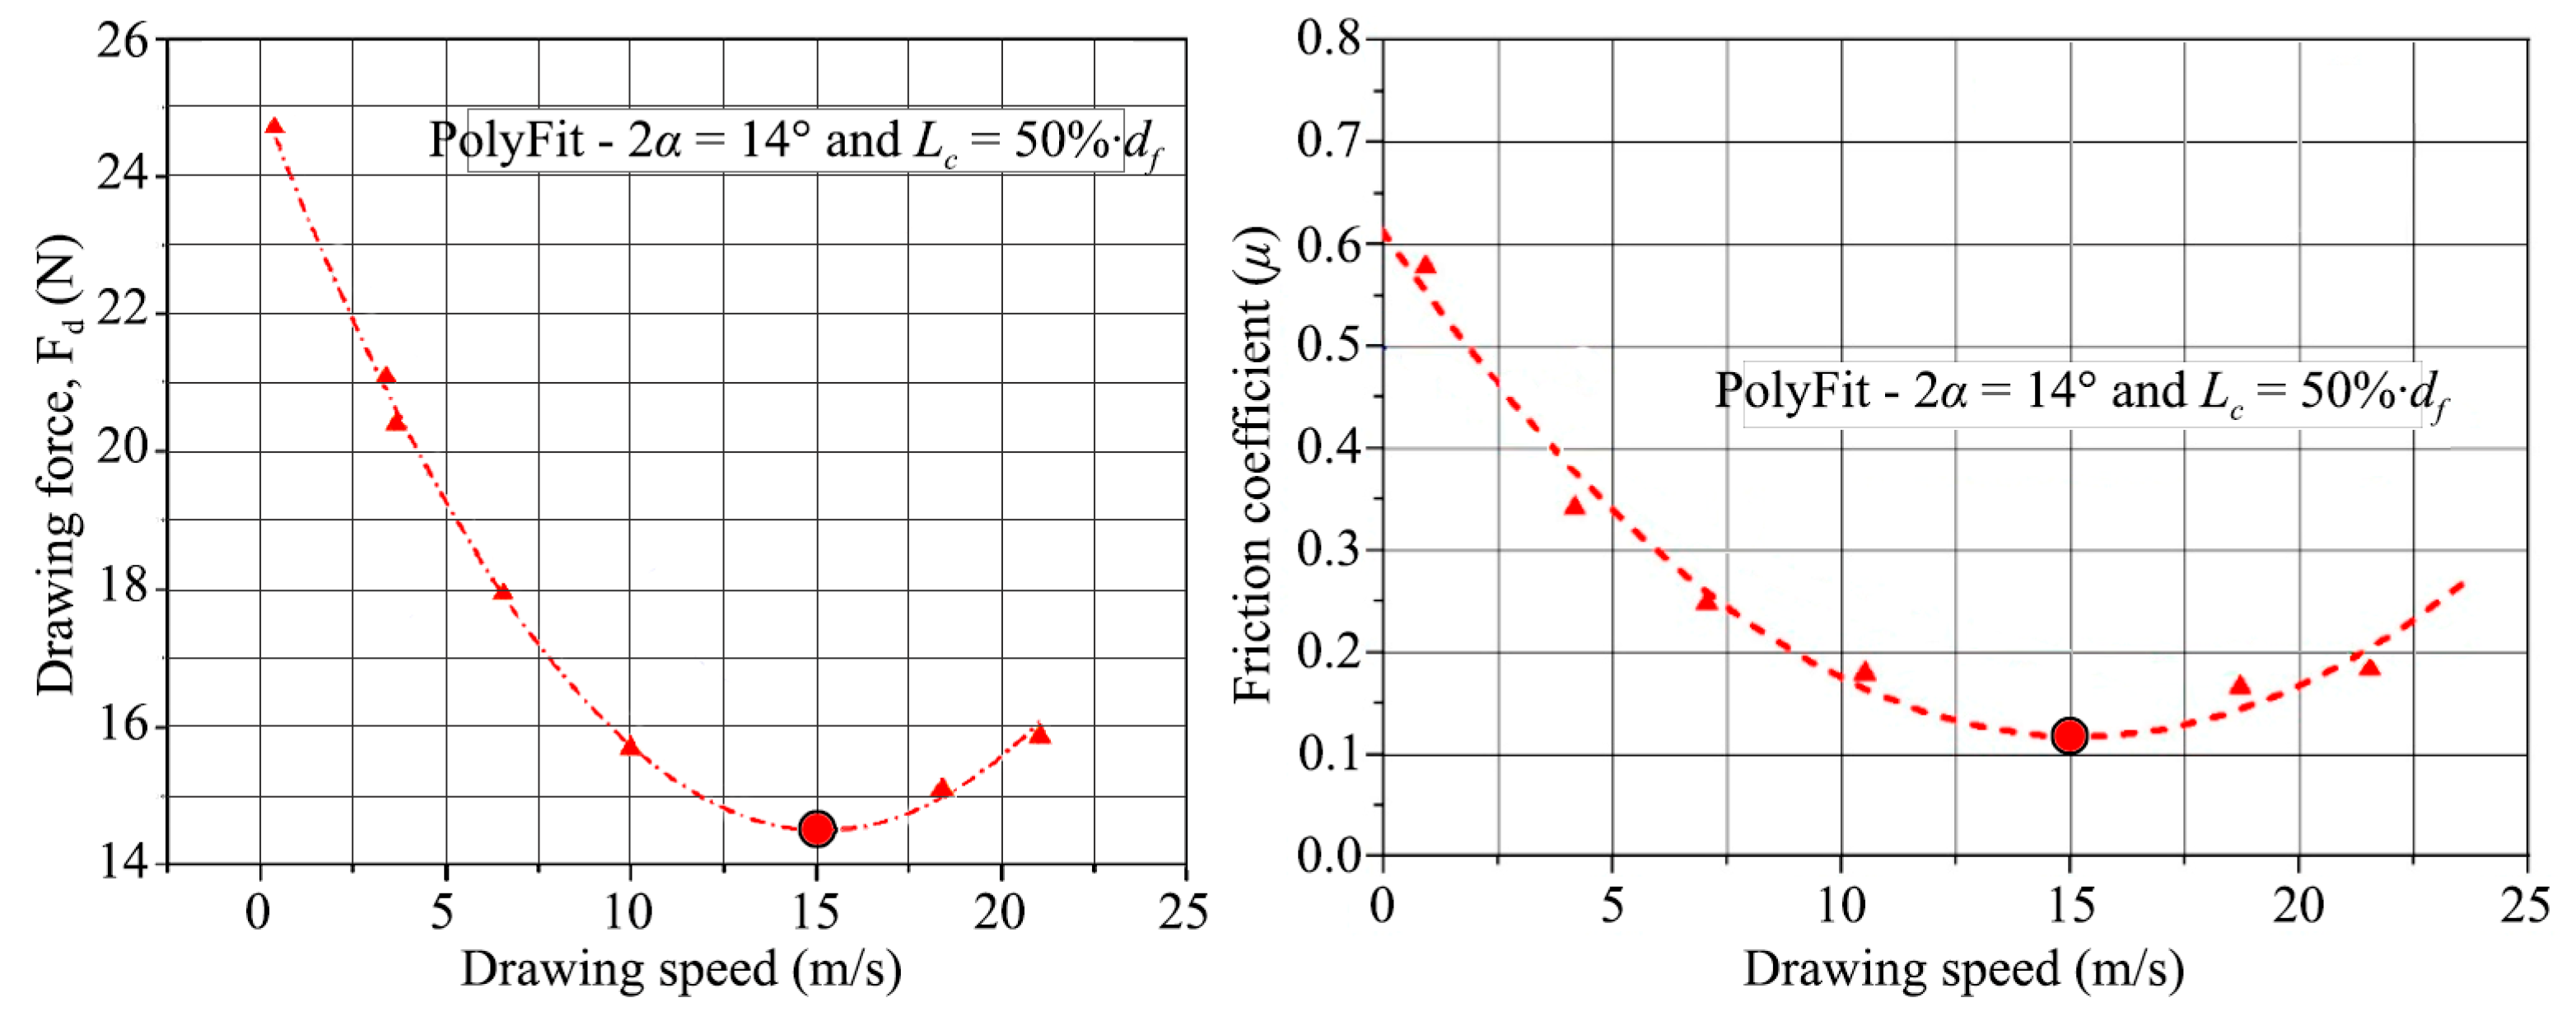
In a second experimental phase, the single-step wiredrawing at different speeds were implemented with the aim of calculate the friction coefficient (μ) using a mineral oil lubricant and calculating the lower value for μ from these experimental results. The experimental procedure was done using a single block drawing machine and a conical wiredrawing die with a core made of polycrystalline diamond (PCD) with 2α = 14° and Lc = 50%∙df, geometrical features and core material recommended by Esteves group [25], commonly used in the case of copper wiredrawing. The drawing stress σd was determined by a direct measure of the drawing load (Fd) with a load cell and signal acquisition system installed on the machine (Figure 4). Finally, the optimal values of μ were determined indirectly, analytically and by polynomial interpolation of the results.
Next, and knowing the plastic behavior of the material, in addition to the minimum value of the friction coefficient obtained by the analytical-empirical method, the analytical method was applied to design the multi-step wiredrawing process for the manufacture of fine wire, using the PullWorks computer application developed for this purpose [26]. This software tool is friendly to use for a user with a certain experience since all the working input conditions must be introduced in the software interface: the material strain hardening is a function of its mechanical properties and the geometric and tribological parameters for each of the consecutive dies/steps constituting the sequential process. However, the software refers to a desired value for the shape coefficient Δ in all the process for the multi-stage wiredrawing sequence design. A value 1 < Δ < 3 reduces the effect of friction while lower values near to one 1 < Δ < 2 minimize wear in the die contact surface, too [27]. In this specific work, the value of delta was fixed as Δ = 1 with aim of obtaining a short sequence of steps for the designed wiredrawing process and, theoretically, minimizing friction and wear effects. This coefficient is geometrically defined as the quotient between the average diameter (dm) and contact length (L), noted in the Equation (6).
Δ = d m L = d 0 + d f d 0 d f · s i n α
Finally, numerical simulations were performed to analyze the proposed multi-step wiredrawing pass schedule using Deform2D FEM software [28]. The model of the initial wire consists of quadratic elements in a perfect plastic wire for the axisymmetric case and the three-dimensional system was simplified in a two-dimensional problem in terms of longitudinal as well as radial dimensions. This initial portion was considered as isotropic body of Ø0.5 mm per 2 mm long and meshed in a linear-quadratic array of 10 elements in the radial direction and 80 elements in the axial direction. For the subsequent simulations of the whole sequence of drawing passes, the accumulated stress and strain state was considered. The drawing dies were modelled as a perfectly rigid body since the interest of this work is focused on the deformation of the wire. It should be noted that, for the purpose of simplifying the design of the rows and the simulations, there was a constant distance from the entry point to the reduction cone to the exit point of the row equal to 1 mm (zones II to IV). The lower value of the friction coefficient μ, obtained from the experimental measurements, was implemented in the simulations as Coulomb’s type friction. It must be noted that the effects of backward tension (σback) and thermal increment generated during the process were neglected in the present approach. The friction coefficients were obtained for different drawing speeds and implementing the measurements of the drawing force in Equations (7) and (8), according to Avitzur’s Equation (3).
μ = σ 0 · [ σ b a c k σ 0 + 2 · f ( α ) · l n r 0 r f + 2 3 · ( α s i n 2 α c o t α ) ] σ d 2 · [ ( L c r f · σ d ) { σ 0 · [ c o t α · ( 1 σ d σ 0 l n r 0 r f ) · l n r 0 r f + L c r f ] } ]
f ( α ) = { 1 c o s α · 1 11 12 · s i n 2 α + 1 11 · 12 · l n 1 + 11 12 11 12 · c o s α + 1 11 12 · s i n 2 α } s i n 2 α
In summary, in the presented procedural methodology, an experimental first phase is indispensable for the determination of the mechanical properties that define the behavior of the metal against cold deformation hardening using wiredrawing. The application of the analytical method implemented in software for the design of the desired sequence of steps for the multi-step process is proposed below, and it is demonstrated how the numerical method and the FEM simulations complement the procedure from the point of view of the analysis of different response variables of the same.

3. Results

3.1. Experimental Determination of the Friction Coefficient

The experiments to determine the lower value of friction coefficient μ were performed on a reduction from Ø0.50 mm to Ø0.45 mm using a die with a reduction angle 2α = 14°, a bearing length Lc = 50%∙df and a contact length in the conical zone L = 0.205 mm which implies a total contact length of 0.43 mm. The drawing tests were done using 100% mineral oil as lubricant interfacial tribo-element [6]. The polynomial fitting, shown in the Figure 5, gives a minimum value of μ = 0.127.
The results in the graph of Figure 5 show a lower friction when the drawing speed increases until a critical value of 15 m/s. Beyond this speed value, excess or lack of lubricant getting inside the wire/die interface may result in an increasing of the friction effect [29]. This minimum of μ = 0.127 was implemented in the analytical design and subsequent numerical analysis of the designed sequential wiredrawing process.

3.2. Analytical Definition of the Multi-Step Pass Schedule Design by PullWorks Software

Fine wiredrawing pass schedule design was calculated by PullWorks software and implementing Ludwik–Hollomon strain hardening law as shown in Equation (5), defining die geometry, the optimum friction coefficient μ = 0.127 and Δ = 1, since this shape coefficient value minimizes friction and wear effects and allows a short relatively sequence for the designed wiredrawing process [27].
The selected conditions threw a seven-step wiredrawing sequence pointing out the convenience of annealing before each of them. This sequence was established as the aim of study by both analytical and numerical methods. Table 1 shows the multi-step wiredrawing pass schedule design.
Table 2 shows the wiredrawing sequence calculated with PullWorks software and the values obtained for the drawing force and drawing stress, analytical and FEM software applications.
The graph of Figure 6 shows that the difference obtained by both methods is smaller than 12.4% in the evolution of drawing stress calculated from a drawing force (Table 2).

3.3. Numerical FEM Study of the Proposed Multi-Step Pass Schedule

To understand the influence of the die geometry in each of the stages of the wire multi-step wiredrawing process, the numerical simulations allows to measure the axial (tractional) and radial (compressive) components of the drawing stress and their evolution while the copper wire is passing through the different zones inside of the dies.
The radial and axial stress distributions were simulated assuming the optimum value of the friction coefficient μ = 0.127 since this condition corresponds to the minimal tool wear and optimum drawing speed, as shown in Figure 5. The simulation snapshot in Figure 7 shows the differentiated zones in the standard geometry of the drawing die and the 23 tracked nodes in a displacement of 1 mm, from a fixed starting point of the reduction cone area (II) to the exit zone (IV).
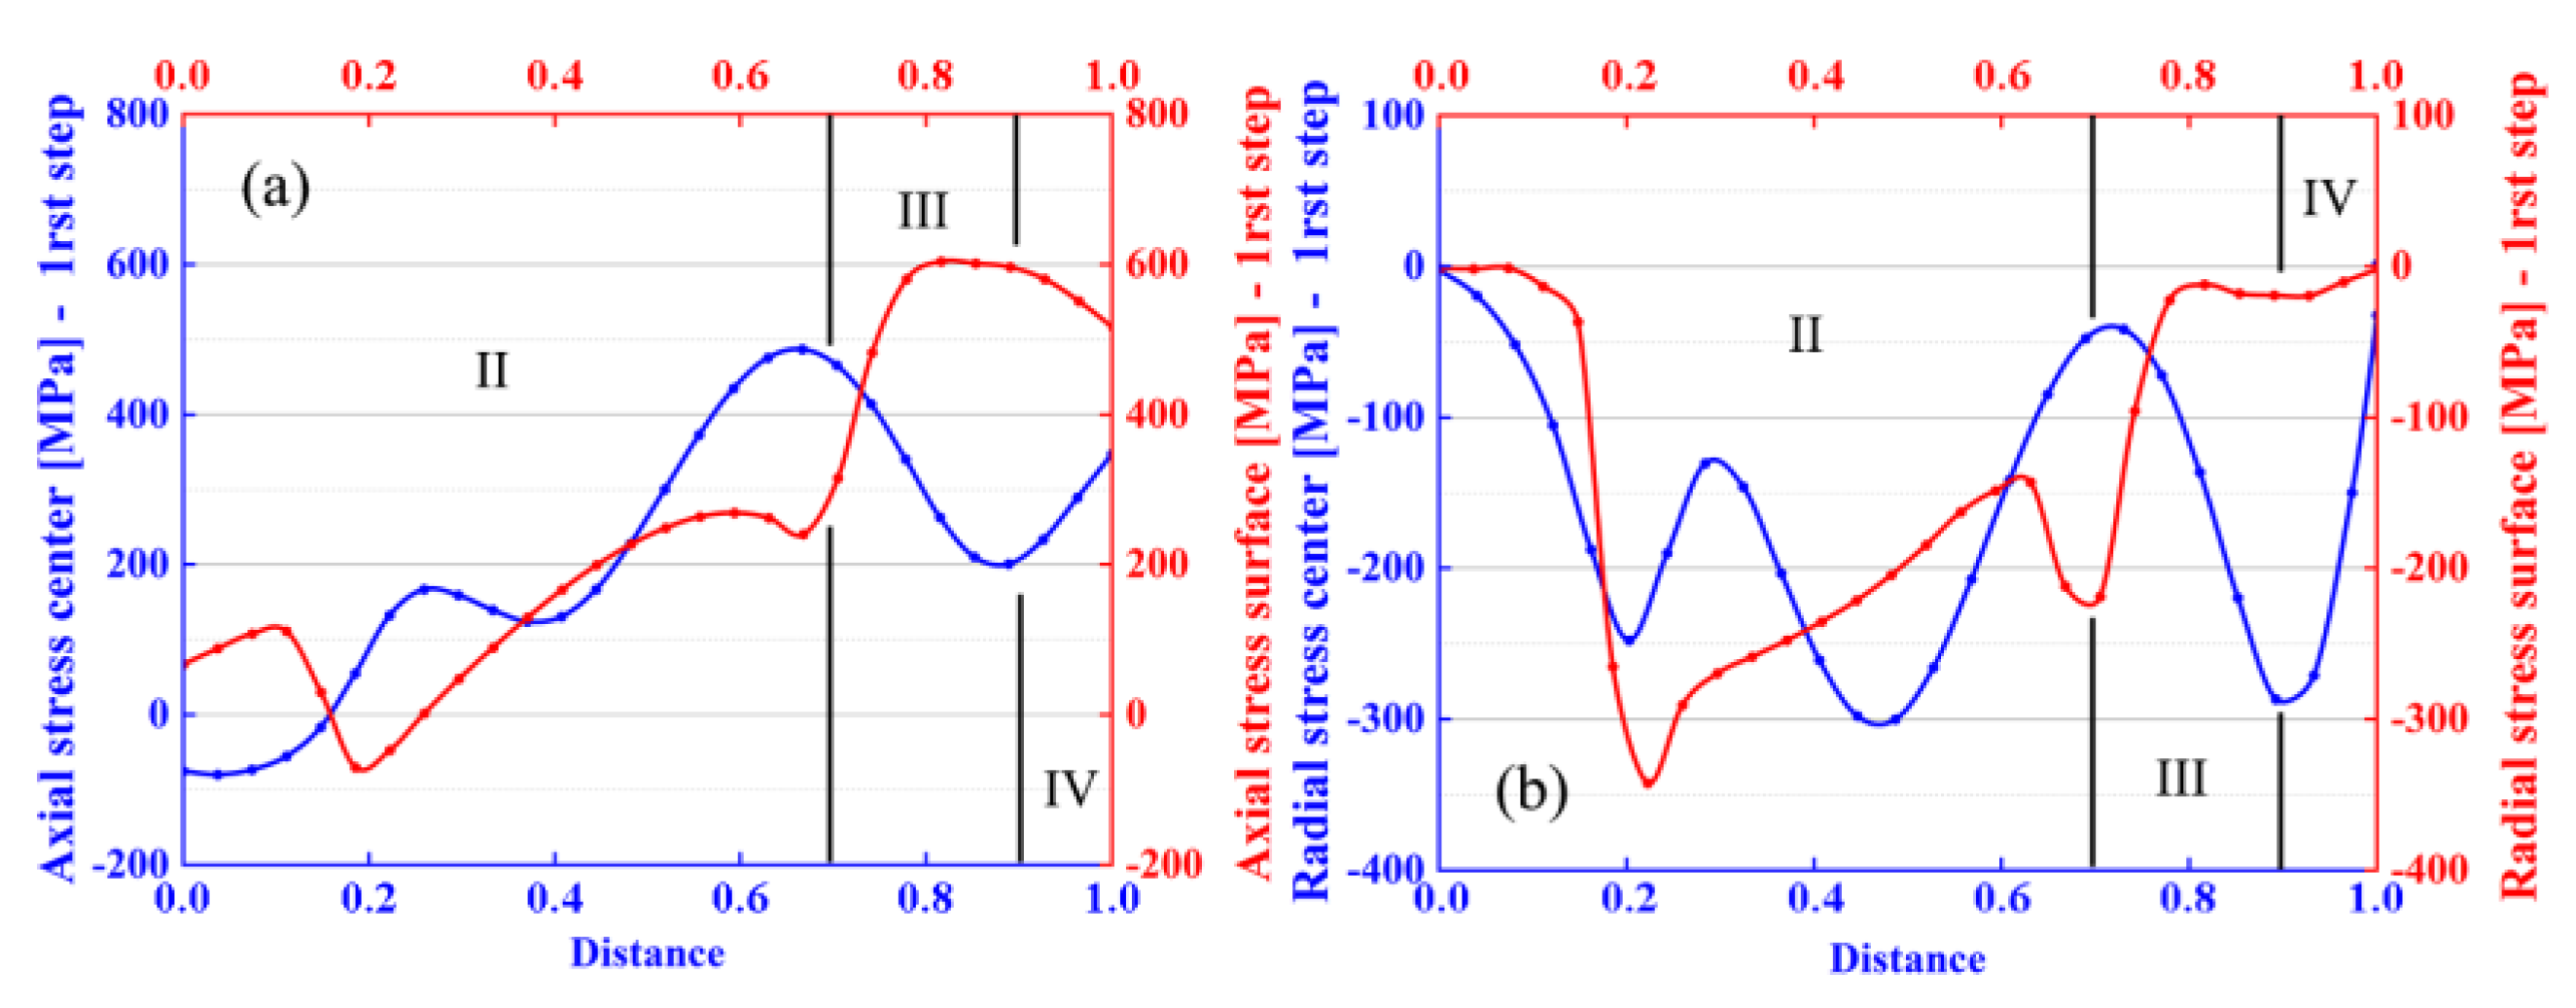
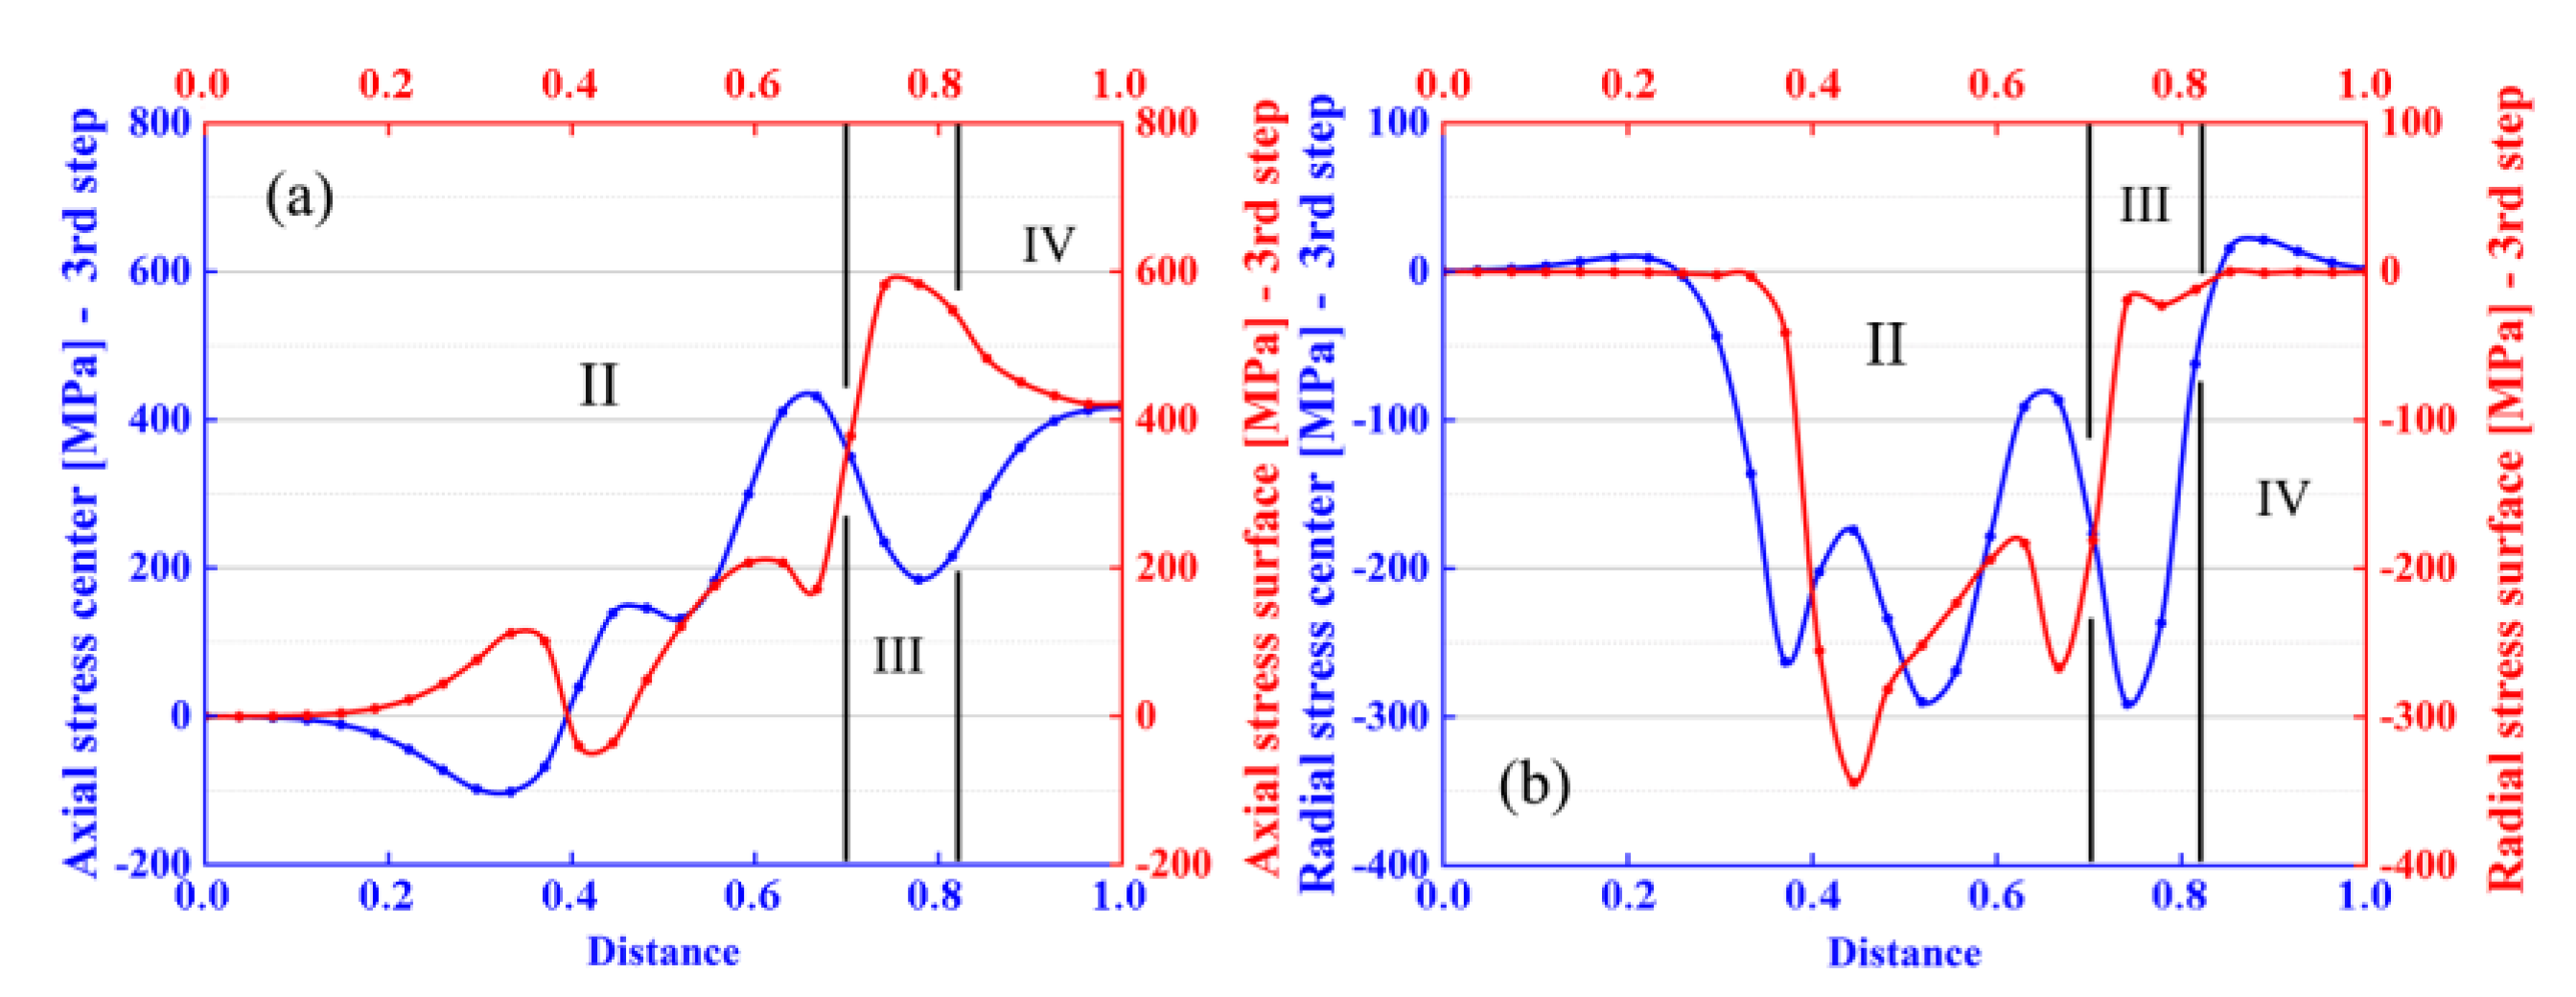
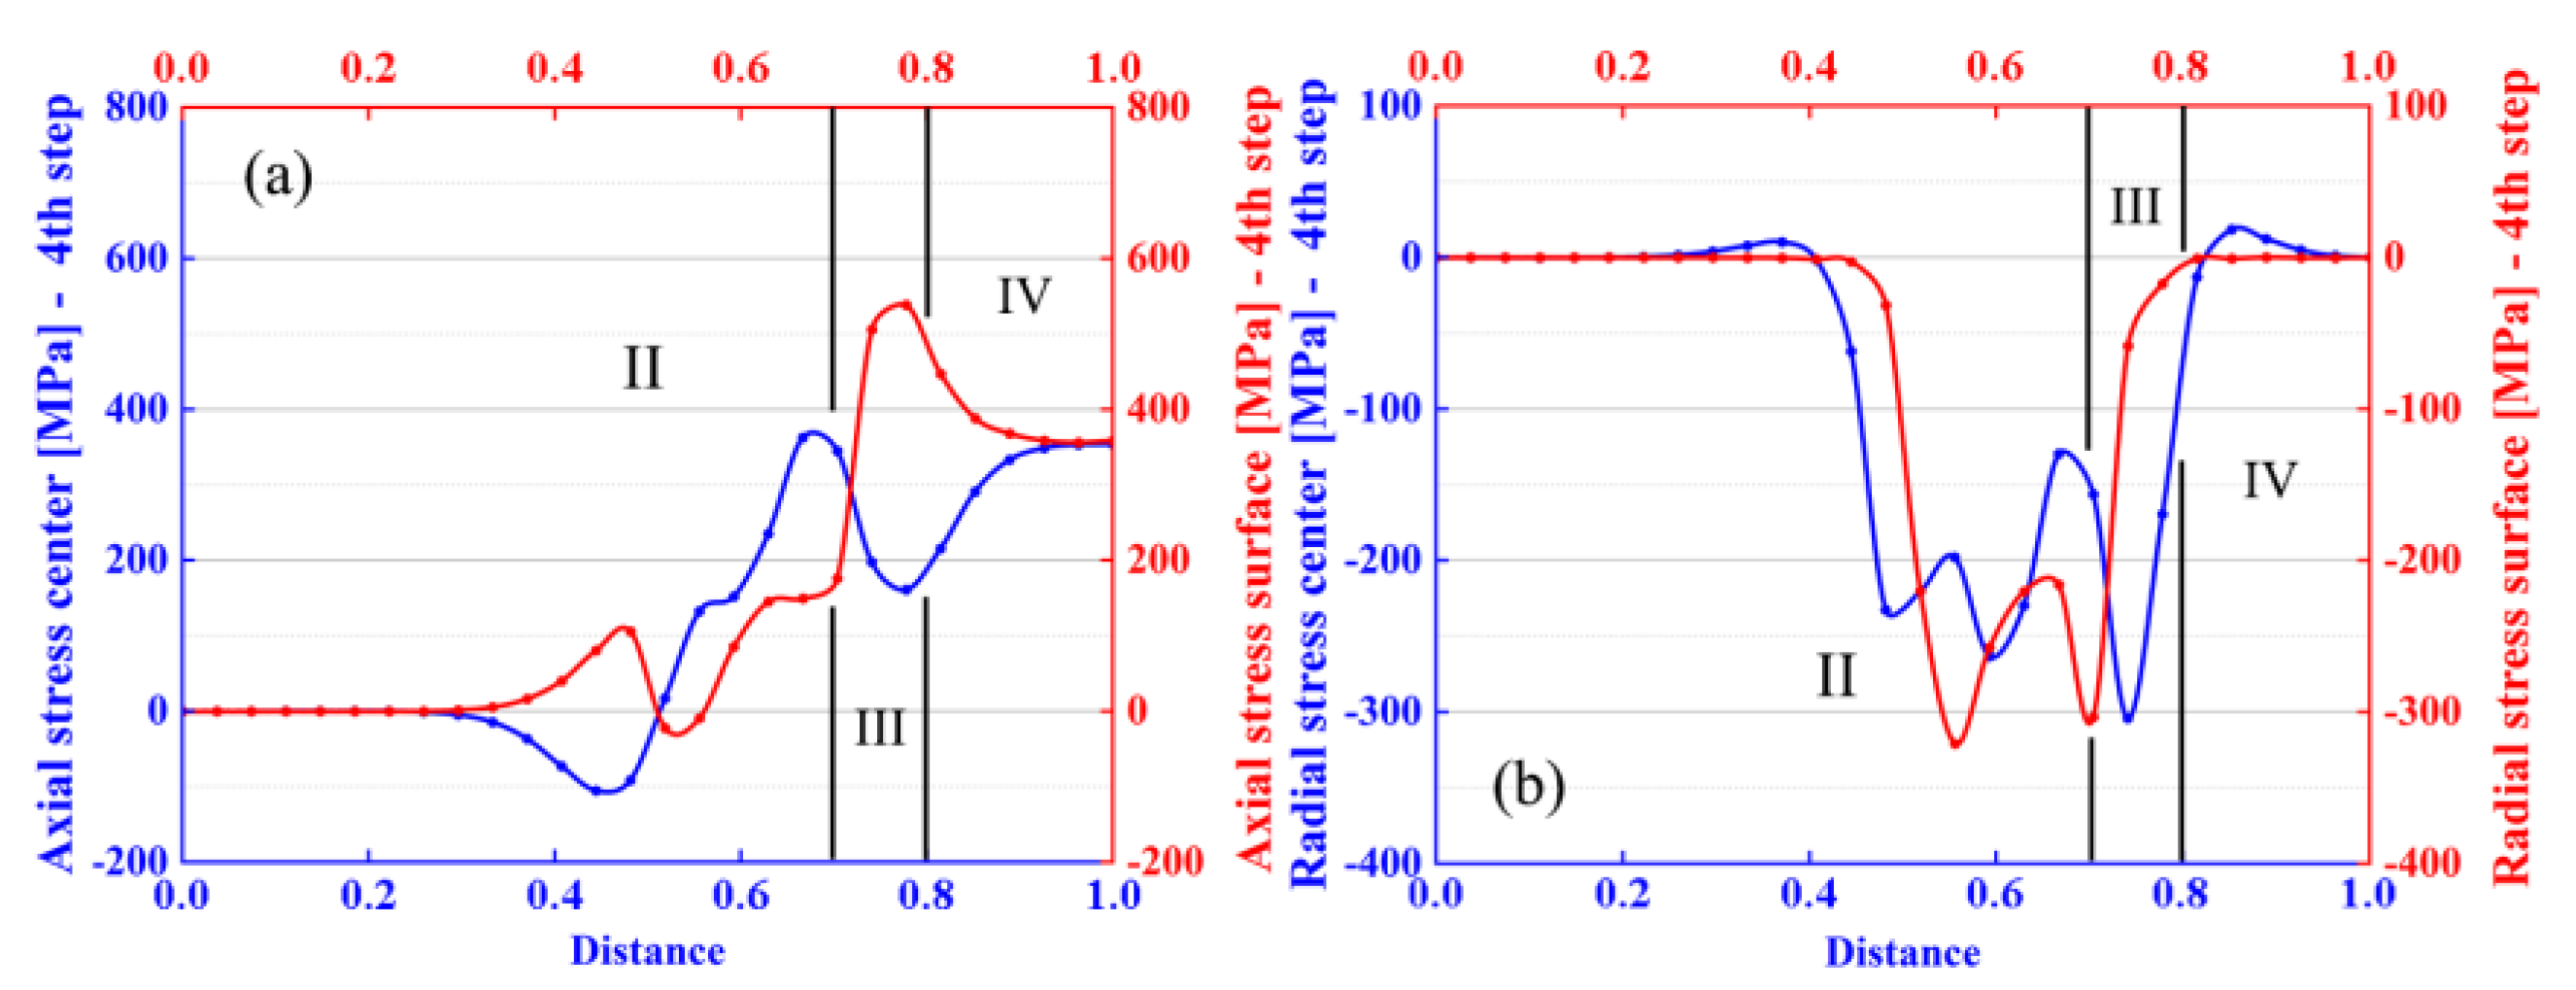
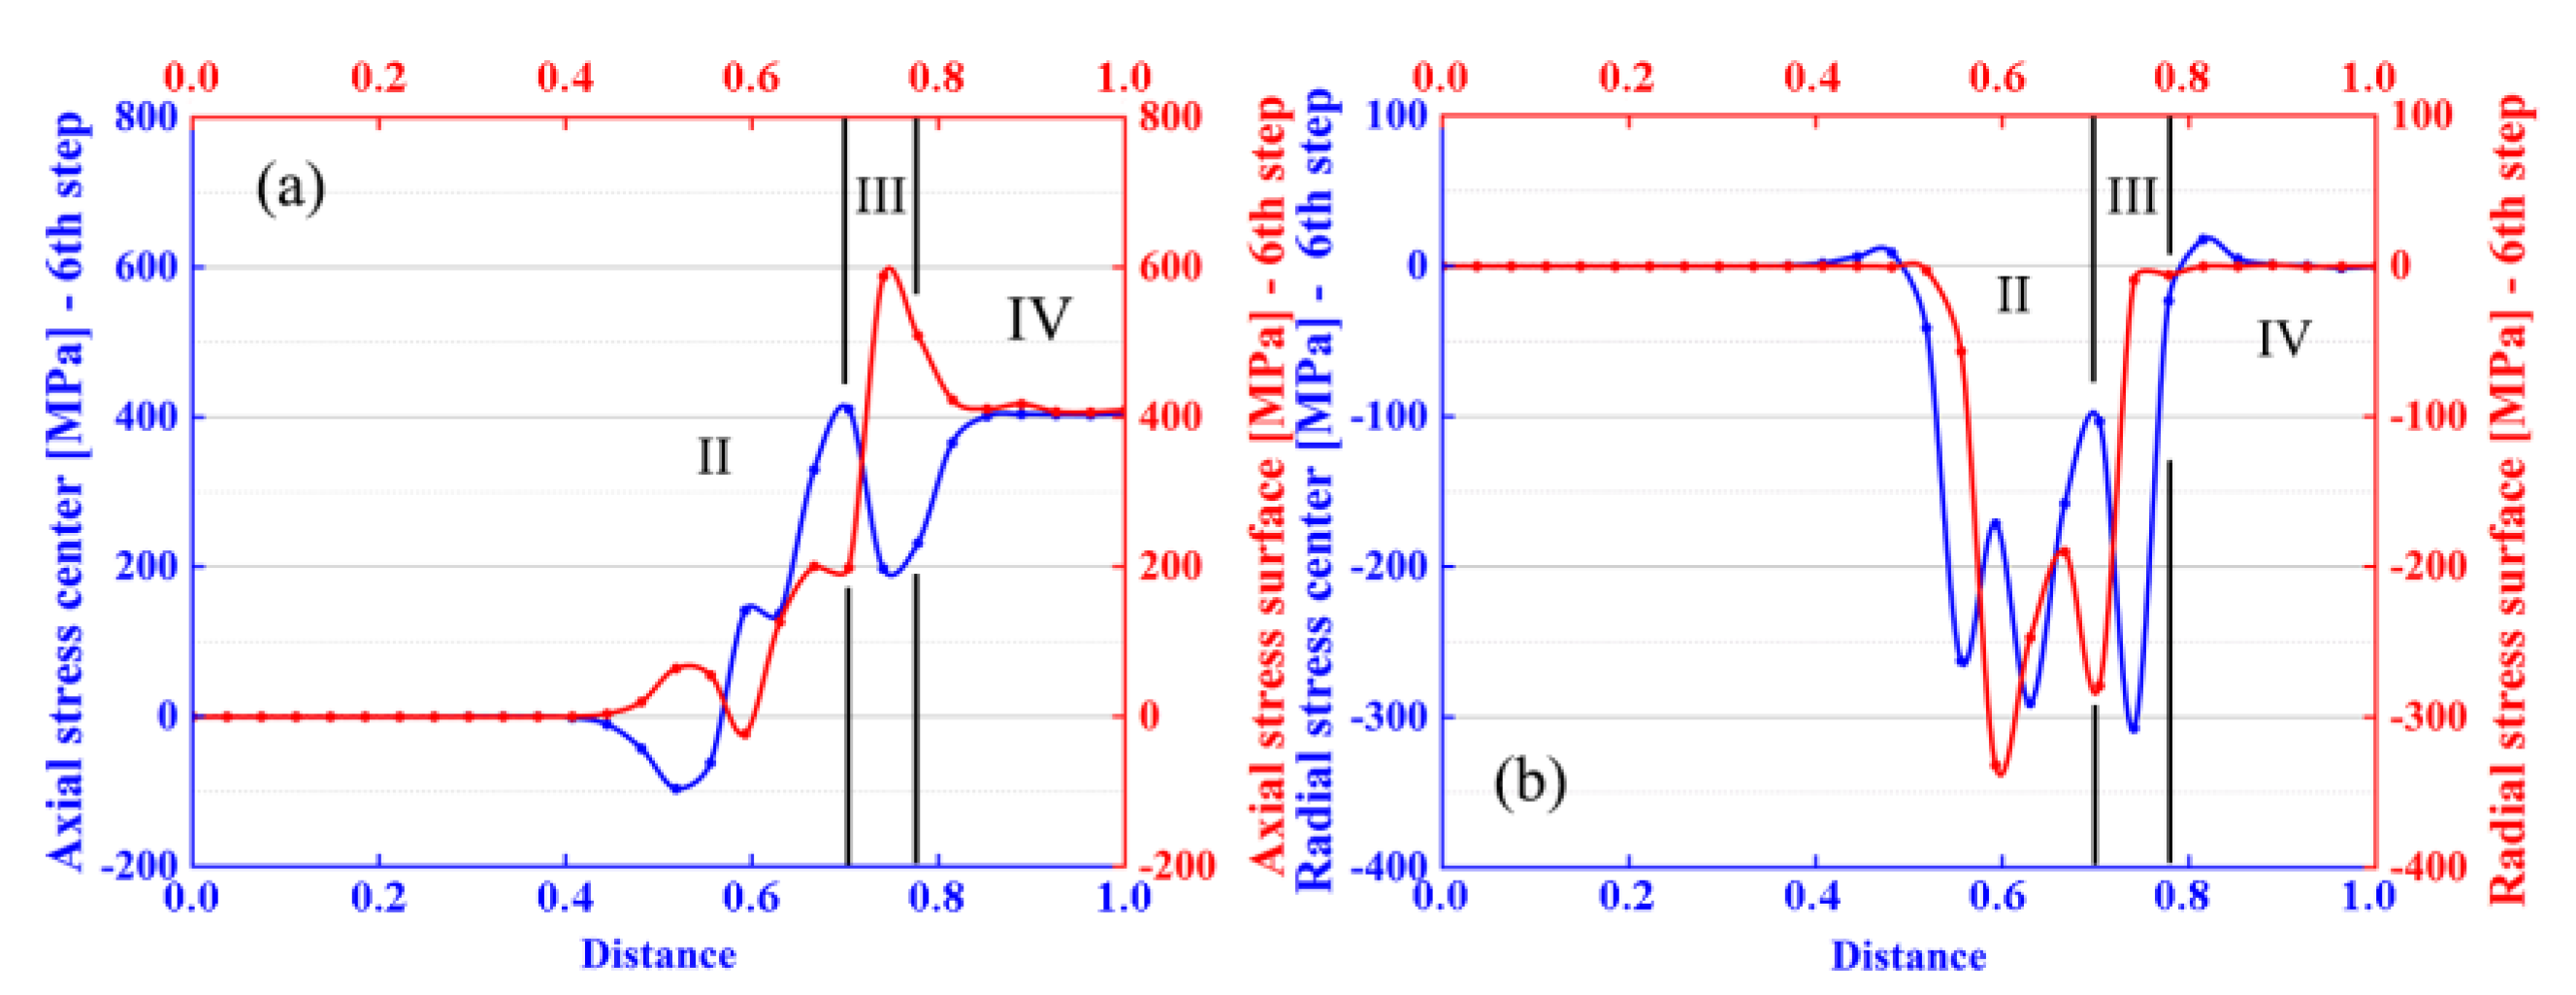
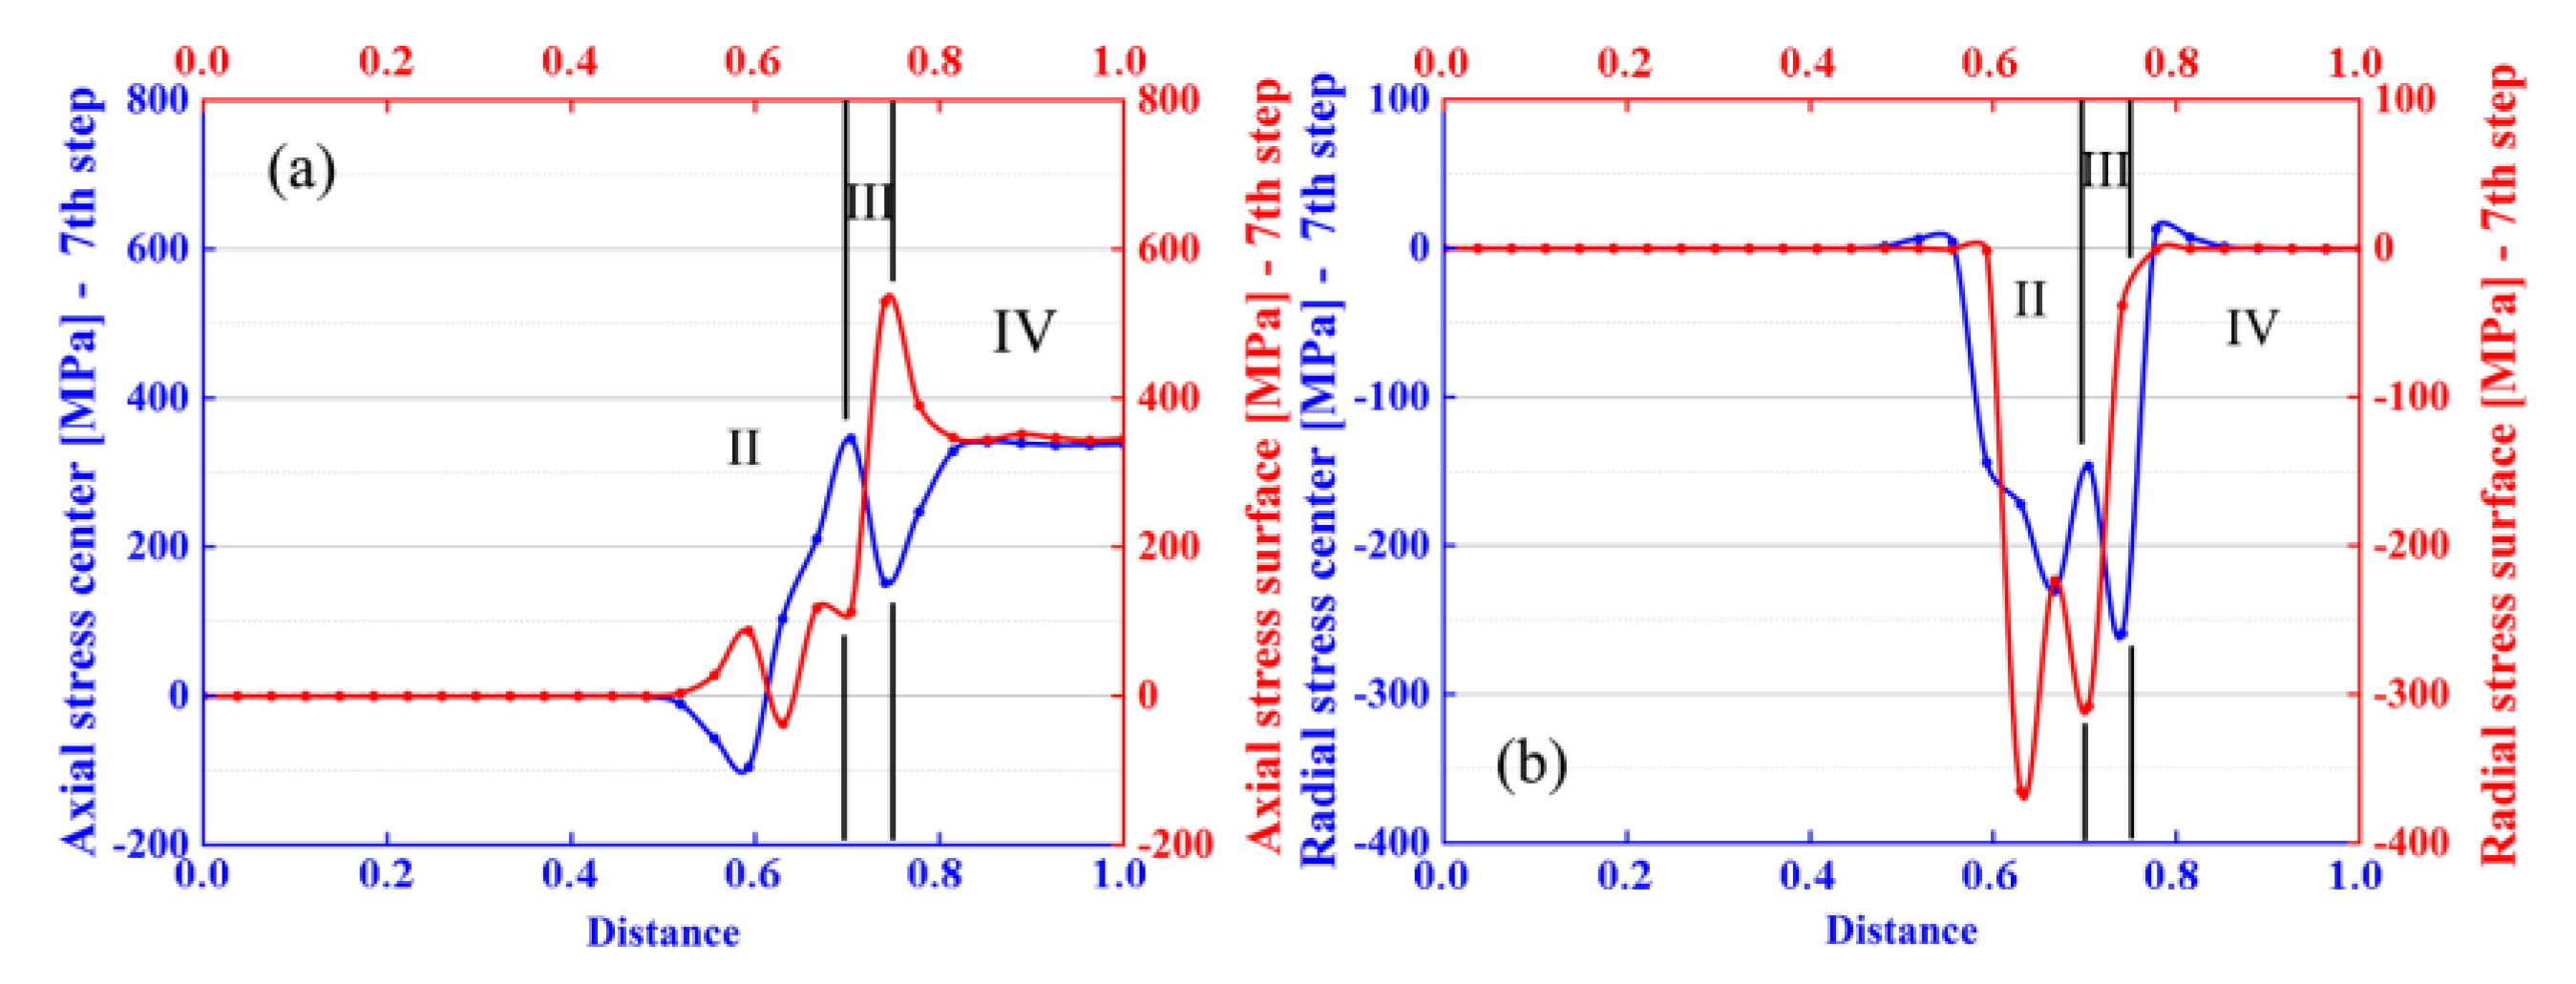
Figure 8, Figure 9, Figure 10, Figure 11, Figure 12, Figure 13 and Figure 14 show the simulations allowed to obtain the compressive radial (σradial) and axial (σaxial) data stress evolution when the wire goes to different zones through the die, in the surface and center of the wire (Figure 2b). Marks II, III, IV indicate the different zones trough the drawing die.
The results demonstrate the internal die geometry´s influence in association with the traction force from capstan in the axial and radial values. In other words, it is possible to see the tensile stress that is necessary to apply by each of the machine capstans (steps) and the compression stress generated in the conical deformation zone into the die (II).
It has been observed that the results obtained by both methods for the values of drawing stress and drawing force shown a very similar evolution (Figure 6). The values obtained by the FEM simulations are slightly higher than those obtained from the calculations performed analytically by means of the software application PullWorks. This fact is in line with the conclusions obtained in the work of Luis et al. [30] and that is because the analytical method only considers the effects of homogeneous deformation and friction, unlike the numerical model, which takes into account the effects due to the additional energy required as a consequence of the non-homogeneous deformation that occurs in wiredrawing process.
As can be seen in Figure 7, the small dies were modelled in such a way that the 0.00 point is fixed, that is, while Lc decreases in the sequence, the length of the conical zone without contact increases just after the entry zone (I). This fact can be appreciated in the graphs (Figure 8, Figure 9, Figure 10, Figure 11, Figure 12, Figure 13 and Figure 14): in the first step both radial (compressive) and axial stresses increase almost instantly with the wire contact with the conical zone, while in the last step (7th) the increase in values of σradial and σaxial is appreciated a few tenths of a millimeter inside the cone. This is because the effective contact length L(i) in this zone decreases as the area reduction increases in the wiredrawing sequence.
Compressive radial stresses (σradial) show a maximum near 300 MPa in the surface points, in all the steps of the sequence, Figure 8b, Figure 9b, Figure 10b, Figure 11b, Figure 12b, Figure 13b and Figure 14b. This circumstance is in agreement with the results obtained by Martinez [30]. The evolution of this response parameter shows a marked increment in its value in a point just entering bearing length, in the case of surface radial stress σradial (surface), while on the contrary, the radial stress in the center points decreases just in the same contact point.
As is shown in Figure 8a, Figure 9a, Figure 10a, Figure 11a, Figure 12a, Figure 13a and Figure 14a, axial stress (σaxial) evidences maximum values under 600 MPa and this maximum occurs at the exit of the die and on the surface points, just in the calibration zone (III) while the maximum of axial stress in the center points of the wire (≈400 MPa) occurs punctually just at the entrance of the calibration zone (III) to drop lightly and reach this maximum again at the exit of the die (IV).

4. Conclusions

In particular, by the experimental determination of the optimum value of the friction coefficient in the case of Cu-ETP commercial wiredrawing process, the analytical designing of a multi-step wiredrawing sequence and the corresponding numerical simulations have been performed in this work. This combined methodology development demonstrated that the effective complementation of the three methods, experimental, analytical, and numerical, allows the implementation of the real boundary conditions with the aim of process design and both analytical and FEM analysis. The work shows the results obtained by PullWorks software application, offering a proposal for a basic process of multi-step wiredrawing to obtain fine copper wire and FEM software has allowed to understand the process conditions in terms of both the superficial and center radial and axial stress components derived from the effective stress associated to the process in each of the stages.

Author Contributions

Conceptualization, O.R.-A. and G.A.S.M.; methodology, O.R.-A.; validation, O.R.-A., E.M. and G.A.S.M.; formal analysis, G.G.-V.; investigation, O.R.-A. and G.A.S.M.; resources, O.R.-A. and G.A.S.M.; data curation, G.A.S.M. and O.R.-A.; writing—original draft preparation, O.R.-A.; writing—review and editing, O.R.-A., P.E.R., M.T. and G.G.-V.; visualization, E.M., P.E.R., M.T. and G.G.-V.; supervision, G.A.S.M. and M.T.; project administration, G.A.S.M. All authors have read and agreed to the published version of the manuscript.

Funding

This research received no external funding.

Acknowledgments

Thanks to Ana María Camacho López, PhD. in the Department of Engineering of Construction and Manufacture, E.T.S. of Industrial Engineering of UNED (Madrid, Spain), allowed us the use of the licensed FEM software Deform2D.

Conflicts of Interest

The authors declare no conflict of interest.

References

  1. Parnian, P.; Parsa, M.H.; Mirzadeh, H.; Jafarian, H.R. Effect of Drawing Strain on Development of Martensitic Transformation and Mechanical Properties in AISI 304L Stainless Steel Wire. Steel Res. Int. 2017, 88, 1–10. [Google Scholar] [CrossRef]
  2. Son, S.B.; Lee, Y.K.; Kang, S.H.; Chung, H.S.; Cho, J.S.; Moon, J.T.; Oh, K.H. A numerical approach on the inclusion effects in ultrafine gold wire drawing process. Eng. Fail. Anal. 2011, 18, 1272–1278. [Google Scholar] [CrossRef]
  3. Kustra, P.; Milenin, A.; Byrska-Wójcik, D.; Grydin, O.; Schaper, M. The process of ultra-fine wire drawing for magnesium alloy with the guaranteed restoration of ductility between passes. J. Mater. Process. Technol. 2017, 247, 234–242. [Google Scholar] [CrossRef]
  4. Schade, P. Wire drawing failures and tungsten fracture phenomena. Int. J. Refract. Met. Hard Mater. 2006, 24, 332–337. [Google Scholar] [CrossRef]
  5. Lee, S.-K.; Lee, I.-K.; Lee, S.-Y.; Hwang, S.-K. Fabrication of 50.0 µm Ultra-Fine Pure Rhodium Wire, Using a Multi-Pass Wire Drawing Process, for Probe Card Pins. Materials 2019, 12, 2194. [Google Scholar] [CrossRef]
  6. Martinez, G.A.S.; Qian, W.-L.; Kabayama, L.K.; Prisco, U. Effect of Process Parameters in Copper—Wire Drawing. Metals 2020, 10, 105. [Google Scholar] [CrossRef]
  7. Pops, H. The Metallurgy of Copper Wire. Copper Development Association Inc. 1997. Available online: https://www.copper.org/publications/newsletters/innovations/1997/12/wiremetallurgy.html (accessed on 9 December 2020).
  8. Vega, G.; Haddi, A.; Imad, A. Investigation of process parameters effect on the copper-wire drawing. Mater. Des. 2009, 18, 3308–3312. [Google Scholar] [CrossRef]
  9. Kabayama, L.K.; Taguchi, S.P.; Martinez, G.A.S. The Influence of Die Geometry on Stress Distribution by Experimental and FEM Simulation on Electrolytic Copper Wiredrawing. Mater. Res. 2009, 12, 281–285. [Google Scholar] [CrossRef]
  10. Adamczyk, J.; Suliga, M.; Pilarczyk, J.; Burdek, M. The Influence of Die Approach and Bearing Part of Die on Mechanical-Technological Properties of High Carbon Steel Wires. Arch. Metall. Mater. 2012, 57, 12–14. [Google Scholar] [CrossRef]
  11. Rubio, E.M.; Camacho, A.M.; Sevilla, L.; Sebastián, M.A.; Sevilla, L. Calculation of the forward tension in drawing processes. J. Mater. Process. Technol. 2005, 162, 551–557. [Google Scholar] [CrossRef]
  12. Rubio, E.M. Analytical methods application to the study of tube drawing processes with fixed conical inner plug: Slab and Upper Bound Methods. J. Achiev. Mater. Manuf. Eng. 2006, 14, 119–130. [Google Scholar]
  13. Rodriguez-Alabanda, O.; Romero, P.E.; Guerrero-Vaca, G.; Sevilla, L. Software implementation of a new analytical methodology applied to the multi-stage wire drawing process: The case study of the copper wire manufacturing line optimization. Int. J. Adv. Manuf. Technol. 2018, 96, 2077–2089. [Google Scholar] [CrossRef]
  14. Hassan, A.K.F.; Hashim, A.S. Three Dimensional Finite Element Analysis of Wire Drawing Process. Univers. J. Mech. Eng. 2015, 3, 71–82. [Google Scholar] [CrossRef]
  15. Rodriguez-Alabanda, O. PullWorks Software Application for the Analytical Study and Optimization of the Wiredrawing Process. Available online: https://youtu.be/jawQDkiYvek (accessed on 9 December 2020).
  16. Avitzur, B. Analysis of Wire Drawing and Extrusion through Conical Dies of Large Cone Angle. J. Eng. Ind. 1964, 86, 305. [Google Scholar] [CrossRef]
  17. Avitzur, B. Handbook of Metal Forming; John Wiley & Sons Inc.: New York, NY, USA, 1983. [Google Scholar]
  18. Bitkov, V.V. Minimization of breaks during drawing thin wire of nonferrous metals. Russ. J. Non-Ferrous Met. 2010, 51, 134–139. [Google Scholar] [CrossRef]
  19. Evans, W.; Avitzur, B. Measurement of Friction in Drawing, Extrusion, and Rolling. J. Lubr. Technol. 1968, 90, 72–80. [Google Scholar] [CrossRef]
  20. Kovács, S.; Mertinger, V. Examination of Complex Optimization Objective Functions of Parameters of Multi- Step Wire Drawing Technology. Acta Polytecnica Hung. 2013, 10, 27–44. [Google Scholar]
  21. Narayanan, K.R.; Sridhar, I.; Subbiah, S. Effect of cold work on the mechanical response of drawn ultra-fine gold wire. Comput. Mater. Sci. 2010, 49 (Suppl. S1), S119–S125. [Google Scholar] [CrossRef]
  22. Naga Teja, C.S.; Murty N, G.; Reddy Teja, P.S. Finite Element Analysis of Wire Drawing Process with different die contours. Int. J. Sci. Eng. Adv. Technol. 2016, 4, 134–143. [Google Scholar]
  23. Sas-Boca, I.M.; Tintelecan, M.; Pop, M.; Iluţiu-Varvara, D.-A.; Mihu, A.M. The Wire Drawing Process Simulation and the Optimization of Geometry Dies. Procedia Eng. 2017, 181, 187–192. [Google Scholar] [CrossRef]
  24. Zottis, J.; Diehl, C.A.T.S.; Rocha, A.D.S. Evaluation of experimentally observed asymmetric distributions of hardness, strain and residual stress in cold drawn bars by FEM-simulation. J. Mater. Res. Technol. 2018, 7, 469–478. [Google Scholar] [CrossRef]
  25. Esteves Group Hileras de Diamante Policristalino PCD. Available online: http://www.estevesgroup.com/es/products/wire-drawing-dies/polycrystalline-dies (accessed on 9 December 2020).
  26. Rodriguez-Alabanda, O. PullWorks Software. Available online: http://www.uco.es/grupos/prinia/oscar-rodriguez-alabanda (accessed on 9 December 2020).
  27. Wright, R.N. Mechanical analysis and die design. Wire J. Int. 1979, 12, 60–61. [Google Scholar]
  28. Fluhrer, J. Deform2D Version 8.1 User´s Manual; Scientific Forming Technologies Corp.: Columbus, OH, USA, 2004. [Google Scholar]
  29. Cheng, H.S. Lubrication Regimes, ASM Handbook Vol.18, Friction, Lubrication, and Wear Technology; ASM International: West Conshohocken, PA, USA, 1992. [Google Scholar]
  30. Martinez Santana, G.A.; Ferro dos Santos, E.; Kabayama, L.K.; Siqueira Guidi, E.; de Azebedo Silva, F. Influences of Different Die Bearing Geometries on the. Metals 2019, 9, 1089. [Google Scholar] [CrossRef]
Figure 1. Representative applications of fine pure copper wire.
Proceedings 63 00012 g001
Figure 2. (a) The slab method in the drawing process: from free body equilibrium to Equation (1) to calculate the drawing stress; (b) the graphic of the finite element method (FEM) model used in the simulations.
Proceedings 63 00012 g002
Figure 3. Multilinear strain hardening rule obtained from the tensile tests.
Proceedings 63 00012 g003
Figure 4. Experimental setup for the indirect determination of the friction coefficient μ.
Proceedings 63 00012 g004
Figure 5. The polynomial fitted values of the minimum drawing force Fd and lower coefficient of friction μ as a function of different values of drawing speed (v) used in the experiments, for a die with 2α = 14° and Lc = 50%∙df lubricated with 100% mineral oil.
Proceedings 63 00012 g005
Figure 6. The evolution of the value of drawing stress σd (analytical vs. FEM).
Proceedings 63 00012 g006
Figure 7. Tracking points and tracked displacement representation for the analysis distribution and evolution of the axial and radial stress when the wire goes through the die.
Proceedings 63 00012 g007
Figure 8. From FEM simulations: (a) axial and (b) radial stress (step 1); (blue) center, (red) surface.
Proceedings 63 00012 g008
Figure 9. From FEM simulations: (a) axial and (b) radial stress (step 2); (blue) center, (red) surface.
Proceedings 63 00012 g009
Figure 10. From FEM simulations: (a) axial and (b) radial stress (step 3); (blue) center, (red) surface.
Proceedings 63 00012 g010
Figure 11. From FEM simulations: (a) axial and (b) radial stress (step 4); (blue) center, (red) surface.
Proceedings 63 00012 g011
Figure 12. From FEM simulations: (a) axial and (b) radial stress (step 5); (blue) center, (red) surface.
Proceedings 63 00012 g012
Figure 13. From FEM simulations: (a) axial and (b) radial stress (step 6); (blue) center, (red) surface.
Proceedings 63 00012 g013
Figure 14. From FEM simulations: (a) axial and (b) radial stress (step 7); (blue) center, (red) surface.
Proceedings 63 00012 g014
Table 1. Multi-step fine wiredrawing pass schedule designed by PullWorks.
Step Nr.Input, d0(i)
[mm]
Output, df(i)
[mm]
Reduction Ratio, rUnit Strain, εShape Factor, ΔContinuous Annealing
10.500.390.400.501YES
20.390.310.400.461YES
30.310.240.400.511YES
40.240.190.400.471YES
50.190.150.400.471YES
60.150.120.400.451YES
70.120.100.310.361.34YES
Table 2. Drawing forces and drawing stresses obtained by the analytical (PullWorks/slab method) and numerical (FEM) software solutions in the multi-step fine wiredrawing sequence.
Step Nr.Drawing Force, Fd (PullWorks)
[N]
Drawing Force, Fd (FEM)
[N]
Drawing Stress, σd (PullWorks)
[MPa]
Drawing Stress, σd (FEM)
[MPa]
145.953.2384.5445.3
22730.1357.2398.8
317.919.4394.4428.8
410.310.7363377.4
56.57.3366.9413.1
63.94.5348.7397.9
72.52.6321331
Publisher’s Note: MDPI stays neutral with regard to jurisdictional claims in published maps and institutional affiliations.