Abstract
We evaluate alternatives for the management of water for agriculture under climate change in six representative basins of Southern Europe: Duero-Douro, Ebro, Guadalquivir, Po, Maritsa-Evros, and Struma. Management objective is the maximization of water availability, understood as the maximum demand that can be satisfied with a given reliability. We focus on water availability for agriculture. For the sake of simplicity, we assume only two types of demands: urban and irrigation. Water is first allocated to urban demands following an established priority; the remaining resources are allocated to agriculture. If water availability does not satisfy all irrigation demands, management measures are applied with the goal of achieving a balance between resources and demands. We present an analysis of three possible management measures to face water scarcity in a long-term scenario: increasing reservoir storage, improving efficiency of urban water use and modifying water allocation to environmental flows. These management measures are globally evaluated for the selected basins in three representative climate scenarios, comparing their possible range and effectiveness. Although such measures can significantly increase water availability and counterbalance a portion of water scarcity due to climate change in some basins like Ebro or Struma, in other basins, such as Guadalquivir, water availability cannot be enhanced with management measures and irrigation water use must be reduced.
Keywords:
water management; water availability; climate change; Southern Europe; agriculture; WAAPA model PACS:
J0101
1. Introduction
We present an analysis of alternatives for water management for irrigation under climate change in six representative basins of Southern Europe: Duero-Douro, Ebro, Guadalquivir, Po, Maritsa-Evros, and Struma (Figure 1). Our analysis illustrates the complexities of water allocation for irrigation and other uses in areas of water scarcity; it also provides guidance to decision makers on adaptation choices from a quantitative perspective.
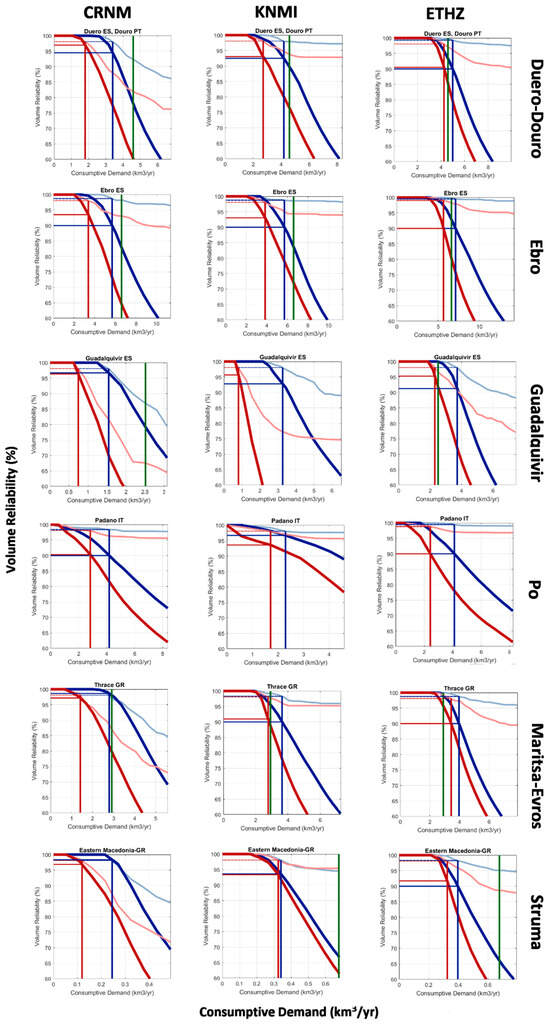
Figure 1.
Demand-performance analysis in the basins under study.
Our analysis focuses on water availability for agriculture, in particular, water management options to compensate for agricultural water scarcity as a result of climate change. Water availability is the maximum demand that can be supplied at a specific point of a river network and satisfies pre-specified reliability conditions. We estimate water availability for agriculture in each basin for a control scenario and under a climate projection. We use a simplified model of the water resources system of the basin, accounting for streamflow, reservoir storage, and environmental flows. We consider two types of demands: urban supply and irrigation. We assume that urban demand has priority over irrigation. Water is allocated to urban demands first and the remaining resources are allocated to irrigation; however, both demands must satisfy their specific reliability requirements.
In our model, we consider that water scarcity arises if water availability in the climate scenario is less than water availability in the control scenario. If water scarcity is projected for a certain basin, management measures should be applied until a balance is reached between resources and demands. The obvious measure is to reduce water allocation for agriculture. We explore the possibility of other additional measures that might mitigate the need to reduce water allocation for irrigation. We focus on three kinds of measures: increasing reservoir storage, changing the allocation to environmental flows, and improving the efficiency of urban water use. We evaluate the effect of these correlative measures on the need to reduce water allocation for irrigation. We compare the effect of these measures in the six basins under analysis according to the climate scenarios projected by three different models.
2. Results
2.1. Water Availability for Irrigation
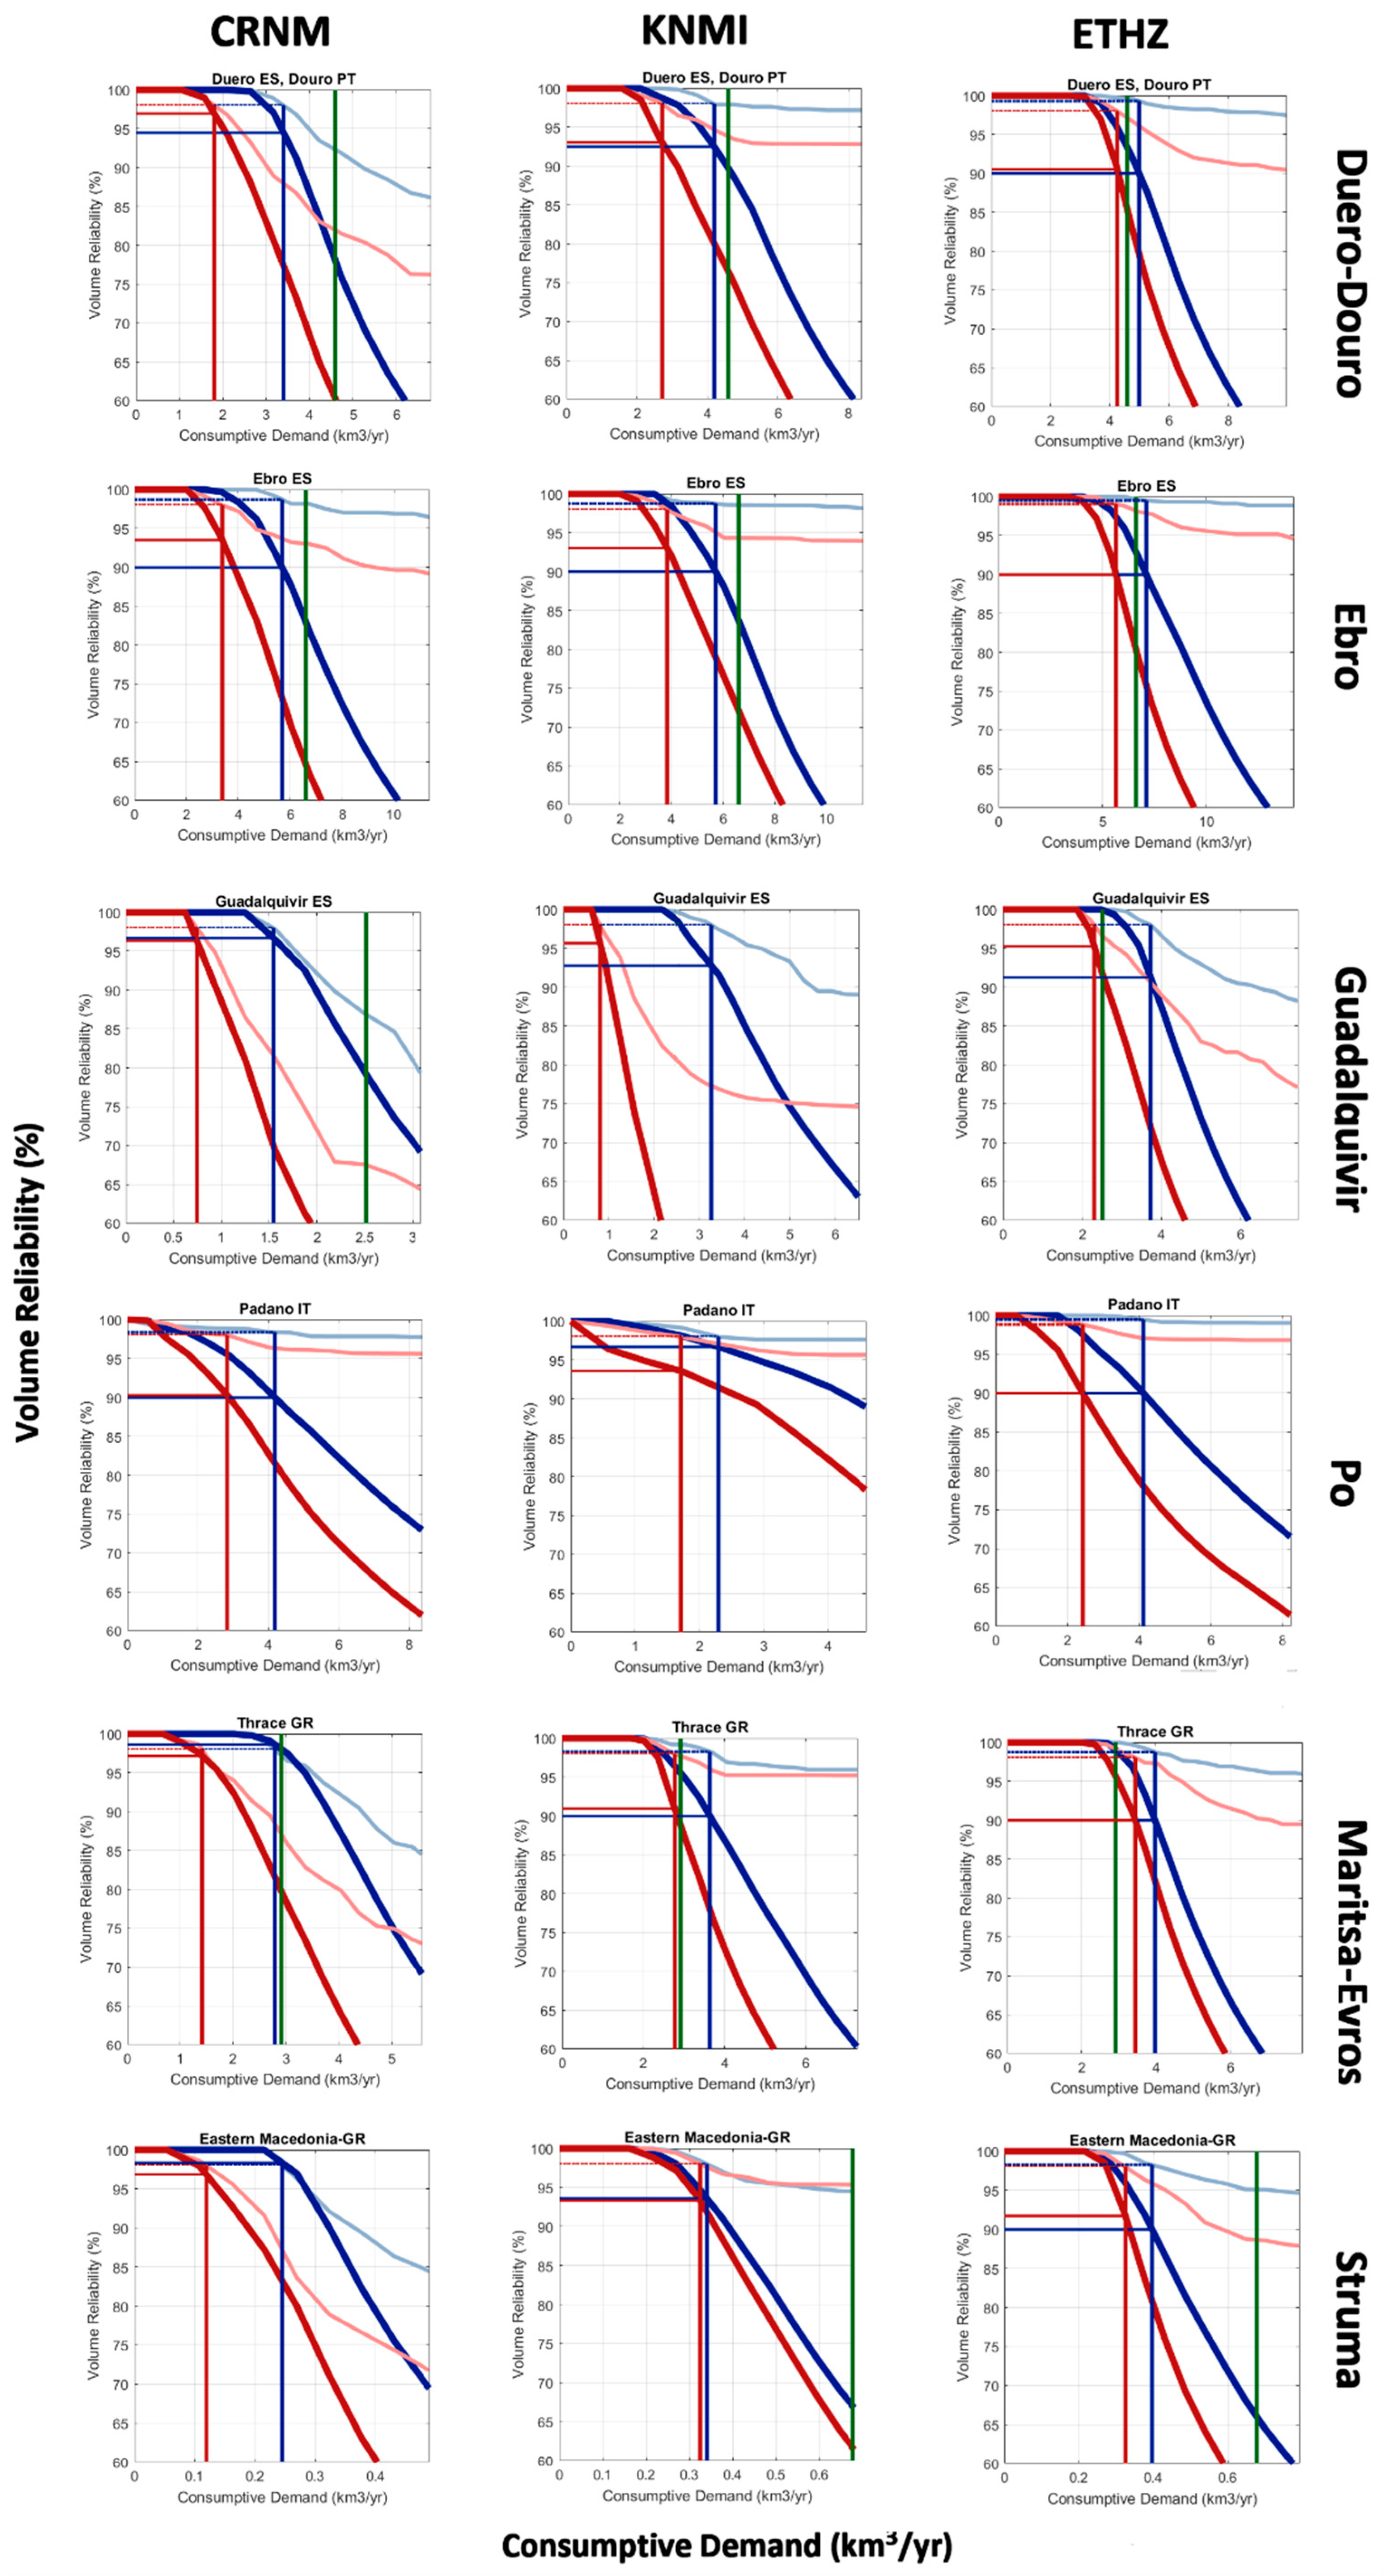
We first present the results of our analysis of water scarcity for irrigation in the six basins under study, which are shown in Figure 1. We present results for the models Centre National de Recherches Météorologiques (CRNM, top), Koninklijk Meteorologisch Instituut (KNMI, center), and Eidgenössische Technische Hochschule Zurich (ETHZ, bottom). Blue lines correspond to the period 1960–1990, and red lines correspond to the long-term time horizon, 2070–2100, under emission scenario A1B. Lighter colors correspond to urban demand, and darker colors to irrigation demand. Water availability in each scenario is represented by a vertical line of the corresponding color.
2.2. Analysis of Policy Meaures
Next, we present an analysis of the effects of different policies on irrigation water availability in the six basins. The correlative policy measures analyzed in this study are the following: (1) increase in reservoir storage, (2) modification of environmental flow requirements, and (3) increase in the efficiency of urban supply.
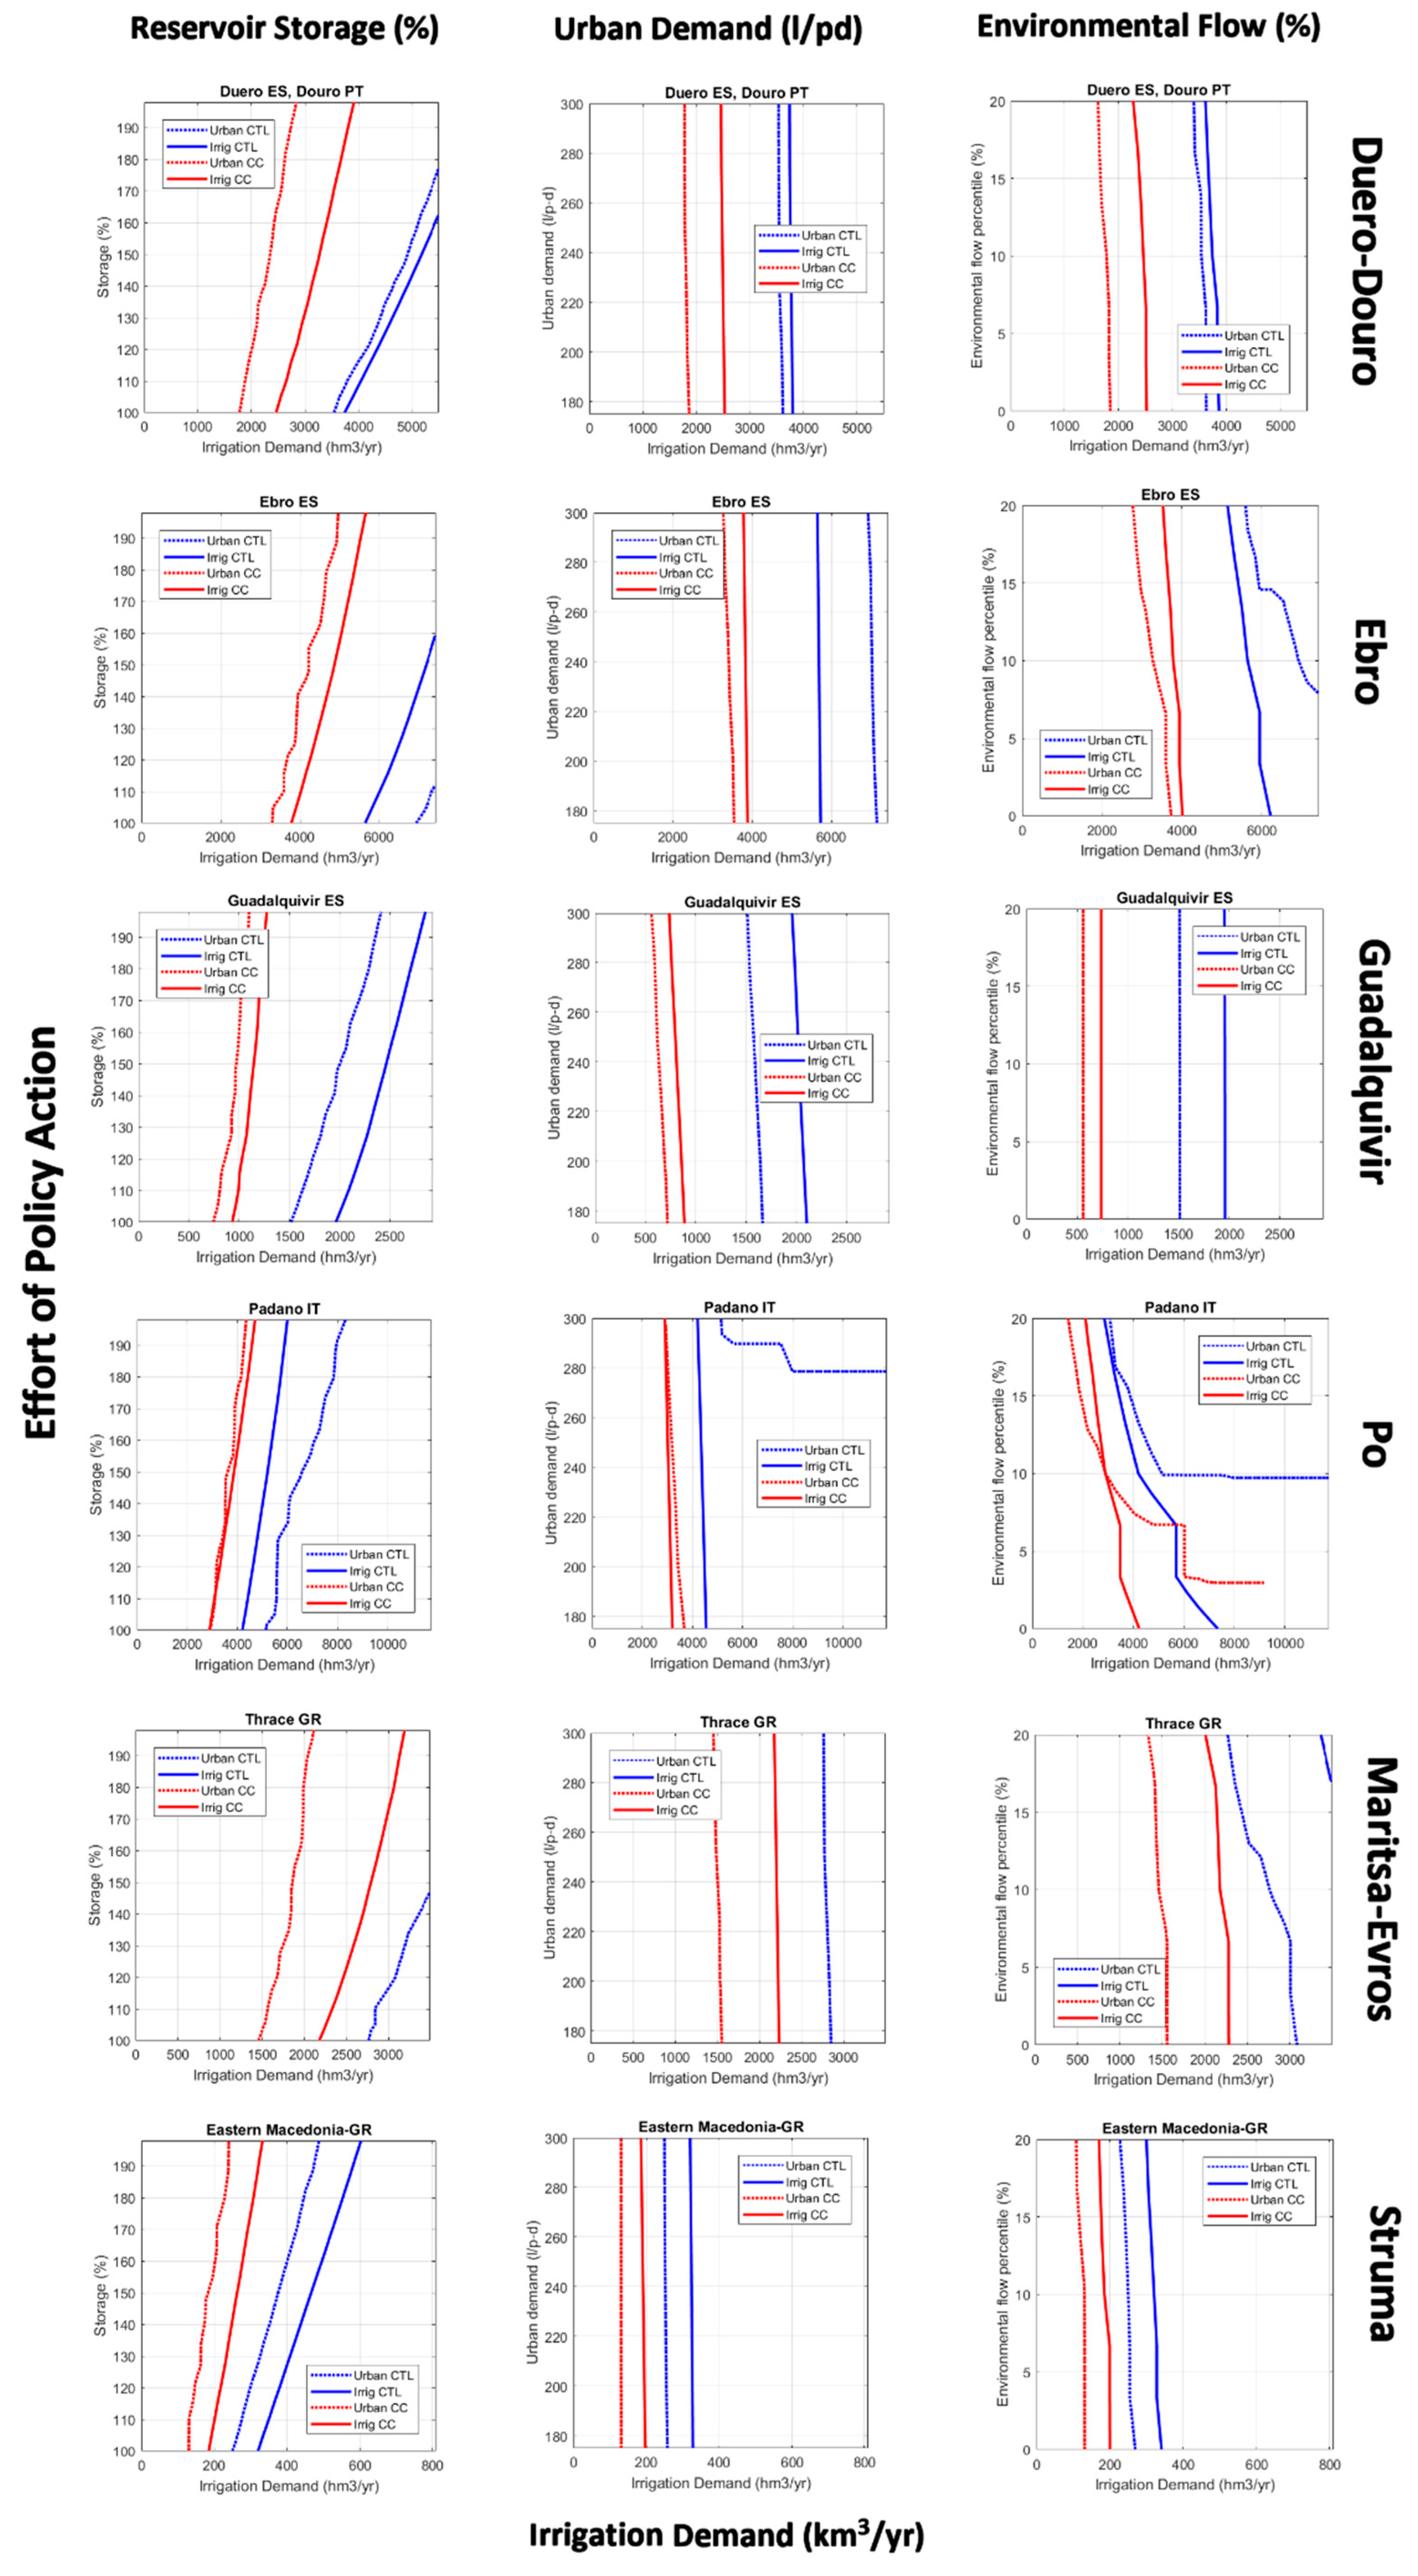
The results for the climate model CRNM are presented in Figure 2. The figure shows water availability for irrigation for the limiting reliability of urban supply (dashed lines) and irrigation (solid lines) as a function of the corresponding variables: percentage of reservoir storage in the basin (top), percentile of the monthly distribution for environmental flows (center), and per capita consumption for urban demand (bottom). Blue lines correspond to the period 1960–1990, and red lines correspond to the long-term time horizon, 2070–2100, under emission scenario A1B for climate model CRNM.
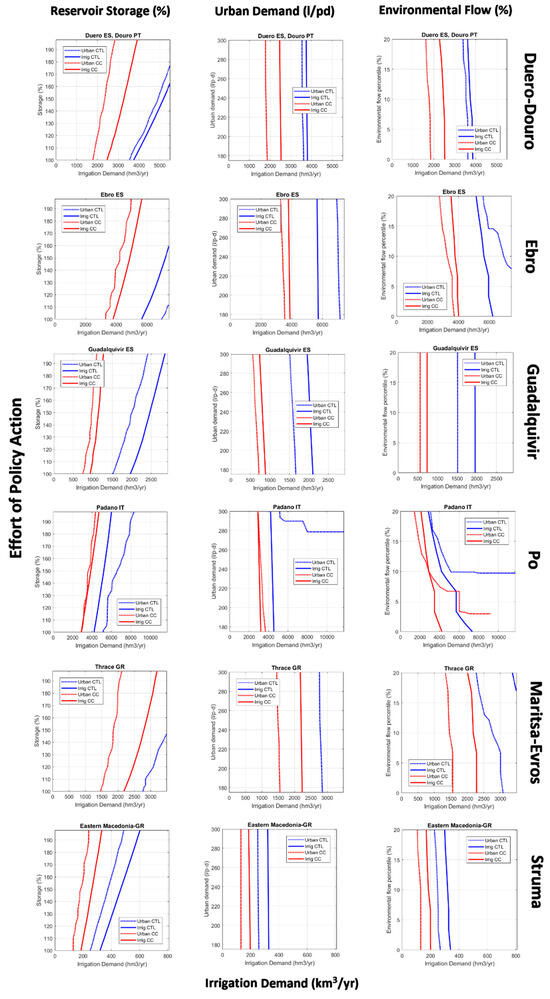
Figure 2.
Water availability for irrigation as a function of the three policy efforts.
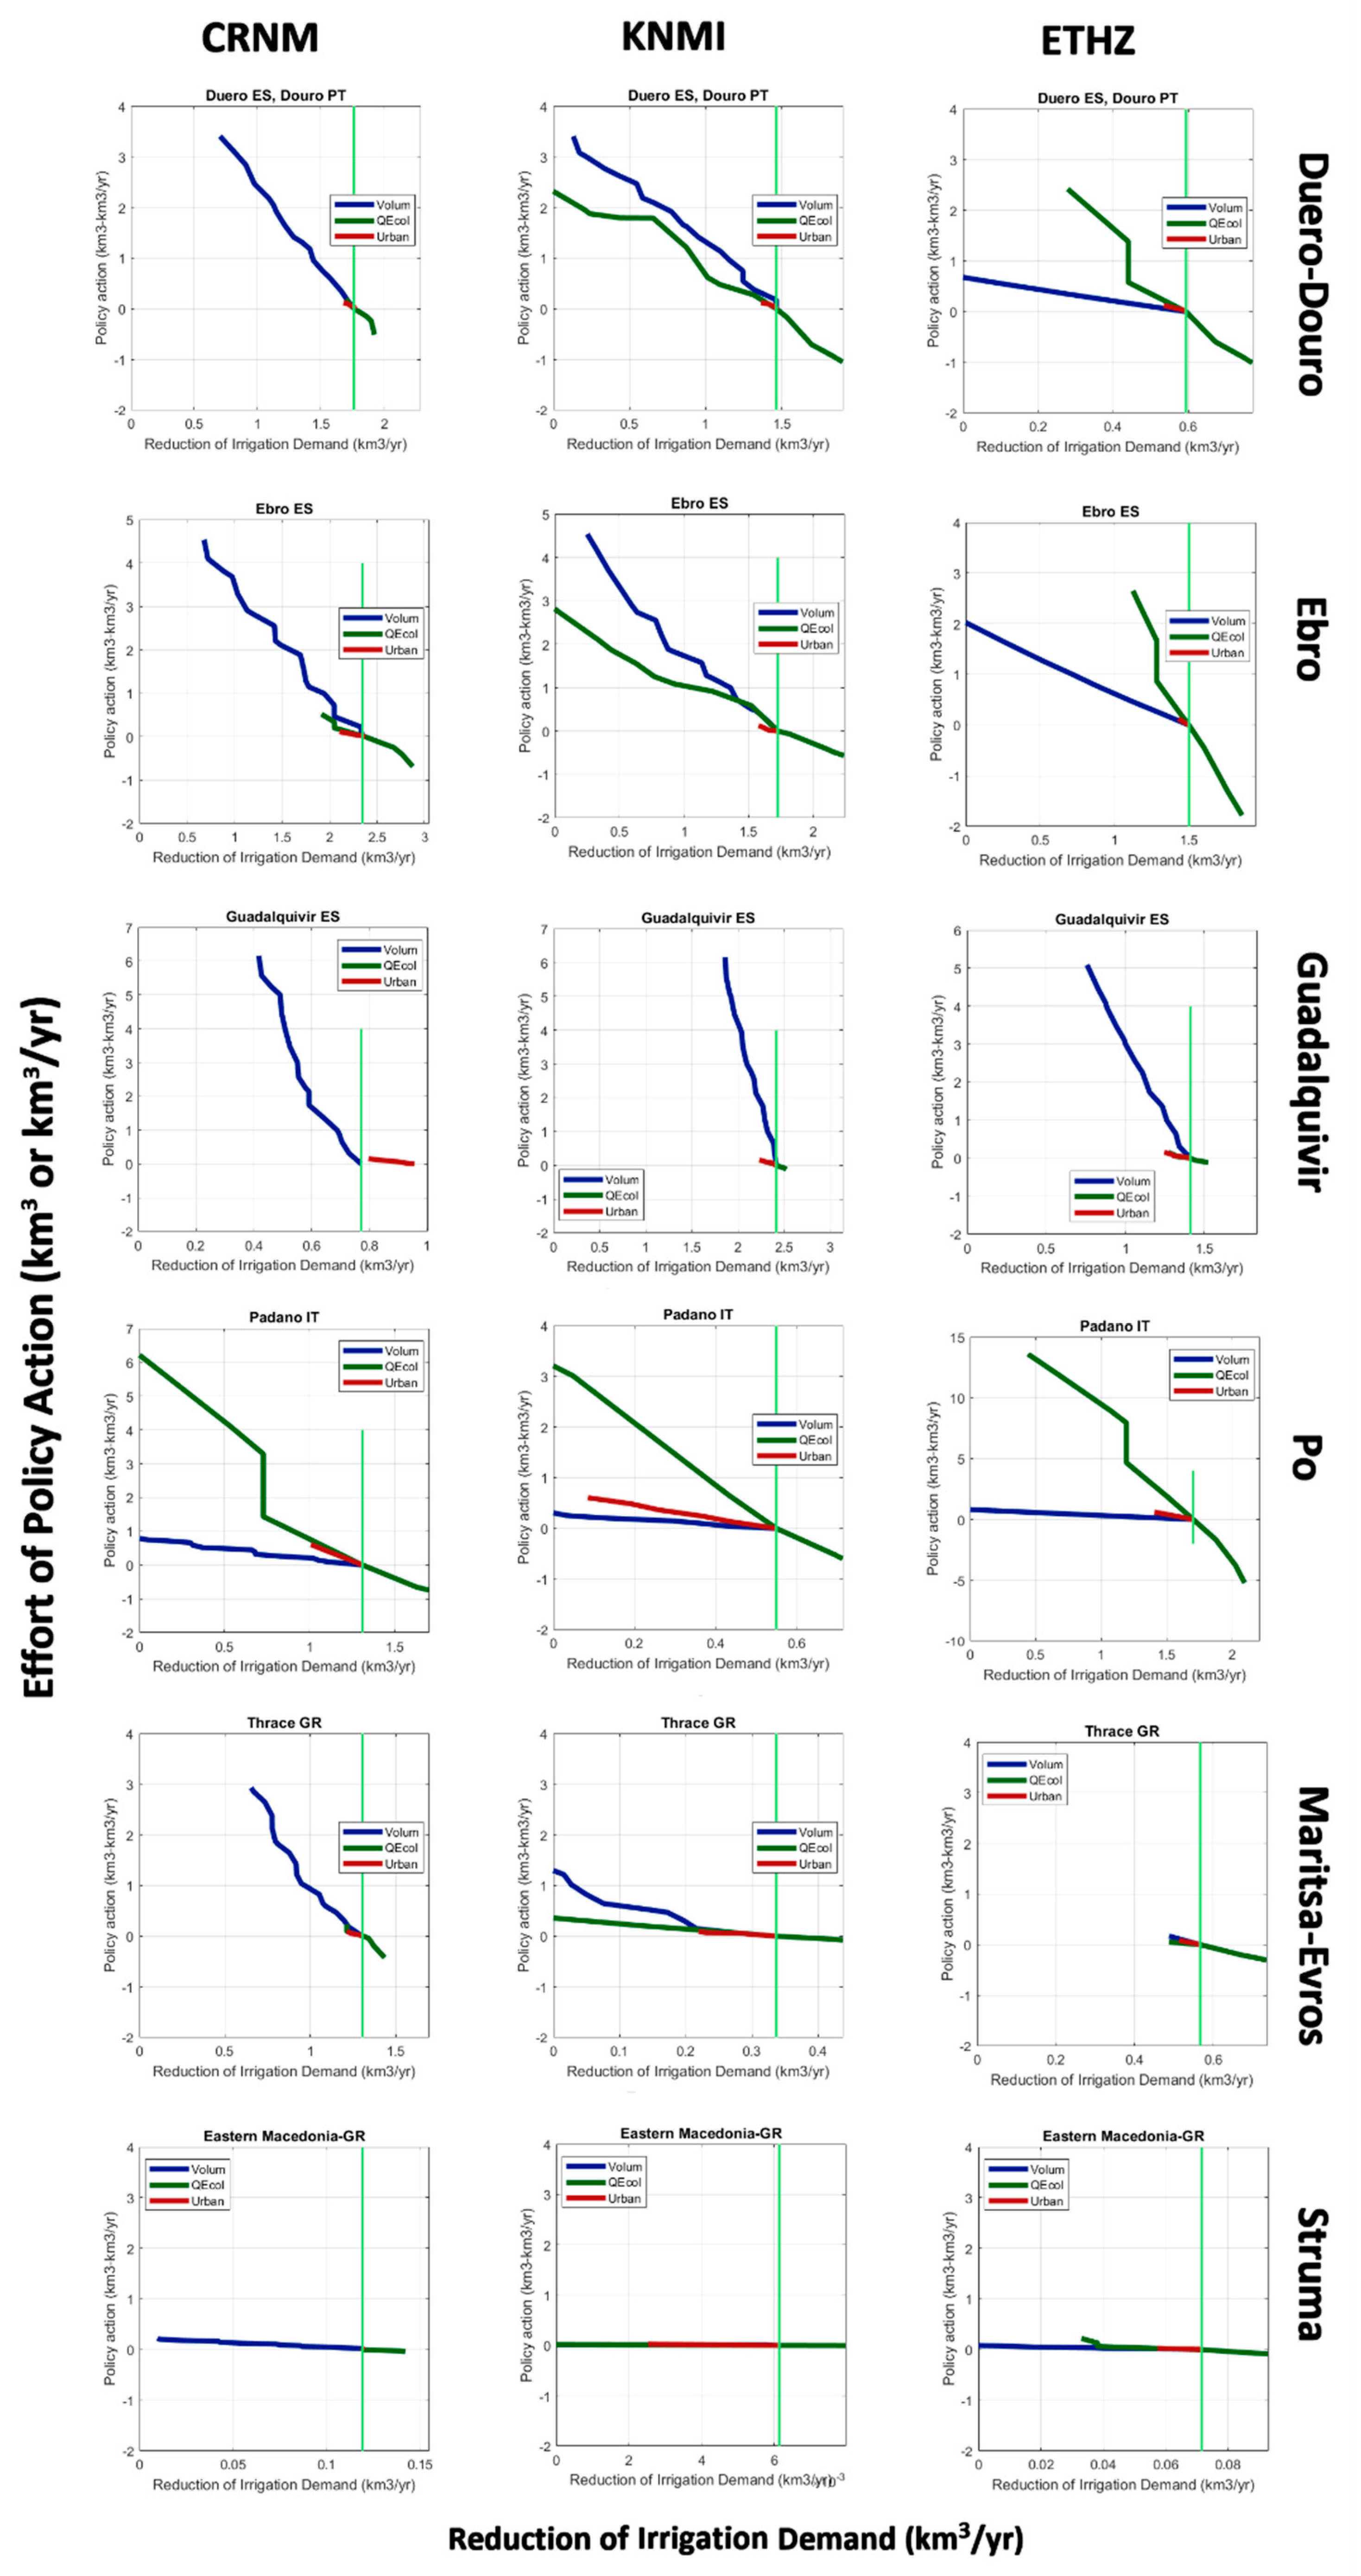
The comparative effect of the three policies analyzed is presented in Figure 3, which shows the range and effectiveness of the three measures in the same units for the six basins. The figure shows the required reduction of irrigation demand in hm3/yr as a function of the correlative policy adopted. The effort of policy action represents the storage increment in hm3 (blue line), the reduction or increment of water allocation to environmental flows in hm3/yr (green line), and the reduction of urban water consumption in hm3/yr (red line). Results are shown for the CRNM (top), KNMI (center), and ETHZ (bottom) models in the long-term time horizon, 2070–2100, under emission scenario A1B.
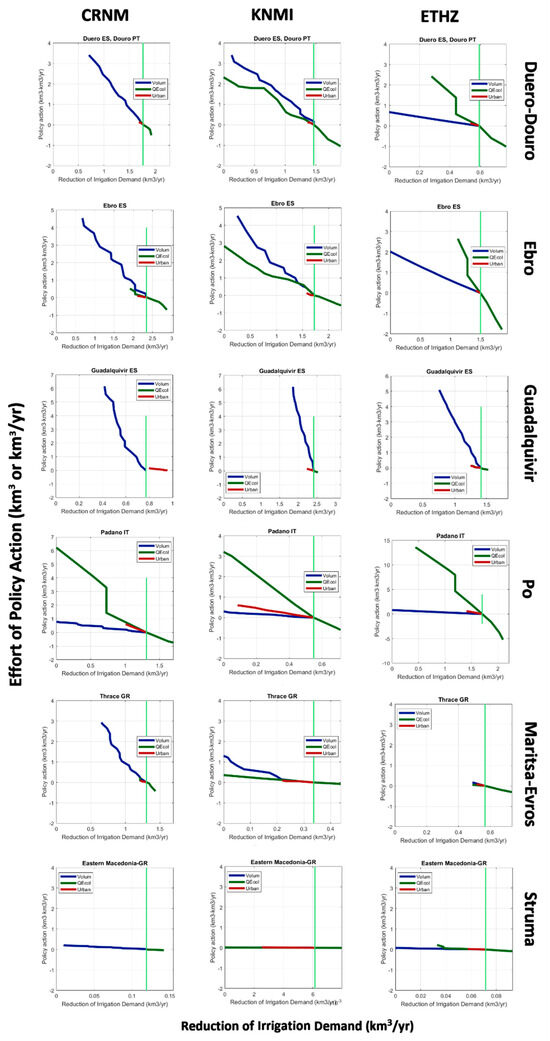
Figure 3.
Comparative effectiveness of the three policies analyzed.
3. Discussion
The analysis of water availability showed significant reductions of water availability in the climate scenario in comparison with the current scenario. These reductions were consistent across the six basins for all three models analyzed. According to our analysis, the effect of increased irrigation demand on the reliability of urban demand was apparent in all cases. Water availability for irrigation in current conditions was limited by the reliability of supply to urban demands in Duero-Douro, Guadalquivir, Po, and Struma basins. The limiting condition was the reliability of irrigation demand only in the cases of Ebro and Maritsa-Evros. In the future scenarios, the limiting factor was the reliability of urban demands in all cases, suggesting that irrigation will have to face strong competition for scarce resources in the future.
The green vertical line in Figure 1 corresponds to the estimated water withdrawal for irrigation, inferred from the irrigated area in each basin. The figures obtained for water availability in current conditions compared well with the estimates of water withdrawals for irrigation in each basin. In most basins, these figures were moderately smaller than the estimated agricultural demand; however, we need to account for return flows and water reuse. The distance between water availability in current and future conditions was an indicator of the intense impact of climate change on water resources in each basin. Although the effect was relatively small in Struma, in the Guadalquivir basin, this effect was dramatic. For example, we obtained a reduction from 3200 hm3/yr for current conditions to 850 hm3/yr for the climate change projection for the KNMI model.
With the strong reduction of water availability obtained in the analysis for most basins, the obvious adaptation measure is to reduce irrigation demand. The estimated required reduction would be the difference between water availability in the control and future scenario to restore the same level of performance that was observed in the control scenario. However, demand reduction is not the only policy alternative to reach the objective of adequate supply reliability. Other measures that increase water supply or improve water use efficiency in other sectors can be applied in combination with irrigation demand management. The effects of these policy actions are shown in Figure 2. Not all basins responded to the policy actions in the same way. For instance, the basins most sensitive to reservoir storage were Duero, Ebro, and Maritsa-Evros. In these basins, increasing reservoir storage increased water availability for irrigation more significantly than in the other three basins. The policy action that showed the least sensitivity was an increase in the efficiency of urban demand because urban demand is small when compared with irrigation demand in all basins. Water allocation to environmental flows did not show strong sensitivity for the model shown in Figure 2 (CRNM); however, as can be seen in Figure 3, this was not the case for the two other models.
We now focus on the comparative effect of the three correlative policies studied. In the Duero-Douro and Maritsa-Evros basins, the effectiveness of the three policies was very similar, indicated by the almost superimposed three lines for the CRNM and KNMI models. However, the range was very different. The range of urban use efficiency was very small in comparison with the amount of irrigation demand that must be reduced. The range of storage increment was also limited, particularly if we account for the doubled storage in our analysis. The Ebro and Po basins have behaviors similar to those of the Duero-Douro and Maritsa-Evros basins, with larger scopes for action in storage; however, the larger slope indicates they have less effectiveness. The Guadalquivir basin is significantly different because both the small scope for action and the high slope of the lines imply that the only possible adaptation measure, according to this study, is the reduction of the irrigation demand. Other Spanish basins, like Júcar or Guadiana, show similar behaviors, suggesting that reduction of irrigation demand is unavoidable in these regions if climate change projections are confirmed.
4. Materials and Methods
The methodology of analysis is based on a computation model to estimate water availability provided by a set of reservoirs in a water resources system under different hypotheses. The model, named WAAPA (Water Availability and Adaptation Policy Analysis), is based on a basic module to simulate the behavior of a set of reservoirs that supply water for set prioritized demands, complying with specified ecological flows and accounting for evaporation losses [1].
WAAPA is a model that simulates reservoir operation in a water resources system. Basic components of WAAPA include reservoirs, inflows, and demands. These components are linked to the nodes of river networks. WAAPA allows for the simulation of reservoir operations as well as the computation of supply to demands within both individual reservoirs and from a system of reservoirs, accounting for ecological flows and evaporation losses. From a time series of supply volumes, supply reliability can be computed according to different criteria. Other quantities may be computed using macros that repeat the simulation procedure, i.e., the demand-reliability curve, the maximum allowable demand corresponding to a given storage or the required storage volume to meet a given demand according to different reliability criteria.
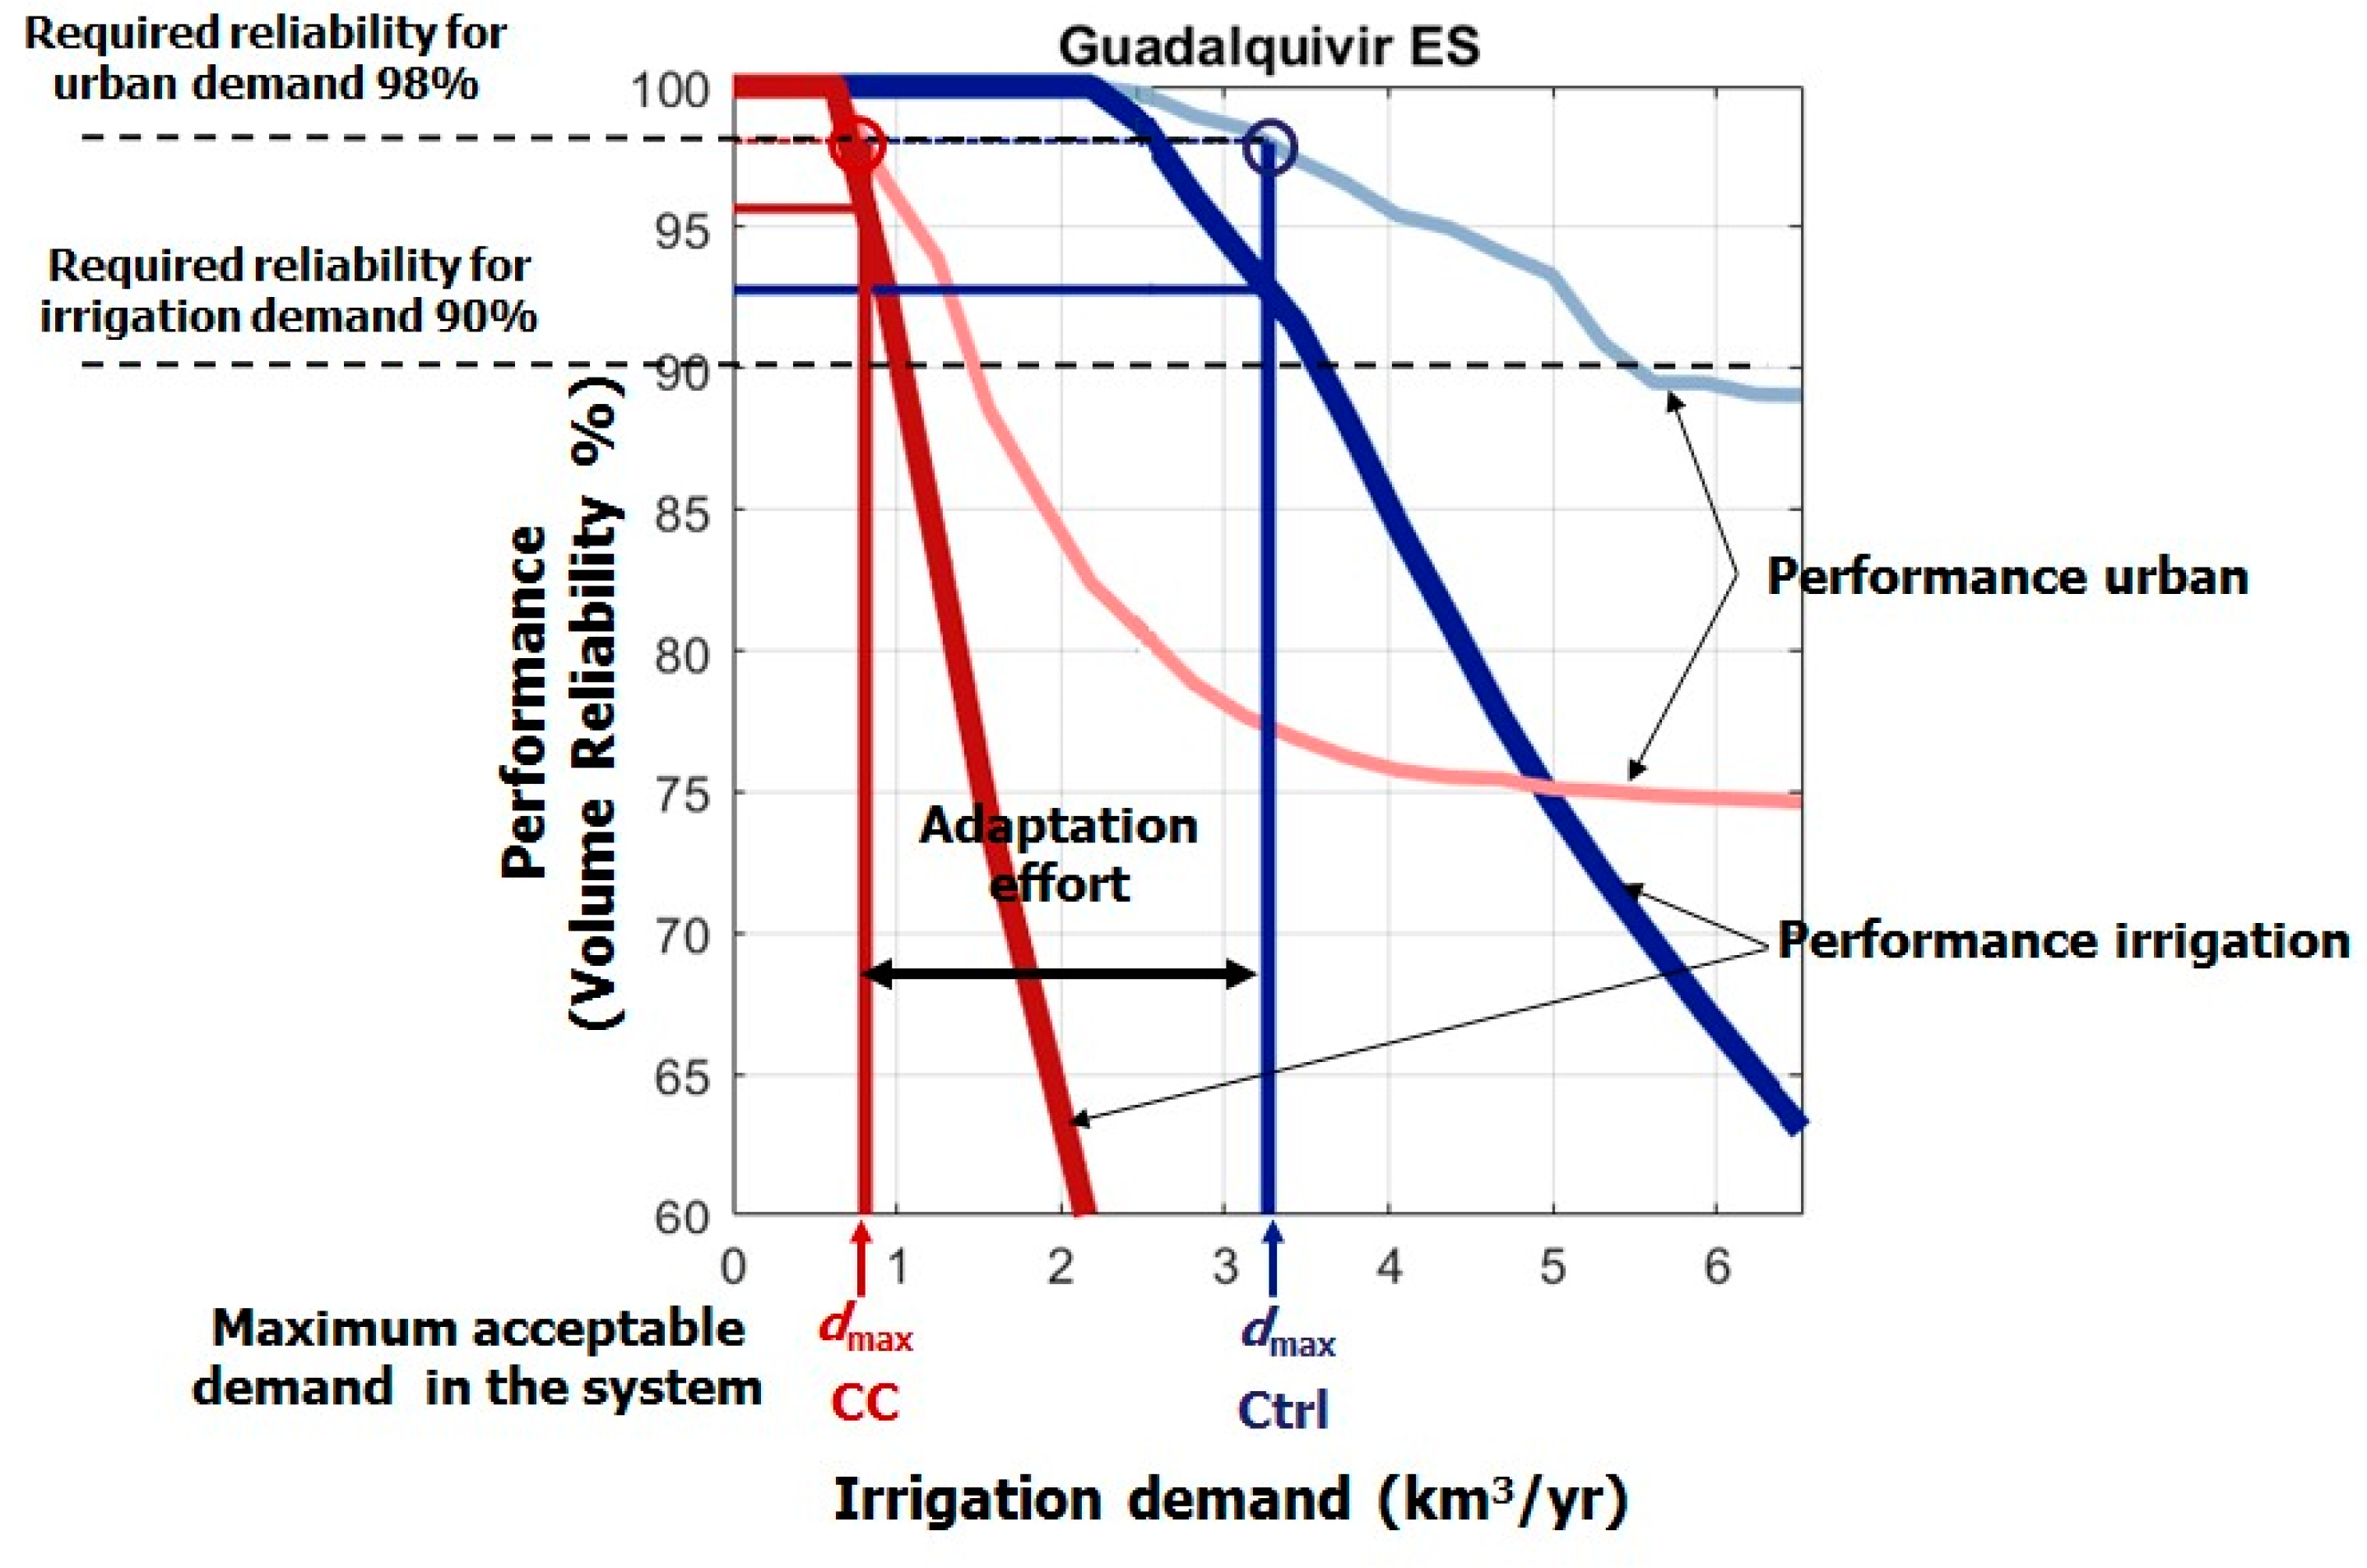
The simplified water resources system models of the basins were based on the Hydro1k topographic dataset [2] and on the ICOLD World Register of Dams [3]. We divided each basin in the subbbasins included in the Hydro1k dataset in addition to the basins corresponding to all dams in the basins with storage capacity larger than 5 hm3. Reservoir data were obtained from the ICOLD database. Climate scenarios were obtained from runoff provided by Regional Climate Models (RCMs) in the ENSEMBLES project [4], using several transient model runs available for the period 1960–2100, produced by three RCMs under emission scenario A1B: CRNM, KNMI, and ETHZ. Three time slices were considered: historical (1960–1990), short term (2020–2050), and long term (2070–2100). Urban demands were estimated from population data and per capita water requirements. Subbasin population was obtained from the Global Rural-Urban Mapping Project (GRUMP), available at the Center for International Earth Science Information Network [5]. Irrigation demands were estimated from the Global Map of Irrigation Areas dataset [6], using an average consumption of 10,000 m3/ha/yr. We first evaluated water availability for agriculture according to two types of demand: an urban demand corresponding to the projected population in every basin with a reference allotment of 300 liters per capita a day and a variable irrigation demand. The analysis was based on a demand-reliability curve for both the urban and the irrigation demand as the irrigation demand increases, as shown in Figure 4. We adopted a minimum volume reliability of 98% for irrigation demand and 90% for irrigation demand. These minimum reliability values determine water availability, which corresponds to the minimum irrigation demand that would cause either demand to fail the required reliability criteria. A comparison of the water availability for irrigation in the control and the climate change scenario provided a proxy variable with which we could estimate exposure to climate change. If the objective of water policy is to maintain adequate reliability for both urban and irrigation demand, we can estimate the adaptation effort from the difference between water availability for irrigation in the control and in the climate change scenario. The larger the difference between current and future water availabilities for irrigation, the greater the effort required to compensate for climate change though adaptation
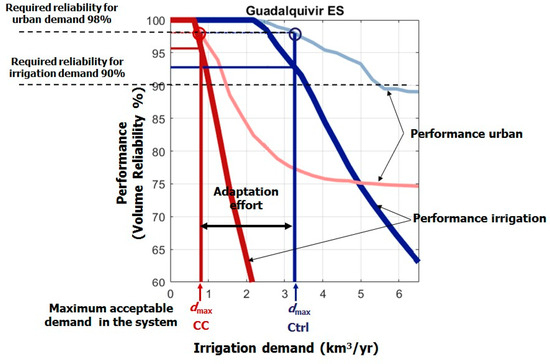
Figure 4.
Methodology for the analysis of water availability for irrigation.
The analysis of the effects of management policies is illustrated via the Guadalquivir basin. The correlative policy measures analyzed in this study are the following: (1) an increase in reservoir storage, (2) modification of environmental flow requirements, and (3) an increase in the efficiency of urban supply. Each factor was analyzed in combination with a reduction of irrigation demand by computing the reliability for the urban supply as well as the irrigation demands that result from the joint application of both measures.
The analysis for reservoir storage was performed by increasing the capacity of existing reservoirs in the basin progressively (in 15 stages), from the current value to almost 200% of current value. We also repeated the analysis of the demand reliability curve for each stage. The analysis of environmental flow modification was performed by considering ecological flows ranging from the 15% percentile of the marginal distribution of monthly flows to 5% in seven stages. The reference situation was assumed to be 10% for the control scenario; accordingly, policy might increase or decrease water availability with respect to current conditions. The analysis for urban demand efficiency was performed by considering diminishing values of the maximum allowable per capita urban demand. The starting value was 300 l/p.d and it was reduced to 175 l/p.d in 6 stages.
The four plots of Figure 5 show the results for the combined analysis of demand reduction and reservoir storage in the Guadalquivir river basin. The plots show reliability for urban supply (top) and irrigation (bottom) demands as a function of irrigation demand (horizontal axis) and reservoir storage in the basin (vertical axis) for the control scenario (left) and the climate change scenario (right). Vertical lines correspond to irrigation water availability in each scenario (blue in control and red in climate change period).
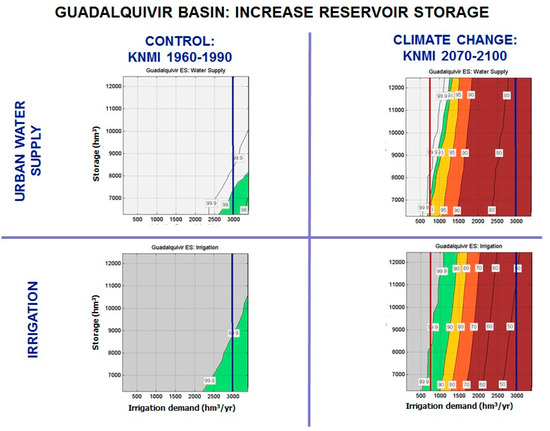
Figure 5.
Demand reliability curves for the Guadalquivir river basin as a function of reservoir storage.
The lines corresponding to acceptable reliability (separation between the green and yellow areas in Figure 5) are shown in Figure 2 to determine water availability for irrigation as a function of the three policy efforts. Accordingly, we took the most limiting case in the climate change scenario to produce Figure 3, where we represented the required reduction of irrigation demand as a function of the correlative measure.
Author Contributions
Á.S.-W. proposed the methodology and wrote the first draft of the manuscript. A.G. conducted the numerical experiments and participated in writing the paper; A.I. and L.G. participated in the analysis and discussion of results as well as writing the paper, contributing to the general idea of the research.
Acknowledgments
We acknowledge the financial support of the Universidad Politécnica de Madrid through the ADAPTA project.
Conflicts of Interest
The authors declare no conflict of interest. The founding sponsors had no role in the design of the study; in the collection, analyses, or interpretation of data; in the writing of the manuscript, and in the decision to publish the results.
References
- Garrote, L.; Iglesias, A.; Martín-Carrasco, F.; Mediero, L. WAAPA: A model for water availability and climate change adaptation policy analysis. In Proceedings of the VI EWRA International Symposium - Water Engineering and Management in a Changing Environment, Catania, Italy, 29 June–2 July 2011. [Google Scholar]
- EROS, USGS. 2008. HYDRO1k Elevation Derivative Database. Tech. rept. U.S. Geological Survey Center for Earth Resources Observation and Science (EROS). Available online: http://eros.usgs.gov/products/elevation/hydro1k.html-97 (accessed on 20 March 2018).
- ICOLD (2004). World Register of Dams. International Commission on Large Dams. Available online: https://www.icold-cigb.org/GB/world_register/database_presentation.asp (accessed on 24 April 2018).
- Hewitt, C.D.; Griggs, D.J. Ensembles-based predictions of climate changes and their impacts. Eos 2004, 85, 566. [Google Scholar] [CrossRef]
- Center for International Earth Science Information Network (CIESIN), International Food Policy Research Institute (IFPRI) and World Resources Institute (WRI). 2000. Gridded Population of the World (GPW), Version 2 [online data]. Palisades, NY: CIESIN, Columbia University. Available online: http://sedac.ciesin.columbia.edu/plue/gpw (accessed on 12 April 2018).
- Siebert, S.; Döll, P.; Hoogeveen, J.; Faures, J.-M.; Frenken, K.; Feick, S. Development and validation of the global map of irrigation areas. Hydrol. Earth Syst. Sci. 2005, 9, 535–547. [Google Scholar] [CrossRef]

© 2018 by the authors. Licensee MDPI, Basel, Switzerland. This article is an open access article distributed under the terms and conditions of the Creative Commons Attribution (CC BY) license (https://creativecommons.org/licenses/by/4.0/).