Abstract
Terahertz time-domain spectroscopy is a useful technique for determining some physical characteristics of materials, and is based on selective frequency absorption of a broad-spectrum electromagnetic pulse. In order to investigate the potential of this technology to classify cocoa percentages in chocolates, the terahertz spectra (0.5–10 THz) of five chocolate samples (50%, 60%, 70%, 80% and 90% of cocoa) were examined. The acquired data matrices were analyzed with the MATLAB 2019b application, from which the dielectric function was obtained along with the absorbance curves, and were classified by using 24 mathematical classification models, achieving differentiations of around 93% obtained by the Gaussian SVM algorithm model with a kernel scale of 0.35 and a one-against-one multiclass method. It was concluded that the combined processing and classification of images obtained from the terahertz time-domain spectroscopy and the use of machine learning algorithms can be used to successfully classify chocolates with different percentages of cocoa.
1. Introduction
The different spectroscopy techniques used in organic products have always explored ranges within the spectra—visible, ultraviolet and infrared—assessing how light-sensitive photoreceptors control many crucial biological processes [1]. The boom in studies at this frequency is due to access to instruments that are available, but some spectra of the intermediate band or terahertz region (THz) are not totally studied and defined yet [2], showing great potential for uses in products of biological origin.
The so-called non-contact and non-destructive methods, such as NIR spectroscopy [3] and multispectral/hyperspectral imaging [4], imaging in the visible range [5] and Raman spectroscopy [6] have been widely used in the food sector as they are sensitive to intra-molecular vibration [7] and are generating applications in the field of food analysis. Likewise, new applications have been identified, such as the classification by origin of various products.
Many of the methodologies that use spectroscopy, such as those mentioned above, are now being used for determining contaminants in food. However, as noted, terahertz spectroscopy (THz) has not been extensively explored in this field yet, because the ranges of this type of spectroscopy are relatively unexplored within the electromagnetic spectrum ranging from 0.1 to 10 THz, which lies between the mid-infrared and microwave ranges [8].
The composition of cocoa beans is directly influenced by genetic variability, geographical origin and processing. Therefore, chemical and biochemical characteristics and their relationship to external parameters are key characteristics for quality control and technological aspects [9]. Currently, there are studies using near-infrared spectroscopy (NIRS) in the cocoa and chocolate industry [10], showing that it can detect differences, but that there are still points for improvement, such as exploring other spectra. Terahertz spectroscopy could generate new and novel information regarding frequency ranges that are not sensitive to thermal radiation [11].
Looking for the applicability of this technology in the chocolate industry, the objective is to determine the level of differentiation of chocolate bars based on their percentage of cocoa in their composition by using THz spectroscopy and multivariate analysis.
2. Materials and Methods
2.1. Raw Material
The cocoa genotype (Theobroma cacao L.) that was used is called “Marañon Native” and comes from the area of Cajamarca, Peru. It was used to make chocolate bars with 50%, 60%, 70%, 80% and 90% of cocoa in their composition. For this process, 10 samples were used for each percentage used. The bars used had dimensions of 10 × 10 cm with 0.5 mm of depth. This gave us an image for each sample. In total, 50 images were taken, with 2048 wavelengths, which gave us an average of 600 Mb per square centimeter analyzed.
2.2. Equipment for the THz Spectroscopy
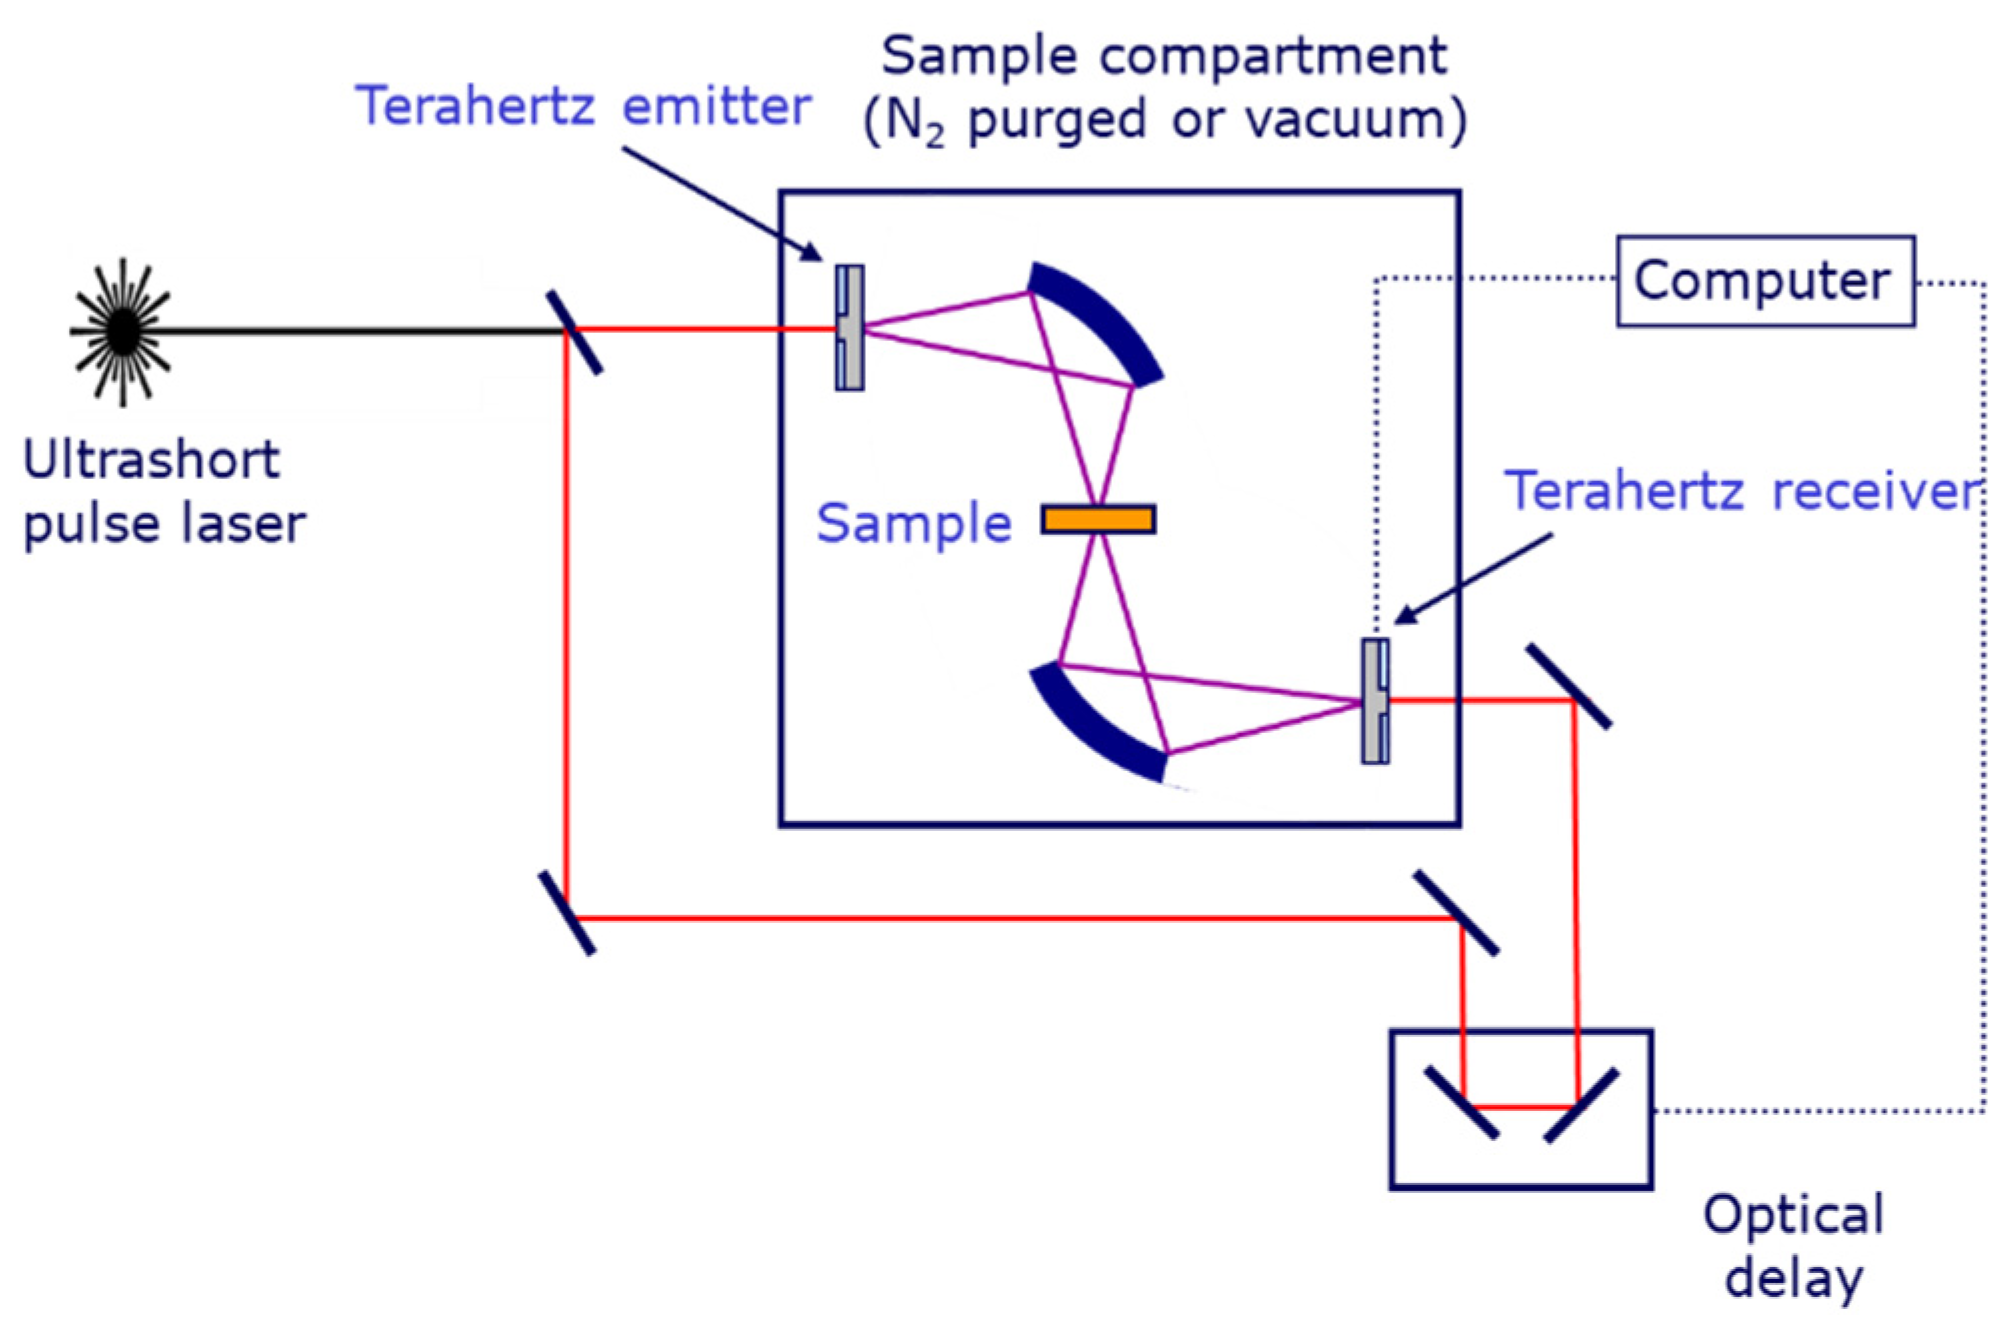
The TeraPulse 4000 (Teraview Ltd., Cambridge, UK) was used for this research, which is equipped to measure the spectrum in the range of terahertz with a bandwidth of 60 GHz up to 10 THz and a scanning range of 1200 ps. Figure 1 shows the scheme of this equipment, where the generation of an ultra-short laser pulse through a semiconductor–photoconductor emitter with laser opening is highlighted.
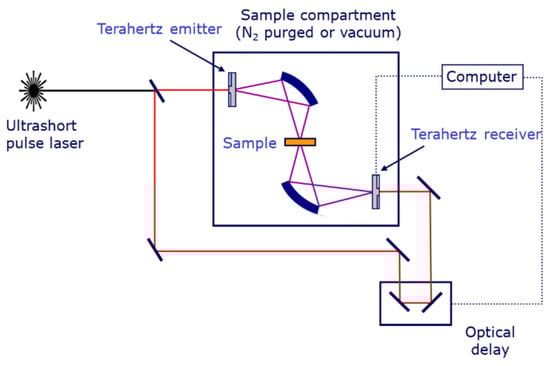
Figure 1.
Figure 1. Terahertz pulsed spectroscopy operation schematic.
2.3. Multivariate Analysis
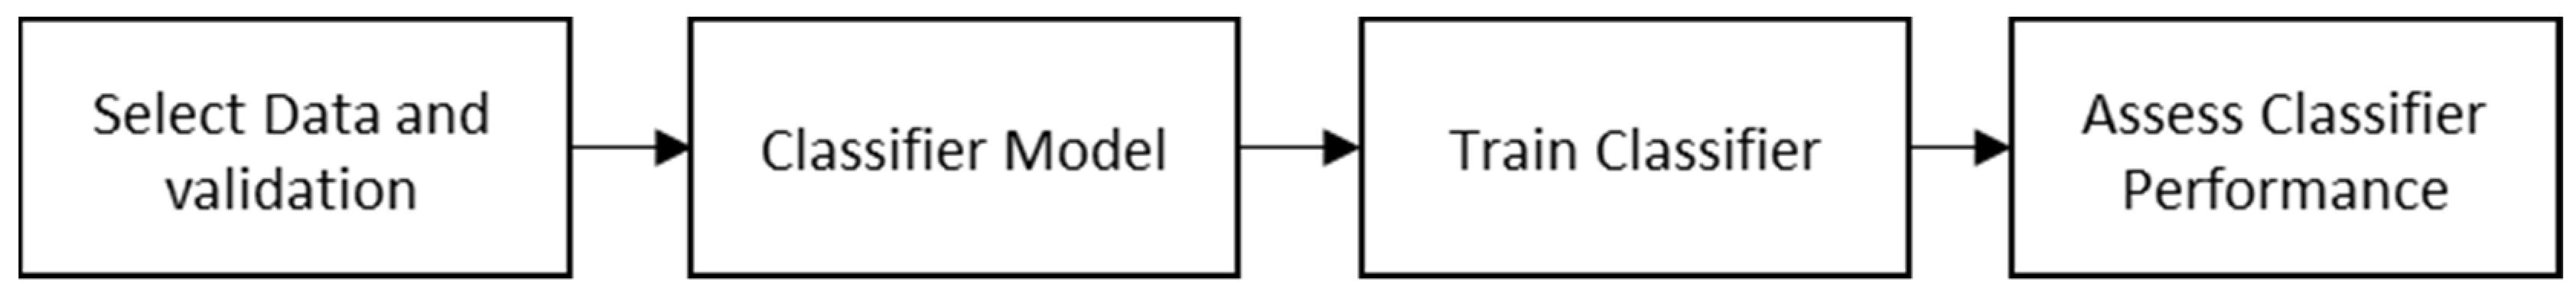
Figure 2 shows the sequence of steps followed to classify the calculated absorbance of THz pulses obtained for each chocolate sample, in order to observe if separation by the percentage of cocoa contained in the samples was possible. To define which classifier had the best performance, 7 models were used, which are listed below: decision trees, linear discriminant analysis (LDA), quadratic discriminant analysis (QDA), support vector machines (SVM), nearest neighbor classifiers, ensemble classifiers and naive Bayes classifiers. Each of these algorithms was combined with its level of interpretability and flexibility, obtaining 24 models that were used in this research. The selection of discriminating variables was carried out using a feature selection technique based on the staggered decorrelation of variables.
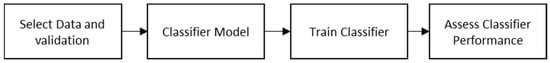
Figure 2.
Figure 2. Supervised classification.
Cross-validation was used to randomly divide the original dataset of THz spectra into a training set and test set, measuring the mean cross-validation error as a performance indicator. For the other parameters, a heuristic procedure was used to select the scale value based on the kernel function to calculate the best classifier. The best model was determined based on its accuracy. Finally, once the best model was determined, the characteristics were transformed with a PCA to reduce its dimensionality.
3. Results
3.1. Terahertz Imaging Analysis
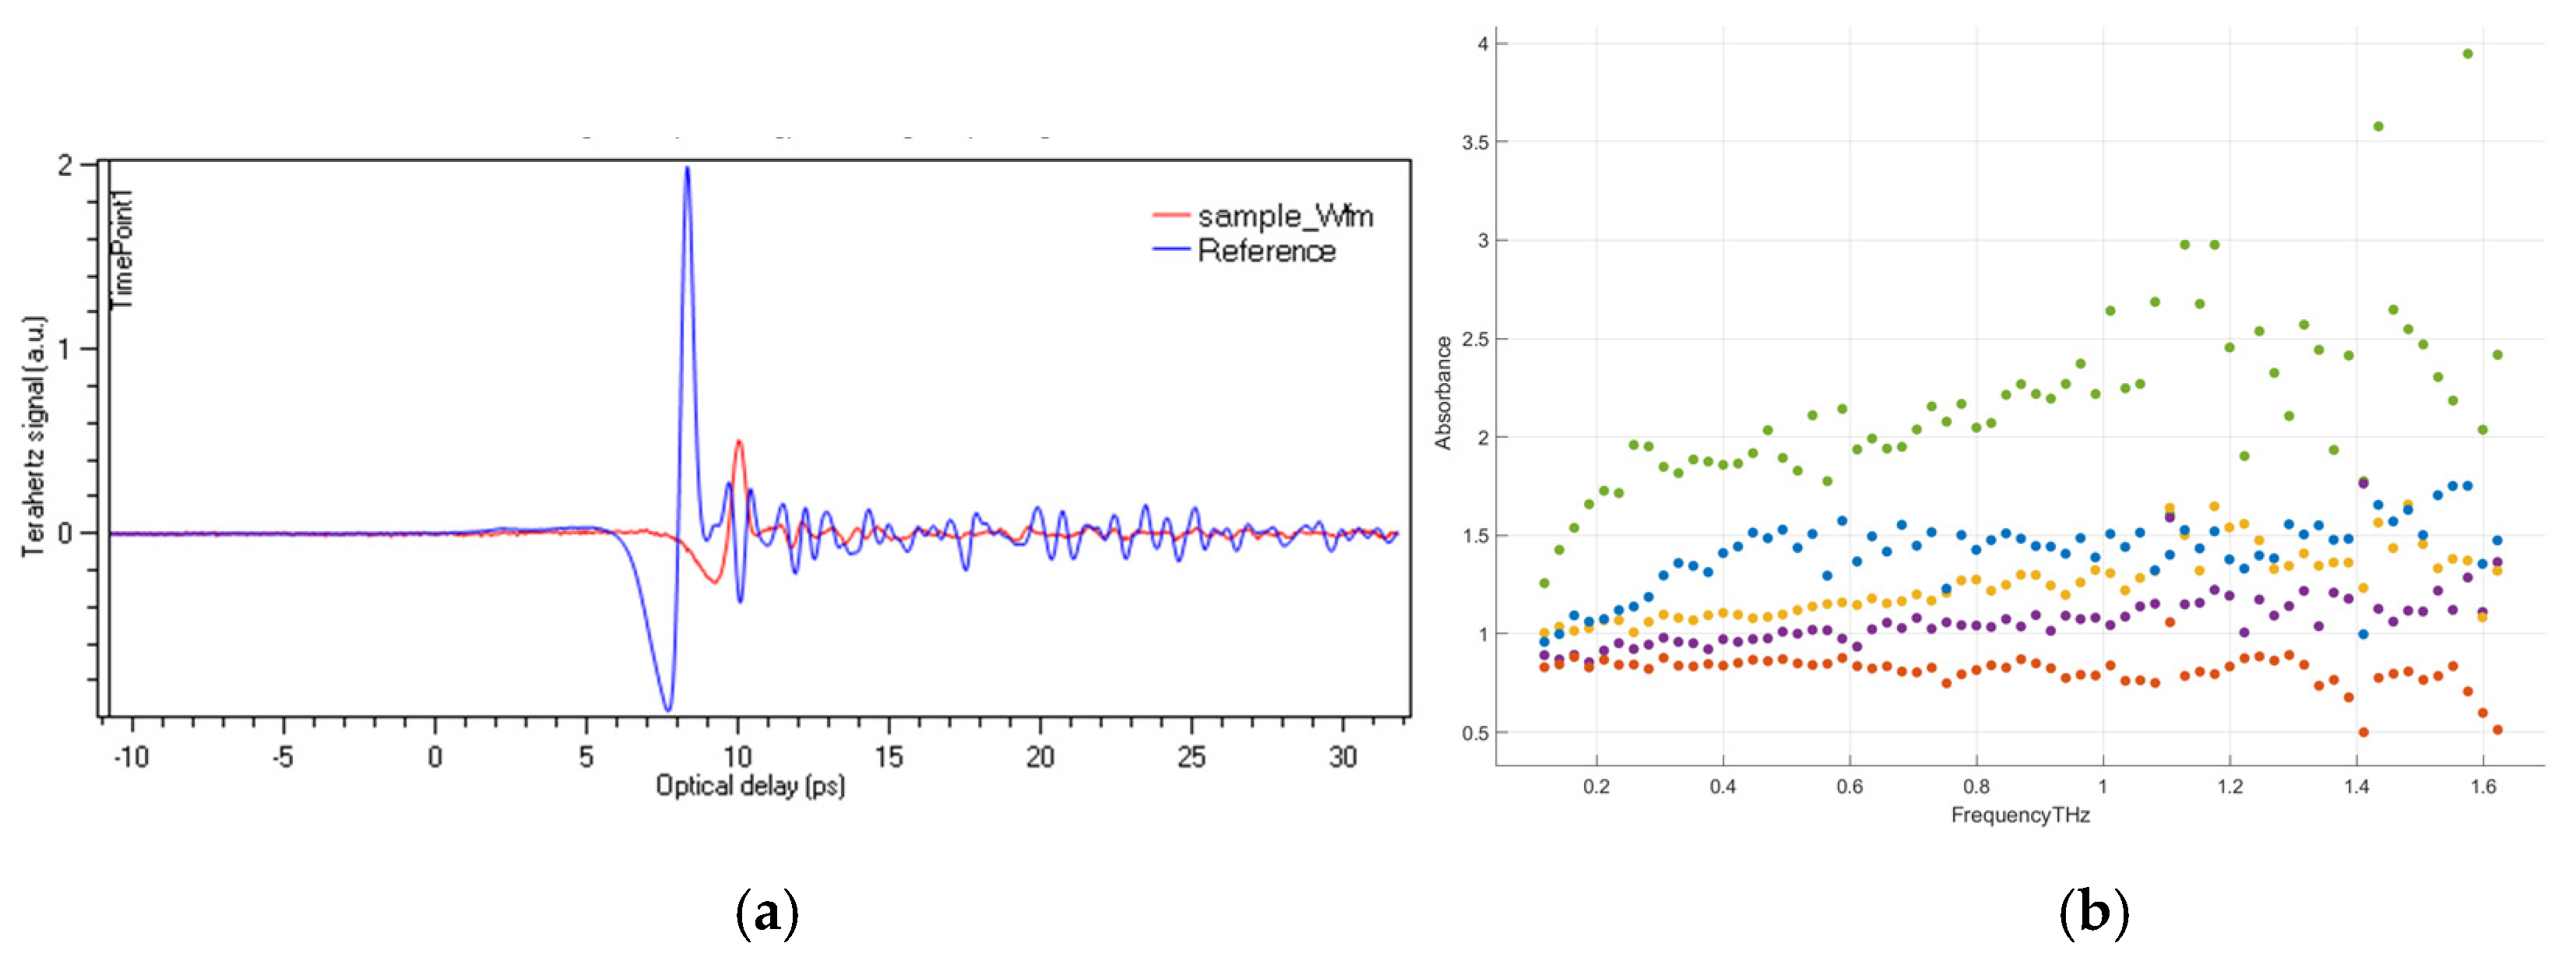
The chocolate samples contained different percentages of cocoa in their composition and, in order to place them in the THz spectrometry equipment, they were arranged in blocks of 10 × 10 cm. The characteristic pulse of THz is shown in Figure 3a. This, after data processing, could be transformed into indicators that were more suitable for analysis, such as the absorbance shown in Figure 3b. Pre-treatment ranged from noise reduction to the application of fast Fourier transform for conversion into absorbance data [12].
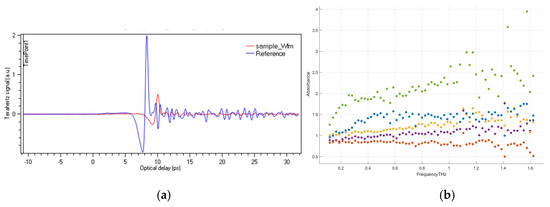
Figure 3.
(a) THz pulse; (b) absorbance of the samples.
As shown in Figure 3b, the measurement range used was 0.1 to 8 THz in order to observe the behavior of each sample in a broad spectrum. However, after pre-treatment, it was observed that not all the spectra generated adequate information for a classification process as that intended for chocolate samples; thus the range with greater differentiation was used, which was 0.1 to 2.0 THz.
In this shorter range, the absorbance spectra obtained could be better differentiated. In the range of 1.6 THz it could be observed that there was crossing of information. This may have been due to the fact that air and water vapor were not properly purged and can generate this type of noise; but despite this, it could be observed that it was possible to differentiate the samples appropriately, based on the cocoa content within their composition.
3.2. Multivariate Analysis
Within the THz classification procedure, two types of models were used to achieve this objective, which were divided into 24 algorithms used, of both LDA and SVM type. To differentiate them, the accuracy indicator (%) and machine learning techniques executed in MATLAB were used, all of them with 15 interactions in cross validation. The five algorithms that reached the highest level of accuracy were taken, which are shown in Table 1.

Table 1.
Models with the best accuracy.
After testing the 24 models, and according to the accuracy, it was obtained that SVM reached the highest accuracy, so that an extra step was made to improve the model with an optimization function. In this case, the selected function was of the Bayesian type with 30 interactions, which achieved an optimized accuracy level of 93%. This SVM model has already been reported as very efficient for food classification [13].
After identifying the best classification function for chocolates based on their cocoa content, it was sought to reduce their dimensionality and test their classification level, for which a PCA was applied, showing that the first component can explain 63.8% and the second component explained 36.2%. In addition, to show the classification level, a confusion matrix was performed as shown in Figure 4a, achieving appropriate classification levels. Additionally, a regression was made, since the exact percentages of cocoa in the chocolates were known. It was tested with the same SVM function and a RMSE of 0.171751 was achieved, which is a very promising value for future work in the prediction of cocoa in chocolate samples. This regression can be seen in Figure 4b.
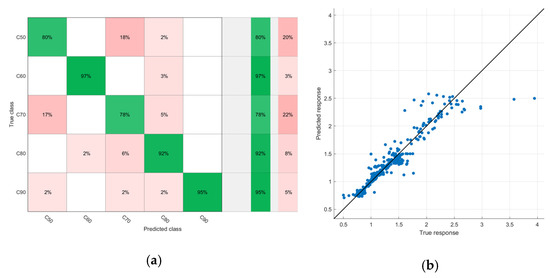
Figure 4.
(a) Confusion matrix; (b) prediction.
Terahertz spectroscopy has shown great potential for use in the field of chocolate production. A study by Catapano [14] examined work on quality control of chocolate bars contaminated with foreign objects, where THz technology showed a great ability to detect and discriminate different types of materials based on their composition. Methods for carrying out these quality processes, especially those based on composition, have always used techniques such as mass spectroscopy [15], so the importance of evaluating novel techniques such as time-domain spectroscopy becomes necessary, especially for the food industry, by assessing the importance of non-destructive inspection, meeting the needs of modern and rapid techniques for international trade in food.
Finally, it can be said that spectroscopy in the terahertz range can have a penetration level in the product, which gives an advantage over other spectroscopy technologies, besides the possibility of analyzing the level of vibration and behavior of food macro- and micronutrients in a little-studied range [16]. Although with this type of spectroscopy many topics are still under discussion, such as water vapor interference, applications in organic and biological systems and the high costs of generating this type of spectrum, as demonstrated, represent an important and emerging point for food control in the future.
4. Conclusions
The overall results show that terahertz time-domain spectroscopy together with classification modeling can successfully identify the composition of chocolate bars based on their cacao percentage. The ability of this technique to characterize the molecular structure of many biological substances makes it an attractive analytical process tool for better monitoring in food quality control. However, while terahertz time-domain spectroscopy is demonstrating efficiency in classification methods, as in chocolate, there are still many parameters to take into account in the use of this type of technology.
Author Contributions
Individual contributions for the authors are as follows: conceptualization, J.O and J.R.; methodology, J.O.; software, J.R. and J.O.; validation, J.R.; formal analysis, J.O.; resources, J.R.; data curation, J.R.; writing–original draft preparation, J.O.; writing–review and editing, J.O and J.R.; visualization, J.O and J.R.; supervision, J.O.; project administration, J.O.; funding acquisition, J.O. All authors have read and agreed to the published version of the manuscript.
Funding
The authors acknowledge the financial support of the Project Concytec–World Bank “Development of Predictive Models of Food Quality Based on THz Imaging Technology”, through its executing unit Fondecyt, contract number 006-2018-FONDECYT/BM-Mejoramiento de la infraestructura para la investigación (equipamiento).
Institutional Review Board Statement
Not applicable.
Informed Consent Statement
Not applicable.
Data Availability Statement
Data sharing not applicable.
Conflicts of Interest
The authors declare no conflict of interest.
References
- Song, S.-H.; Dick, B.; Penzkofer, A.; Pokorny, R.; Batschauer, A.; Essen, L.-O. Absorption and Fluorescence Spectroscopic Characterization of Cryptochrome 3 from Arabidopsis Thaliana. J. Photochem. Photobiol. B Biol. 2006, 85, 1–16. [Google Scholar] [CrossRef] [PubMed]
- Singh, A.K.; Pérez-López, A.V.; Simpson, J.; Castro-Camus, E. Three-Dimensional Water Mapping of Succulent Agave Victoriae-Reginae Leaves by Terahertz Imaging. Sci. Rep. 2020, 10, 1404. [Google Scholar] [CrossRef] [PubMed]
- 3Uddin, M.N.; Ferdous, T.; Islam, Z.; Jahan, M.S.; Quaiyyum, M.A. Development of Chemometric Model for Characterization of Non-Wood by FT-NIR Data. J. Bioresour. Bioprod. 2020, 5, 196–203. [Google Scholar] [CrossRef]
- De-la-Torre, M.; Avila-George, H.; Oblitas, J.; Castro, W. Selection and Fusion of Color Channels for Ripeness Classification of Cape Gooseberry Fruits. Adv. Intell. Syst. Comput. 2020, 1071, 219–233. [Google Scholar] [CrossRef]
- Castro, W.; Oblitas, J.; Chuquizuta, T.; Avila-George, H. Application of Image Analysis to Optimization of the Bread-Making Process Based on the Acceptability of the Crust Color. J. Cereal Sci. 2017, 74, 194–199. [Google Scholar] [CrossRef]
- Xu, Y.; Zhong, P.; Jiang, A.; Shen, X.; Li, X.; Xu, Z.; Shen, Y.; Sun, Y.; Lei, H. Raman Spectroscopy Coupled with Chemometrics for Food Authentication: A Review. TrAC Trends Anal. Chem. 2020, 131, 116017. [Google Scholar] [CrossRef]
- Wang, K.; Sun, D.-W.; Pu, H. Emerging Non-Destructive Terahertz Spectroscopic Imaging Technique: Principle and Applications in the Agri-Food Industry. Trends Food Sci. Technol. 2017, 67, 93–105. [Google Scholar] [CrossRef]
- Ferguson, B.; Zhang, X.-C. Materials for Terahertz Science and Technology. Nat. Mater. 2002, 1, 26–33. [Google Scholar] [CrossRef] [PubMed]
- Ferreira de Oliveira, A.P.; Milani, R.F.; Efraim, P.; Morgano, M.A.; Tfouni, S.A.V. Cd and Pb in Cocoa Beans: Occurrence and Effects of Chocolate Processing. Food Control. 2021, 119, 107455. [Google Scholar] [CrossRef]
- Barbin, D.F.; Maciel, L.F.; Bazoni, C.H.V.; Ribeiro, M. da S.; Carvalho, R.D.S.; Bispo, E. da S.; Miranda, M. da P.S.; Hirooka, E.Y. Classification and Compositional Characterization of Different Varieties of Cocoa Beans by near Infrared Spectroscopy and Multivariate Statistical Analyses. J. Food Sci. Technol. 2018, 55, 2457–2466. [Google Scholar] [CrossRef] [PubMed]
- Liu, W.; Liu, C.; Yu, J.; Zhang, Y.; Li, J.; Chen, Y.; Zheng, L. Discrimination of Geographical Origin of Extra Virgin Olive Oils Using Terahertz Spectroscopy Combined with Chemometrics. Food Chem. 2018, 251, 86–92. [Google Scholar] [CrossRef] [PubMed]
- Shen, X.; Dietlein, C.R.; Grossman, E.; Popovic, Z.; Meyer, F.G. Detection and Segmentation of Concealed Objects in Terahertz Images. IEEE Trans. Image Process. 2008, 17, 2465–2475. [Google Scholar] [CrossRef] [PubMed]
- Loussaief, S.; Abdelkrim, A. Machine Learning Framework for Image Classification. Adv. Sci. Technol. Eng. Syst. 2018, 3, 1–10. [Google Scholar] [CrossRef]
- Catapano, I.; Soldovieri, F. Chapter 11—THz imaging and data processing: State of the art and perspective. In Innovation in Near-Surface Geophysics; Persico, R., Piro, S., Linford, N., Eds.; Elsevier: Amsterdam, The Netherlands, 2019; pp. 399–417. ISBN 978-0-12-812429-1. [Google Scholar]
- Humston, E.M.; Knowles, J.D.; McShea, A.; Synovec, R.E. Quantitative Assessment of Moisture Damage for Cacao Bean Quality Using Two-Dimensional Gas Chromatography Combined with Time-of-Flight Mass Spectrometry and Chemometrics. J. Chromatogr. A 2010, 1217, 1963–1970. [Google Scholar] [CrossRef] [PubMed]
- Wang, C.; Zhou, R.; Huang, Y.; Xie, L.; Ying, Y. Terahertz Spectroscopic Imaging with Discriminant Analysis for Detecting Foreign Materials among Sausages. Food Control. 2019, 97, 100–104. [Google Scholar] [CrossRef]

Publisher’s Note: MDPI stays neutral with regard to jurisdictional claims in published maps and institutional affiliations. |
© 2020 by the authors. Licensee MDPI, Basel, Switzerland. This article is an open access article distributed under the terms and conditions of the Creative Commons Attribution (CC BY) license (https://creativecommons.org/licenses/by/4.0/).