Abstract
Phenolics are bioactive compounds already reported in Hibiscus sabdariffa (roselle). The present study reports the development and validation of the analytical microwave-assisted extraction (MAE) method for the determination of phenolic compounds in roselle flowers to establish their positive contribution to human health. Prior to the optimization, a study for identifying phenolic compounds revealed that chlorogenic acid, protocatechuic acid, caffeic acid, and rutin were presented in Roselle. Three factors affecting MAE, viz. temperature, solvent composition, and sample to solvent ratio, were optimized employing a Box-Behnken Design (BBD) in conjunction with response surface methodology (RSM). The maximum extraction recovery was achieved using the extraction temperature of 68 °C, solvent composition of 59% MeOH in water, and 20:1 solvent to sample ratio. The kinetics experiment confirmed full recoveries (92–119%) at 15 min. Subsequently, method validation showed a satisfactory result, including low detection limits from 0.219 mg L−1 (caffeic acid) to 0.374 mg L−1 (chlorogenic acid). Both precisions and accuracy met the acceptances by AOAC. Finally, the method was successfully applied to quantify phenolics in the two most common varieties of Roselle. Chlorogenic acid was found as the main phenolic compound in both varieties
1. Introduction
Edible flowers have gain popularity in culinary arts, where chefs all around the world have tried to incorporate their dish with one [1]. Actually, it was not only recently that people use the flower in daily consumption. In China dan Japan, the incorporation of flowers in their recipe has been made since thousands of years ago [2]. Greece and Rome, medieval France, Europe, Victorian England, or the Middle Eastern region had also used them as part of their diet [3]. In the different regions, various types and approaches in the cooking method are used. In Asia or other tropical areas, one of the most well-known edible flowers is Hibiscus sabdariffa or also known as Roselle [4].
Roselle is one to be the most consumed edible flower. Industries commonly use Roselle as a food coloring agent, while the cosmetic industry also uses its extract for lotion and shampoo mixture [5]. Traditionally, in some countries, the flower was made into juices, infused water, a blend in tea drink, and also served as herbal medicine [4,6]. Pleasant appearance and flavor are not the only consideration in consuming this flower; health benefits obtained from it are also taken into account. Exploration of Roselle extract has shown a great result in which several bioactive compounds are found to be presented, such as phenolics, organic acids, and polysaccharides [7,8,9]. These compounds are responsible for antioxidant activity, antibacterial agent, anti-inflammatory, hepatoprotective and anti-cholesterol activities [5,8,10].
Usually, liquid chromatography based methods are used for the determination of regular bioactive compounds in roselle and other edible flowers [11,12,13]. Therefore, some extraction methods must be applied before the final analysis. The reliability of the extract can be affected by specific extraction conditions and procedures [14]. Conventional methods, such as Soxhlet extraction and maceration, are frequently used. However, these methods are time-consuming and require a massive amount of solvent. Therefore, an alternative method, viz., microwave-assisted extraction (MAE), is more suitable. MAE has been proven to effectively extract different types of compounds in a wide variety of edible flowers and plant parts [15,16,17,18,19]. The extraction rate is enhanced by a unique direct energy transference offered by MAE. The microwave energy reacts with the polar materials resulting in simultaneous and fast heating through dipole rotation [20]. The short exposure time to high temperatures provides high-quality extracts with better target compound recoveries preventing degradation [21].
The process efficiency of MAE strongly depends on some factors factors, i.e., extraction temperature, solvent composition, and solvent to sample ratio [22]. A higher temperature could enhance the extraction rate while the solvent work as a medium for energy and mass transfer during the MAE process. Therefore, it is essential to optimize the aforementioned MAE factors to recover the target analyte from the matrix. Usually, the interactions among the extraction variables are significant; adopting a chemometric approach is useful to evaluate the factors simultaneously. Integrating Box-Behnken Design (BBD) and Response Surface Methodology (RSM) provides a good result for this purpose [23,24,25]. Compared to the single-factor experimental design, a factorial design is more useful to evaluate the MAE factors simultaneously [26]. In regard to the number of extraction factors, BBD offers fewer runs over other factorial design [27].
The focus of the current study was to optimize an analytical extraction for the determination of phenolic compounds in roselle using BBD in conjunction with RSM. The optimized method was then validated and applied to determine phenolic compounds in different varieties of roselle.
2. Material and Methods
2.1. Chemicals
Phenolic standards (analytical grade), including chlorogenic acid, protocatechuic acid, caffeic acid and rutin, HPLC-grade methanol, acetonitrile, and formic acid were purchased from Sigma (Madrid, Spain). Water was purified with a Mili-Q purification system (Millipore, Billerica, MA, USA).
2.2. Samples
Two samples of roselle were used in the study, namely red and pink roselle. Both flowers were in the dried form obtained from local farmers in Yogyakarta, Indonesia. Before the experiment, the whole dried roselle flower was ground into powder for 5 min, with 30 s break every 1-minute intervals. The powdered roselle flowers was placed in a bottle sample and stored in a refrigerator at 4 °C.
2.3. Extraction of Phenolic Compounds
Microwave-assisted extraction (MAE) experiments were conducted in a MARS 6 240/50 (CEM, Matthew, NC, USA) equipped with the extraction vials, which were made of modified polytetrafluoroethylene (PTFE-TFM). Roselle powder was accurately weighed according to the experimental design (1.5, 1, and 0.75 g) to provide a solvent to sample ratio (v/w) of 10:1, 15:1, and 20:1 and placed into an extraction vial. A precise volume of 15 mL with a different solvent composition (40, 70, and 100% MeOH in water) was prepared. The extraction was then conducted under the studied levels of temperature (30, 55, and 80 °C). Once the extraction was completed, the vessel was introduced to a 5 °C water bath for 30 s to allow it to cool down, reaching ambient temperature. Separation of the solid material and the solvent was conducted in centrifugation at 4000 rpm for 5 min. The extract was then adjusted to 5 mL and filtered using a 0.22 μm nylon filter (Millipore) prior to injection in the UPLC–PDA system.
2.4. Identification and Quantification of Phenolic Compounds
The identification and quantification of individual phenolic compounds were conducted by chromatographic analysis using the ACQUITY UPLC H-Class system coupled to an ACQUITY UPLC Photodiode Array (PDA) detector. The system was controlled by EmpowerTM 3 Chromatography Data Software (Waters Corporation, Milford, MA, USA).
The PDA detector was set at the wavelength range 200–400 nm for the 3D scan, with a data collection rate of 40 pts s−1 to identify the compounds. A certain wavelength of 2D scans PDA detector (260, 280, and 320 nm), on the basis of the maximum absorbance wavelength with a data collection rate of 80 pts s−1 was used for compound quantification. A binary solvent system was used as the mobile phase. Solvent A was 0.01% acetic acid in water and solvent B was 2% acetic acid in acetonitrile. The analysis was run in 10 min using the following gradient program (%B): 0–0.3 min, 3.1–9.5%; 0.3–0.8 min, 9.5–15.6%; 0.8–5 min, 15.6–82.2%; 5–6 min, 82.2–100%; 6–9 min, 100%; 9-10 min, 3.1%. The flow rate was set at 0.64 mL min−1 [28]. Phenolic compounds found in the Roselle extract were identified by comparing the retention time and spectra to those of standards. Addition%ally, a spiking procedure with corresponding standards was performed to confirm the identification.
2.5. Experimental Design and Statistical Analysis
Box-Behnken design (BBD) was used in this study to evaluate the effect of the independent variables on the extraction efficiency of microwave-assisted extraction (MAE). Response Surface Methodology (RSM) was then employed for optimization. The three-factor (x1, temperature; x2, solvent composition; and x3, sample to solvent ratio) with the three-level design was performed (−1, 0, 1). Table 1 shows the range of the independent factors and their levels, while Table 2 presented the whole design, which consisted of 15 sets of experimental runs carried out in random orders. The response was the relative values with respect to the maximum response (%) of the total concentration of the studied compounds.

Table 1.
Selected factors and their levels for Box–Behnken design.
Table 2.
Box–Behnken design for three factors with their observed responses.
This approach was used to obtain the surface response by fitting the data to a polynomial model and also to evaluate the effects of each factor and the interaction effects between factors. If all factors are considered to be evaluated, the RSM can be expressed as follows:
where y is the dependent factor while and x1, x2, and x3 were independent factors (temperature, solvent composition, and solvent to sample ratio, respectively).
It is supposed that the xi is continuous and controllable during the experiments. Since the objective was to optimize the response y, it was necessary to find the best estimation for the correlation between independent factors and the response surface. Generally, a second-order model is applied in RSM:
x1, x2, ..., xk are the MAE factors that influence the extraction efficiency, y; βo, βii (i = 1, 2, ..., k), βij (i = 1, 2, ..., k; j = 1, 2, ..., k) are unknown parameters, ε is a random error. The least-square method was used to estimate the β coefficients, while only second-order interactions were considered.
The construction and analysis of the experimental design and the response surface were performed using STATGRAPHICS Centurion XVI (Statpoint Technologies, Inc., The Plains, VA, USA) to reach the optimum conditions. This statistical tool utilized the quadratic model equation to build response surfaces. The Analysis ToolPak of an Excel of Microsoft Office Professional Plus 2013 was used to analyze the experimental data generated from single-factor experiments. The Analysis of Variance (ANOVA, p = 0.05) was used to determine the significance of the effect of studied variables. In the event that ANOVA suggested a significant difference, Least Significant Difference (LSD, p = 0.05) test was used to check the differences among the means.
2.6. Kinetic Study
The determination of the extraction rate of the studied phenolic compounds from Roselle was done by running the analysis using the optimum MAE condition over a period of time (5 to 30 min).
2.7. Performance of the Method
The validation of the analytical chromatographic method for the determination of phenolic compounds was performed based on the recommendations of ISO 17025 and ICH Guideline Q2 (R1) [29]. Linearity, the limit of detection and quantification of the method were assessed (Table 3).
Table 3.
Analytical properties for the UPLC-PDA method for phenolic compounds determination.
Linearity was evaluated to confirm that the method is appropriate over a specified interval of concentration. Four phenolic standards solutions were prepared by serial dilution for a concentration ranging from 0.5 to 10 and 10–100 mg L−1 with the coefficient of determination (R2), all higher than 0.996. The slope and the standard deviation were then used to assess the limits of detection (LOD) and quantification (LOQ). Caffeic acid was observed to has the lowest LOD and LOQ, by 0.219 and 0.730 mg L−1, respectively. Whilst, the highest LOD (0.374 mg L−1) and LOQ (1.245 mg L−1) were observed for chlorogenic acid.
In regards to accuracy, as certified reference material (CRM) for phenolics in roselle was not available, a specific statement cannot be made. Therefore, a spiking procedure was used to calculate extraction recovery (%R). Using the optimized MAE condition, extraction of roselle samples with and without spiking of the studied standard compounds were employed. The spiked mixture consists of the studied phenolic standards, in which the concentration of each compound was similar to the concentration found in the extract. The estimation of the method accuracy was calculated by comparing the spiked compounds recovered from the sample with the level of corresponding compounds in the spiked solution.
Precisions were also evaluated for the MAE method validation. The evaluation was conducted by repeating nine extractions on the same (n = 9) day for repeatability while three extractions in three consecutive days for intermediate precision. The precisions were expressed as the coefficient of variation (%CV) of the responses.
3. Result and Discussion
3.1. Identification of Phenolic in Roselle
Before developing the MAE method, the identification of phenolic compounds presented in roselle was firstly performed. For this purpose, a qualitative screening was conducted by extracting a 1 g Roselle with 10 mL of 50% MeOH. The extract was analyzed using UPLC-PDA system. The identification of phenolic compounds was conducted by comparing the retention time and the spectra found in the sample to the standard solution. The result revealed that Roselle contains chlorogenic acid and protocatechuic acid in which as previously reported [30]. The other identified phenolic compounds in roselle were caffeic acid and rutin.
3.2. Effect of MAE Factors
The factors were likely to affect the efficiency of microwave-assisted extraction (MAE), namely temperature (x1, 30–80 °C), solvent composition (x2, 50–100% MeOH in water), and solvent to sample ratio (x3, 10:1–20:1) were selected to be studied by BBD. The levels for the extraction variables were chosen based on previous information on literature working on the extraction of phenolic compounds from edible flowers [31]. In order to achieve an even response from the variables with different ranges and unit, each of the variables was normalized and made into the range of −1 to +1. The responses showed in Table 2 were the relative values to the maximum of total concentration (%) of the studied compounds.
Based on the design, 15 experiments, including three center points, were performed to determine the effect contributed by each of the main variables and their combination to the extraction efficiency. The effect of the studied factors were evaluated using the analysis of variance (ANOVA). The mean square against an estimate of the experimental error was used to define the statistical significance of the effect of extraction factors. Pareto chart (Figure 1) was built, presenting the standardized effects of the main, interactions, and quadratic effects. Factors or combinations served as bars that cross the vertical line describe the ones to have a significant effect on the response (p < 0.05). Thus, four effects consisted of two main effects (x2 and x3) and two combination effect (x2x2 and x1x2) with a p-value lower than 0.05, indicating that they were significantly influenced the extraction recovery at the confidence level of 95%.
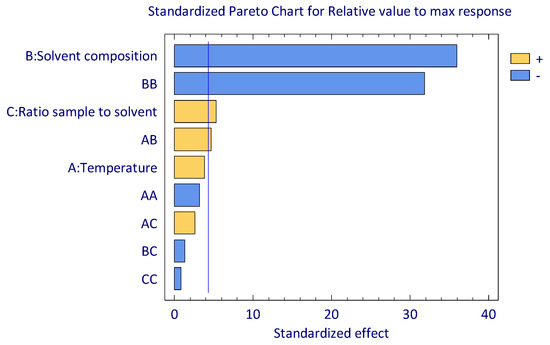
Figure 1.
Standardized of main, interaction, and quadratic effects of MAE factors on the extraction yield.
As shown in Figure 1, solvent composition () and its quadratic effect () showed a significant negative impact in which increasing this factor will result in a lower extraction recovery. In contrast, a positive effect was found for the solvent to sample ratio (); thus an increase of recovery could be achieved by increasing the amount of the extraction solvent. Similar effect were also found for the combination of temperature and solvent composition (). Nonetheless, contribution by all factors was used to evaluate the fitting properties for the model. The second-order polynomial equation for the fitted model is:
where y is the extraction yield and xi are the extraction factors (x1, temperature; x2, solvent composition; x3, solvent to sample ratio).
The validity of the model was statistically evaluated by applying a lack-of-fit test. The test was carried out by calculating the variability of the current model residuals to the variability between observation at replicate settings for the factors. The p-value in ANOVA for the lack-of-fit test was 0.0506. Therefore the model was appeared to be adequate for the observed data at the confidence level of 95%. The statistical R2 indicated that the model explains 97.60% of the variability in the response, with the standard deviation of the residuals was 1.81. Whilst the mean absolute error of 3.03 was the average value of the residuals. Hence, the suggested model can be applied to estimate the optimum MAE factors to obtain the maximum recovery.
3.3. Optimization of MAE Condition
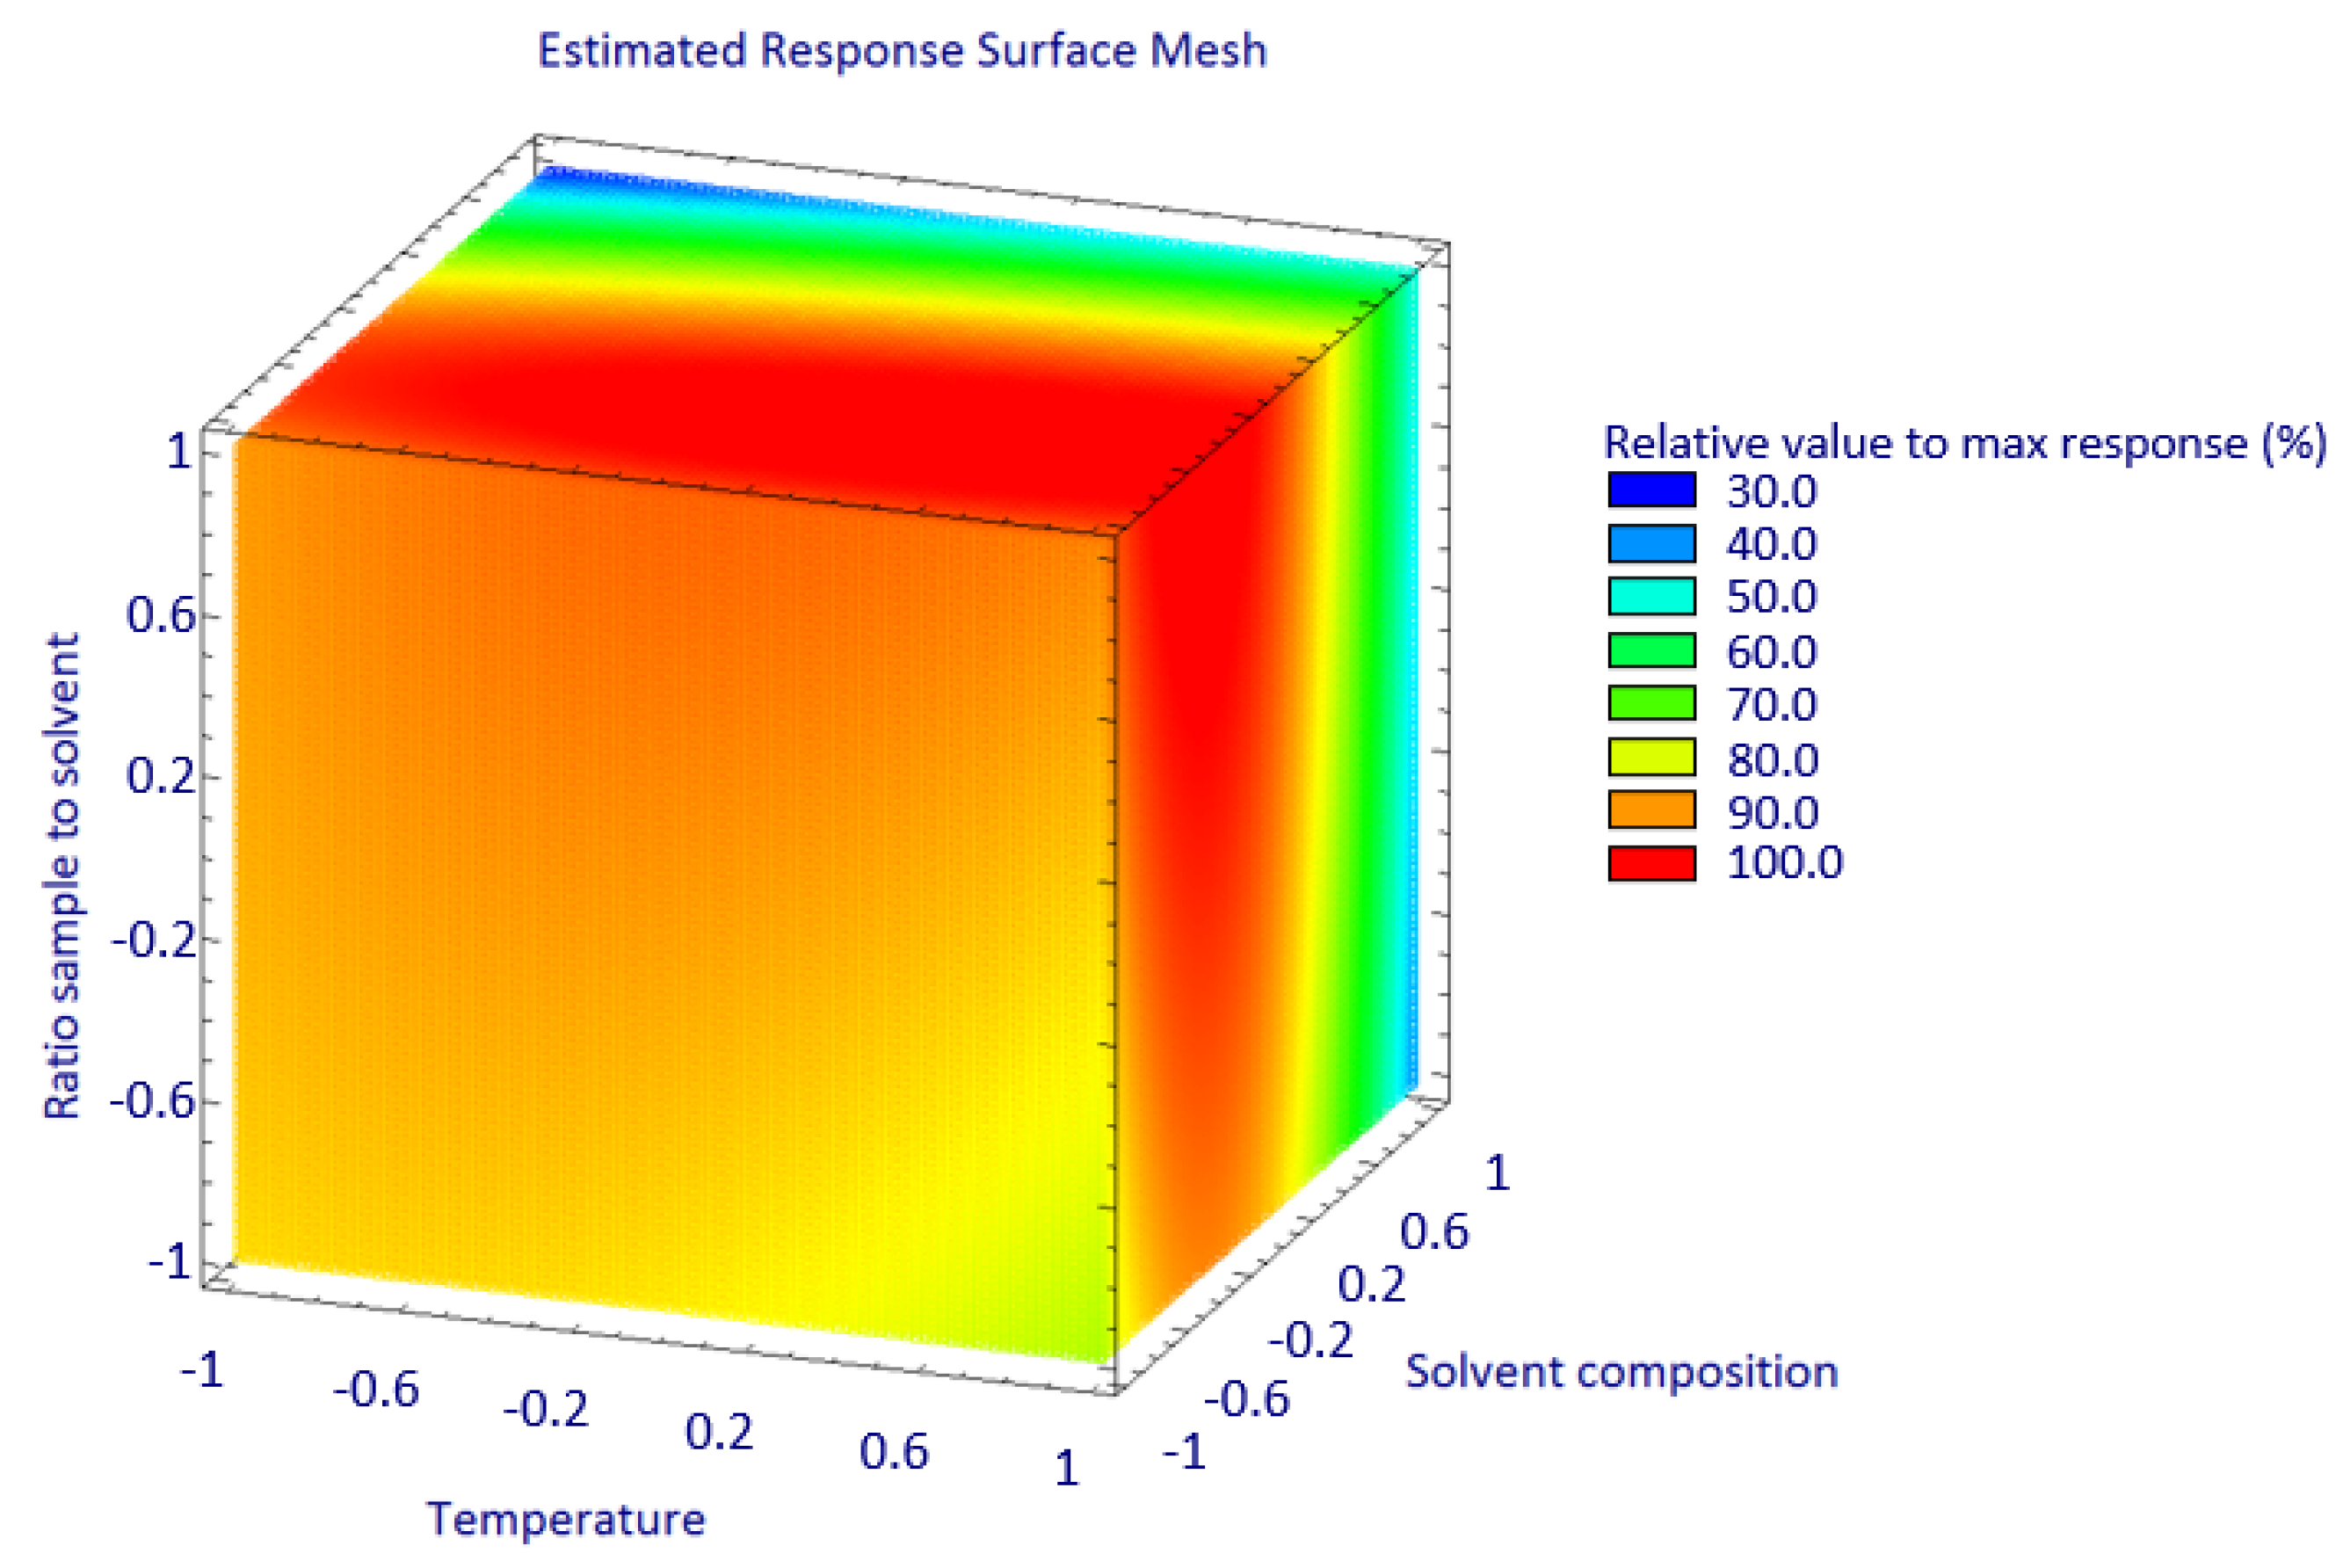
The objective of the optimization by Response Surface Methodology (RSM) was to obtain the best combination setting between the three independent factors of the MAE, namely temperature (x1), solvent composition (x2), and solvent to sample ratio (x3), achieving the highest recovery result. Based on the predicted model, a three-dimensional mesh plot was constructed to predict the relationship between the independent factors and responses (Figure 2). The highest response was obtained with the optimum MAE yield (103.54%) at the coordinate of 0.534 for extraction temperature (x1), −0.365 for solvent composition (x2), and 1 for ratio sample to solvent (x3). Henceforth, the optimum extraction recovery for the studied phenolic compound in Roselle can be achieved by applying 68 °C of extraction temperature using 59% methanol in water as the extraction solvent with a 20:1 solvent to sample ratio. Although the present study revealed similar results as the previous one [32], the temperature reported here was much lower. This temperature setting could guarantee better stability of the thermolabile phenolic compounds such as rutin [33]. Therefore, a higher extraction yield should be expected. Additionally, the higher solvent to sample ratio should allow for faster extraction methods because of diffusion rate [34].

Figure 2.
A 3D mesh of response plot for the studied MAE factors.
3.4. Kinetics Study
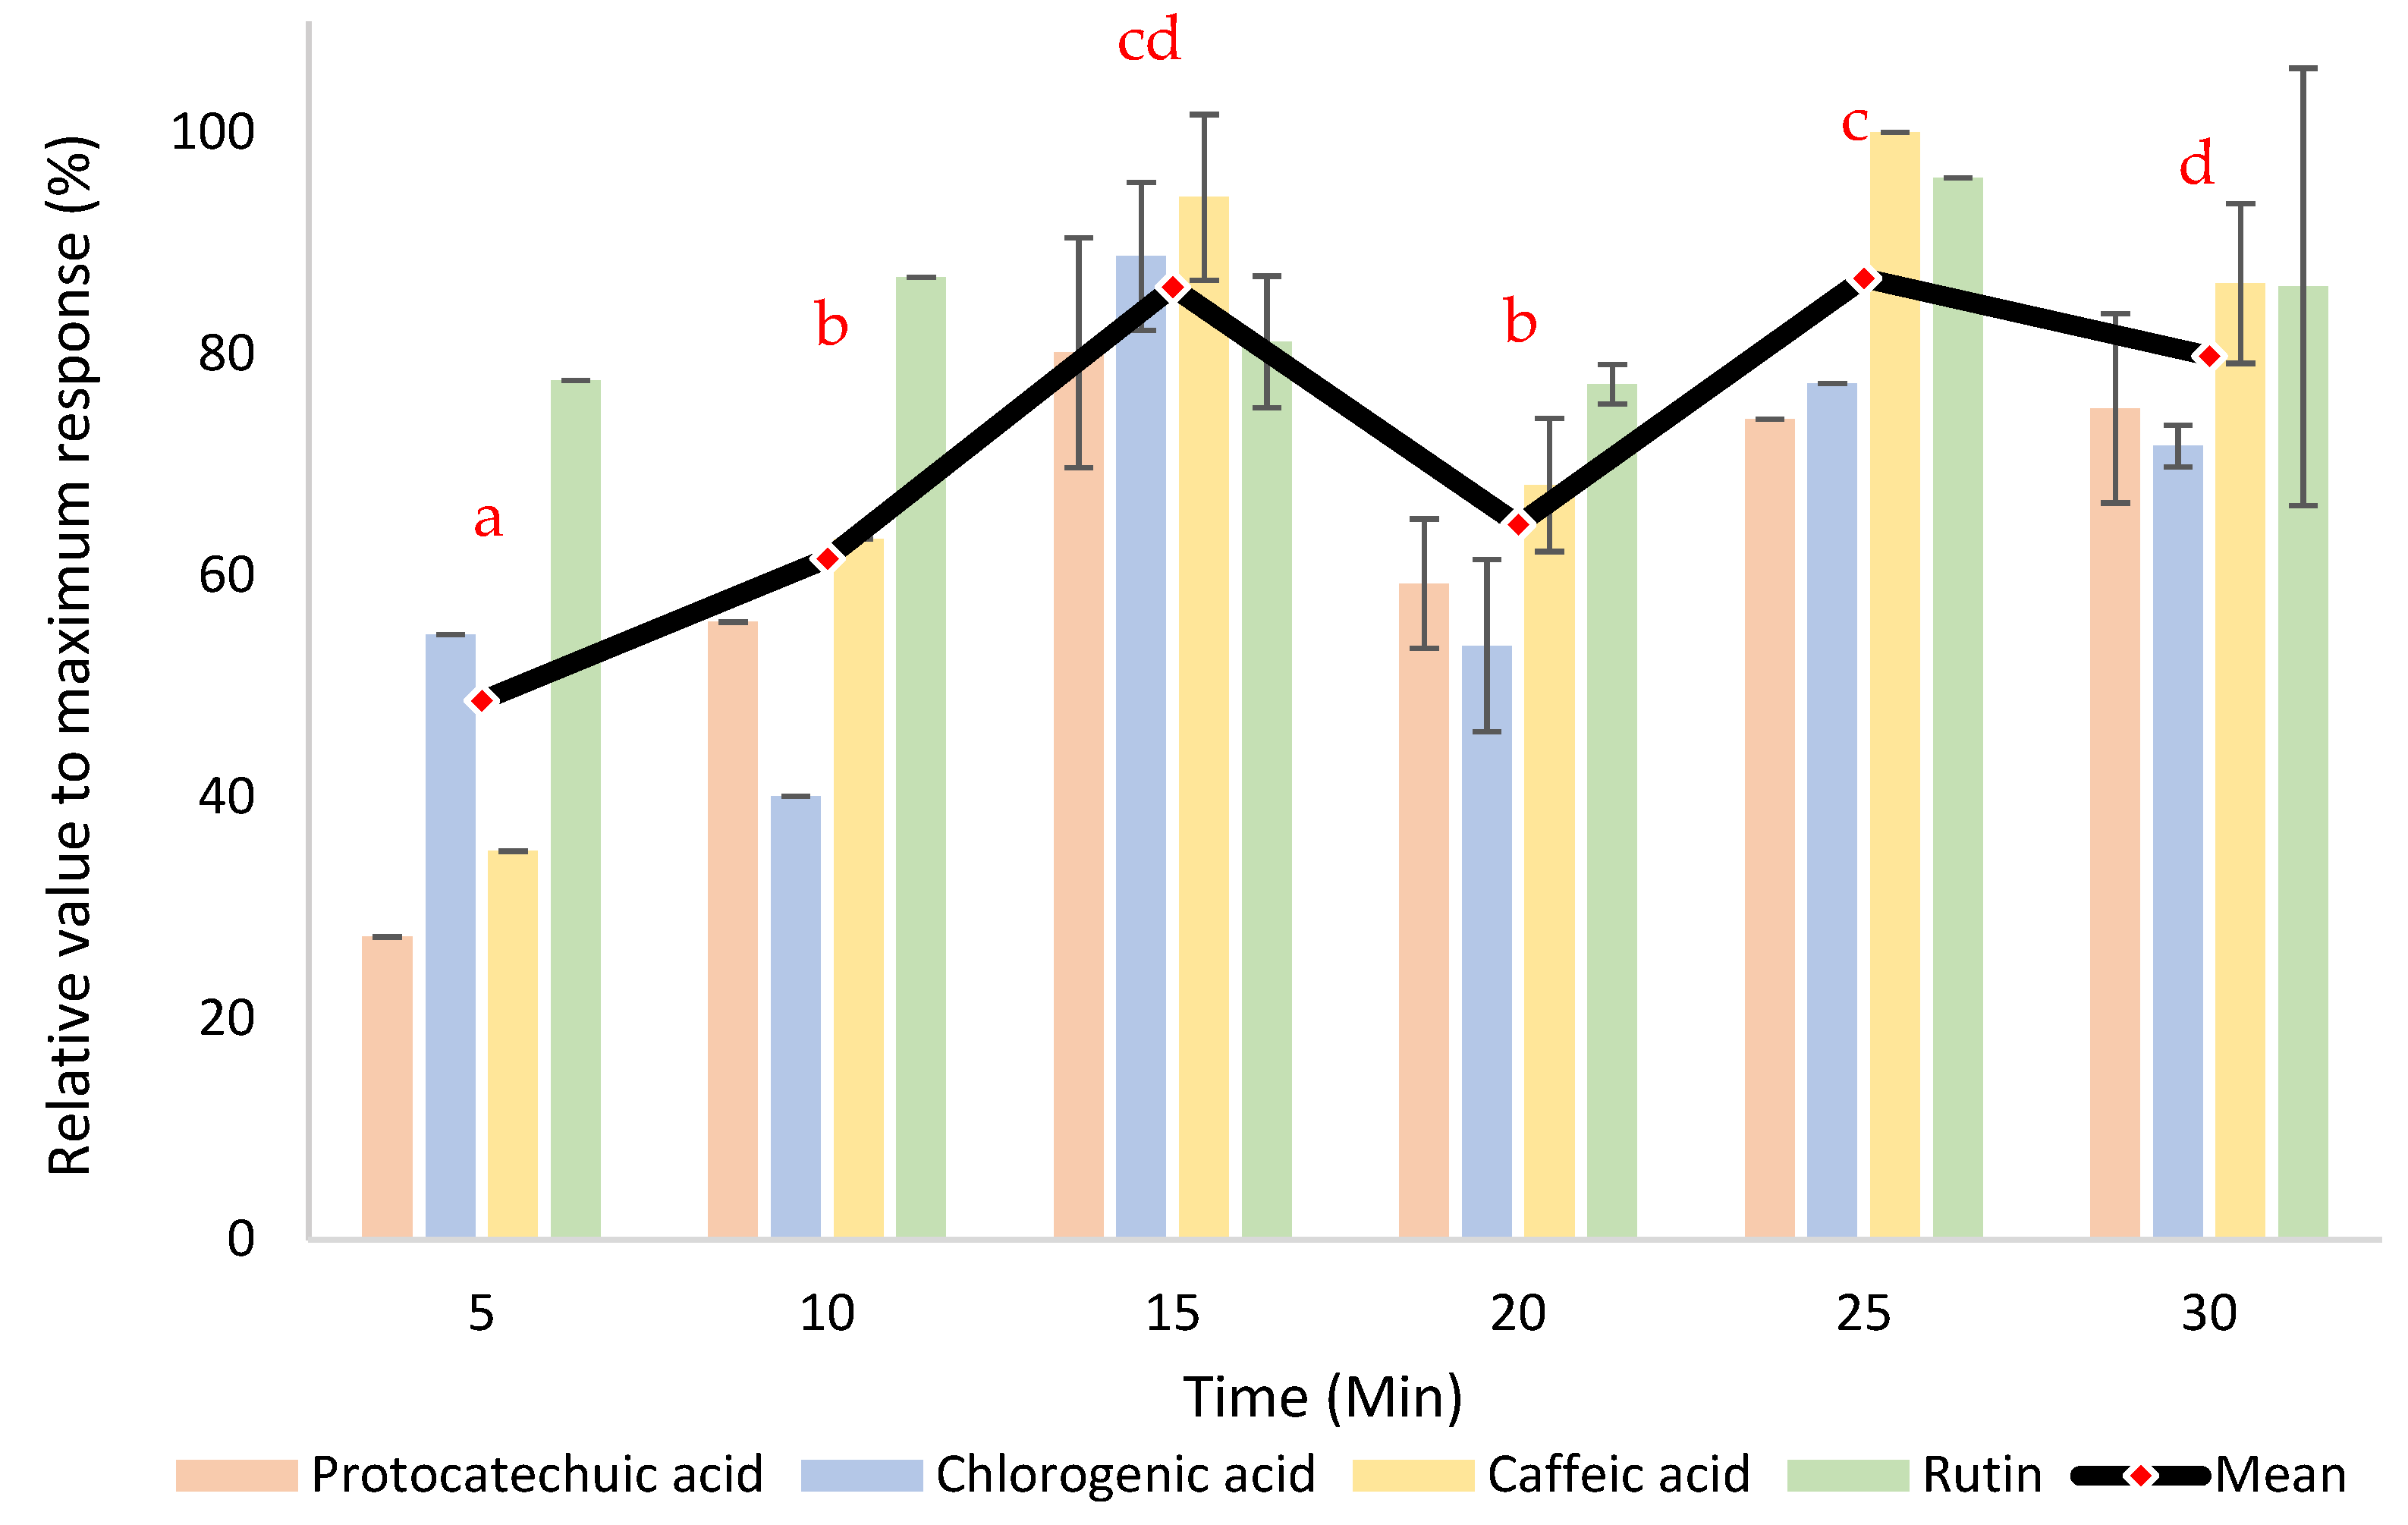
To achieve an efficient MAE for phenolic compounds in roselle, extraction kinetics was performed by checking the extraction yield over a period of time. The extraction kinetics was evaluated by running extractions at the optimum MAE condition for 5 to 30 min. Afterward, the evaluation was conducted using the average of the relative value to the maximum yield of the extracted compounds (Figure 3). The ANOVA suggested that the extraction time significantly affected the extraction yield (p < 0.05). The proposed extraction time for phenolic compounds from roselle was 15 min to achieve the highest yield (LSD, p < 0.05), as an extended extraction time to 30 min did not enhance the extraction recovery compare to the longer extraction time. Increasing the extraction time will not alter the extraction yield after the full recovery was reached. While the decrease of the yield with longer extraction time might occur due to the degradation of the compounds or interaction between compounds as a result of microwave exposure [34,35].
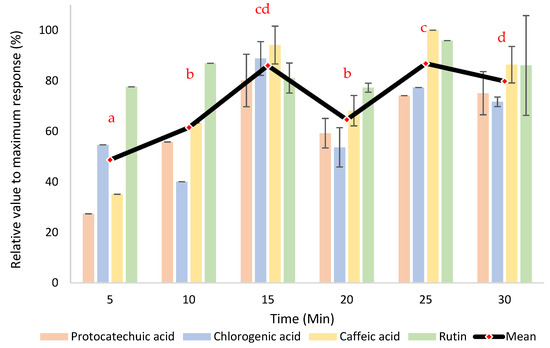
Figure 3.
Extraction yield throughout the extraction time. The values followed by different letters are indicated as significantly different (p < 0.05).
3.5. Method Validation
To check the reliability of the developed method, confirmation experiments were carried using the optimized MAE condition, viz, extraction temperature of 68 °C, 20:1 of solvent to sample ratio, 59% MeOH in water for the solvent, and extraction time of 15 min. Values for both precisions and accuracy (Table 4) were evaluated under the aforementioned optimized condition.
Table 4.
Precision and recovery of the phenolic compounds.
Two-level of precisions were studied, i.e., repeatability and intermediate precision. Although the values of coefficient of variation (CV) for the precisions were varied among the phenolic compounds, the data met the ICH requisite since the values were 10% or less. The recovery (%R) evaluation for indicating the accuracy was performed by comparing the concentration of both spiked samples to the concentration of standards after the extraction procedure. The recoveries were between the acceptable values by the ICH, ranging from 92% (protocatechuic acid) to 119% (caffeic acid). The reported CV and R values indicated a high precision and accuracy of the developed method.
3.6. Real Sample Application
In order to assess the applicability, the developed and validated method was employed to extract real samples of two different Roselle varieties (Table 5). The result showed that chlorogenic acid has the highest value in both samples, by 118.86 and 41.08 mg 100 g−1 for red and pink Roselle, respectively. The total phenolic compounds in the darker colored (red) roselle were roughly three times higher than the lighter one (pink). This result was in accordance with the former study [36], which showed that darker colored roselle contained much higher total phenolic compounds compared to the lighter colored and white roselle in the early stage of maturity.
Table 5.
The level of phenolic compounds in the studied dried roselle samples.
4. Conclusions
A fast and reliable microwave-assisted extraction (MAE) for the phenolic compound from roselle flower was successfully optimized using Box-Behnken Design in conjunction with Response Surface Methodology (RSM). The optimum extraction yield can be achieved by applying the following MAE condition: temperature 68 °C, solvent composition 59% methanol in water, solvent to sample ratio 20:1, and extraction time 15 min. The method validation reported a satisfactory result for precisions and accuracy to meet the ICH guideline. Finally, the method was successfully identified and quantified four phenolic compounds in two varieties of dried roselle flower with chlorogenic acid as the major phenolic in the flowers.
Author Contributions
Conceptualization, W.S. and M.P.; methodology, W.S.; validation, M.P.; formal analysis, W.S. and R.N.F.; investigation, R.N.F.; technical assistance, C.C.; data curation, W.S. and M.P.; writing—original draft preparation, R.N.F.; writing—review and editing, W.S. and M.P.; grammar editing, C.C.; supervision, W.S. and M.P.; funding acquisition, M.P. All authors have read and agreed to the published version of the manuscript.
Funding
This research was funded by Faculty of Agricultural Technology, Gadjah Mada University, Indonesia, through Innovative Research Grant No. 1853/UN1/FTP.1.3/SET-D/KU/2020.
Institutional Review Board Statement
Not applicable.
Informed Consent Statement
Not applicable.
Conflicts of Interest
The authors declare no conflict of interest. The funders had no role in the design of the study; in the collection, analyses, or interpretation of data; in the writing of the manuscript, or in the decision to publish the results.
References
- Kou, L.; Turner, E.R.; Luo, Y. Extending the Shelf Life of Edible Flowers with Controlled Release of 1-Methylcyclopropene and Modified Atmosphere Packaging. J. Food Sci. 2012, 77, 188–193. [Google Scholar] [CrossRef] [PubMed]
- Rop, O.; Mlcek, J.; Jurikova, T.; Neugebauerova, J.; Vabkova, J. Edible Flowers—A New Promising Source of Mineral Elements in Human Nutrition. Molecules 2012, 17, 6672–6683. [Google Scholar] [CrossRef] [PubMed]
- Pires, T.C.S.P.; Barros, L.; Santos-Buelga, C.; Ferreira, I.C.F.R. Edible flowers: Emerging components in the diet. Trends Food Sci. Technol. 2019, 93, 244–258. [Google Scholar] [CrossRef]
- Mariod, A.A.; Saeed Mirghani, M.E.; Hussein, I. Hibiscus sabdariffa L. Roselle. Unconv. Oilseeds Oil Sources 2017, 59–65. [Google Scholar] [CrossRef]
- Villani, T.; Juliani, H.R.; Simon, J.E.; Wu, Q.L. Hibiscus sabdariffa: Phytochemistry, quality control, and health properties. ACS Symp. Ser. 2013, 1127, 209–230. [Google Scholar] [CrossRef]
- Thiagarajah, K.; Ong, M.K.; Teh, L.K.; Lye, H.S. Plants Infused Water as Preferred Healthy Drinks; Elsevier Inc.: Amsterdam, Netherlands, 2019; ISBN 9780128152720. [Google Scholar]
- Jabeur, I.; Pereira, E.; Barros, L.; Calhelha, R.C.; Soković, M.; Oliveira, M.B.P.P.; Ferreira, I.C.F.R. Hibiscus sabdariffa L. as a source of nutrients, bioactive compounds and colouring agents. Food Res. Int. 2017, 100, 717–723. [Google Scholar] [CrossRef]
- Salib, J.Y. Polyphenolic Compounds from Flowers of Hibiscus: Characterization and Bioactivity; Elsevier: Amsterdam, Netherlands, 2014; ISBN 9780123979346. [Google Scholar]
- Tsai, P.J.; McIntosh, J.; Pearce, P.; Camden, B.; Jordan, B.R. Anthocyanin and antioxidant capacity in Roselle (Hibiscus sabdariffa L.) extract. Food Res. Int. 2002, 35, 351–356. [Google Scholar] [CrossRef]
- Da-Costa-Rocha, I.; Bonnlaender, B.; Sievers, H.; Pischel, I.; Heinrich, M. Hibiscus sabdariffa L.—A phytochemical and pharmacological review. Food Chem. 2014, 165, 424–443. [Google Scholar] [CrossRef]
- Moratalla-López, N.; Sánchez, A.M.; Lorenzo, C.; López-Córcoles, H.; Alonso, G.L. Quality determination of Crocus sativus L. flower by high-performance liquid chromatography. J. Food Compos. Anal. 2020, 93, 103613. [Google Scholar] [CrossRef]
- Abidi, J.; Ammar, S.; Ben Brahim, S.; Skalicka-Woźniak, K.; Ghrabi-Gammar, Z.; Bouaziz, M. Use of ultra-high-performance liquid chromatography coupled with quadrupole-time-of-flight mass spectrometry system as valuable tool for an untargeted metabolomic profiling of Rumex tunetanus flowers and stems and contribution to the antioxidant activity. J. Pharm. Biomed. Anal. 2019, 162, 66–81. [Google Scholar] [CrossRef]
- Chen, G.-L.; Chen, S.-G.; Xie, Y.-Q.; Chen, F.; Zhao, Y.-Y.; Luo, C.-X.; Gao, Y.-Q. Total phenolic, flavonoid and antioxidant activity of 23 edible flowers subjected to in vitro digestion. J. Funct. Foods 2015, 17, 243–259. [Google Scholar] [CrossRef]
- Segura-Carretero, A.; Puertas-Mejía, M.A.; Cortacero-Ramírez, S.; Beltrán, R.; Alonso-Villaverde, C.; Joven, J.; Dinelli, G.; Fernández-Gutiérrez, A. Selective extraction, separation, and identification of anthocyanins from Hibiscus sabdariffa L. using solid phase extraction-capillary electrophoresis-mass spectrometry (time-of-flight/ion trap). Electrophoresis 2008, 29, 2852–2861. [Google Scholar] [CrossRef] [PubMed]
- Akhtar, I.; Javad, S.; Ansari, M.; Ghaffar, N.; Tariq, A. Process optimization for microwave assisted extraction of Foeniculum vulgare Mill using response surface methodology. J. King Saud Univ. Sci. 2020, 32, 1451–1458. [Google Scholar] [CrossRef]
- Alara, O.R.; Abdurahman, N.H.; Ukaegbu, C.I.; Azhari, N.H. Vernonia cinerea leaves as the source of phenolic compounds, antioxidants, and anti-diabetic activity using microwave-assisted extraction technique. Ind. Crops Prod. 2018, 122, 533–544. [Google Scholar] [CrossRef]
- Elez Garofulić, I.; Dragović-Uzelac, V.; Režek Jambrak, A.; Jukić, M. The effect of microwave assisted extraction on the isolation of anthocyanins and phenolic acids from sour cherry Marasca (Prunus cerasus var. Marasca). J. Food Eng. 2013, 117, 437–442. [Google Scholar] [CrossRef]
- Fu, X.Q.; Ma, N.; Sun, W.P.; Dang, Y.Y. Microwave and enzyme co-assisted aqueous two-phase extraction of polyphenol and lutein from marigold (Tagetes erecta L.) flower. Ind. Crops Prod. 2018, 123, 296–302. [Google Scholar] [CrossRef]
- López-Hortas, L.; Conde, E.; Falqué, E.; Domínguez, H. Flowers of Ulex europaeus L.-Comparing two extraction techniques (MHG and distillation). C. R. Chim. 2016, 19, 718–725. [Google Scholar] [CrossRef]
- Mandal, V.; Mohan, Y.; Hemalatha, S. Microwave Assisted Extraction—An Innovative and Promising Extraction Tool for Medicinal Plant Research. Pharmacogn. Rev. 2007, 1, 7–18. [Google Scholar]
- Rombaut, N.; Tixier, A.-S.; Billy, A.; Chemat, F. Green extraction processes of natural products as tools for biorefinery Natacha. Biofuels Bioprod. Biorefin. 2014. [Google Scholar] [CrossRef]
- Llompart, M.; Garcia-Jares, C.; Celeiro, M.; Dagnac, T. Microwave-Assisted Extraction, 3rd ed.; Elsevier Inc.: Amsterdam, Netherlands, 2018; ISBN 9780124095472. [Google Scholar]
- Setyaningsih, W.; Duros, E.; Palma, M.; Barroso, C.G. Optimization of the ultrasound-assisted extraction of melatonin from red rice (Oryza sativa) grains through a response surface methodology. Appl. Acoust. 2016, 103, 129–135. [Google Scholar] [CrossRef]
- Setyaningsih, W.; Saputro, I.E.; Carrera, C.A.; Palma, M.; Barroso, C.G. Multiresponse optimization of a UPLC method for the simultaneous determination of tryptophan and 15 tryptophan-derived compounds using a Box-Behnken design with a desirability function. Food Chem. 2017, 225, 1–9. [Google Scholar] [CrossRef] [PubMed]
- Setyaningsih, W.; Saputro, I.E.; Carrera, C.A.; Palma, M. Optimisation of an ultrasound-assisted extraction method for the simultaneous determination of phenolics in rice grains. Food Chem. 2019, 288, 221–227. [Google Scholar] [CrossRef] [PubMed]
- Setyaningsih, W.; Palma, M.; Barroso, C.G. A new microwave-assisted extraction method for melatonin determination in rice grains. J. Cereal Sci. 2012, 56, 340–346. [Google Scholar] [CrossRef]
- Ferreira, S.L.C.; Bruns, R.E.; Ferreira, H.S.; Matos, G.D.; David, J.M.; Brandão, G.C.; da Silva, E.G.P.; Portugal, L.A.; dos Reis, P.S.; Souza, A.S.; et al. Box-Behnken design: An alternative for the optimization of analytical methods. Anal. Chim. Acta 2007, 597, 179–186. [Google Scholar] [CrossRef]
- Setyaningsih, W.; Saputro, I.E.; Carrera, C.A.; Palma, M.; García-Barroso, C. Fast Determination of Phenolic Compounds in Rice Grains by Ultraperformance Liquid Chromatography Coupled to Photodiode Array Detection: Method Development and Validation. J. Agric. Food Chem. 2019, 67, 3018–3027. [Google Scholar] [CrossRef]
- ICH. ICH Topic Q2 (R1) Validation of Analytical Procedures: Text and Methodology; ICH: Geneva, Switzerland, 2005. [Google Scholar]
- Chen, G.L.; Chen, S.G.; Xiao, Y.; Fu, N.L. Antioxidant capacities and total phenolic contents of 30 flowers. Ind. Crops Prod. 2018, 111, 430–445. [Google Scholar] [CrossRef]
- Zhao, L.; Fan, H.; Zhang, M.; Chitrakar, B.; Bhandari, B.; Wang, B. Edible flowers: Review of flower processing and extraction of bioactive compounds by novel technologies. Food Res. Int. 2019, 126. [Google Scholar] [CrossRef]
- Pimentel-Moral, S.; Borrás-Linares, I.; Lozano-Sánchez, J.; Arráez-Román, D.; Martínez-Férez, A.; Segura-Carretero, A. Microwave-assisted extraction for Hibiscus sabdariffa bioactive compounds. J. Pharm. Biomed. Anal. 2018, 156, 313–322. [Google Scholar] [CrossRef]
- Setyaningsih, W.; Saputro, I.E.; Palma, M.; Barroso, C.G. Stability of 40 phenolic compounds during ultrasound-assisted extractions (UAE). AIP Conf. Proc. 2016, 1755, 080009. [Google Scholar]
- Krishnan, R.Y.; Rajan, K.S. Influence of microwave irradiation on kinetics and thermodynamics of extraction of flavonoids from Phyllanthus emblica. Braz. J. Chem. Eng. 2017, 34, 885–899. [Google Scholar] [CrossRef]
- Amirah; Reddy Prasad, D.M.; Khan, M.R. Comparison of extraction techniques on extraction of gallic acid from stem bark of Jatropha curcas. J. Appl. Sci. 2012, 12, 1106–1111. [Google Scholar] [CrossRef]
- Christian, K.R.; Jackson, J.C. Changes in total phenolic and monomeric anthocyanin composition and antioxidant activity of three varieties of sorrel (Hibiscus sabdariffa) during maturity. J. Food Compos. Anal. 2009, 22, 663–667. [Google Scholar] [CrossRef]

Publisher’s Note: MDPI stays neutral with regard to jurisdictional claims in published maps and institutional affiliations. |
© 2020 by the authors. Licensee MDPI, Basel, Switzerland. This article is an open access article distributed under the terms and conditions of the Creative Commons Attribution (CC BY) license (https://creativecommons.org/licenses/by/4.0/).