Proceeding Paper

Smart Design Nano-Hybrid Formulations by Machine Learning †

by
Raquel de Melo Barbosa
1,*,
Fabio Fonseca de Oliveira
2,
Gabriel Bezerra Motta Câmara
1,2,
Tulio Flavio Accioly de Lima e Moura
1,
Fernanda Nervo Raffin
1 and
Marcelo Augusto Costa Fernandes
2,3
1
Laboratory of Drug Development, Department of Pharmacy, Federal University of Rio Grande do Norte, Natal. Gal Gustavo C Farias street, s/n, Natal 59078-970, Brazil
2
Laboratory of Machine Learning and Intelligent Instrumentation, IMD/nPITI, Federal University of Rio Grande do Norte, Natal 59078-970, Brazil
3
Department of Computer Engineering and Automation, Federal University of Rio Grande do Norte, Natal 59078-970, Brazil
*
Author to whom correspondence should be addressed.
Presented at the 1st International Electronic Conference on Pharmaceutics, 1–15 December 2020; Available online: https://iecp2020.sciforum.net/.
Proceedings 2021, 78(1), 5; https://doi.org/10.3390/IECP2020-08700
Published: 1 December 2020
(This article belongs to the Proceedings of The 1st International Electronic Conference on Pharmaceutics)

Abstract

:
Nano-hybrid formulations combine organic and inorganic materials in self-assembled platforms for drug delivery. Laponite is a synthetic clay, biocompatible, and a guest of compounds. Poloxamines are amphiphilic four-armed compounds and have pH-sensitive and thermosensitive properties. The association of Laponite and Poloxamine can be used to improve attachment to drugs and to increase the solubility of β-Lapachone (β-Lap). β-Lap has antiviral, antiparasitic, antitumor, and anti-inflammatory properties. However, the low water solubility of β-Lap limits its clinical and medical applications. All samples were prepared by mixing Tetronic 1304 and LAP in a range of 1–20% (w/w) and 0–3% (w/w), respectively. The β-Lap solubility was analyzed by UV-vis spectrophotometry, and physical behavior was evaluated across a range of temperatures. The analysis of data consisted of response surface methodology (RMS), and two kinds of machine learning (ML): multilayer perceptron (MLP) and support vector machine (SVM). The ML techniques, generated from a training process based on experimental data, obtained the best correlation coefficient adjustment for drug solubility and adequate physical classifications of the systems. The SVM method presented the best fit results of β-Lap solubilization. In silico tools promoted fine-tuning, and near-experimental data show β-Lap solubility and classification of physical behavior to be an excellent strategy for use in developing new nano-hybrid platforms.

1. Introduction

Nano-hybrid systems have been presented as an attractive platform for drug delivery. These systems combine organic and inorganic materials in self-assembled structures [1]. Laponite (inorganic network, LAP) nanoparticles are disk-like synthetic smectite clays; they are biocompatible, and they have been explored for hybridization with polymers or small molecules to improve the attachment of drugs [2,3,4]. LAP has an empirical formula of Na+0.7[(Si8Mg5.5Li0.3)O20(OH)4]−0.7, and its surfaces exhibit negative charges, whereas the edge charges are pH-dependent. Poloxamines (organic compounds) are amphiphilic four-armed (X-shaped) block copolymers of poly(ethylene oxide)-poly (propylene oxide)-poly(ethylene oxide) with pH-sensitive and thermosensitive properties, being very attractive as drug delivery systems due to the capacity to form nanometric structures as micelles or wormlike micelles, for example [5,6]. Polyamines are commercially available as Tetronic, with different units per arm of poly(propylene oxide) (PPO) and poly(ethylene oxide) (PPE), hydrophilic-lipophilic balance (HBL), and molecular weight [7]. We expect that the polymer (Tetronic) association with clay (LAP) with their respective properties of thermoresponsivity and swelling in aqueous solutions promotes a significant increase in lipophilic drugs’ solubilization. In addition, adjusting the transition of sol-gel phases of the nanocomposites can provide a modified release, depending on the body temperature at the application site [8,9].
β-Lap, a model drug used in this work, is derivated from Lapachol, a natural product, chemically identified as a naphthoquinone, extracted from various species of plants of the bignoniciae family, Tabebuia, found in the northern and northeastern regions of Brazil. β-Lap has antiviral, antiparasitic, antitumor, and anti-inflammatory properties, showing promising potential in various biomedical applications [10]. However, β-Lap has very low water solubility, 0.038 mg mL−1 [11], that limits its systemic administration and clinical applications due to its low bioavailability.
With a wide possibility of combinations between organic and inorganic compounds to develop nanohybrid systems for pharmaceutical or cosmetic products reported in the literature, the optimization of the parameters used during development allows for assessment of the impact of each variable (input data) on the target (output data). One such approach is the response surface methodology (RSM), a technique created in 1951 by Box and Wilson [12] and widely used in the chemical industry to optimize experimental procedures with a reduced set of experiments. RSM is used to indicate an ideal operational region through mathematical models capable of predicting the impact of various factors related to a process, both individually and cumulatively, in response to a system [13].
Machine learning (ML) has been increasingly used as a predictive tool in different knowledge areas, such as telecommunications, electronics, bioengineering, and medicine since the last decade of the twentieth century. ML techniques allow analysis and extraction of new insights, accelerated discoveries of materials and structures, and planning of new experiences in an optimized way [14]. ML tools, such as support vector machine (SVM) and multilayer perceptron (MLP), use learning algorithms and discriminate the input and output relationships for complex non-linear systems, requiring a good set of inputs/outputs for shaping the knowledge of the algorithm to provide the regression analysis and classification parameters [14]. Although MLP is used to achieve regression models closer to the real thing (more predictive), it is necessary for many experimental data for training and validation (14). In contrast, the SVM model works very well with small datasets, generating good results concerning response surfaces and data classification [15,16,17].
Both RSM and ML (SVM and MLP) were applied to optimize different T1304 and LAP concentrations to find the most efficient formulations to solubilize β-Lap. The resulting prediction models must demonstrate a strong correlation with the experimental results. In addition, ML (SVM) also simulated the physical behavior of the samples [15,16,17].

2. Experiments

2.1. Materials

Tetronic® 1304 (10,500 Dalton, T1304 (21 PEO and 27 PPO units), HBL: 12–18) was kindly gifted by the BASF Corporation (Ludwigshafen, Germany). Laponite RD also was kindly donated by BYK Additives & Instruments (Wesel, Germany). The β-Lap, a drug model used in this work, was synthesized from Lapachol by acidic cyclization at acid (H2SO4) and low temperature conditions by Professor Celson Camara from Federal Rural University of Pernambuco (UFPE, Recife, Brazil). All other chemicals used in this work were of analytical grade and commercially available.

2.2. Methods

2.2.1. Preparation of the Nanocarriers

The nanocarrier (single and hybrid) systems’ preparation consists of a mixture of Tetronic and a dispersion of LAP in the water previously stirred for 20 min. After the components (T1304 and LAP) were mixed, the samples were kept under stirring for 24 h. The nano-hybrid formulations studied in this work comprised different T1304 concentrations (1, 5, 10, 15, and 20%, w/w) with and without LAP (1.5 or 3%, w/w). All samples were prepared in triplicate at natural pH (~8.2 for nanocarriers in absence of LAP and ~10 in presence of LAP).

2.2.2. Characterization of the Nanocarriers

Experimental Design Using the Central Composite Design
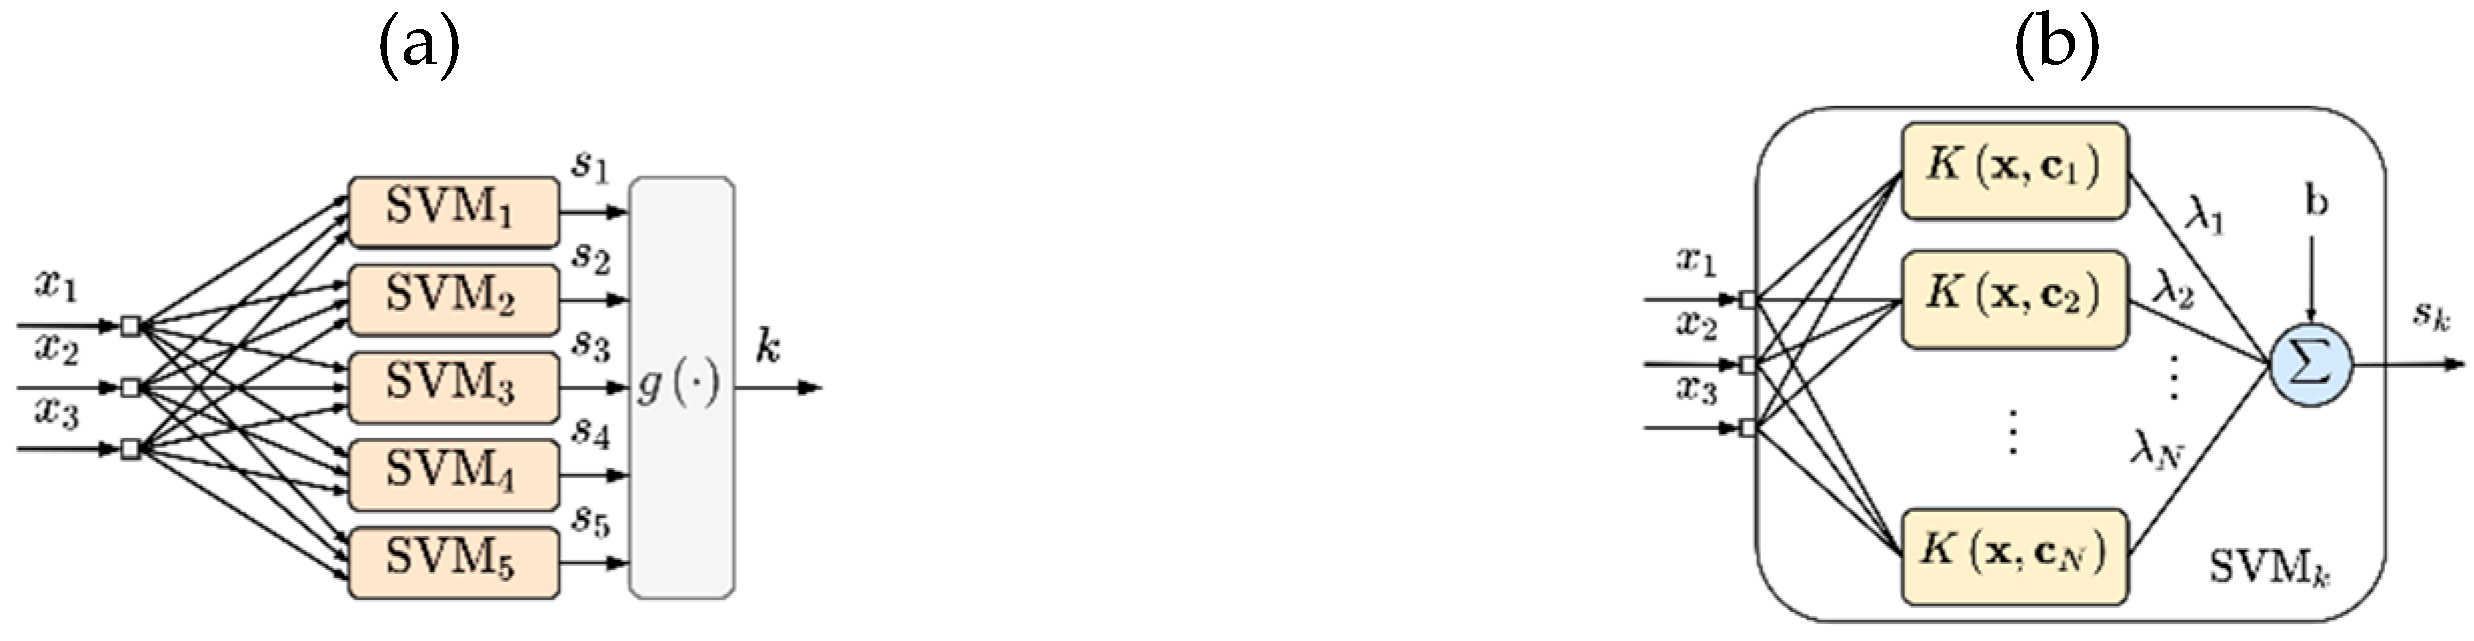
Experimental results of β-Lap solubility were organized in the factorial design of central composite design (CCD), with a 32 design (two factors and three levels) according to Table 1. The efficiency of the method (the coefficient of determination (R2) of the surface) was obtained using the computational tool MATLAB 2020 (License 650662, Mathworks, Natick, MA, USA). The resultant solubility surface of β-Lap can be expressed as:
β Lap ( μ g   mL 1 ) = β 0 + β 1 x 1 + β 2 x 2 + β 11 x 1 2 + β 22 x 2 2 + β 12 x 1 x 2 ,
where β n represents the n -th linear and quadratic coefficient of the independent variables, the T1304 ( x 1 ) and LAP ( x 2 ) concentrations.

Machine Learning

MLP and SVM set-up-to-surface Response: Figure 1a,b show the MLP and SVM used to create the surface response, respectively. Like the RSM method (see Equation (1)), x 1 and x 2 represent the independent variables, the T1304 and LAP concentrations, respectively. Both MLP and SVM used two variables on the input layer, which were the proportions of T1304 and LAP (see Table 1). For the output layer, both ML techniques used β-Lap solubility data. MLP used two hidden layers (with 16 neurons), the sigmoid activation function in all hidden neurons, and the linear function in the output neuron. The training step used the Levenberg-Marquardt backpropagation [14,15,16]. The SVM used the sequential minimal optimization (SMO) algorithm in the training step, and the Gaussian kernels are expressed as:
K ( x , c i ) = e 1 2 σ || x c i || 2 ,
where x = [ x 1 ,   x 2 ] and c i is the centre of the i -th kernel [14,15,16]. Both ML techniques used 90% of the samples for the training phase and 10% for the validation step.
SVM set-up to phase behaviour classification: Figure 2a,b illustrates the SVM used to classify the phase behaviour. As the SVM makes a binary classification, a pool of the five SVMs, one of each class, was employed. Each class represents the solution’s phase behavior: liquid ( k = 1 ), viscous liquid ( k = 2 ), gel ( k = 3 ), strong gel ( k = 4 ), and solid ( k = 5 ) (see Table 2). Each k -th SVM of the pool ( SVM k ) was configured with three inputs: the proportion of T1304 ( x 1 ), the proportion of LAP ( x 2 ), and the mixture’s temperature ( x 3 ) in degrees celsius. One output ( s k ) where 0 s k 1 (see Figure 2a) was also employed. The kernels in each k -th SVM ( SVM k ) were the Gaussian (see Equation (2)), and the SVM was also used SMO in the training algorithm. The output of the classifier ( k ) can be expressed as
k = g ( index 1 k 5 ( max { s 1 , s 2 , s 3 , s 4 , s 5 } ) ) .
The dataset used for training and validation of the SVM classification model was chosen at random and corresponded to 80% and 20%, respectively.
The data used in RSM followed the same input and output schemes as the ML (SVM and MLP), and the implementations were made with MATLAB 2020 (License 650662, Mathworks, Natick, MA, USA). Table 3 shows the additional values (beyond Table 1) used to training (assays 1–12 in Table 1 and 12–18 in Table 3) and validating (assays 19–21 in Table 3) the ML techniques.

Experimental Procedure

Solubility of β-Lap in the Nanocarriers

The maximum solubility of β-Lap was evaluated by adding an excess of the drug (5 mg) in vials with all nanocarrier systems mentioned in Section 2.2. The samples were kept under continuous agitation for 10 days, uninterrupted, using the Blood Homogenizer and Solutions Model AP 22 (Phoenix-Luferco, Araraquara, Brazil). After stirring, the samples were centrifuged (14,000 rpm for 15 min at 20 °C), and the supernatant was quantified by UV-Vis spectrophotometry at 257 nm. The concentration of β-Lap was found by the equation obtained from the linear regression given by the calibration curve (2–10 μg mL−1) of β-Lap in ethanolic solution (1:1) y = 0.1123x + 0.0041, where y is the drug concentration (μg mL−1) and x is the absorbance measured by the equipment, R2 = 0.9998 [11].

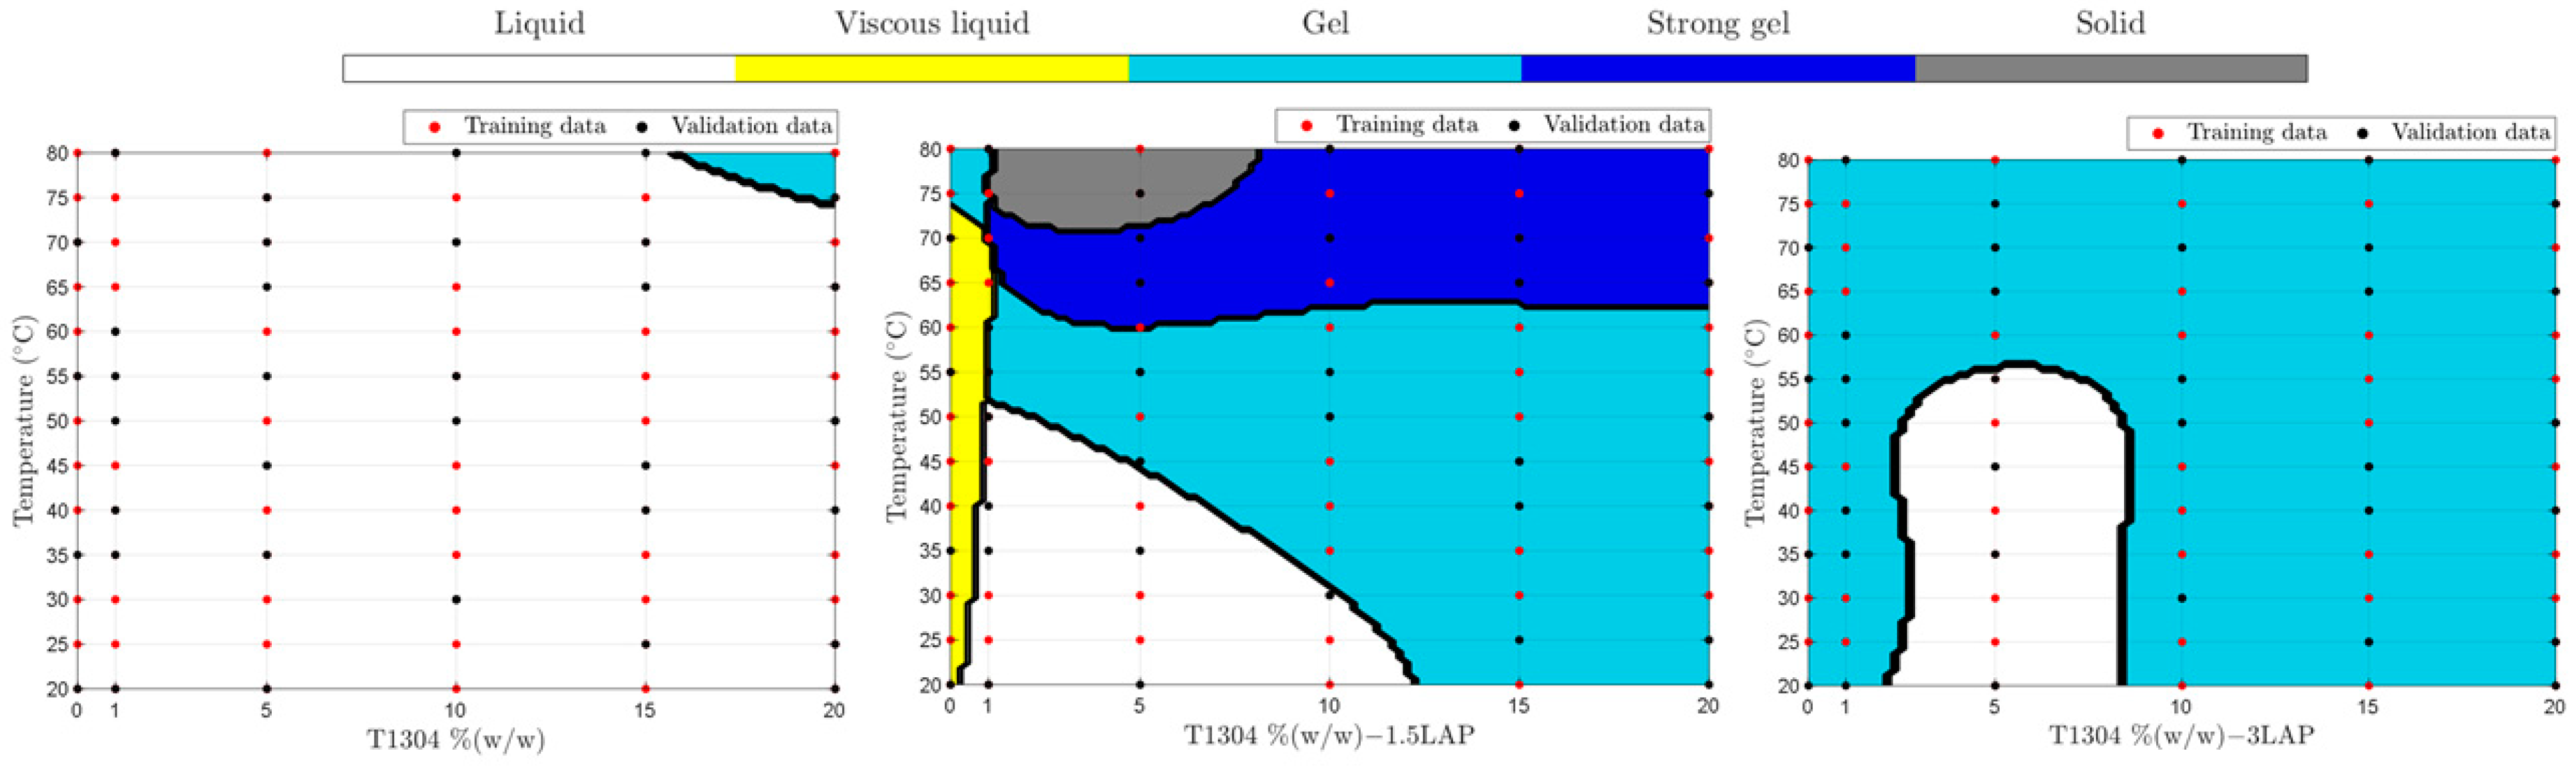
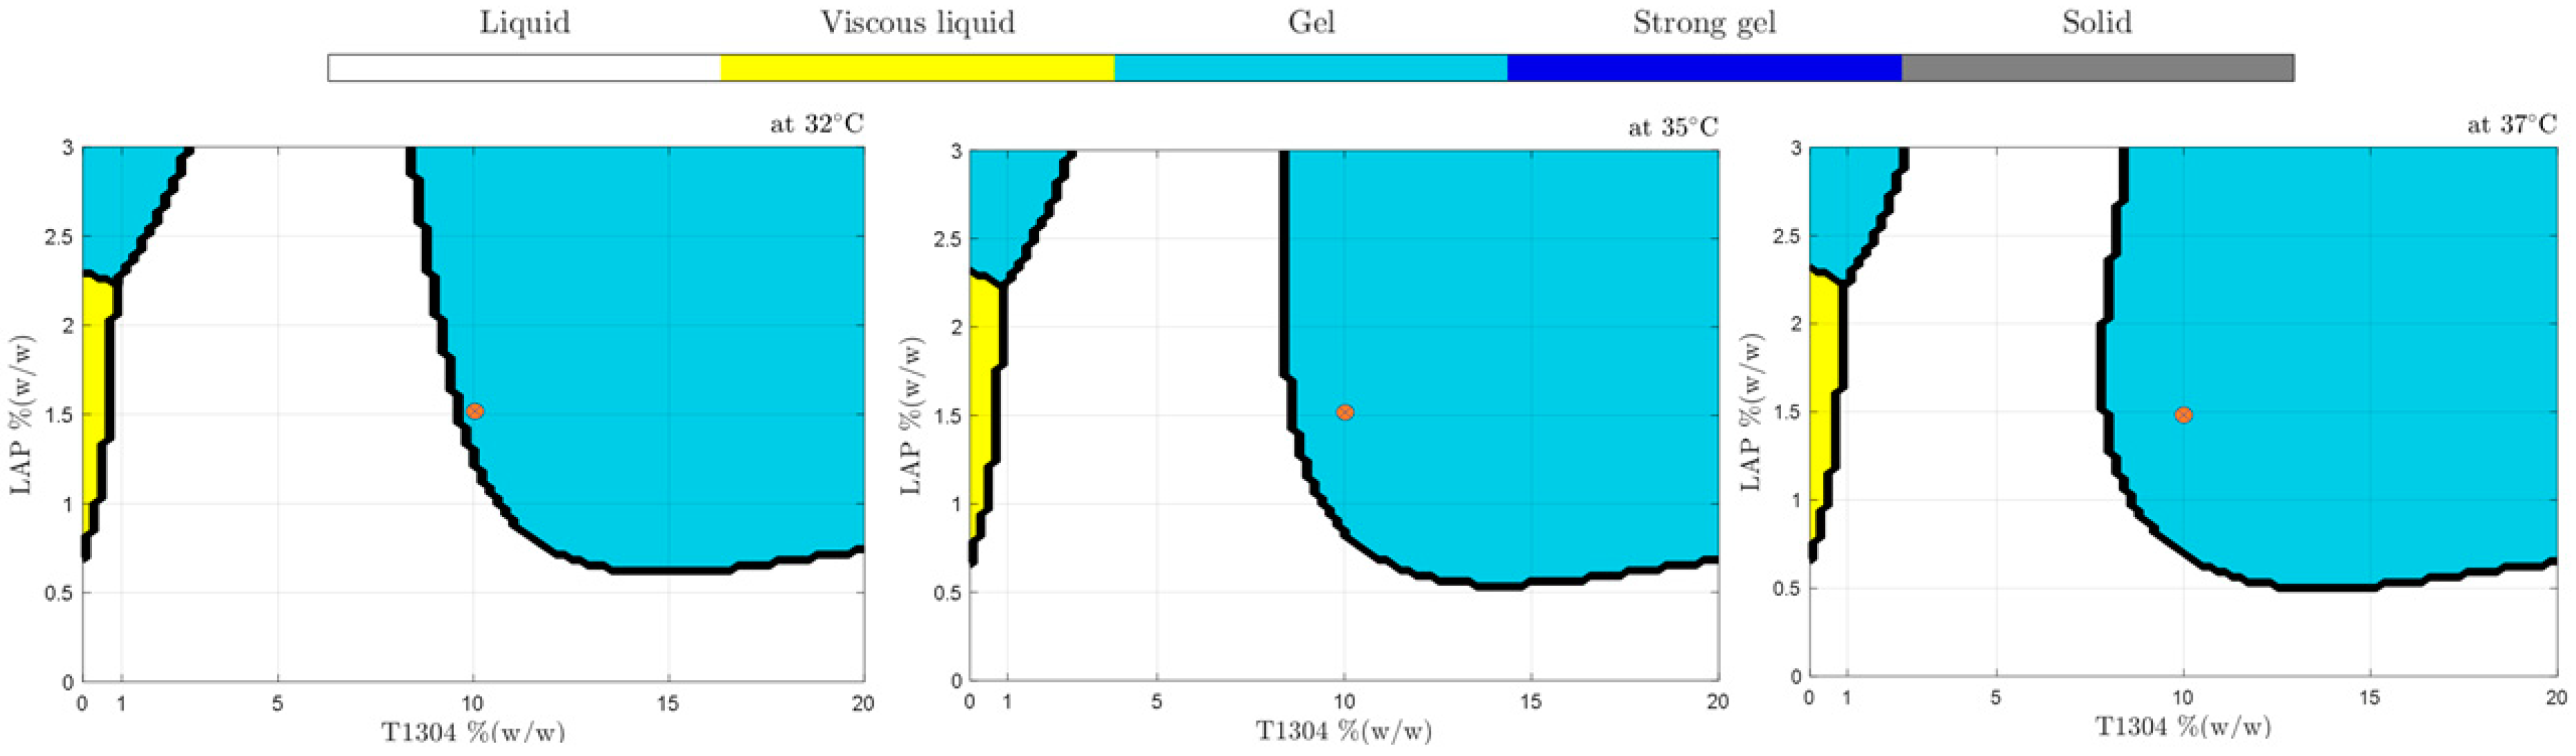
Phase Behavior of Nanocarriers

The phase behavior of the samples was determined by visual observation after a gradual increase of temperature using a water bath in the range of 20 to 80 °C and in increments of 5 °C. The samples T1304 (1–20%, w/w) with LAP (0–3%, w/w) were submitted of heat at 10-min intervals at each temperature. The samples were made in triplicates at their natural pH, as described in Section 2.2.1. Table 2 presents the parameters used to classify the phase behavior of samples during the temperature’s ramp.

3. Results and Discussion

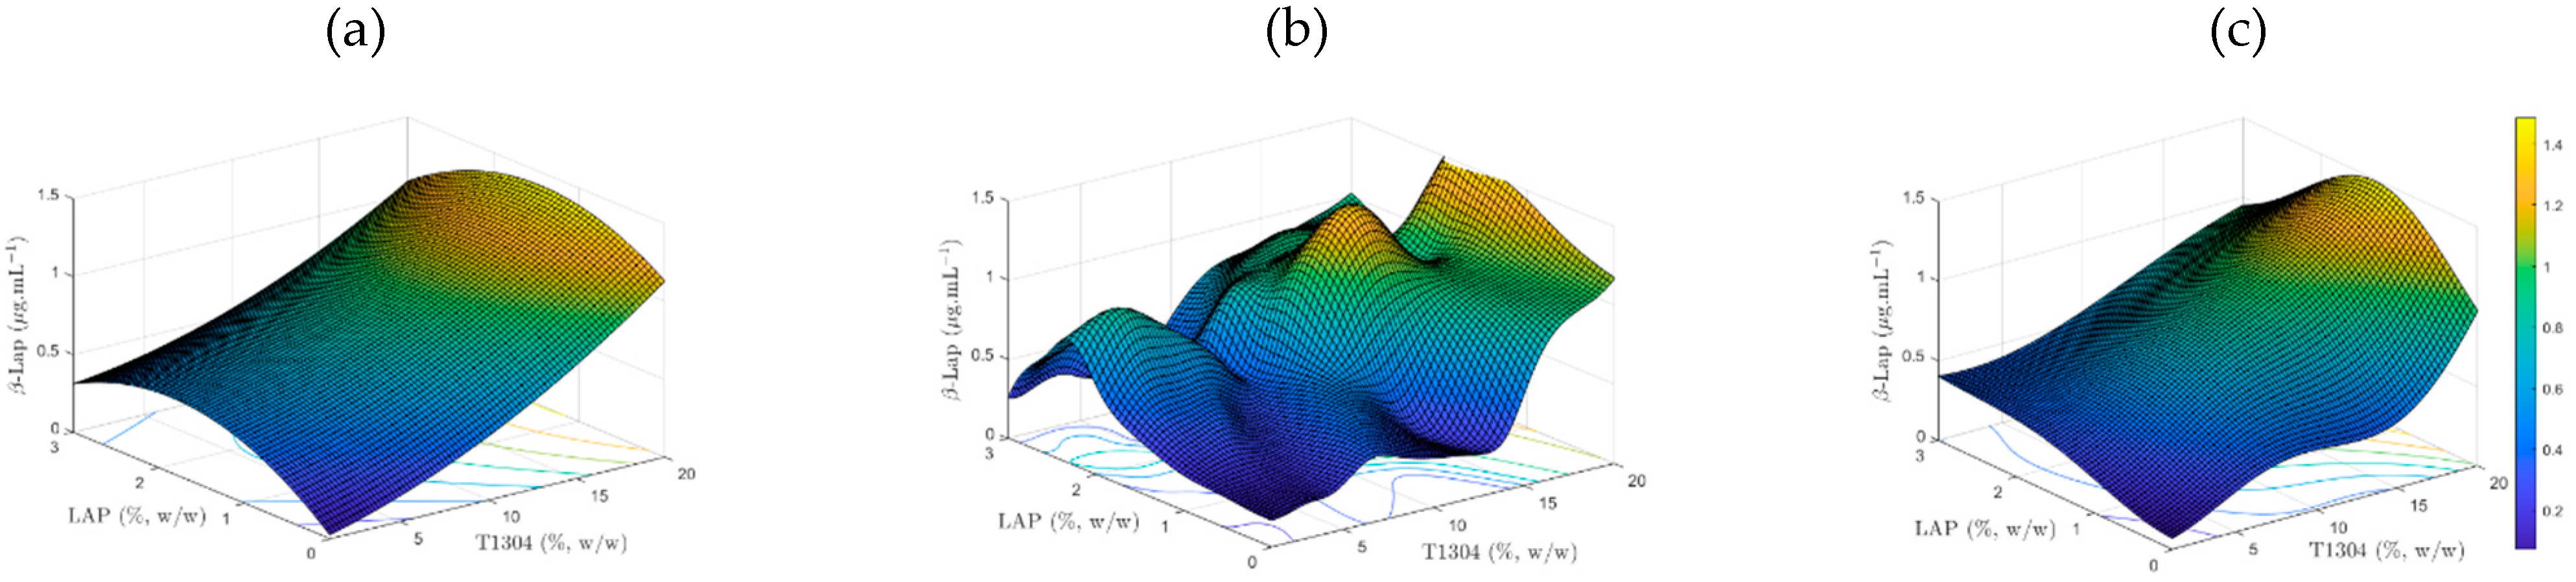
3.1. β-Lap Solubility Studies

Figure 3a–c presents the surface response concerning the influence of the concentrations of T1304 and LAP on the solubility of β-Lap for the RSM, MLP, and SVM methods, respectively. In addition, the regression model used only 13 kernels.
Table 4 presents the coefficients (β1–5,) obtained from the RSM model, and Table 5 shows the mean square error (MSE) and R-squared coefficient (R2) calculated from the resulted models of the RSM, MLP, and SVM. For the RSM, the MSE and R2 were calculated to the fitting values (assays 1–12 in Table 1) and validation values (assays 19–21 in Table 3). For MLP and SVM, the MSE and R2 were calculated to the training values (assays 1–9 in Table 1) and validation values (assays 19–21 in Table 3).
Based on Table 5, the SVM had better results than the other two techniques, MLP and RSM. The surface found from the RSM methodology is limited by Equation (1). This characteristic allows for creation of the standard surface. However, this approach can mask some behavior in the found surface. On the other hand, the MLP method had a measure closer to the training points provided, although in some regions found on the surface, there were abrupt changes. In terms of MSE, the results of MLP and RSM are similar; however, the MLP has better results in terms of R2. The SVM machine had a smooth behavior throughout the change of the surface variables T1304 ( x 1 ) and LAP ( x 2 ), and it had the smallest MSE and the most R2 (Table 5). The reduced number of samples to training MLP is an important aspect to observe, mainly when planning an MLP machine. In this context, the SVM algorithm appears to be the best alternative because it does not require the same condition as an MLP.

3.2. Phase Behavior Classification by SVM

Figure 4 shows samples’ physical behavior with different concentrations of T1304 with or without LAP over a wide temperature range after training and data validation using SVM. The implementation of the physical behavior classification by SVM used 58, 50, 7, 25, and 22 kernels on SVM 1 , SVM 2 , SVM 3 , SVM 4 , and SVM 5 , respectively.
According to Figure 4, samples with T1304 (1–20%, w/w) (without LAP) showed up as liquid samples in practically all studied concentrations in the broad range of temperatures studied; only above 75 °C was a phase transition behavior promoted (sol-gel). In addition, Figure 4 shows the positive LAP influence as an ingredient of formulation and capable of changing their sample’s physical behavior against different temperatures. According to the results, at 1.5% of LAP, it was possible to obtain samples with five different physical states in different temperatures, demonstrating that they are good candidates for future studies to develop nanocarriers of drug delivery. The use of nano-hybrid systems with a transition phase from sol-gel to body temperatures, such as 32 °C, 35 °C, and 37 °C (Figure 5), is very promising and can improve characteristics such as the release or the bioavailability of drugs.
Prediction models based on machine learning techniques with an accurate response and high effectiveness have been increasingly used to develop pharmaceutical formulations. The purpose of using predictive techniques is to minimize costs (materials, equipment, workers, among others) and accelerate the development of new medicine with desired target characteristics. Figure 6a,b shows slices of the samples’ phase diagram at temperatures of 20 to 40 °C (a) and from 40 to 80 °C obtained by SVM. It is possible to observe that ML is demonstrated to be an excellent optimization tool for pharmaceutical formulations.

4. Conclusions

The association of Tetronic and Laponite in different concentrations allowed the formation of systems that present different phase behaviors as a function of temperature. LAP had a great influence in the liquid-gel transition of the systems. β-Lap solubility had an expressive increase in samples T1304 (over 10%) and 1.5% LAP, or systems with only LAP (1.5%). In silico ML tools, SVM promoted fine-tuning and near-experimental data, shown to be an excellent strategy for use in the development of new nano-hybrid platforms.

Author Contributions

Data curation, F.F.d.O. and G.B.M.C.; Funding acquisition, F.N.R.; Methodology, R.d.M.B.; Project administration, M.A.C.F.; Supervision, R.d.M.B.; Writing—original draft, R.d.M.B.; Writing—review & editing, T.F.A.d.L.eM., F.N.R. and M.A.C.F. All authors have read and agreed to the published version of the manuscript.

Funding

This research was financially supported by CAPES [1975/2015] and CAPES [1777580].

Institutional Review Board Statement

Not applicable.

Informed Consent Statement

Not applicable.

Acknowledgments

We acknowledge the collaboration of Celso Amorim Câmara from Department of Chemistry, Federal Rural University of Pernambuco, Recife, Pernambuco, Brazil for synthesis of β-Lap, BASF Corporation (Ludwigshafen, Germany) and by the BYK Additives & Instruments (Wesel, Germany) for donation of Tetronic® 1304 and LAP, respectively.

Conflicts of Interest

The authors declare no conflict of interest.

References

  1. Faustini, M.; Nicole, L.; Ruiz-Hitzky, E.; Sanchez, C. History of Organic–Inorganic Hybrid Materials: Prehistory, Art, Science, and Advanced Applications. Adv. Funct. Mater. 2018, 28, 1704158. [Google Scholar] [CrossRef]
  2. Aguzzi, C.; Cerezo, P.; Viseras, C.; Caramella, C. Use of Clays as Drug Delivery Systems: Possibilities and Limitations. Appl. Clay Sci. 2007, 36, 22–36. [Google Scholar] [CrossRef]
  3. Haraguchi, K.; Farnworth, R.; Ohbayashi, A.; Takehisa, T. Compositional Effects on Mechanical Properties of Nanocomposite Hydrogels Composed of Poly (N, N-Dimethylacrylamide) and Clay. Macromolecules 2003, 36, 5732–5741. [Google Scholar] [CrossRef]
  4. Chang, C.-W.; van Spreeuwel, A.; Zhang, C.; Varghese, S. PEG/Clay Nanocomposite Hydrogel: A Mechanically Robust Tissue Engineering Scaffold. Soft Matter. 2010, 6, 5157–5164. [Google Scholar] [CrossRef]
  5. Schmolka, I.R. A Review of Block Polymer Surfactants. J. Am. Oil Chemists Soc. 1977, 54, 110–116. [Google Scholar] [CrossRef]
  6. Alexandridis, P. Poly (Ethylene Oxide)/Poly (Propylene Oxide) Block Copolymer Surfactants. Curr. Opin. Colloid Interface Sci. 1997, 2, 478–489. [Google Scholar] [CrossRef]
  7. Alvarez-Lorenzo, C.; Rey-Rico, A.; Sosnik, A.; Taboada, P.; Concheiro, A. Poloxamine-Based Nanomaterials for Drug Delivery. Front. Biosci. 2010, 2, 424–440. [Google Scholar] [CrossRef] [PubMed]
  8. Pelegrino, M.T.; de Araújo, D.R.; Seabra, A.B. S-Nitrosoglutathione-Containing Chitosan Nanoparticles Dispersed in Pluronic F-127 Hydrogel: Potential Uses in Topical Applications. J. Drug Deliv. Sci. Technol. 2018, 43, 211–220. [Google Scholar] [CrossRef]
  9. dos Santos, A.C.M.; Akkari, A.C.S.; Ferreira, I.R.S.; Maruyama, C.R.; Pascoli, M.; Guilherme, V.A.; de Paula, E.; Fraceto, L.F.; de Lima, R.; da Silva Melo, P.; et al. Poloxamer-Based Binary Hydrogels for Delivering Tramadol Hydrochloride: Sol-Gel Transition Studies, Dissolution-Release Kinetics, in Vitro Toxicity, and Pharmacological Evaluation. Int. J. Nanomed. 2015, 10, 2391. [Google Scholar]
  10. da Silva, M.N.; Ferreira, V.F.; de Souza, M.C.B. An Overview of the Chemistry and Pharmacology of Naphthoquinones with Emphasis on B-Lapachone and Derivatives. Química Nova 2003, 26, 407–416. [Google Scholar]
  11. dos Santos, K.M.; de, M. Barbosa, R.; Vargas, F.G.A.; de Azevedo, E.P.; da S. Lins, A.C.; Camara, C.A.; Aragão, C.F.; de Limia E. Moura, T.F.; Raffin, F.N. Development of Solid Dispersions of β-Lapachone in PEG and PVP by Solvent Evaporation Method. Drug Dev. Ind. Pharm. 2018, 44, 750–756. [Google Scholar] [CrossRef] [PubMed]
  12. Box, G.E.; Wilson, K.B. On the Experimental Attainment of Optimum Conditions. J. R. Stat. Soc. Ser. B Methodol. 1951, 13, 1–38. [Google Scholar] [CrossRef]
  13. Singh, B.; Chakkal, S.K.; Ahuja, N. Formulation and Optimization of Controlled Release Mucoadhesive Tablets of Atenolol Using Response Surface Methodology. Aaps Pharmscitech 2006, 7, E19–E28. [Google Scholar] [CrossRef] [PubMed]
  14. Boulogeorgos, A.-A.A.; Trevlakis, S.E.; Tegos, S.A.; Papanikolaou, V.K.; Karagiannidis, G.K. Machine Learning in Nano-Scale Biomedical Engineering. arXiv 2020, arXiv:2008.02195. [Google Scholar] [CrossRef]
  15. Pereira, A.K.V.; de M. Barbosa, R.; Fernandes, M.A.C.; Finkler, L.; Finkler, C.L.L. Comparative Analyses of Response Surface Methodology and Artificial Neural Networks on Incorporating Tetracaine into Liposomes. Braz. J. Pharm. Sci 2020, 56. [Google Scholar] [CrossRef]
  16. Sun, Y.; Peng, Y.; Chen, Y.; Shukla, A.J. Application of Artificial Neural Networks in the Design of Controlled Release Drug Delivery Systems. Adv. Drug Deliv. Rev. 2003, 55, 1201–1215. [Google Scholar] [CrossRef]
  17. Ekins, S.; Puhl, A.C.; Zorn, K.M.; Lane, T.R.; Russo, D.P.; Klein, J.J.; Hickey, A.J.; Clark, A.M. Exploiting Machine Learning for End-to-End Drug Discovery and Development. Nat. Mater. 2019, 18, 435. [Google Scholar] [CrossRef] [PubMed]
Figure 1. Schematic representation of multilayer perceptron (MLP) (a) and support vector machine (SVM) (b) models used for surface response of β-Lap solubility in the samples of nanocarriers.
Proceedings 78 00005 g001
Figure 2. Schematic representation of SVM (a) models used for classification of physical the samples of nanocarriers. (b) k-th SVM used to k-th class.
Proceedings 78 00005 g002
Figure 3. β-Lap solubility response surface: RSM (a), MLP (b), and SVM (c).
Proceedings 78 00005 g003
Figure 4. Phase behavior of different concentrations of T1304 and LAP from 20 to 80 °C ramp, classified by SVM. The red dots are values used for ML training, and the black dots are values used for ML validation.
Proceedings 78 00005 g004
Figure 5. Phase behavior diagrams of different concentrations of T1304 and LAP classified by SVM at 32, 35, and 37 °C. The red dot highlights that small temperature changes generate alterations in the physical state of samples, such as 10% T1304 and 1.50% LAP.
Proceedings 78 00005 g005
Figure 6. Phase behavior diagrams of different concentrations of T1304 and LAP classified by SVM at ramp from 20 °C to 40 °C (a) and from 40 °C to 80 °C (b).
Proceedings 78 00005 g006
Table 1. Factorial design of experiment with two factors and three levels, 32.
Assays T 1304   ( x 1 ) LAP   ( x 2 ) β - Lap   *
Coded Level% (w/w)Coded Level% (w/w) μ g   mL 1
1−11−10.00.1206
2−1101.50.2600
3−11+13.00.4264
4010−10.00.4281
5010+13.00.5103
6+120−10.01.0211
7+12001.51.6062
8+120+13.00.9988
901001.50.7875
1001001.50.8010
1101001.50.7780
1201001.50.7650
Note: * β-Lap: obtained from solubility studies described in section (Solubility of β-Lap in the nanocarriers).
Table 2. Classification of phase behavior of nanocarriers.
Phase BehaviorParameters of Classification
Liquidliquid samples are clear aqueous dispersions unable to hold their weight against gravity in and inverted vial.
Viscous liquidviscous liquid samples are thicker liquids: liquid flow occurs more slowly and is still unable to hold its weight against gravity in an inverted vial.
Gelgel samples are clear gel dispersions and able to hold their weight against gravity in an inverted vial, but come off when shaken
Strong gelstrong gel samples are clear gel dispersions and able to hold their weight against gravity in an inverted vial but does not come off when shaken.
SolidPhase separation leading to a solid cluster suspended in the fluid.
Table 3. Additional values were applied to training and validate the ML (SVM and MLP).
Assays T 1304   ( x 1 ) LAP   ( x 2 ) β - Lap   *
Coded Level% (w/w)Coded Level
1350.00.2092
1451.50.4792
1553.00.3617
16150.00.3639
17151.51.1375
18153.00.8039
1980.00.4618
20201.00.1397
21202.01.2785
Note: * β-Lap: obtained from solubility studies described in section (Solubility of β-Lap in the nanocarriers).
Table 4. The coefficients (β1–5,) obtained from the RSM model.
ParametersValuesParametersValues
β0−0.0005β110.0015
β10.0262β22−0.1345
β20.5031β12−0.0057
Table 5. Comparison between the techniques used.
Surface MethodMSE R 2
FittingVal.FittingVal.
RSM0.01050.01090.92790.9368
TrainingVal.TrainingVal.
MLP0.01060.00980.93320.9433
SVM0.00300.00450.98140.9737
Publisher’s Note: MDPI stays neutral with regard to jurisdictional claims in published maps and institutional affiliations.

