Article

A Global Multi-Scale Channel Adaptation Network for Pine Wilt Disease Tree Detection on UAV Imagery by Circle Sampling

1
Hubei Engineering Technology Research Center for Farmland Environmental Monitoring, China Three Gorges University, Yichang 443000, China
2
State Grid Yichang Power Supply Company, Yichang 443000, China
*
Author to whom correspondence should be addressed.
Drones 2022, 6(11), 353; https://doi.org/10.3390/drones6110353
Submission received: 30 September 2022 / Revised: 3 November 2022 / Accepted: 8 November 2022 / Published: 15 November 2022

Abstract

:
Pine wilt disease is extremely ruinous to forests. It is an important to hold back the transmission of the disease in order to detect diseased trees on UAV imagery, by using a detection algorithm. However, most of the existing detection algorithms for diseased trees ignore the interference of complex backgrounds to the diseased tree feature extraction in drone images. Moreover, the sampling range of the positive sample does not match the circular shape of the diseased tree in the existing sampling methods, resulting in a poor-quality positive sample of the sampled diseased tree. This paper proposes a Global Multi-Scale Channel Adaptation Network to solve these problems. Specifically, a global multi-scale channel attention module is developed, which alleviates the negative impact of background regions on the model. In addition, a center circle sampling method is proposed to make the sampling range of the positive sample fit the shape of a circular disease tree target, enhancing the positive sample’s sampling quality significantly. The experimental results show that our algorithm exceeds the seven mainstream algorithms on the diseased tree dataset, and achieves the best detection effect. The average precision (AP) and the recall are 79.8% and 86.6%, respectively.

1. Introduction

Pine wilt disease is an epidemic disease of pine trees that is devastating to forests. It has the characteristics of rapid onset, long latent time, hidden location, difficulty to find, inconvenient treatment, and so on [1]. It will cause many diseased trees to die once pine wilt disease has started to spread [2]. If the diseased trees are not detected and cleared early, the disease will cause great damage to the forest ecosystem and bring huge economic losses to the country. To prevent pine wilt disease from destroying forest resources, it is necessary to clean up the infected diseased trees in time. Because the diseased tree will have the characteristics of yellow-brown, red-brown, and other color transformations [3], the monitoring of the discolored diseased tree is an important means to control the spread of the epidemic.
At present, the monitoring of diseased trees relies on field inspection by workers and unmanned aerial vehicle inspection, in many countries and cities and mainly [4]. Field inspection by workers requires forestry personnel to go deep into the forest area to check the diseased trees [5], which has problems such as long inspection time, high labor cost, low efficiency, and difficulty in inspecting the diseased trees in deep mountain forests. For this reason, Li Weizheng et al. began to patrol diseased trees by using UAV remote sensing images [6], which can monitor diseased trees in deep mountains and dense forests, greatly improving the patrol efficiency and expanding the patrol scope. However, the UAVs patrol method still uses manual visual identification of the captured images [7], which has low identification efficiency, subjectivity is strong, heavy workload, and other problems [8,9]. During these years, deep learning technology has been used to detect the various remote sensing images taken by UAVs, and has been widely used in the field of forest monitoring [10,11,12,13,14]. Some scholars began to use deep learning technology to detect pine wilt diseased trees under the remote sensing images of UAVs [15,16]. Wang Chen et al. used the K-means clustering algorithm to reset the anchor size to detect pine wilt diseased trees based on the YOLOv3 algorithm [17]. Huang Liming et al. improved YOLOv4 by using deep separable convolution and used the improved YOLOv4 algorithm to identify abnormal discolored wood with pine wilt disease [18]. At present, existing object detection research methods have a certain detection effect on the detection of pine wilt disease tree, but their approach ignored the complex background information that the UAV image interferes with the extraction of the features of the diseased tree by the algorithm [19,20], resulting in the insufficient extraction of the features of the diseased tree by the algorithm. In addition, the positive sampling range is rectangular in the existing positive and negative sample sampling methods, but the shape of the diseased tree is circular in the high-altitude UAV orthophoto image. This makes the rectangular sampling range of the positive samples not match the shape of the diseased tree, resulting in noise labels on the positive samples collected, which reduces the confidence and accuracy of the model for diseased tree recognition.
To solve these above problems, this paper proposes a Global Multi-Scale Channel Adaptation Network for diseased tree detection on UAV imagery by circle sampling. Firstly, we propose a global multi-scale channel attention (GMCA) module to enhance the feature extraction ability of our network to the diseased tree by introducing the GMCA module into the feature pyramid networks (FPN) module, to relieve the adverse effects of complex background on the model recognition accuracy. Moreover, a new positive and negative sample sampling method is proposed by us to let the sampling range of positive samples be a circle, which is in line with the shape of our diseased tree target to improve the sampling quality of positive samples when the model is sampled. For the dataset of pine wilt disease tree, our method obtains better recall and average precision compared with other mainstream detection algorithms and is suitable for large-scale pine forest epidemic monitoring tasks.
The rest of this paper is summarized as follows: Section 2 summarizes the relevant data information of our experiment, the experimental parameter design, and the experimental methods we proposed. In Section 3, the results of our comparative experiments and ablation experiments are presented. In Section 4, based on the existing research methods and research basis, this paper discusses the effectiveness of our proposed method. Finally, Section 5 summarizes the work of this paper and looks forward to future research directions.

2. Materials and Methods

2.1. Data Acquisition and Dataset Production

In the experiment, we selected the pine wilt disease tree images of Yiling District and Yidu county forest area in Yichang City, Hubei Province, in 2021, by UAV, as the data source. The ground resolution of the UAV image is 0.05 m. Then, we cut the UAV images to a size of 1000 × 1000 pixels. Finally, 2014 images of diseased trees were annotated with the labelImg tool and made into the dataset of pine wilt disease trees in VOC format. To reduce the false detection rate of the diseased tree, we divided the labeled rectangular targets into two categories. Among them, the diseased pine tree is labeled as one class as the positive class sample, and the red car, red roof, and red bare ground are labeled as one class as the negative class sample. The dataset is randomly divided into the training set, validation set, and test set according to the ratio of 8:1:1. The distribution of the divided data set is shown in Table 1:
As shown in the dataset distribution table, our training set has 3415 diseased tree targets, the validation set has 380 diseased tree targets, and the test set has 427 diseased tree targets, of which there are only two targets in a single image, on average.
The statistical analysis of the target scale in the data set of pine wood nematode disease trees made by us, is shown in Figure 1:

2.2. Experimental Environment

The hardware environment of the experiment is Nvidia GeForce GTX 3090 GPU and 128 G memory server. The operating system is Ubuntu 18.04, and PyTorch is used as the deep learning framework for training and testing. Each model trains 24 epochs. The initial learning rate is set to 0.001, the batch size is set to 4, the optimization method is random gradient descent (SGD), the momentum is set to 0.9, and the regularization coefficient is set to 0.0001.

2.3. Detection Algorithm Model

In this section, the proposed method is introduced in detail. Firstly, Section 2.3.1 describes the Global Multi-Scale Channel Adaptive Network in detail in terms of network structure and hierarchical detection mechanism. Then, Section 2.3.2 introduces the global multi-scale channel attention (GMCA) module proposed. Finally, Section 2.3.3 describes the center circle sampling (gts-circle) method.

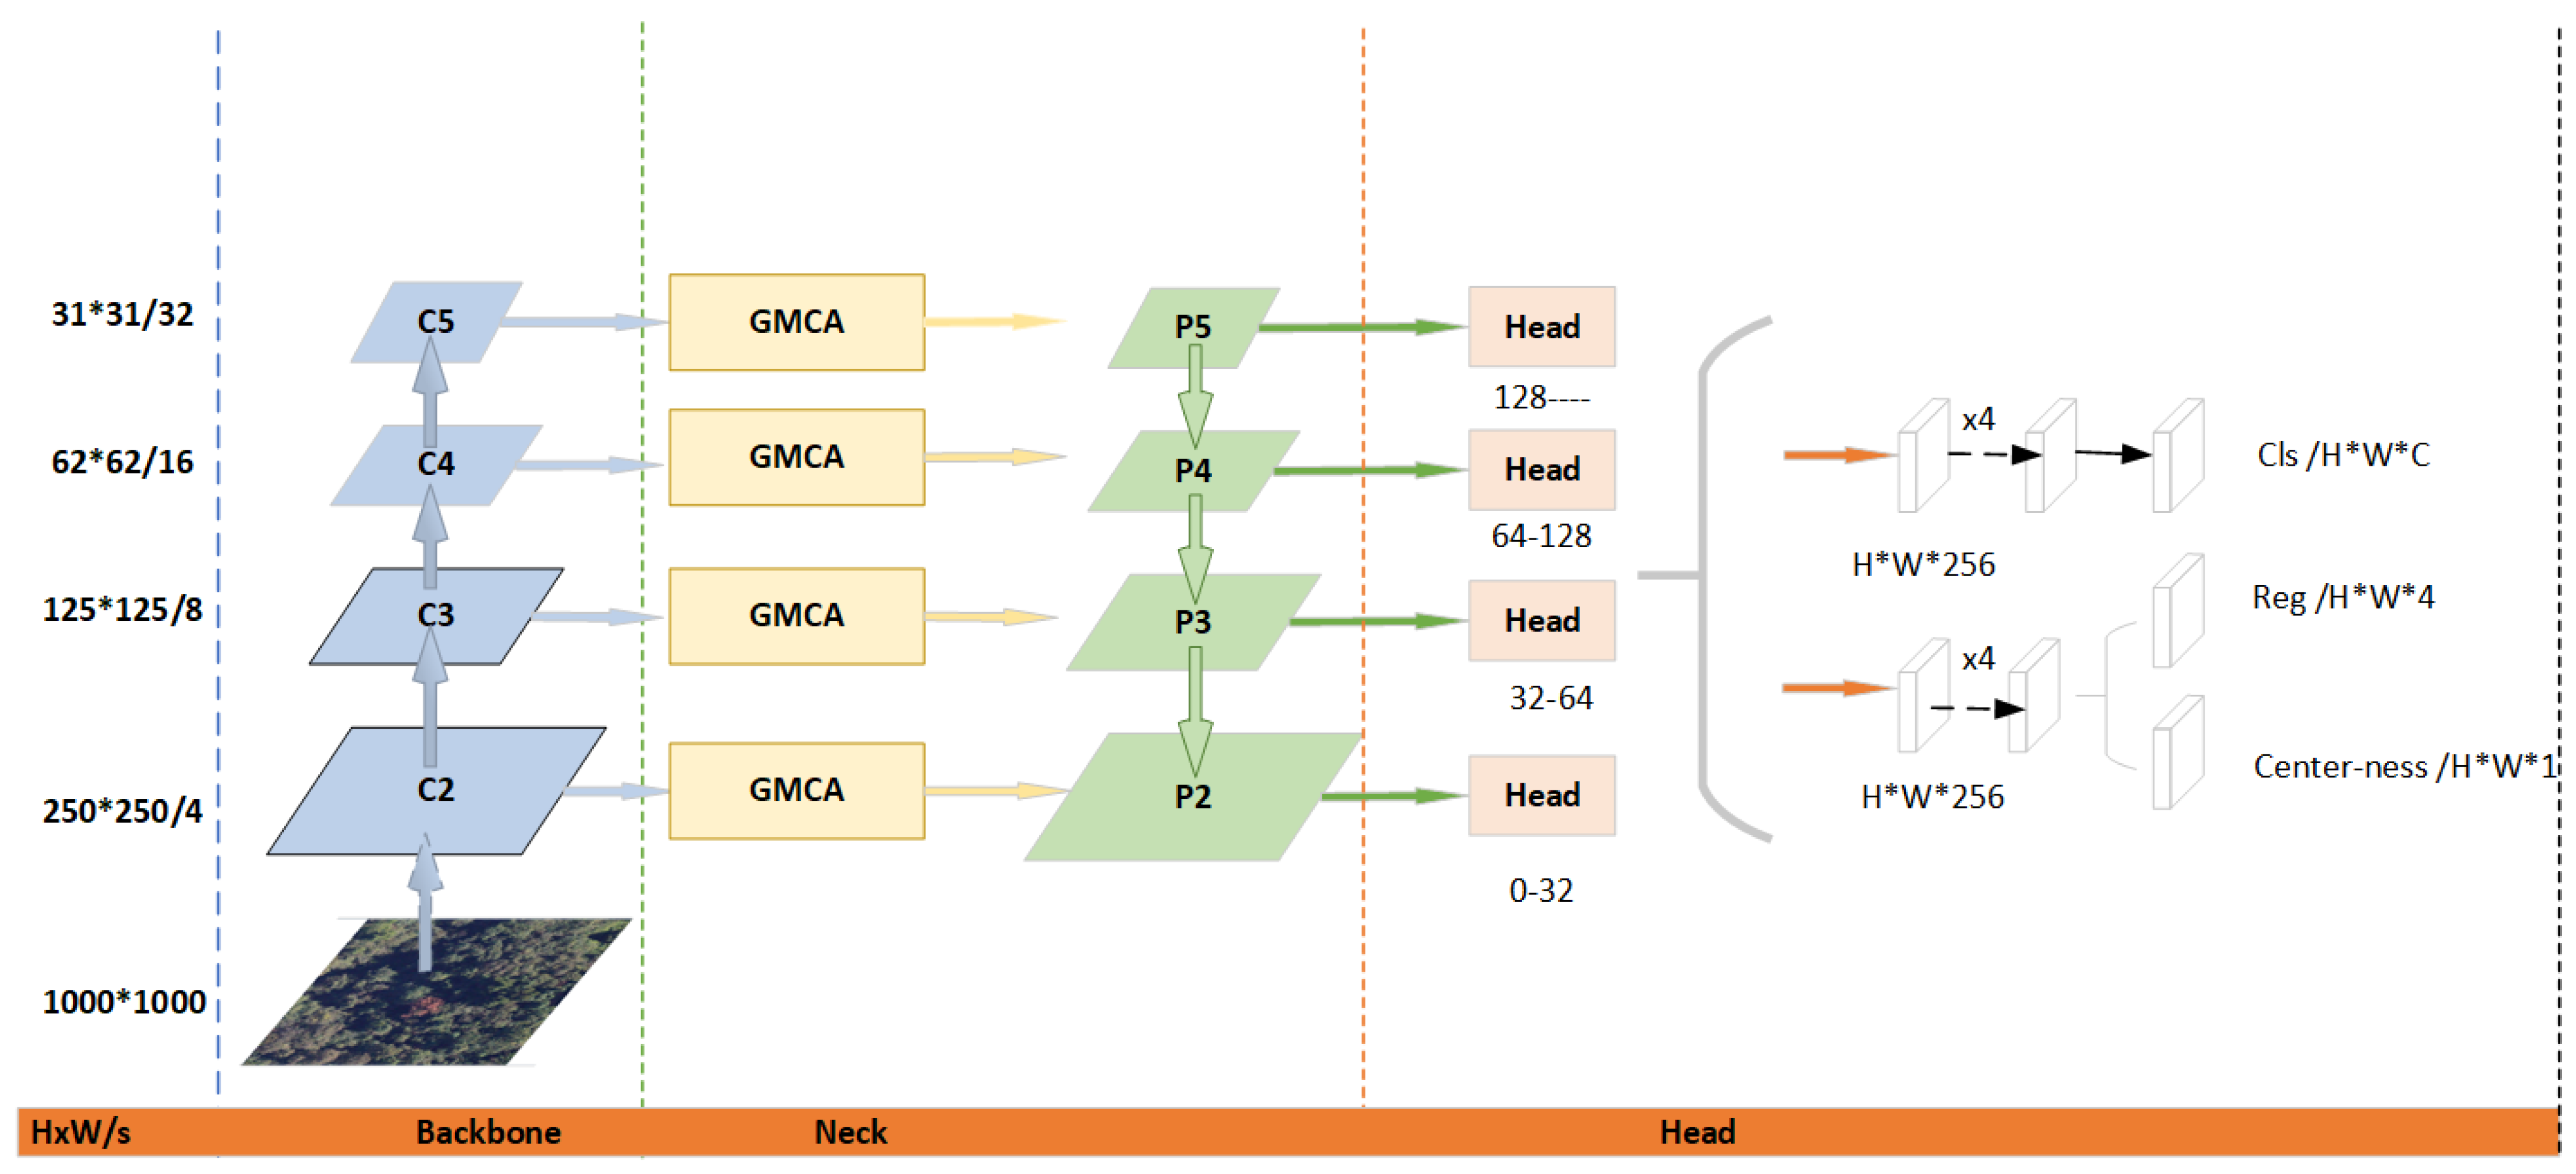
2.3.1. The Global Multi-Scale Channel Attention Network

The proposed Global Multi-Scale Channel Adaptation Network is based on the improved anchor-free detection algorithm FCOS [21], and our network structure is shown in Figure 2.
The Global Multi-Scale Channel Adaptation Network is not a complicated and efficient one-stage detection network without an anchor box, it uses Resnet50 [22] as the backbone to extract features, and uses the improved FPN [23] module based on a global multi-scale channel attention (GMCA) module as the neck part for feature fusion enhancement. In the detection head part, the anchor-based detectors are equivalent to treating the anchor box as a training sample: if the IOU of one anchor box and the ground truth box is more than the threshold value, the anchor box is regarded as a positive sample; or else, it is a negative sample. The Global Multi-Scale Channel Adaptation Network takes each position (pixel) as a training sample on the prediction feature map directly. However, in the sampling method of positive and negative samples, the center circle sampling method proposed by us throws out the traditional rectangular sampling range but designs a circular sampling range more in line with our target of a diseased tree; that is, if a pixel is located at the center circle of the central region of a ground truth box, it is regarded as a positive sample; or else, the pixel is a negative sample. Other than the branch used for classification, the detection head of our network also has a regression branch of 4D vector (l, r, t, b), regarded as the learning parameters of the target position, like the FCOS network, where l, r, t, b are from the position to the distance of ground truth box (gts-box) between the four sides of the bounding box. In the part of the regression detection head, there is also a parallel branch, called the center deviation, which is used to restrain the training weight of samples far from the target center point.
Optimization of layered detection mechanism: The FCOS algorithm uses five prediction feature layers P3, P4, P5, P6, and P7 to perform hierarchical prediction on targets. Among them, the prediction feature layer P3 layer regresses small and medium-scale targets with scales ranging from 0 to 64 × 64, and prediction feature layers P6 and P7 regress large-scale targets, with scales ranging from 256 × 256 to 512 × 512 and greater than 512 × 512, respectively. Through the statistical analysis of our dataset of pine wilt disease trees, it is found that the scale distribution of our annotated samples is from 0 to 64 × 64, accounting for 78.8%. As a result, most targets are predicted at the P3 layer, the layered prediction effect is poor, and dense targets are difficult to detect. To solve this problem, the Global Multi-Scale Channel Adaptation Network proposed adds a P2 layer in the neck based on the FCOS algorithm, and divides the targets within the scale of 0 to 64 × 64 into P2 and P3 layers for regression according to the division of 0 to 32 × 32 and 32 × 32 to 64 × 64. In detail, it is to make a prediction output for targets of different sizes at different prediction layers, so that the adjacent targets can be divided into different layers for prediction, which can alleviate the problem of dense target detection effectively. Meanwhile, the feature map of the P2 layer, which integrates the semantic information of the third layer, is rich in small target information, which contributes to the detection of small-scale diseased trees by the model. Since there is no target with a scale greater than 256 × 256 in our dataset of pine wilt disease trees, the P6, and P7 layers are cut out to simplify the network structure when building the network model.

2.3.2. The Global Multi-Scale Channel Attention (GMCA)

The attention mechanism has been proven to help enhance the foregrounded information extraction of convolutional networks and alleviate the interference of complex background on network feature extraction. However, how to combine the interdependence between channels and the extraction of spatial context information has always been a great challenge for effective attention mechanisms. Therefore, a global multi-scale channel attention (GMCA) module is proposed to combine with local channel attention weight and global attention weight, and multi-scale spatial context information. Then, the Global Multi-Scale Channel Adaptation Network introduces the GMCA module into the FPN to enhance the ability of the FPN module to distinguish the target area from the background area, which shifts the attention of the model to the channels focusing on the target area, increasing the feature weight of the channels in the target area. The global multi-scale channel attention (GMCA) module learns a new weight parameter adaptively; it measures the importance of different channels by introducing different weights; it adds higher attention weights to the channels focusing on the target area; and it reduces the attention weights of the channels focusing on the background area correspondingly, thereby increasing the distinguishability between the background and the target for our model, to relieve the adverse effect of the complex background of the remote sensing images.
The specific process of the global multi-scale channel attention module (GMCA) is shown in Figure 3. Using a split module divides the channels into four groups and performs feature extraction of four scales (convolution kernel size is 3 × 3, 5 × 5, 7 × 7, and 9 × 9, respectively) for the four groups of channel feature maps. As shown in the following Formula (1), the input feature map F ( x ) is divided into four groups and expressed by a0, a1, a2 and a3:
S p l i t ( F ( x ) ) = [ a 0 , a 1 , a 2 , a 3 ]
where F ( x ) represents the input feature map, and a0, a1, a2, and a3 represent the four groups of feature maps after splitting the input feature map.
The number of channels of each group is denoted by C i ( C i = C 4 , C is the number of channels of the input feature map). The convolution operation is performed on the four groups of channel feature maps using convolution kernels of 3 × 3, 5 × 5, 7 × 7, and 9 × 9, respectively, to obtain feature maps F0, F1, F2, and F3 with different scale information, and then the feature map F ( x ) after multi-scale information fusion can be obtained, as shown in the following Formula (2):
F ( x ) = C o n c a t ( [ F 0 , F 1 , F 2 , F 3 ] )
where F ( x ) represents the feature map after the concat of the feature maps F0, F1, F2, and F3. Additionally, F0, F1, F2, and F3 represent the four groups of feature maps after multi-scale convolution operation, respectively.
For the feature maps F0, F1, F2, and F3 with different spatial scale information, use the ECA attention module to extract their channel attention weights to obtain channel attention vectors on four different scales; the attention vector of multi-scale channels is re-calibrated by using an activation function called SoftMax to get the weight parameter of the channel after the interaction of new multi-scale channels; perform a dot multiplication on the recalibrated weight and the corresponding feature map according to elements, and then the module will obtain a feature map with multi-scale feature information and attention weighting:
F ( x ) = F ( x ) S o f t max ( i   =   0 4 E C A ( F i ) ) i = 0 , 1 , 2 , 3
where ⊗ represents the dot multiplication of the feature map with the attention weight parameter.
Then, the SE attention is used for extracting the attention weight of the global channel from the feature map with rich multi-scale information, to reacquire the weight parameter of each channel. Additionally, perform a dot multiply the weight parameter with the feature map by element to get the feature map with global multi-scale information:
F ( x ) = F ( x ) S i g m o d ( S E ( F ( x ) ) )

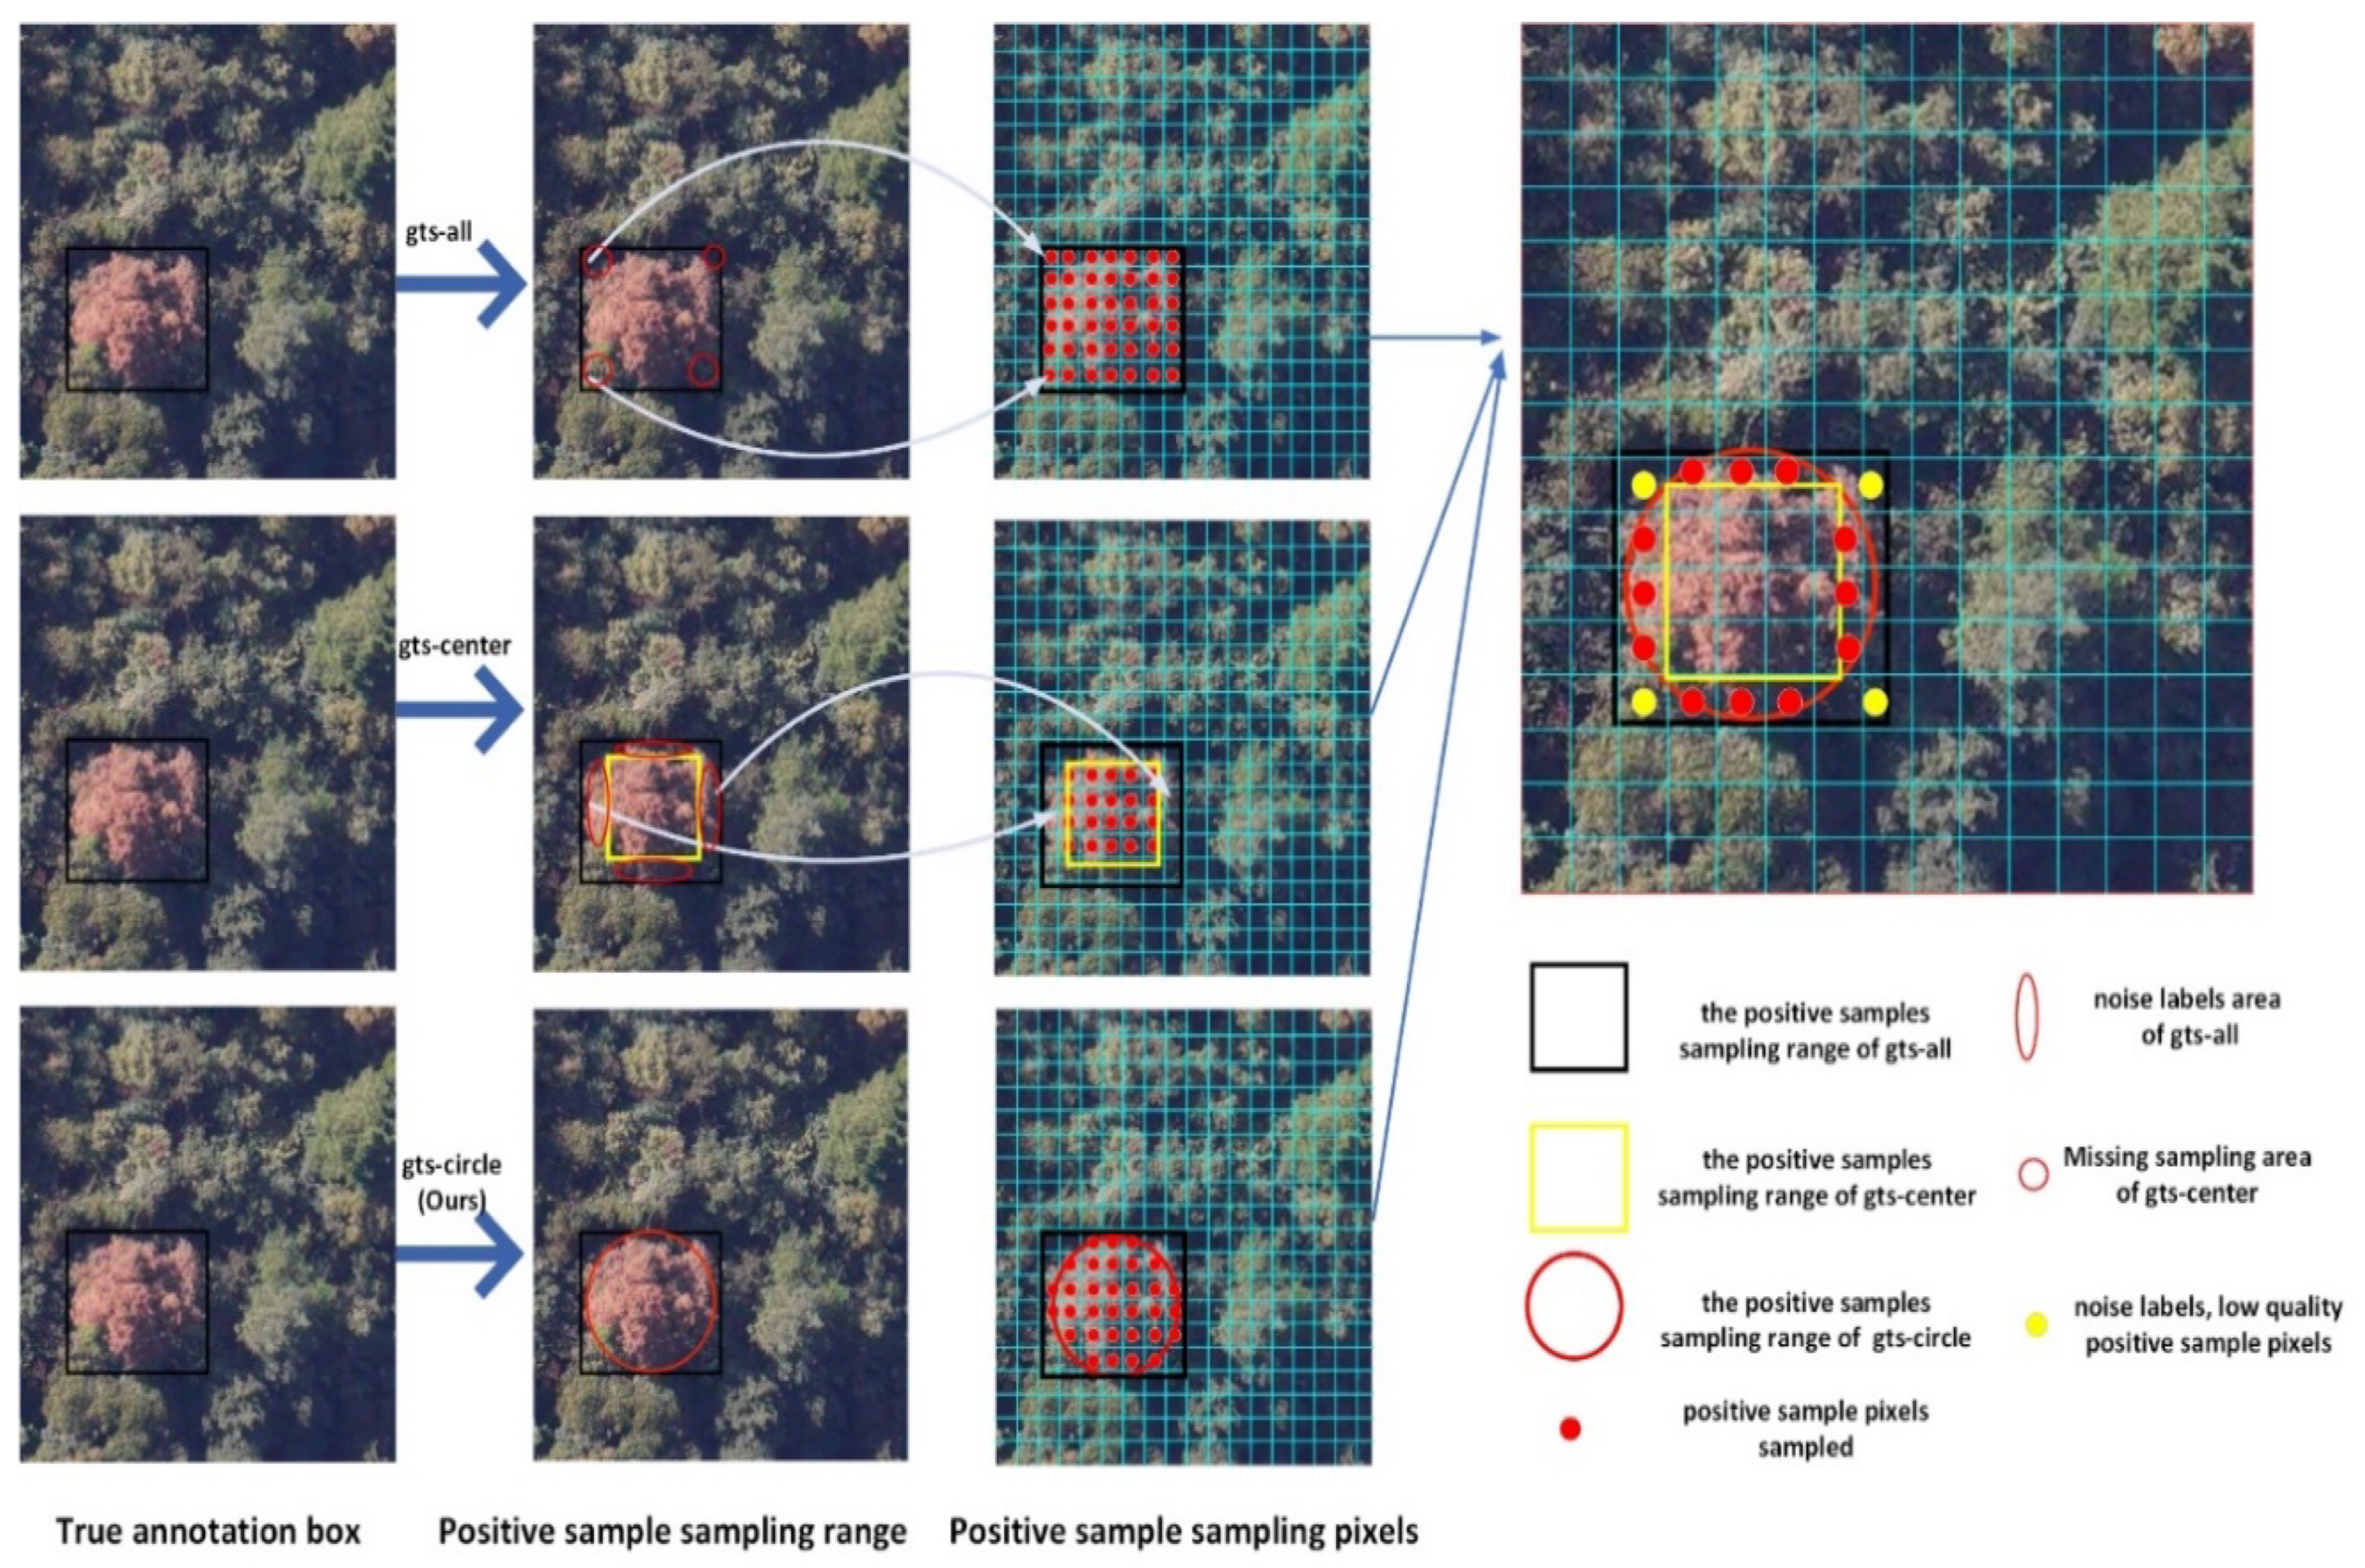
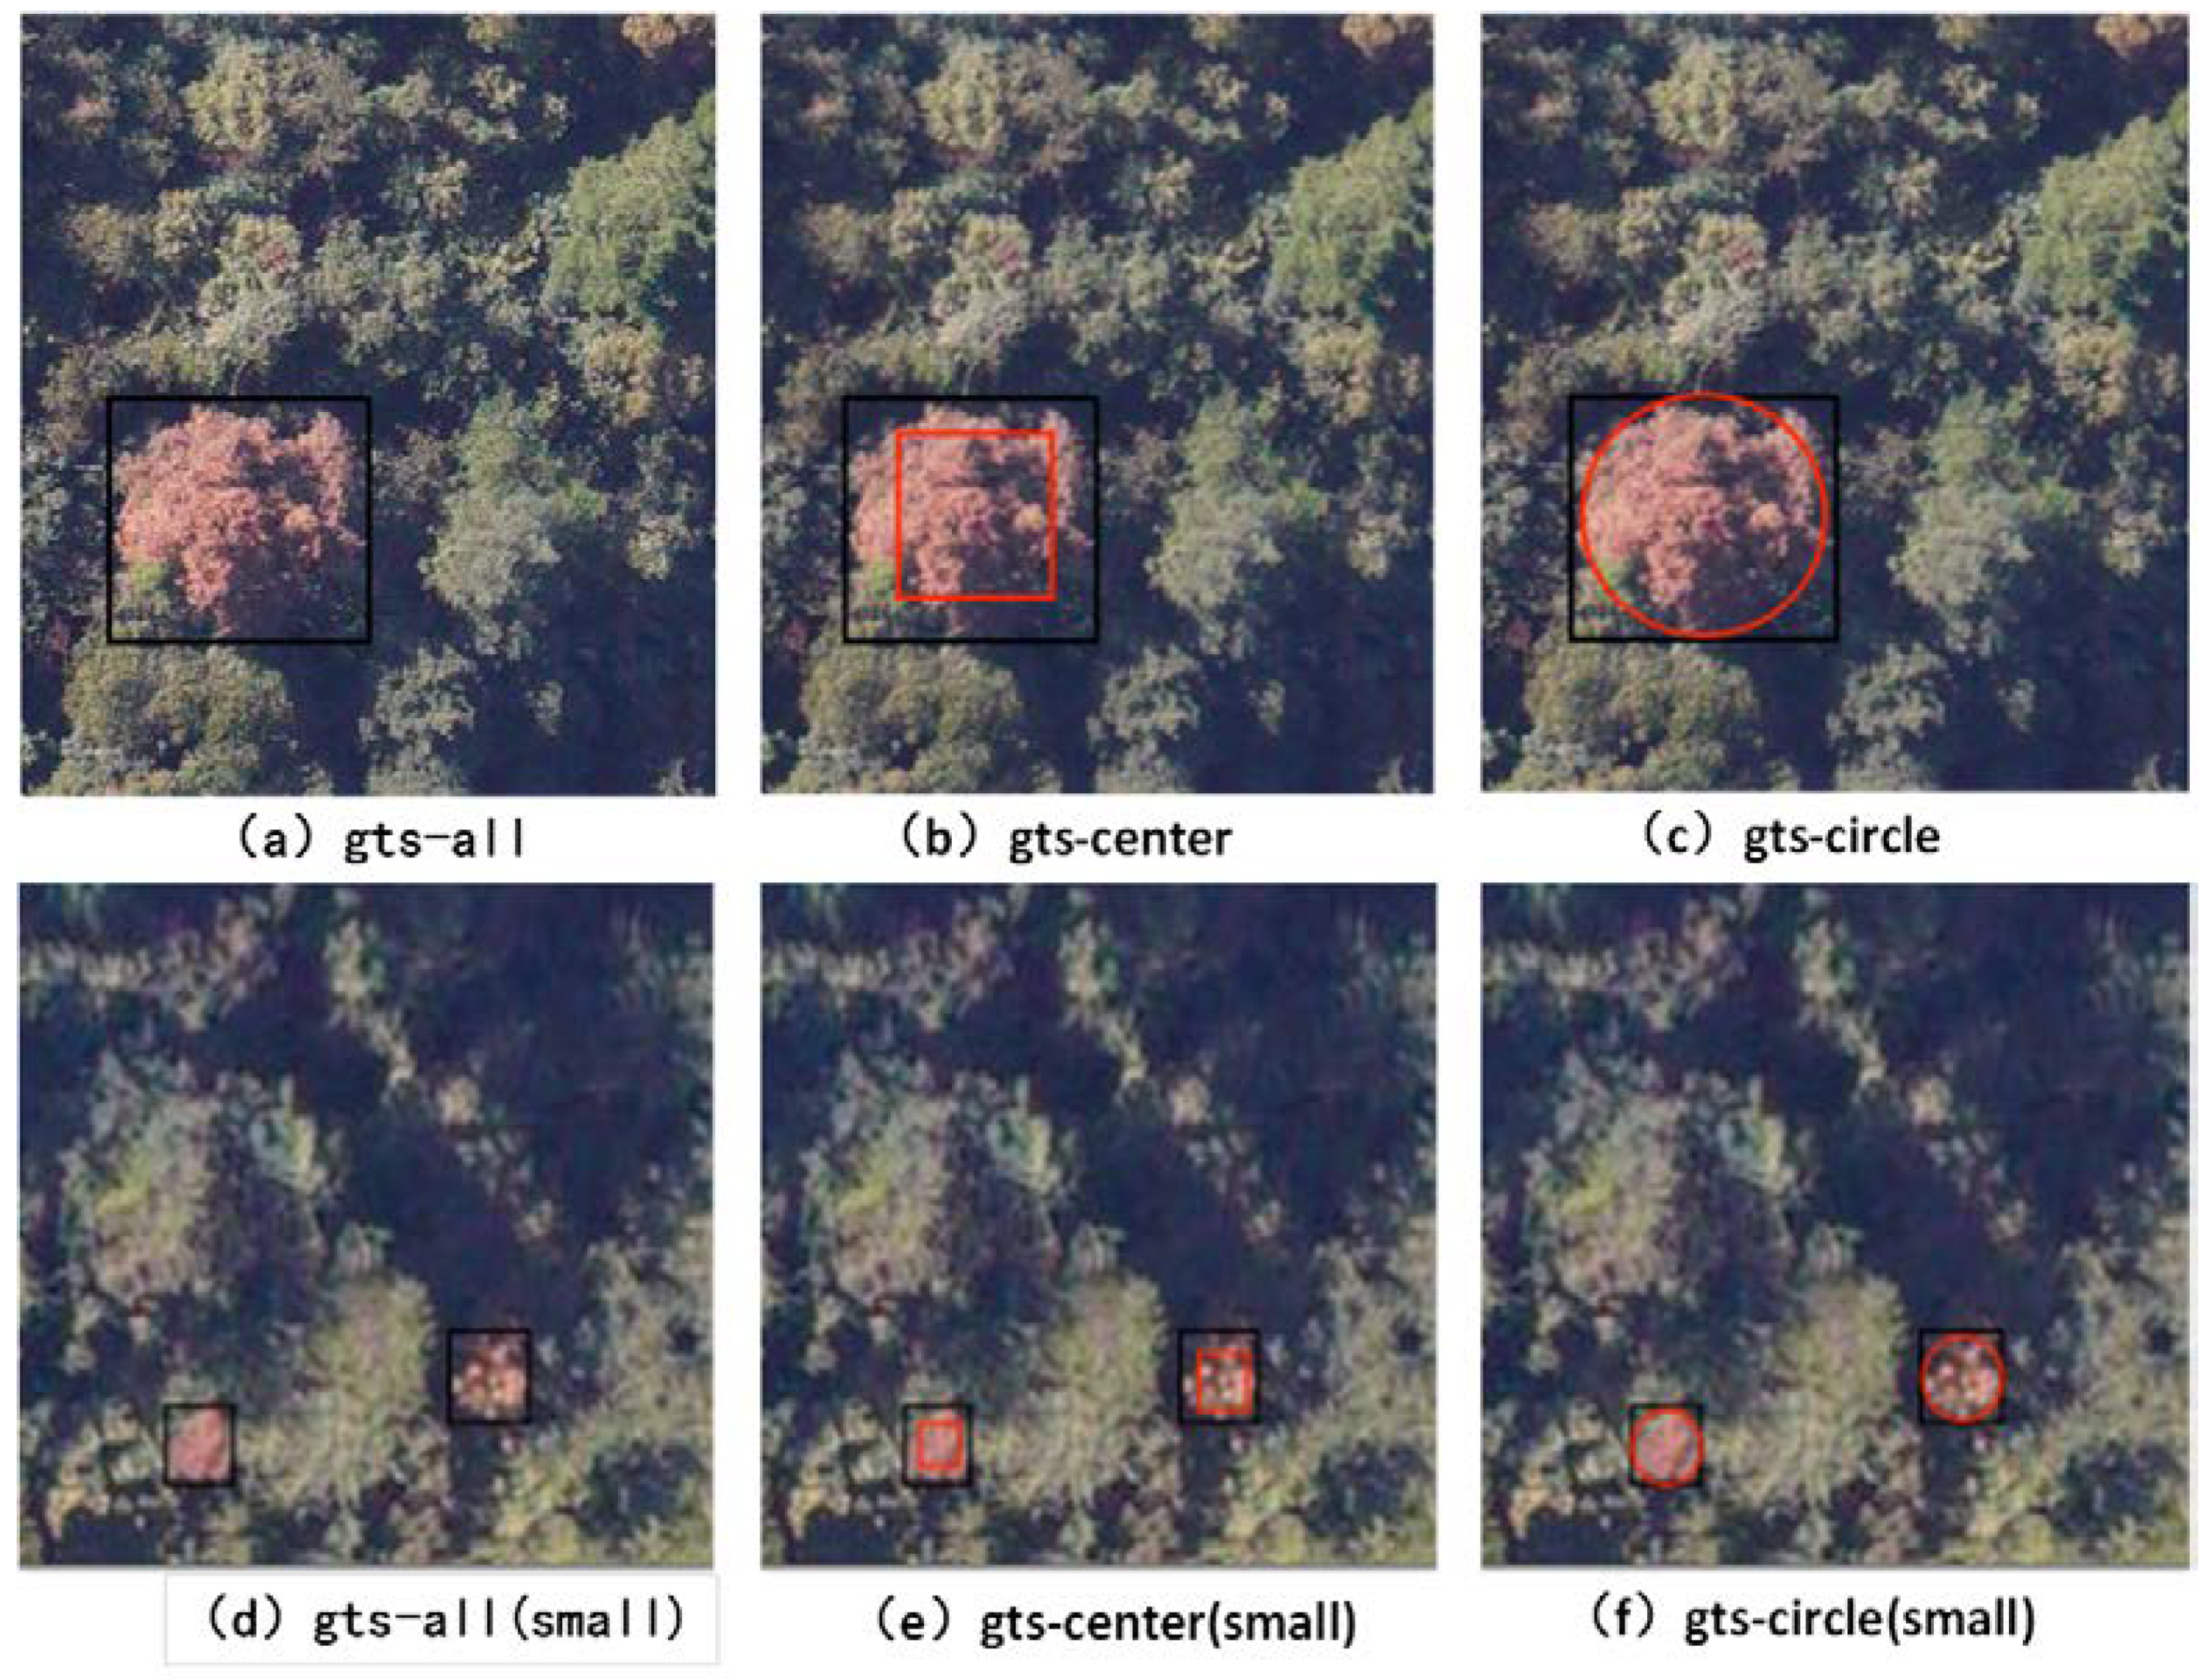
2.3.3. Gts-Circle Sampling

The proposed center circle sampling (gts-circle) method abandons the traditional rectangular area sampling method and designs a circular area sampling range, which can obtain high-quality positive samples. As shown in Figure 4, to fit the sampling range of positive samples with the shape of our circular disease tree target when the algorithm is sampling, and enhance the sampling quality and quantity of positive samples, a center circle sampling (gts-circle) method is proposed.
Comparisons of positive sample sampling ranges of the gts-all sampling from FCOS, the gts-center sampling from FCOSv2, and the gts-circle sampling methods proposed by us, are shown in Figure 4. In the positive and negative sample sampling of FCOS, each position on the prediction feature map, that is, each pixel point, is regarded as a training positive sample. Once the position (pixel) falls inside the ground truth box of a class, the pixel is regarded as a positive sample of that class; or else, the pixel is regarded as a negative sample. In other words, all pixels in the label box are trained as positive samples. This gts-all sampling strategy increases the number of positive samples significantly, but this sampling method also samples many noise labels at the inner edge of the label box as positive samples, which reduces the function of the model, as shown by the yellow dots in Figure 4.
Therefore, in FCOSv2, the sampling strategy is improved, as shown in the red rectangle box in Figure 4. Taking the center point of the label box as the center, a square sub-box is constructed, the red square namely in the figure. The pixels are positive samples inside the square sub-box, and the pixels are negative samples outside the square sub-box. The gts-center sampling method improves the sampling quality of positive samples and reduces the impact of noise labels effectively. However, because the shape of our diseased trees is like a circle, this sampling method loses a lot of geometric edge information, and the square sub-box cannot fit the geometry of our diseased tree target well. On the other hand, when sampling for small-scale targets, the gts-center sampling strategy makes the number of positive samples of small-scale targets reduce significantly, which is not conducive to the training of small-scale targets.
To solve the above problems, a center circle sampling (gts-circle) method is presented in this article, as shown in Figure 4. The center of the ground truth box is the center of the circle, half of the short side of the label box is the radius, and an inner circle is constructed. All the pixel points falling within the inner circle are positive samples, otherwise, it is a negative sample. Comparing the sampling range of positive samples of the three sampling methods in Figure 4, it can be found that the center circle sampling (gts-circle) method makes the sampling range of positive samples match the geometric shape of the diseased tree better when our algorithm samples, and it alleviates the problem of edge geometric information loss in gts-center sampling effectively, and improves the sampling quality of positive samples. The expression formula of the positive sample in gts-circle is as follows:
( C x x 0 ) 2 + ( C y y 0 ) 2 r 2 ( r = min ( w , h ) / 2 ) F ( x , y ) = ( C x , C y )
where C x , C y represent the horizontal and vertical coordinates of the points on the feature map corresponding to the original image. x 0 , y 0 represent the coordinates of the center point of the annotation box. r is a hyperparameter, represents the radius of the inner circle. w and h represent the width and height of the annotation box, respectively.

3. Results

In this section, this paper introduces the evaluation metric of our experimental results, it is compared with seven current mainstream object detection algorithms on the dataset of pine wilt disease trees made by ourselves. Finally, an ablation experiment is designed for the proposed modules.

3.1. Evaluation Metric

For the detection of pine wilt diseased trees, the expectation is not to miss a diseased tree, as much as possible. Therefore, this paper uses recall and average precision (AP) as performance indicators. The recall is the percentage that the positive examples predicted correctly out of all positive examples. While ensuring that the overall performance AP of the model is excellent, we expect the recall of the model to be as high as possible.

3.2. Comparative Experimental

Based on the above experimental environment, parameter settings, and evaluation metric, we selected seven mainstream network models for comparative experiments. The results are shown in Table 2:
To assess the network proposed comprehensively, we design comparative experiments. The experiment compares the classical two-stage detection network Faster-RCNN [27] and the classical one-stage detection network RetinaNet [28] based on anchor, the detection network FoveaBox [29], and CenterNet [30] based on anchor-free, and the current mainstream object detection network YOLOV5 [31], YOLOv6 [32], and YOLOX [33]. As can be seen from Table 2, the recall and average precision (AP) of our network are 86.6 and 79.8, respectively, which exceed the current mainstream network models. The recall and average precision (AP) of our detection network is significantly improved compared with CenterNet, FoveaBox, YOLOv5, and RetinaNet. Although the average precision (AP) is not significantly improved compared with Faster-RCNN and YOLOX, the recall is improved by 1.9% and 3.5%, respectively. At the same time, we also compared the current advanced method YOLOv6. We found that the YOLOv6 algorithm is not friendly to the dataset of pine wilt disease trees, and the value of the AP is the lowest among all network model experimental results through experiments.
To further analyze the detection performance of our network, we visualize the recognition results of our algorithm and the current mainstream object detection algorithms, YOLOX and Faster-RCNN, on the test set, as shown in Figure 5.
As shown in the yellow boxes in Figure 5, there are many missed detections in the identification results of Faster-RCNN and YOLOX, and the missed detection problem of our network has been alleviated greatly.
To analyze the specific situation of missed detection, we counted the number of missed disease trees and the distribution of the number of the target size of missed disease trees in the test set of the three networks.
Table 3 statistics the specific number of diseased trees detected and the missed detection by Faster-RCNN, YOLOX, and our network, on the test set:
We can find that there are missed detections in the detection results of YOLOX and Faster-RCNN. Among them it can be seen from Table 3 that the Faster-RCNN misses detection more seriously than YOLOX, and the detection effect of our network is the best.
It can be found from the data in Table 4 that the missed detection of the three network models is all concentrated on the small-scale diseased tree target, among which YOLOX has the best detection effect on the small-scale diseased tree. In addition, it is not difficult to see that the proposed network by us has a better detection effect at medium and large scales, and the missed detection is reduced significantly. The detection effect of our network on multi-scale diseased trees is better than that of Faster-RCNN and YOLOX, but the detection of small-scale diseased trees needs to be further improved.

3.3. Ablation Study

To better evaluate the effectiveness of each module proposed in this paper, firstly, we use the FCOS network based on ResNet50 as a baseline, and then we test the effectiveness of our module on our pine wilt diseased trees dataset by combining FCOS with the proposed central circle sampling method (gts-circle), and the global multi-scale channel attention (GMCA) module, respectively. The average precision (AP) and the recall were taken as evaluation indexes to characterize the algorithm performance when the IOU was equal to 0.5. The results of the ablation experiments are shown in Table 5.
It can be found from the data in Table 5 that the gts-all sampling strategy has high recall and low average precision (AP); the adoption of the gts-center sampling strategy has low recall and high average precision (AP); while using our proposed sampling method, called gts-circle, improves the recall significantly while maintaining high average precision (AP).
To analyze the reasons for the big differences in network average precision (AP) and recall caused by the three sampling methods, we compared the sampling ranges of the three sampling methods. Firstly, we compared the sampling results of the three sampling methods, as shown in Figure 6.
Figure 6 shows that, on the one hand, the gts-all sampling method collects the largest number of positive samples, but it collects many low-quality positive samples with noise labels at the edges. On the other hand, the quality of positive samples collected by the gts-center sampling method is higher, and there are no low-quality and noisy label samples at the edges. However, this also leads to the small number of positive samples collected by this sampling method, and the lack of edge information of the disease tree target. The sampling range of the center circle sampling method proposed by us is a circle, which not only ensures the number of positive samples collected is enough but also enhances the sampling quality of the positive samples, which is most suitable for the positive sample collection of our diseased tree target.
Moreover, after the original sampling strategy is adopted, the GMCA attention module is added, and the recall and average precision (AP) were improved by 0.4 and 1.5. It can be seen that the AP of the network is not obviously improved significantly when adding the GMCA module, but the recall of the network is improved significantly.
After adding the attention (GMCA) module and adopting our center circle sampling (gts-circle) method, the recall and average precision (AP) of our model are improved by 3.5 and 2.2, respectively.
To further verify the effectiveness of the proposed GMCA module, we introduced the FPN with GMCA module into Faster RCNN and FCOS and conducted ablation expe-riments on the Pascal VOC2012 dataset. The experimental results are shown in Table 6.
It can be seen from Table 6 that the results on the Pascal VOC2012 dataset show that the accuracy has been improved by 1.1 and 0.8, respectively, after adding the proposed GMCA module to Faster-RCNN and FCOS.

3.4. Application Results

Finally, our network was used to identify the UAV imagery of the forest areas in Dengcun Township, Wuduhe Town, Dalaoling nature reserve, Wufeng County, Yuan’an county, and Yidu City in Yichang City, Hubei Province. Many diseased trees were identified, and the identification results are shown in Table 7.
The coordinates of the identified diseased trees were imported into ArcGIS, and the visualization results were shown in Figure 7.

4. Discussion

The effectiveness of the Global Multi-Scale Channel Adaptation Network proposed by us is carefully verified by analyzing and comparing several groups of experiments.
Due to the complex background of the UAV remote sensing image, the training of the model is often affected by the background information, which leads to false detection and missed detection. The attention mechanism is often used to mitigate the adverse impact of complex background on the model [34,35,36,37,38]. The global multi-scale channel attention (GMCA) module adopted by us can establish the dependence relationship between channels and extracting multi-scale spatial information. The global attention weight of the feature map can be extracted, which can enhance the feature extraction ability of the model to the target.
In YOLOF [39], the authors found that the success of FPN lies in its divide-and-conquer solution to the problem of target detection optimization through experiments, that is, a hierarchical detection strategy. Through the analysis of our dataset and network model, it was found that 78.8% of the samples in our dataset are distributed in the P3 layer for detection, which did not make full use of the idea of divide and conquer. Therefore, the P2 layer that integrates the C3 layer of rich small-scale target information is added to our network model and lets 78.8% of the data samples be detected by P2 and P3 layers, using the idea of divide and conquer effectively.
The sampling strategy of positive and negative samples has always been the focus of research on the object detection network. The quality and quantity of samples affect the stability of the model directly. From the classic anchor-based two-stage target detection network, Faster-RCNN, to the current popular anchor-free detection network, researchers continue to study the sampling strategies of positive and negative samples during sampling. In Faster-RCNN, the positive and negative samples are determined by the Intersection over Union (IOU) threshold of the artificially set that overlap rate of anchor and ground true boxes. The anchor samples larger than the threshold artificially set are positive samples, and the anchor samples smaller than the threshold are negative samples. In Libra RCNN [40], the authors improved the sampling strategy of negative samples from the difficult negative samples and easy negative samples. During sampling, the impact of difficult negative samples and easy negative samples near the IOU threshold on the model performance was fully considered. The negative samples were divided into k intervals according to the IOU value of anchor samples, and each interval was randomly sampled. This ensures that the proportion of negative samples which are easy to learn and which are difficult to learn is as balanced as possible, and improves the robustness of the model. In RetinaNet, from the point of view of the loss function, researchers designed a focal loss function to give different weights to different samples, thus alleviating the impact of imbalance between positive and negative samples on network performance to some extent.
The current popular anchor-free object detection network discards the complex anchor boxes design and further improves the sampling strategy, such as CenterNet, FCOS, and FoveaBox, among which CenterNet uses the pixels of the center points of ground truth boxes in the original image regarded as a positive sample, and the rest of the pixels are regarded as a negative sample. FCOS determines the positive and negative samples by designing the square subframe of the annotation boxes; FoveaBox uses a super parameter to narrow the length and width of the annotation box, and then obtains the rectangles box, which was narrowed. The pixels are positive samples inside the rectangles box, and the pixels are negative samples outside the box. In this paper, by analyzing the geometry of our diseased tree target, the sampling strategy of the center circle (gts-circle) is proposed to make our sampling area fit our sample shape as much as possible, improving the sampling quality effectively. This plays an important role in improving the recall of our network.

5. Conclusions

In this paper, a Global Multi-Scale Channel Adaptation Network for pine wilt disease trees by center circle (gts-circle) sampling method is proposed. On the one hand, the global multi-scale channel attention (GMCA) module proposed can learn the global channel attention weight and multi-scale spatial information of the feature map effectively. Its adaptive channel weight parameter learning makes the model more concerned with the foreground target, and heightens the feature extraction ability of the model to the diseased trees significantly. On the other hand, the center circle sampling (gts-circle) method proposed by us makes the sampling range of the positive samples in the model sampling more match the geometry of the diseased tree target, improving the sampling quantity and quality of the positive samples in the model sampling, and reducing the impact of noise labels on the model performance. The experimental results showed that on the pine wilt disease tree dataset, the network presented compares with the seven mainstream object detection algorithms; our network has achieved the optimal detection effect and applies to the application needs of large-scale identification of pine forest epidemic control.
In the future, we will focus on how to improve the detection performance of diseased trees under different illumination color differences, and continue to study the positive and negative sample sampling strategies to further improve the detection performance of the network.

Author Contributions

Conceptualization and Methodology: D.R. and H.S.; Software and validation: D.R. and H.S.; Formal analysis: H.S., M.Y. and Z.L.; Investigation: Z.L.; Resources: M.Y.; Data curation: J.Y.; Writing—original draft preparation: Y.P.; Writing—review and editing: D.R. and H.S.; Visualization: Y.P.; Supervision: D.R.; Project administration: D.R.; Funding acquisition: Y.P., D.R. and H.S. All authors have read and agreed to the published version of the manuscript.

Funding

This research received no external funding.

Informed Consent Statement

Not applicable.

Data Availability Statement

Data are available upon reasonable request from the corresponding author.

Conflicts of Interest

The authors declare no conflict of interest.

References

  1. Zeng, Q.; Sun, H.-F.; Yang, Y.-L.; Zhou, J.-H.; Yang, C. Comparison of accuracy of UAV monitoring pine wood nematode disease. J. Sichuan For. Sci. Technol. 2019, 40, 92–95+114. [Google Scholar]
  2. Wu, S. Tree extraction of pine wood nematode disease from remote sensing images based on deep learning. Comput. Sci. Appl. 2021, 11, 1419–1426. [Google Scholar]
  3. Xiangkang, L.; Huanhua, H.; Yongkui, H.; Jun-Xiang, F.; Hai-Wei, W.; Wu, J.R. Study on the change of characteristics of pine wood nematode disease, Study on the change of characteristics of pine wood nematode disease. Guangdong For. Sci. Technol. 2010, 5, 92–96. [Google Scholar]
  4. He, S.; Liu, P. UAV inspection and verification, ground manual inspection of the city’s 1,592,200 mu of pine forest cover, no dead corners Beijing has woven a three-dimensional monitoring network for pine wood nematode disease. Green. Life. 2020, 7, 19–24. [Google Scholar]
  5. Peng, L.; WeiXing, S.; Feng-gang, S.; Li, X.; Fengdi, L.; Zhengyu, L.; Zhichao, G.; Chun-yan, J.; Bin, D. A tree detection method and system for pine wood nematode disease based on YOLOV3-CIOU. J. Shandong Agric. Univ. Nat. Sci. Ed. 2021, 52, 10. [Google Scholar]
  6. Weizheng, L.; Shiguang, S.; Peng, H.; Dejun, H.; Yang, F.; Long, T.; Shuifeng, Z. Remote sensing location of dead and dead wood by low-cost small UAV. For. Sci. Technol. Dev. 2014, 28, 102–106. [Google Scholar]
  7. Sun, Y.; Ma, O. Automating Aircraft Scanning for Inspection or 3D Model Creation with a UAV and Optimal Path Planning. Drones 2022, 6, 87. [Google Scholar] [CrossRef]
  8. Hu, M.; Liu, W.; Lu, J.; Fu, R.; Peng, K.; Ma, X.; Liu, J. On the joint design of routing and scheduling for vehicle-assisted multi-UAV inspection. Future Gener. Comput. Syst. 2019, 94, 214–223. [Google Scholar] [CrossRef]
  9. Jenssen, R.; Roverso, D. Automatic autonomous vision-based power line inspection: A review of current status and the potential role of deep learning. Int. J. Electr. Power Energy Syst. 2018, 99, 107–120. [Google Scholar]
  10. Xiang, T.-Z.; Xia, G.-S.; Zhang, L. Mini-unmanned aerial vehicle-based remote sensing: Techniques, applications, and prospects. IEEE Geosci. Remote Sens. Mag. 2019, 7, 29–63. [Google Scholar] [CrossRef] [Green Version]
  11. Ahmed, I.; Ahmad, M.; Chehri, A.; Hassan, M.M.; Jeon, G. IoT Enabled Deep Learning Based Framework for Multiple Object Detection in Remote Sensing Images. Remote Sens. 2022, 14, 4107. [Google Scholar] [CrossRef]
  12. Pajares, G. Overview and current status of remote sensing applications based on unmanned aerial vehicles (UAVs). Photogramm. Eng. Remote Sens. 2015, 81, 281–330. [Google Scholar] [CrossRef] [Green Version]
  13. Wu, X.; Li, W.; Hong, D.; Tao, R.; Du, Q. Deep learning for unmanned aerial vehicle-based object detection and tracking: A survey. IEEE Geosci. Remote Sens. Mag. 2021, 10, 91–124. [Google Scholar] [CrossRef]
  14. Luo, W.; Jin, Y.; Li, X.; Liu, K. Application of Deep Learning in Remote Sensing Monitoring of Large Herbivores-A Case Study in Qinghai Tibet Plateau. Pak. J. Zool. 2022, 54, 413. [Google Scholar] [CrossRef]
  15. Syifa, M.; Park, S.-J.; Lee, C.-W. Detection of the pine wilt disease tree candidates for drone remote sensing using artificial intelligence techniques. Engineering 2020, 6, 919–926. [Google Scholar] [CrossRef]
  16. Yu, R.; Luo, Y.; Zhou, Q.; Zhang, X.; Wu, D.; Ren, L. Early detection of pine wilt disease using deep learning algorithms and UAV-based multispectral imagery. For. Ecol. Manag. 2021, 497, 119493. [Google Scholar] [CrossRef]
  17. Chen, W.; Huihui, Z.; Jiwang, L.; Shuai, Z. Object Detection to the Pine Trees Affected by Pine Wilt Disease in Remote Sensing Images Using Deep Learning. J. Nanjing Norm. Univ. 2021, 44, 84–89. [Google Scholar]
  18. Liming, H.; Yixiang, W.; Qi, X.; Qing, H. YOLO algorithm and UAV image were used to identify abnormal dis-colored wood of pine wood nematode disease. Trans. Chin. Soc. Agric. Eng. 2021, 37, 197–203. [Google Scholar]
  19. Görlich, F.; Marks, E.; Mahlein, A.-K.; König, K.; Lottes, P.; Stachniss, C. Uav-based classification of Cercospora leaf spot using images. Drones 2021, 5, 34. [Google Scholar] [CrossRef]
  20. Buters, T.; Belton, D.; Cross, A. Seed and seedling detection using unmanned aerial vehicles and automated image classification in the monitoring of ecological recovery. Drones 2019, 3, 53. [Google Scholar] [CrossRef] [Green Version]
  21. Tian, Z.; Shen, C.; Chen, H.; He, T. Fcos: Fully convolutional one-stage object detection. In Proceedings of the IEEE/CVF International Conference on Computer Vision, Seoul, Korea, 27 October–2 November 2019; pp. 9627–9636. [Google Scholar]
  22. He, K.; Zhang, X.; Ren, S.; Sun, J. Deep residual learning for image recognition. In Proceedings of the IEEE Conference on Computer Vision and Pattern Recognition, Las Vegas, NV, USA, 27–30 June 2016; pp. 770–778. [Google Scholar]
  23. Qilong, W.; Banggu, W.; Pengfei, Z.; Peihua, L.; Wangmeng, Z.; Qinghua, H. Feature pyramid networks for object detection. In Proceedings of the IEEE Conference on Computer Vision and Pattern Recognition, Honolulu, HI, USA, 21–26 July 2017; pp. 2117–2125. [Google Scholar]
  24. Zhang, Q.-L.; Yang, Y.-B. ECA-Net: Efficient Channel Attention for Deep Convolutional Neural Networks. arXiv 2019, arXiv:1910.03151. [Google Scholar]
  25. Hu, J.; Shen, L.; Sun, G. Squeeze-and-excitation networks. In Proceedings of the IEEE Conference on Computer Vision and Pattern Recognition, Salt Lake City, UT, USA, 18–23 June 2018; pp. 7132–7141. [Google Scholar]
  26. Tian, Z.; Shen, C.; Chen, H.; He, T. Fcos: A simple and strong anchor-free object detector. IEEE Trans. Pattern Anal. Mach. Intell. 2022, 44, 1922–1933. [Google Scholar] [CrossRef] [PubMed]
  27. Ren, S.; He, K.; Girshick, R.; Sun, J. Faster r-cnn: Towards real-time object detection with region proposal networks. Adv. Neural Inf. Process. Syst. 2015, 28, 91–99. [Google Scholar] [CrossRef] [PubMed] [Green Version]
  28. Lin, T.-Y.; Goyal, P.; Girshick, R.; He, K.; Dollár, P. Focal loss for dense object detection. In Proceedings of the IEEE International Conference on Computer Vision, Venice, Italy, 22–29 October 2017; pp. 2980–2988. [Google Scholar]
  29. Kong, T.; Sun, F.; Liu, H.; Jiang, Y.; Li, L.; Shi, J. Foveabox: Beyond anchor-based object detection. IEEE Trans. Image Process. 2020, 29, 7389–7398. [Google Scholar] [CrossRef]
  30. Zhou, X.; Wang, D.; Krähenbühl, P. Objects as points. arXiv 2019, arXiv:1904.07850. [Google Scholar]
  31. Jocher, B.A.G. AyushExel, “Yolov5”. 2020. Available online: https://github.com/ultralytics/yolov5 (accessed on 12 May 2022).
  32. Li, C.; Li, L.; Jiang, H.; Weng, K.; Geng, Y.; Li, L.; Ke, Z.; Li, Q.; Cheng, M.; Nie, W. YOLOv6: A single-stage object detection framework for industrial applications. arXiv 2022, arXiv:2209.02976. [Google Scholar]
  33. Ge, Z.; Liu, S.; Wang, F.; Li, Z.; Sun, J. Yolox: Exceeding series in 2021. arXiv 2021, arXiv:2107.08430. [Google Scholar]
  34. Dai, W.; Mao, Y.; Yuan, R.; Liu, Y.; Pu, X.; Li, C. A novel detector based on convolution neural networks for multiscale SAR ship detection in complex background. Sensors 2020, 20, 2547. [Google Scholar] [CrossRef]
  35. Gao, Y.; Wu, Z.; Ren, M.; Wu, C. Improved YOLOv4 Based on Attention Mechanism for Ship Detection in SAR Images. IEEE Access 2022, 10, 23785–23797. [Google Scholar] [CrossRef]
  36. Wang, Z.; Wang, B.; Xu, N. SAR ship detection in complex background based on multi-feature fusion and non-local channel attention mechanism. Int. J. Remote Sens. 2021, 42, 7519–7550. [Google Scholar] [CrossRef]
  37. Zhang, W.; Sun, Y.; Huang, H.; Pei, H.; Sheng, J.; Yang, P. Pest Region Detection in Complex Backgrounds via Contextual Information and Multi-Scale Mixed Attention Mechanism. Agriculture 2022, 12, 1104. [Google Scholar] [CrossRef]
  38. Zhao, Y.; Zhao, L.; Xiong, B.; Kuang, G. Attention receptive pyramid network for ship detection in SAR images. IEEE J. Sel. Top. Appl. Earth Obs. Remote Sens. 2020, 13, 2738–2756. [Google Scholar] [CrossRef]
  39. Chen, Q.; Wang, Y.; Yang, T.; Zhang, X.; Cheng, J.; Sun, J. You only look one-level feature. In Proceedings of the IEEE/CVF Conference on Computer Vision and Pattern Recognition, Nashville, TN, USA, 20–25 June 2021; pp. 13039–13048. [Google Scholar]
  40. Pang, J.; Chen, K.; Shi, J.; Feng, H.; Ouyang, W.; Lin, D. Libra R-CNN: Towards balanced learning for object detection. In Proceedings of the IEEE/CVF Conference on Computer Vision and Pattern Recognition, Long Beach, CA, USA, 15–20 June 2019; pp. 821–830. [Google Scholar]
Figure 1. Distribution proportion of marked targets at various scales. It can be seen that the number of targets with the size of 0 to 64 × 64 pixels in the collected data set accounts for 78.8% of the total number of targets.
Drones 06 00353 g001
Figure 2. The overall architecture of the Global Multi-Scale Channel Adaptation Network. Our network extracts feature through the Renset50 backbone network, passes the feature map output from the backbone through the GMCA attention module, and learns the channel attention weight of the feature map adaptively to reduce the interference of the complex background in the UAV image to feature extraction. Then, the feature maps enhanced by the GMCA module are input to the neck (FPN) for feature fusion and enhancement. In the positive and negative sample sampling section, we propose a center circle sampling method to design a circular sampling range more in line with our target of a diseased tree.
Drones 06 00353 g002
Figure 3. The network structure of the global multi-scale channel attention (GMCA) module. Firstly, the GMCA module divides the channel into four groups through the split module. Then, the four groups of channel feature maps are convolved with four convolution kernels of different sizes to obtain multi-scale spatial context information. Moreover, the ECA [24] attention module was used to obtain the local channel attention weight to obtain a feature map with multi-scale feature information and attention weighting. Finally, the SE [25] attention is used for extracting the attention weight of the global channel from the feature map with rich multi-scale information.
Drones 06 00353 g003
Figure 4. The gts-circle sampling method is the proposed process and comparison of three sampling methods. The gts-circle sampling method takes each pixel as a sample mainly. Firstly, the sampling method selects all pixels as candidate positive sample points in the annotated box. Then, draw a circle with the center point of the annotation box as the center and half of the short edge of the annotation box as the radius. All pixels are positive sample points in the circle and others are negative sample points outside the circle. Compared to the gts-all sampling method of the FCOS algorithm, the gts-circle sampling method proposed removes many positive samples that are background pixels. Compared to the gts-center sampling method of the FCOSv2 [26] algorithm, the gts-circle sampling method increases the number of positive samples sampled from the target edge.
Drones 06 00353 g004
Figure 5. Recognition results of Faster-RCNN, YOLOX, and ours on the test set. The red box represents the diseased tree that is detected, and the yellow box represents the diseased tree that is missed. As can be seen in the picture, in the detection results of the test set of diseased trees, both Faster-RCNN and YOLOX have a missing detection obviously, while the missing detection of our proposed algorithm is reduced significantly.
Drones 06 00353 g005
Figure 6. Comparison of three sampling methods. From the sampling range, it can be seen that the sampling range of the center circle sampling (gts-circle) method proposed is more consistent with the circular shape of the target of the diseased trees, and higher quality positive sample pixels are collected at the edge of the diseased tree. As can be seen from the sampling range of small-scale disease trees, the quality of positive samples collected by our proposed sampling method is higher than that of the gts-all sampling method, and the number of samples collected is more than that of the gts-center sampling method.
Drones 06 00353 g006
Figure 7. Distribution map of disease trees coordinates imported into ArcGIS (red points are coordinates of disease trees).
Drones 06 00353 g007
Table 1. Dataset distribution.
Number of PicturesGT NumberAve Target Number
Training set161234152.1
Validation set2003801.9
Test set2024272.1
Table 2. Experimental results of different networks on the dataset of disease trees.
Network (Year)BackboneRecall (Score = 0.5)AP (IOU = 0.5)
CenterNet (2019)ResNet1871.677.5
FoveaBox (2020)ResNet5080.378.7
YOLOX (2021)CSPDarknet5383.179.5
YOLOv5 (2020)CSPDarknet5379.078.5
Faster-RCNN (2015)ResNet5084.779.2
RetinaNet (2017)ResNet5082.577.6
YOLOv6 (2022)EfficientRep80.573.6
OursResNet5086.679.8
Table 3. The specific number of diseased trees detected by the three algorithms in the test set.
NetworkNum of TrueNum of DetectionNum of Missed
Faster-RCNN42735869
YOLOX42735374
Ours42737354
Table 4. The number of the target size of missed disease trees in the test set of the three networks.
NetworkL: Size 96 × 96 M: Size: 32 × 32–96 × 96S: Size 32 × 32
Faster-RCNN41253
YOLOX162632
Ours0846
Table 5. Ablation experimental results of each module.
ModuleRecallAP
FCOS (gts-all)83.177.6
FCOS + gts-center80.278.3
FCOS + gts-circle84.378.4
FCOS + GMCA83.579.1
FCOS + GMCA + gts-circle86.679.8
Table 6. Ablation experimental results of each module on the Pascal VOC2012 dataset.
FasterFaster + GMCAFCOSFCOS + GMCA
person79.977.080.280.5
aeroplane79.179.679.479.8
tvmonitor66.667.065.965.5
train72.776.977.279.4
boat52.751.149.351.2
dog83.886.582.083.9
chair50.551.552.152.6
bird73.874.975.375.3
bicycle73.675.972.472.7
bottle50.850.651.953.6
sheep72.671.471.670.8
diningtable52.955.051.350.1
horse74.379.776.377.4
motorbike76.675.574.076.4
sofa56.561.156.859.7
cow67.870.262.164.8
car69.769.871.470.8
cat86.388.685.187.0
bus76.276.878.076.8
pottedplant41.940.242.743.5
mAP67.969.067.868.6
Table 7. Detection results of diseased trees by our model in various areas of Yichang City.
RegionNumber of DetectedThe Area (km2)
Yidu City6159211.94
Dengcun Township657895.4
Wuduhe town3265125
Dalaoling Nature Reserve146886
Wufeng County18624
Yuan’an County2448127
Publisher’s Note: MDPI stays neutral with regard to jurisdictional claims in published maps and institutional affiliations.

