
Real-Time Survivor Detection System in SaR Missions Using Robots

 , , , ,
Abstract
:1. Introduction
2. Literature Survey
3. Problem Statement
4. Hypothesis
5. Proposed Solution
- Rescue Robo: Used to explore the area and record the live stream.
- Video Detection Architecture: Used to discover humans in the recorded feed in real time.
- Audio Detection Architecture: Used to analyze the audio file associated with the live stream and identify the emotion in the human voice.
- Internet of Things (IoT): Used to stream the location of the detected survivors to a centralized cloud server and to determine the air-quality index of the disaster-affected area.
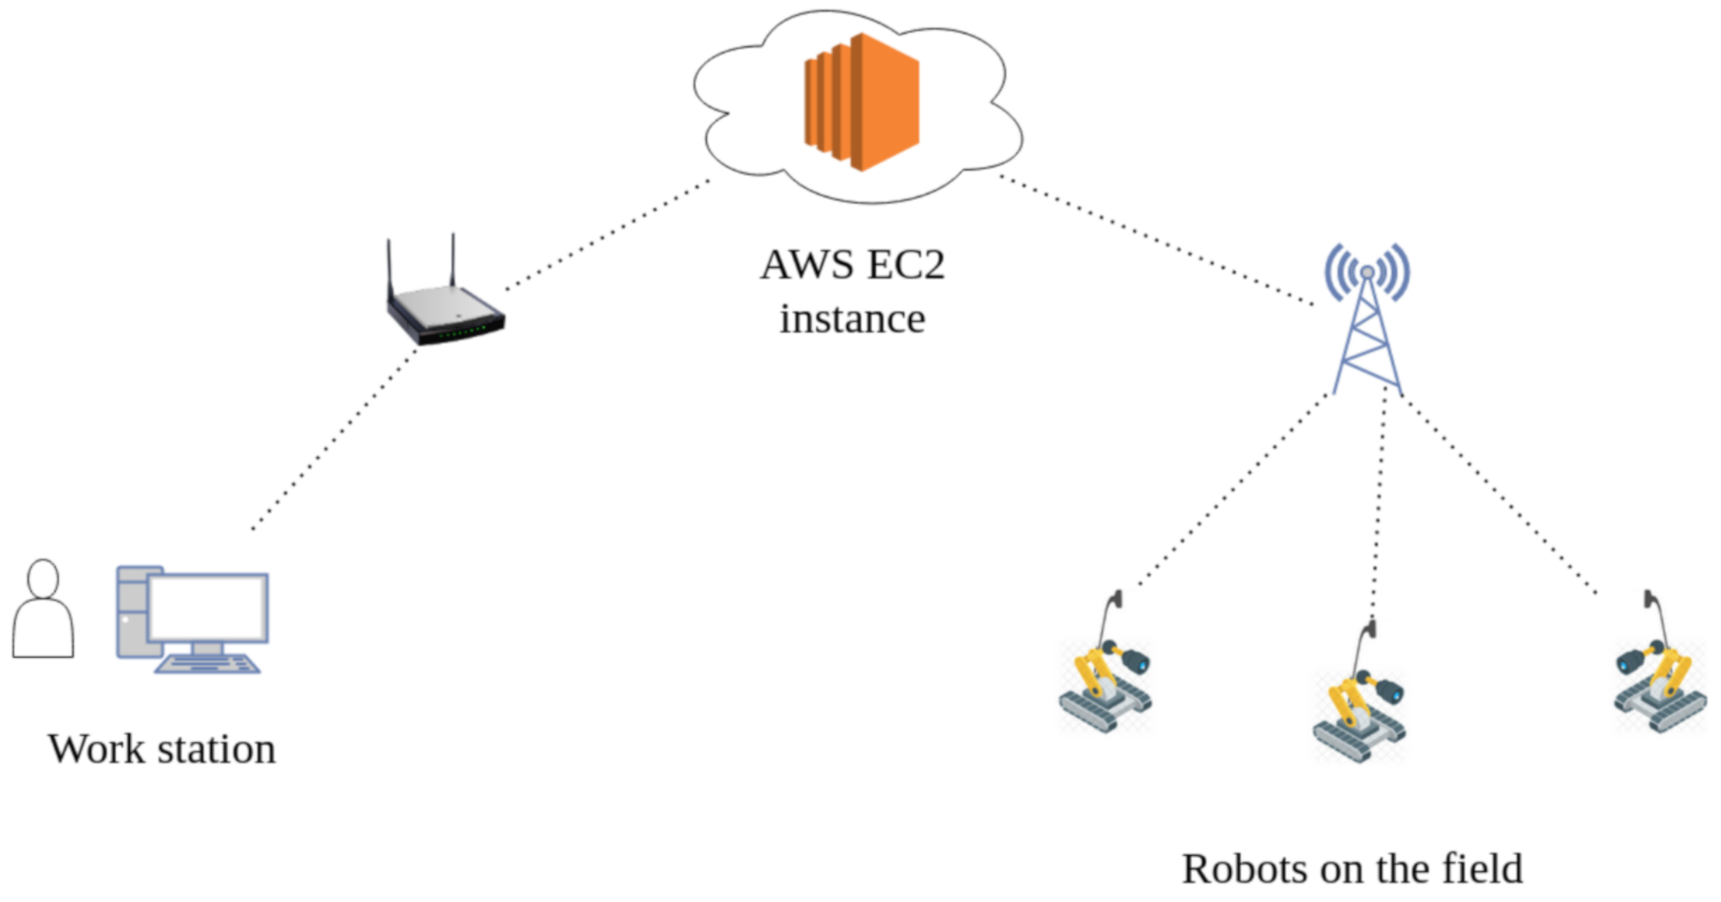
- Cloud Server: This is where the service will be deployed. The robot will transmit the location coordinates and the air-quality data to the cloud server.
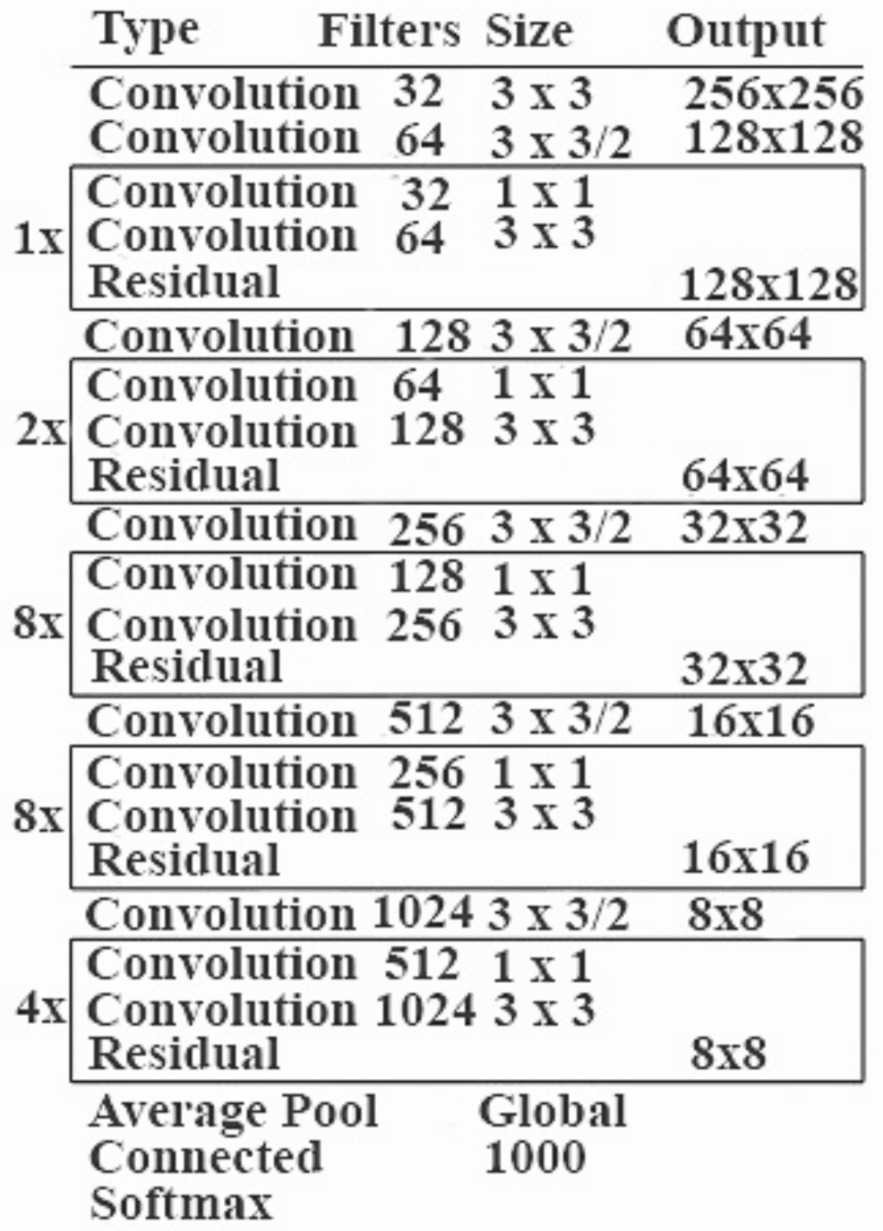
5.1. Video Detection Architecture
Advantages of Using YOLO
- Instead of employing a two-step approach for object classification and localization, YOLO uses a single CNN for both classification and localization.
- YOLO can process photos at a rate of 40-90 frames per second. This means that streaming video can be handled in real time, with only a few milliseconds of latency.
- YOLO’s architecture makes it exceptionally quick. It is 1000 times faster than the R-CNN and 100 times faster than the fast R-CNN [4].
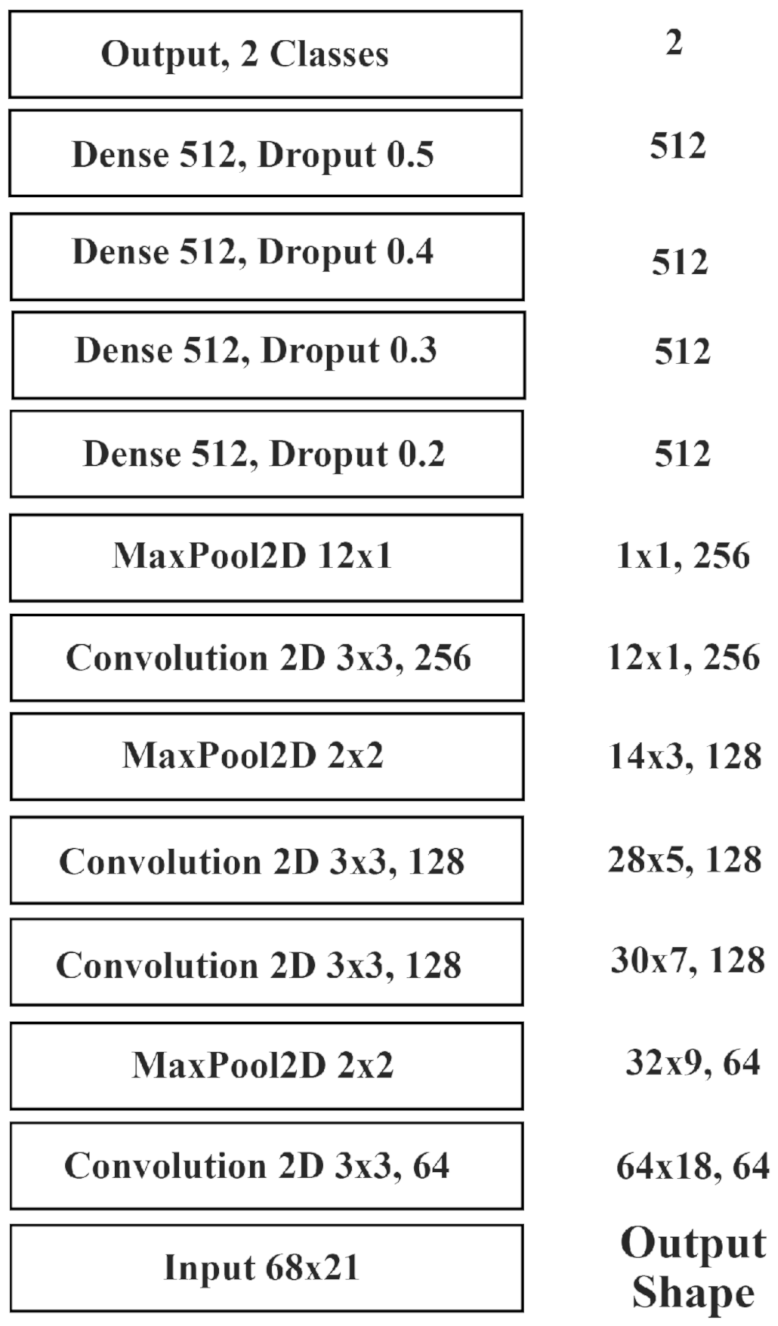
5.2. Audio Detection Architecture
5.3. Internet of Things (IoT)
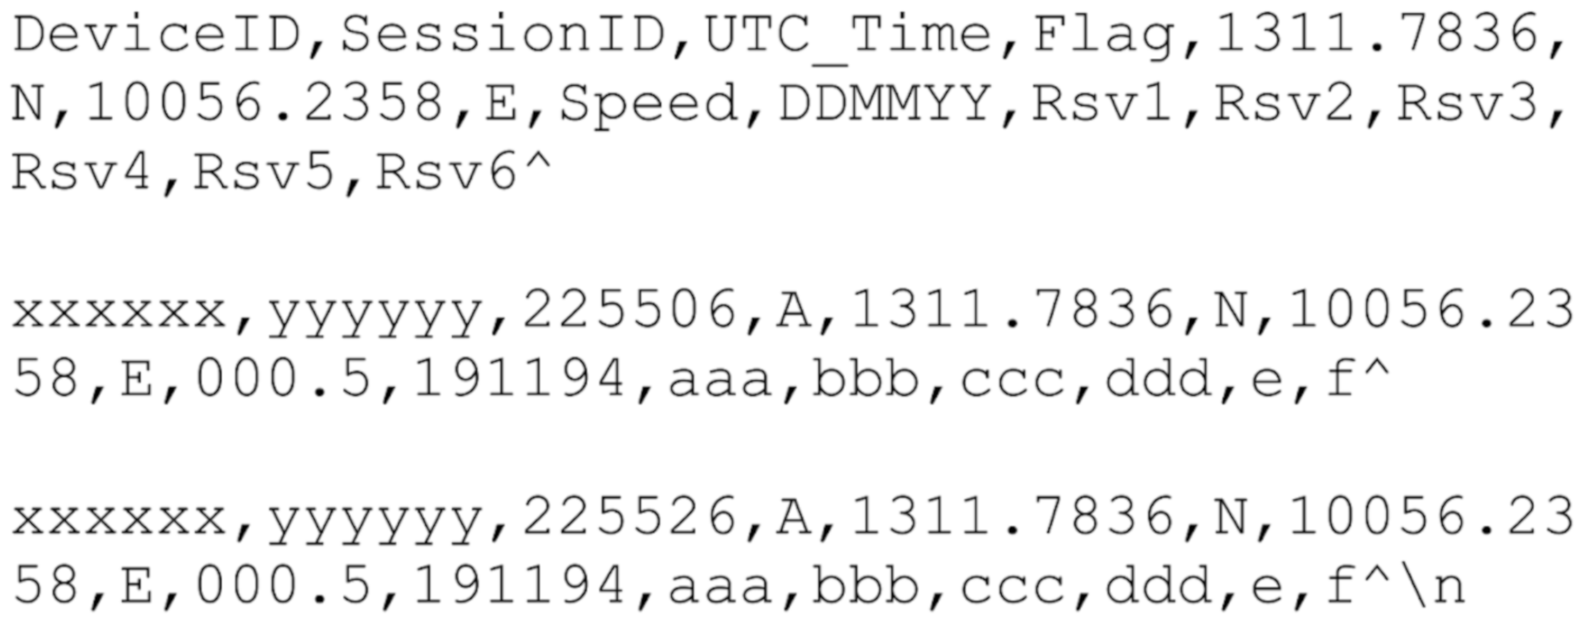
5.3.1. Transmitting Location Coordinates
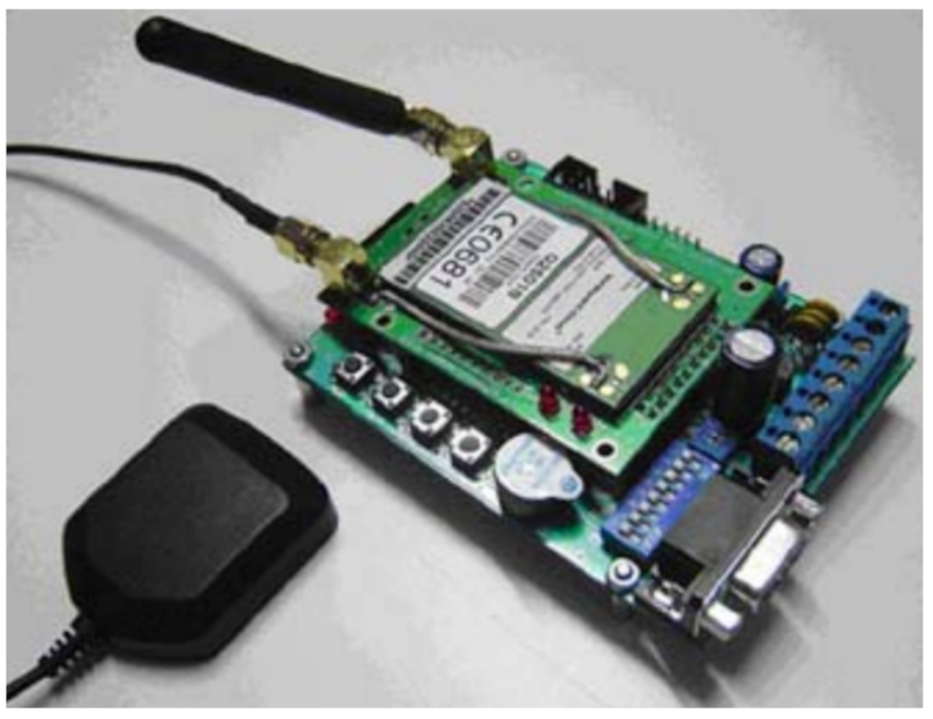
5.3.2. GPS Tracking Module
5.3.3. Geo-Tracking Firmware
5.3.4. Geo-Tracking Server
5.3.5. Monitoring Air Quality
5.3.6. Component Overview
- Power Module: A power supply, which might be a battery or a controlled power source device, is utilized to give electric power to the boards [5].
- Controller Module: An Arduino UNO is a controller for a function that already exists. The Arduino board converts analog data from a sensor into cutting-edge data [5].
- Internet of Things (IoT) Module: The IoT board hoists a variety of web/online application requirements. It is the strongest tool in the arsenal of a system architect. It can be used to add web networks to applications effectively, quickly, and flawlessly. It is an ideal module to use for remote data transmission and remote sensing and controlling, owing to the module’s UART refresh feature and site page control [5].
- Sensor Module: Sensors are used to detect distinct turbulence and frameworks in the atmosphere and in the soil, as well as to gauge the atmospheric conditions. Some notable sensors are DHT11, Temperature Sensor (LM35), and Carbon Monoxide (CO) Sensor [5].
5.3.7. Process Flow
- Connect the sensors to the microcontroller board.
- Invoke the sensors to detect the required parameters (temperature, etc.).
- Process the data to convert it into the required format as stated in Figure 8.
- Serialize the data so that it can be transmitted over the network.
- Initialize the WiFi module added to the Arduino board to transmit the data over the network.
- Transmit the data to the centralized cloud server.
5.4. Cloud Server
6. Multi Robot Coverage and Path Planning
6.1. Introduction
- Comprehensive coverage.
- The operation without any prior preparation.
- The full use of multi-robot dynamics.
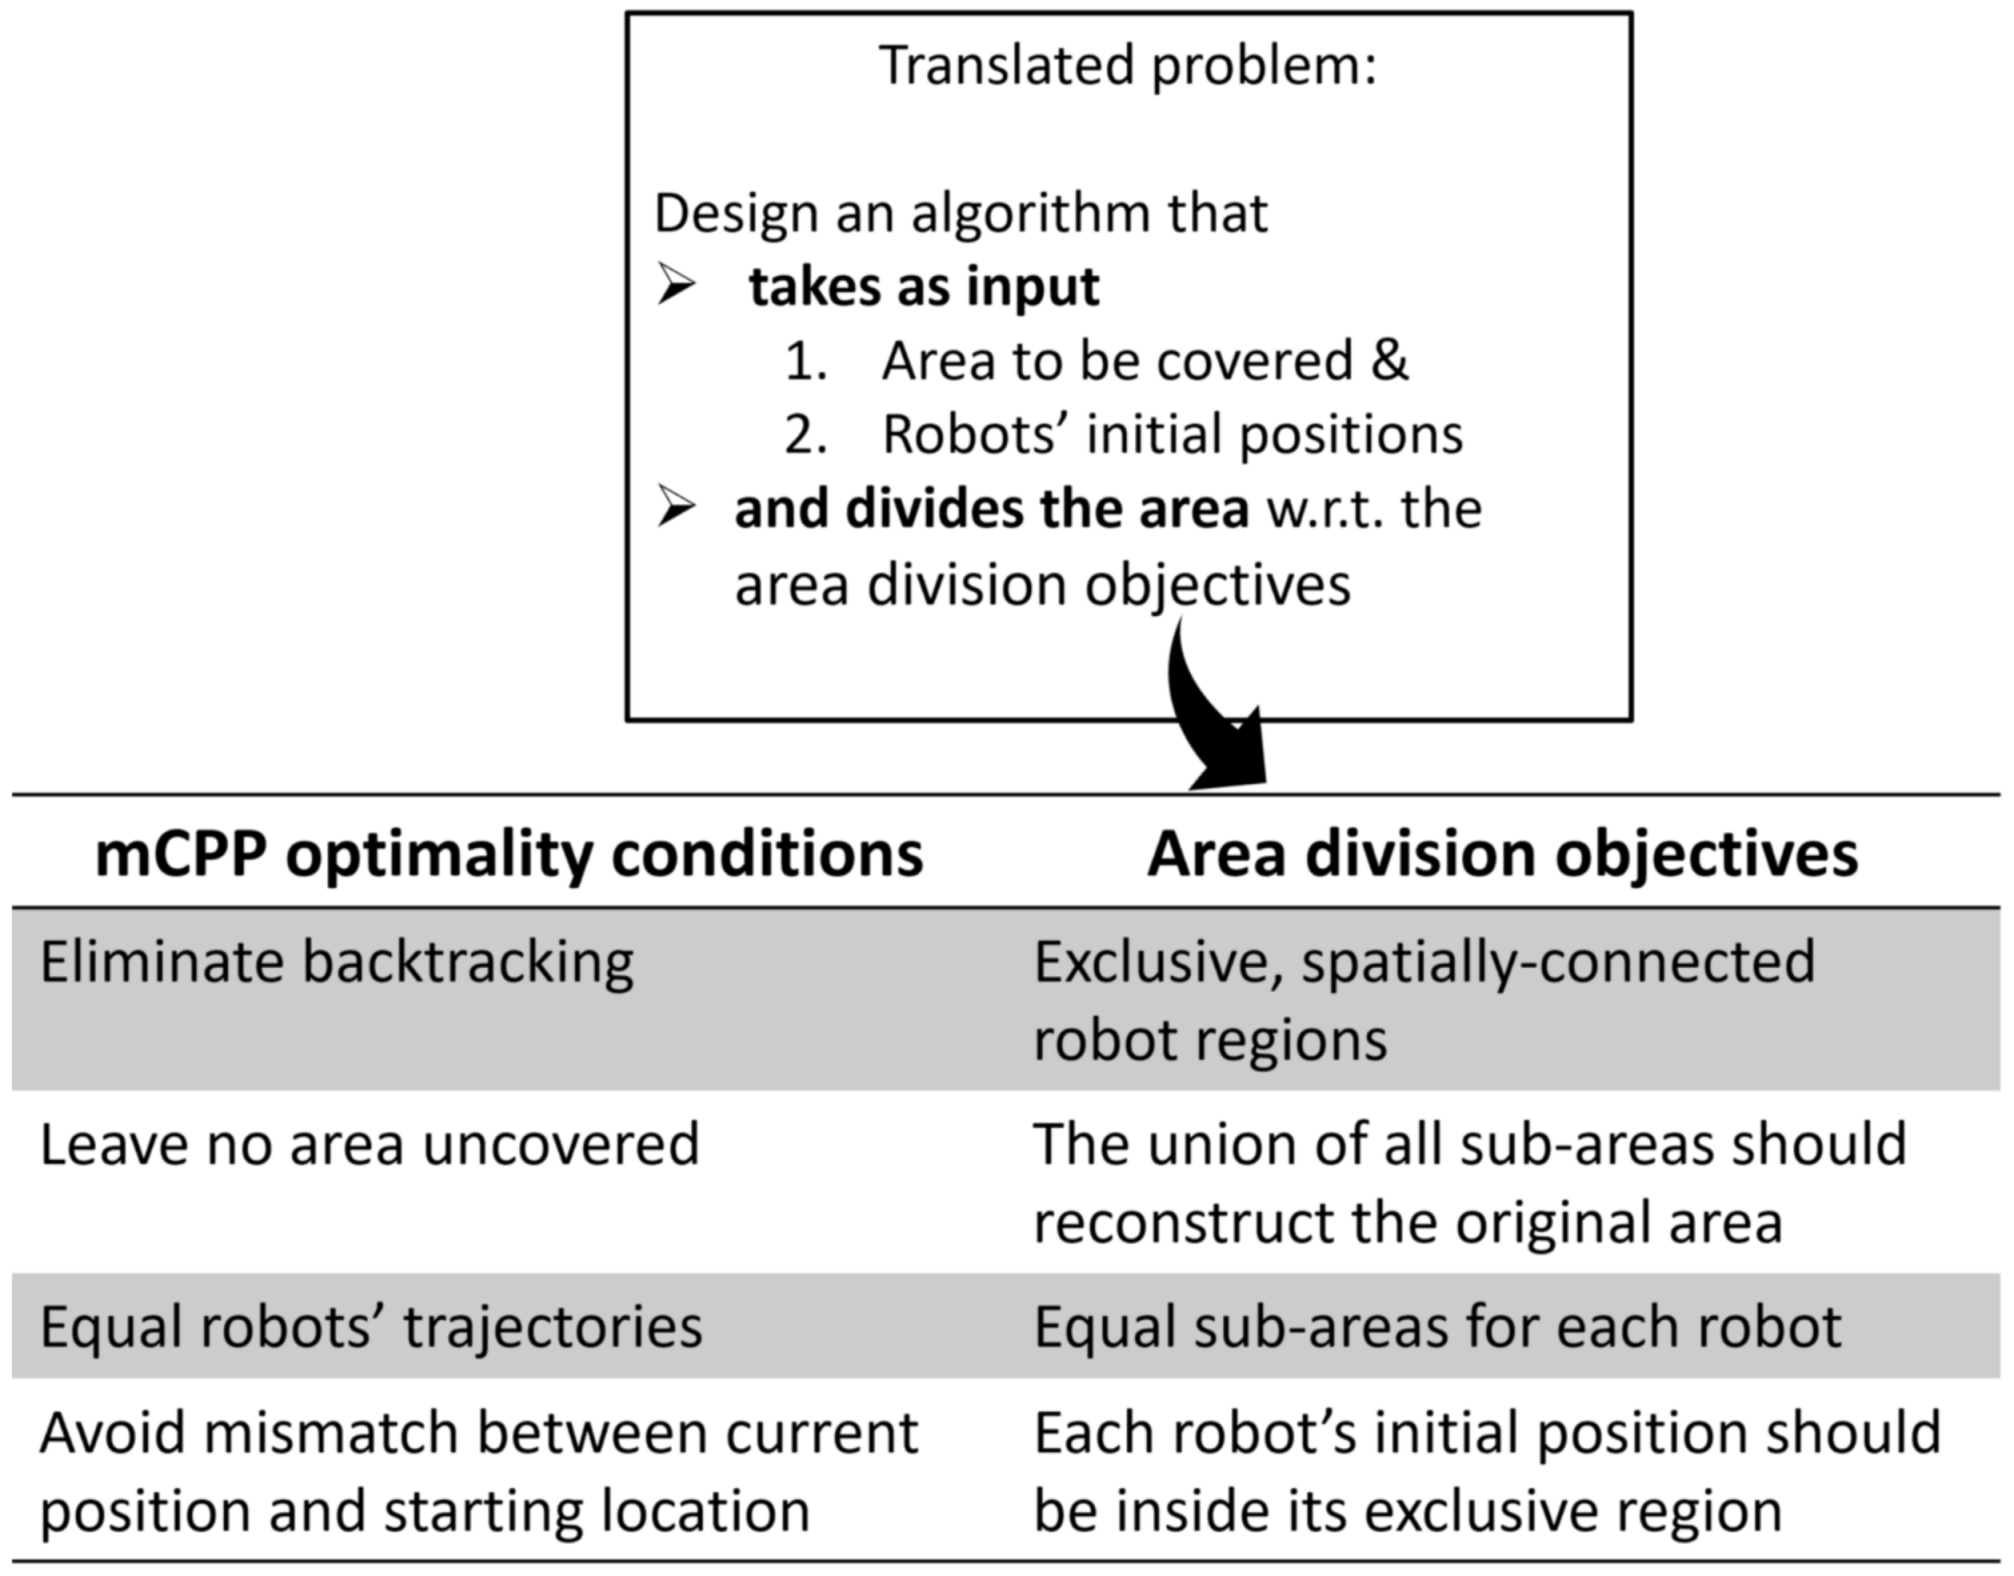
6.2. Problem Formulation
6.3. Voronoi Space Partitioning
6.4. Divide Areas Algorithm for Multi-Robot Coverage and Path Planning Problem
- Coordinate descent algorithms guarantee convergence.
- It has a fast optimization procedure.
- It is very simple to implement.
- There is no guarantee of spatial connectivity inside each robot’s domain.
| Algorithm 1 DARP Algorithm |
|
7. Experiment
7.1. Setup
7.2. Working
| Algorithm 2 Algorithm to find out the intersection between intervals |
|
8. Results
Performance Analysis
9. Concerns
10. Conclusions and Future Scope
Future Scope
Author Contributions
Funding
Institutional Review Board Statement
Informed Consent Statement
Data Availability Statement
Conflicts of Interest
References
- World Disasters Report 2020: Come Heat or High Water—Tackling the Humanitarian Impacts of the Climate Crisis Together [EN/AR]; Disaster Report; International Federation of Red Cross and Red Crescent Societies: Geneve, Stwitzerland, 2020.
- Sambolek, S.; Ivasic-Kos, M. Automatic Person Detection in Search and Rescue Operations Using Deep CNN Detectors. IEEE Access 2021, 9, 37905–37922. [Google Scholar] [CrossRef]
- Alsamhi, S.H.; Almalki, F.; Ma, O.; Ansari, M.S.; Lee, B. Predictive estimation of optimal signal strength from drones over IoT frameworks in smart cities. IEEE Trans. Mob. Comput. 2021. [Google Scholar] [CrossRef]
- Shinde, S.; Kothari, A.; Gupta, V. YOLO based Human Action Recognition and Localization. Procedia Comput. Sci. 2018, 133, 831–838. [Google Scholar] [CrossRef]
- Bharathi, R.U.; Seshashayee, M. Weather and Air Pollution real-time Monitoring System using Internet of Things. Int. J. Innov. Technol. Explor. Eng. (IJITEE) 2019, 8, 348–354. [Google Scholar]
- Clavel, C.; Vasilescu, I.; Devillers, L.; Richard, G.; Ehrette, T. Fear-type emotion recognition for future audio-based surveillance systems. Speech Commun. 2008, 50, 487–503. [Google Scholar] [CrossRef] [Green Version]
- Venkataramanan, K.; Rajamohan, H.R. Emotion recognition from speech. arXiv 2019, arXiv:1912.10458. [Google Scholar]
- Guizzo, E.; Weyde, T.; Leveson, J.B. Multi-time-scale convolution for emotion recognition from speech audio signals. In Proceedings of the ICASSP 2020—2020 IEEE International Conference on Acoustics, Speech and Signal Processing (ICASSP), Barcelona, Spain, 4–8 May 2020. [Google Scholar]
- Khalil, R.A.; Jones, E.; Babar, M.I.; Jan, T.; Zafar, M.H.; Alhussain, T. Speech emotion recognition using deep learning techniques: A review. IEEE Access 2019, 7, 117327–117345. [Google Scholar] [CrossRef]
- Lygouras, E.; Santavas, N.; Taitzoglou, A.; Tarchanidis, K.; Mitropoulos, A.; Gasteratos, A. Unsupervised human detection with an embedded vision system on a fully autonomous UAV for search and rescue operations. Sensors 2019, 19, 3542. [Google Scholar] [CrossRef] [Green Version]
- Bejiga, M.B.; Zeggada, A.; Nouffidj, A.; Melgani, F. A convolutional neural network approach for assisting avalanche search and rescue operations with UAV imagery. Remote Sens. 2017, 9, 100. [Google Scholar] [CrossRef] [Green Version]
- Llasag, R.; Marcillo, D.; Grilo, C.; Silva, C. Human detection for search and rescue applications with uavs and mixed reality interfaces. In Proceedings of the 2019 14th Iberian Conference on Information Systems and Technologies (CISTI), Coimbra, Portugal, 19–22 June 2019. [Google Scholar]
- Tolstaya, E.; Paulos, J.; Kumar, V.; Ribeiro, A. Multi-robot coverage and exploration using spatial graph neural networks. arXiv 2020, arXiv:2011.01119. [Google Scholar]
- Tihanyi, D.; Lu, Y.; Karaca, O.; Kamgarpour, M. Multi-robot task allocation for safe planning under dynamic uncertainties. arXiv 2021, arXiv:2103.01840. [Google Scholar]
- Rekleitis, I.; New, A.P.; Rankin, E.S.; Choset, H. Efficient boustrophedon multi-robot coverage: An algorithmic approach. Ann. Math. Artif. Intell. 2008, 52, 109–142. [Google Scholar] [CrossRef] [Green Version]
- Batalin, M.A.; Sukhatme, G.S. The analysis of an efficient algorithm for robot coverage and exploration based on sensor network deployment. In Proceedings of the 2005 IEEE International Conference on Robotics and Automation, Barcelona, Spain, 18–22 April 2005. [Google Scholar]
- Shaban, K.B.; Kadri, A.; Rezk, E. Urban Air Pollution Monitoring System with Forecasting Models. IEEE Sens. J. 2016, 16, 2598–2606. [Google Scholar] [CrossRef]
- Kularatna, N.; Sudantha, B.H. An Environmental Air Pollution Monitoring System Based on the IEEE 1451 Standard for Low Cost Requirements. IEEE Sens. J. 2008, 8, 415–422. [Google Scholar] [CrossRef]
- Dhingra, S.; Madda, R.B.; Gandomi, A.H.; Patan, R.; Daneshmand, M. Internet of Things Mobile–Air Pollution Monitoring System (IoT-Mobair). IEEE Internet Things J. 2019, 6, 5577–5584. [Google Scholar] [CrossRef]
- Jung, Y.; Lee, Y.K.; Lee, D.; Ryu, K.; Nittel, S. Air Pollution Monitoring System based on Geosensor Network. In Proceedings of the IEEE International Geoscience & Remote Sensing Symposium, IGARSS 2008, Boston, MA, USA, 8–11 July 2008; pp. 1370–1373. [Google Scholar] [CrossRef]
- Walker, J. Search and Rescue Robots—Current Applications on Land, Sea, and Air; EMERJ: Boston, MA, USA, 2019. [Google Scholar]
- Chadil, N.; Russameesawang, A.; Keeratiwintakorn, P. Real-time tracking management system using GPS, GPRS and Google earth. In Proceedings of the 2008 5th International Conference on Electrical Engineering/Electronics, Computer, Telecommunications and Information Technology, Krabi, Thailand, 14–17 May 2008; Volume 1, pp. 393–396. [Google Scholar] [CrossRef]
- Dutta, P.; Dutta, P. Comparative Study of Cloud Services Offered by Amazon, Microsoft and Google. Int. J. Trend Sci. Res. Dev. 2019, 3, 981–985. [Google Scholar] [CrossRef]
- Kapoutsis, A.C.; Chatzichristofis, S.A.; Kosmatopoulos, E.B. DARP: Divide Areas Algorithm for Optimal Multi-Robot Coverage Path Planning. J. Intell. Robot. Syst. 2017, 86, 663–680. [Google Scholar] [CrossRef] [Green Version]
- Tzanetakis, G.; Cook, P. Musical genre classification of audio signals. IEEE Trans. Speech Audio Process. 2002, 10, 293–302. [Google Scholar] [CrossRef]
- Scheirer, E.; Slaney, M. Construction and evaluation of a robust multifeature speech/music discriminator. In Proceedings of the 1997 IEEE International Conference on Acoustics, Speech, and Signal Processing, Munich, Germany, 21–24 April 1997; Volume 2, pp. 1331–1334. [Google Scholar] [CrossRef]
- Snyder, D.; Chen, G.; Povey, D. Musan: A music, speech, and noise corpus. arXiv 2015, arXiv:1510.08484. [Google Scholar]
- Lin, T.-Y.; Maire, M.; Belongie, S.; Bourdev, L.; Girshick, R.; Hays, J.; Perona, P.; Ramanan, D.; Zitnick, C.L.; Dollár, P. Microsoft COCO: Common Objects in Context. In Proceedings of the European Conference on Computer Vision, Zurich, Switzerland, 6–12 September 2014. [Google Scholar]
- Redmon, J.; Farhadi, A. YOLOv3: An Incremental Improvement. arXiv 2018, arXiv:1804.02767. [Google Scholar]
- Doukhan, D.; Carrive, J.; Vallet, F.; Larcher, A.; Meignier, S. An Open-Source Speaker Gender Detection Framework for Monitoring Gender Equality. In Proceedings of the 2018 IEEE International Conference on Acoustics, Speech and Signal Processing (ICASSP), Calgary, AB, Canada, 15–20 April 2018; pp. 5214–5218. [Google Scholar] [CrossRef] [Green Version]
- Alsamhi, S.H.; Almalki, F.A.; Al-Dois, H.; Shvetsov, A.V.; Ansari, M.S.; Hawbani, A.; Gupta, S.K.; Lee, B. Multi-drone edge intelligence and SAR smart wearable devices for emergency communication. Wirel. Commun. Mob. Comput. 2021, 2021, 6710074. [Google Scholar] [CrossRef]
- Heinzmann, J.; Zelinsky, A. Quantitative safety guarantees for physical human-robot interaction. Int. J. Robot. Res. 2016, 22, 479–504. [Google Scholar] [CrossRef]
- Jimenez, P.; Thomas, F.; Torras, C. Collision detection algorithms for motion planning. In Robot Motion Planning and Control; Lecture Notes in Control and Information Sciences; Springer: London, UK, 1998; Volume 229, pp. 305–343. [Google Scholar]
- Bicchi, A.; Tonietti, G. Dealing with the safety-performance tradeoff in robot arms design and control. IEEE Robot. Autom. Mag. 2004, 11, 22–33. [Google Scholar] [CrossRef]
- Mitsantisuk, C.; Ohishi, K.; Katsura, S. Estimation of action/reaction forces for the bilateral control using Kalman filter. IEEE Trans. Ind. Electron. 2012, 59, 4383–4393. [Google Scholar] [CrossRef]
- Pillai, B.M.; Suthakorn, J. Challenges for Novice Developers in Rough Terrain Rescue Robots: A Survey on Motion Control Systems. J. Control Sci. Eng. 2019, 2019, 2135914. [Google Scholar] [CrossRef]
- Laijawala, V.; Masurkar, M.; Khandekar, R. Air Quality Monitoring System. 2019. Available online: https://ssrn.com/abstract=3454389 (accessed on 14 April 2022).


| Task Undertaken | Learning Type | Training Used | Simulation via | ||||
|---|---|---|---|---|---|---|---|
| Reference Paper | Human Recognition | Emotion Recognition | CNN | RNN | Unsupervised Learning | Supervised Learning | Computer Vision |
| Chloé Clavel [6] | - | ✔ | × | × | ✔ | × | - |
| Kannan, Haresh [7] | - | ✔ | ✔ | ✔ | × | × | - |
| Eric Guizzo, Tillman [8] | - | ✔ | ✔ | × | × | × | - |
| Khalil, Ruhul Amin [9] | - | ✔ | ✔ | ✔ | × | × | - |
| Lygouras, Eleftherios [10] | ✔ | - | × | × | × | ✔ | ✔ |
| Bejiga, Mesay Belete [11] | ✔ | - | ✔ | × | × | × | × |
| Llasag, Raúl [12] | ✔ | - | × | × | × | × | ✔ |
| Reference Paper | Path Planning | Greedy Algorithm | Sensor Network | Coverage Exploration | GNN | Robot Task Allocation |
|---|---|---|---|---|---|---|
| Tolstaya, Ekaterina [13] | ✔ | ✔ | × | × | × | ✔ |
| Tihanyi, Daniel [14] | ✔ | ✔ | × | × | × | ✔ |
| Rekleitis, Ioannis [15] | ✔ | ✔ | × | ✔ | × | × |
| Batalin, Maxim A., and Gaurav S. [16] | × | × | ✔ | ✔ | × | × |
| Parameter | Amazon AWS | Google Cloud | Microsoft Azure |
|---|---|---|---|
| IoT Device Security | High | Low | Medium |
| Security and Compliance Service | Medium | Low | Medium |
| Backup and Recovery | Medium | None | High |
| Identity and Access Management | High | High | Medium |
| Key Management Services | High | High | High |
| Web Application Firewall | High | High | High |
| Method Used | Sensor Used | |||||
|---|---|---|---|---|---|---|
| Reference Paper | Internet of Things | Wireless Sensor Networks | Gas Sensor | Temperature and Humidity Sensor | Sound Sensor | Rain Sensor |
| R. Udaya Bharathi, M. Seshashayee [5] | ✔ | × | ✔ | ✔ | ✔ | ✔ |
| Khaled Bashir Shaban, Abdullah Kadri [17] | × | ✔ | ✔ | ✔ | × | × |
| Nihal Kularatna, B. H. Sudantha [18] | × | × | ✔ | × | × | × |
| Swati Dhingra, Rajasekhara Babu, Amir Gandomi [19] | ✔ | × | ✔ | × | × | × |
| Young Jin Jung, Yang Koo Lee, Dong Gyu Lee [20] | × | ✔ | ✔ | ✔ | × | × |
| Total Video | Human Detection Duration (s) | Accuracy | ||||
|---|---|---|---|---|---|---|
| Sample Number | Duration (s) | Using Audio Only | Using Video Only | Overall Time Detected | Actual Time Detected | (%) |
| 1 | 22.83 | 18 | 3.6 | 19.8 | 20 | 99 |
| 2 | 20.71 | 16 | 15.6 | 17.4 | 19 | 91.58 |
| 3 | 26.07 | 26.1 | 3.9 | 25.8 | 26 | 99.23 |
| 4 | 20.01 | 15.8 | 0 | 15.8 | 16 | 98.75 |
| 5 | 15.38 | 0 | 12.3 | 12.3 | 13 | 94.62 |
| 6 | 13.01 | 8 | 12.4 | 12.4 | 13 | 95.39 |
| 7 | 8.17 | 6.5 | 1.8 | 6.5 | 7 | 92.86 |
| 8 | 24.9 | 9.1 | 0 | 9.1 | 10 | 91 |
| 9 | 16 | 16 | 6 | 16 | 16 | 100 |
| 10 | 25 | 14.2 | 19.6 | 23 | 24 | 95.83 |
| S. No. | Method | Mean Average Precision (mAP) | Size (MB) |
|---|---|---|---|
| 1 | SSD321 | 45.4 | 410.21 |
| 2 | DSSD321 | 46.1 | 510.34 |
| 3 | R-FCN | 51.9 | 454.98 |
| 4 | RetinaNet-50-500 | 50.9 | 584.66 |
| 5 | Our Model | 70.2 | 366.10 |
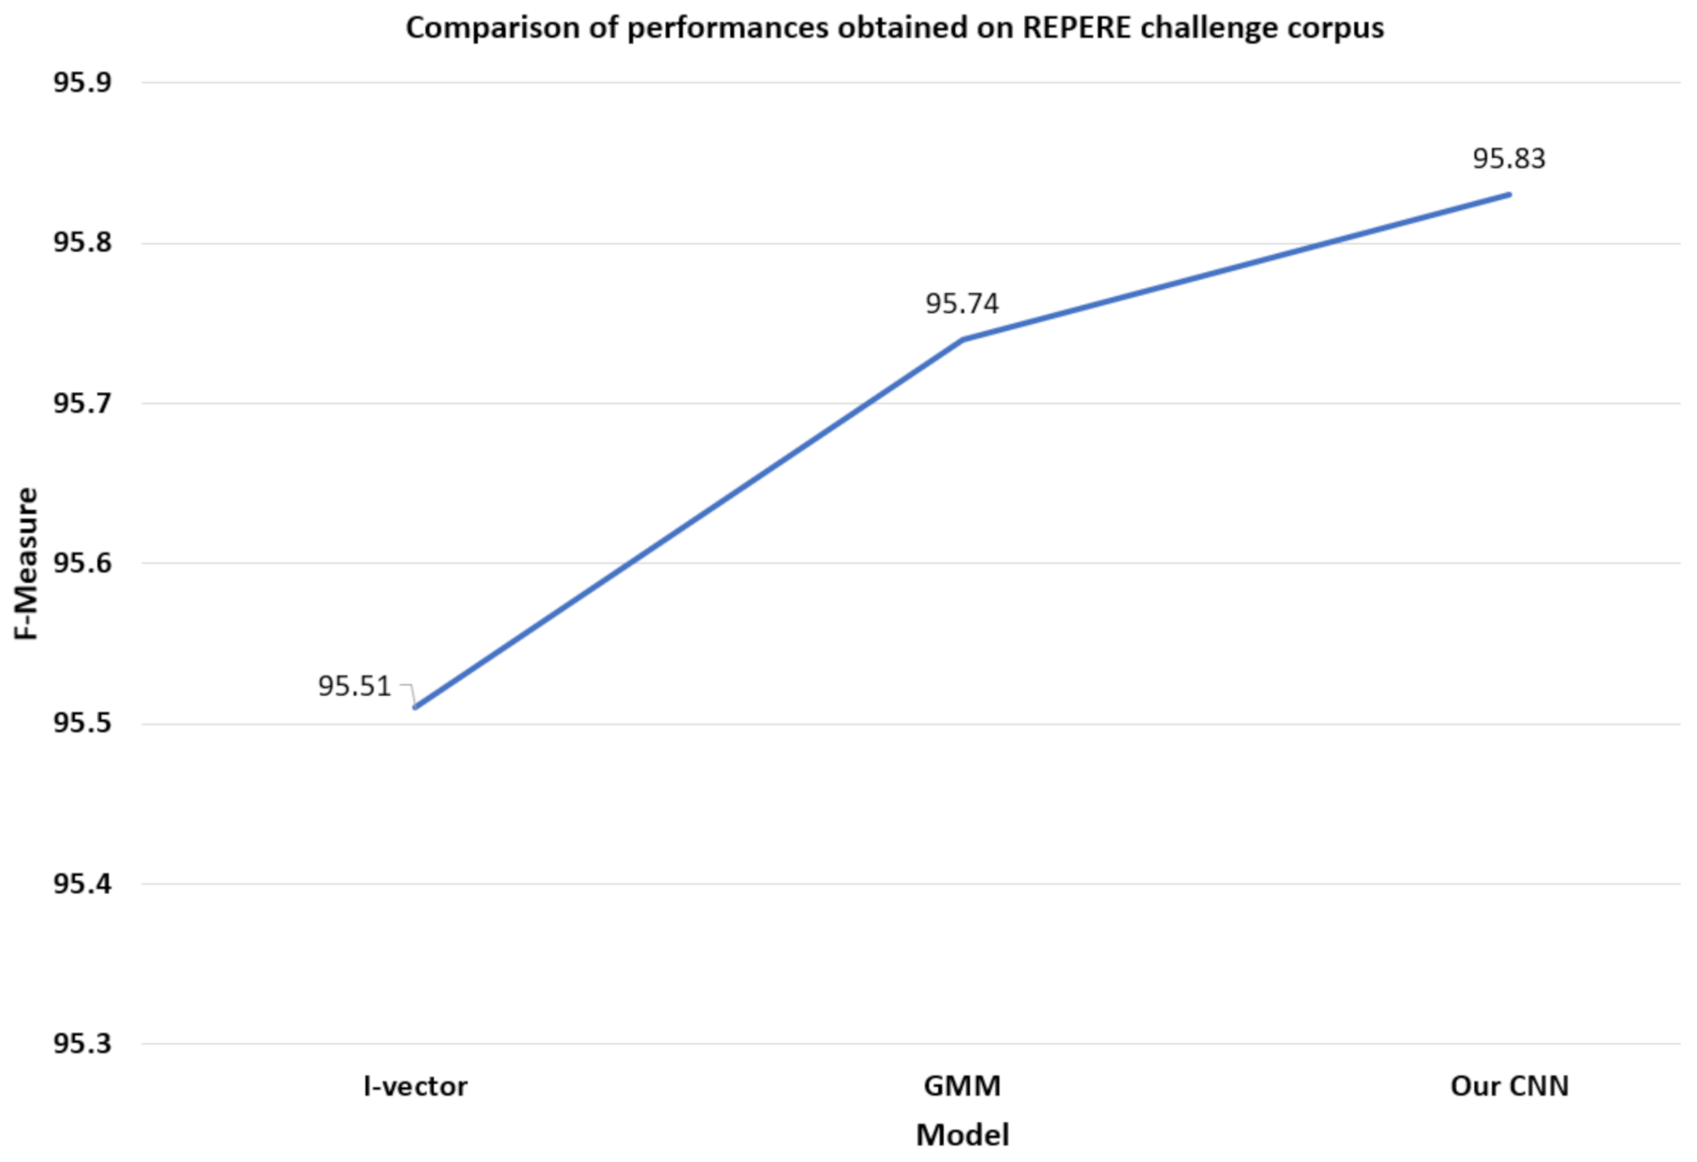
| S. No. | Model | F-Measure |
|---|---|---|
| 1 | GMM | 95.74 |
| 2 | I-vector | 95.51 |
| 3 | Our Model | 95.83 |
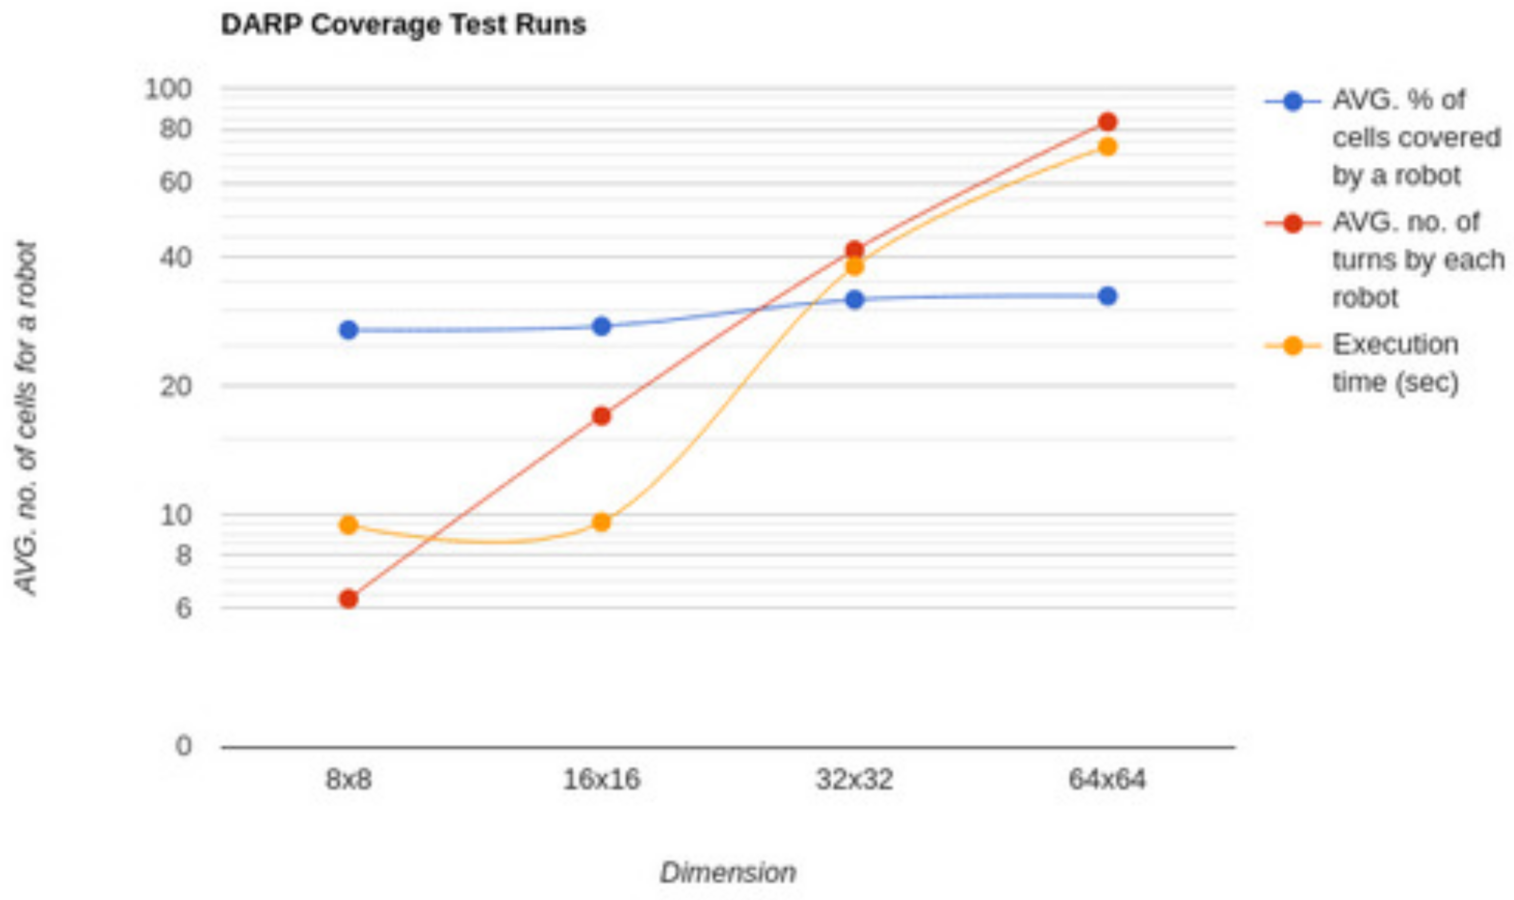
| S. No. | Dimension | Average Percentage of Cells for a Robot | Average Number of Turns | Execution Time (seconds) |
|---|---|---|---|---|
| 1 | 8 × 8 | 27.07 | 6.33 | 9.43 |
| 2 | 16 × 16 | 27.6 | 17 | 9.58 |
| 3 | 32 × 32 | 31.9 | 41.66 | 38.19 |
| 4 | 64 × 64 | 32.51 | 83.33 | 72.94 |
Publisher’s Note: MDPI stays neutral with regard to jurisdictional claims in published maps and institutional affiliations. |
© 2022 by the authors. Licensee MDPI, Basel, Switzerland. This article is an open access article distributed under the terms and conditions of the Creative Commons Attribution (CC BY) license (https://creativecommons.org/licenses/by/4.0/).
Share and Cite
Sharma, K.; Doriya, R.; Pandey, S.K.; Kumar, A.; Sinha, G.R.; Dadheech, P. Real-Time Survivor Detection System in SaR Missions Using Robots. Drones 2022, 6, 219. https://doi.org/10.3390/drones6080219
Sharma K, Doriya R, Pandey SK, Kumar A, Sinha GR, Dadheech P. Real-Time Survivor Detection System in SaR Missions Using Robots. Drones. 2022; 6(8):219. https://doi.org/10.3390/drones6080219
Chicago/Turabian StyleSharma, Kaushlendra, Rajesh Doriya, Saroj Kumar Pandey, Ankit Kumar, G. R. Sinha, and Pankaj Dadheech. 2022. "Real-Time Survivor Detection System in SaR Missions Using Robots" Drones 6, no. 8: 219. https://doi.org/10.3390/drones6080219
APA StyleSharma, K., Doriya, R., Pandey, S. K., Kumar, A., Sinha, G. R., & Dadheech, P. (2022). Real-Time Survivor Detection System in SaR Missions Using Robots. Drones, 6(8), 219. https://doi.org/10.3390/drones6080219