Abstract
Numerous attempts have been made to extend the endurance of small unmanned aerial vehicles (UAVs) by improving their propulsion system. However, due to their non-linear setup, no study has been conducted on small electric UAVs’ architecture framework. This study established a novel propulsion system framework model by analyzing 42 existing UAV electric propulsion systems. The proposed framework-based complicated model includes a new torque factor used to determine the operating current and voltage of the system. This innovative approach improved the model accuracy for the non-linear behavioral nature-based electrical and mechanical systems. The findings include a reduced electrical current usage of up to 84% and an average reduction of 26%. In addition, the investigation also found that the durability of the propulsion systems improved by 53% on average. Similarly, improvements in the trust-to-weight ratio were also established. As a result, a method of propeller matching is presented to facilitate the broad implementation of the proposed framework. The performance of the existing propulsion system was enhanced by using the proposed framework.
1. Introduction
Nowadays, unmanned aerial vehicles (UAVs) and their implementation in real-time applications are emerging everywhere. Therefore, the entire aeronautical society focuses on the innovations and inventions of all UAVs. The research activities are enforced on all the emerging domains of UAVs through engineering approaches, such as analytical formulations, experimental tests, and computational predictions. This work deals with one approach: computational-method-based advanced perspective studies on UAVs and their component selections. This work mainly focused on detailed computational investigations of small electric UAV propulsion systems, where an innovative design framework was proposed for the UAV industry.
1.1. Unmanned Aircraft System
In recent years, the development of small unmanned aerial vehicles (UAVs) has been of great interest, and many have been deployed for emergencies. UAVs can execute the mission without the control of onboard crew members. The difficult and dangerous environments are handled by UAVs, which reduce the crew in critical applications and thereby increase the lifetime of human operators. Everything nowadays is either mechanized or controlled by some remote device. Because of this, airplanes without onboard pilots are generally referred to as UAVs since they can be automated or remotely operated from the ground. Both RC and automated UAVs have the flexibility to perform a wide range of tasks dependent on the input of ground pilots. Still, the latter is built to carry out predetermined missions.
UAVs have come a long way in the previous two decades. These UAVs come in various types, each with advantages and disadvantages in, for example, operational range, lift generation, or performance metrics. Combat and other UAVs can be the size of a small plane. In contrast, smaller UAVs can be integrated into more mundane aspects of life. Because of technological advancements in areas such as fabrication, navigation, and control and power systems, a diverse array of UAVs has been developed for use in settings where the presence of humans would be impractical, inadvisable, or even dangerous. UAVs are unmanned aircraft that rely only on remote controls and electronic communication networks.
Because of the complexity, careful planning is required. Although UAVs have many parts, they are typically sorted into groups based on their size and the environment in which they operate. These include the high-altitude long-endurance variant, which can fly for more than 24 h at an altitude of more than 15,000 m. The medium-altitude long-endurance variant can fly between 5000 and 15,000 m. The terminal ultra-long-range variant can fly between 100 and 300 km, and the close-range UAV variant can fly for less than 100 km. It is a micro air vehicle with a wingspan of less than 150 mm, but it has the range of a medium-sized UAV (up to 30 km).
Multirotor, fixed wing, rotary wing, and hybrid are the four primary groups of UAVs. For propulsion and maneuverability, the multirotor UAV employs several rotors. The primary portion of fixed-wing UAVs is the fixed wing, which provides lift, much like an airplane’s wings. Like a helicopter, rotary-wing UAVs have a main rotor and a tail rotor for precise control. Hybrid UAVs combine features from multiple different types of UAVs. Depending on the specifics of the UAV, we can further divide it into several subtypes. Based on the number of rotors, multirotor UAVs are categorized as bicopter, tricopter, quadcopters, etc. A unique wing-and-tail-design combination, propulsion system, and other features distinguish different fixed-wing UAVs. Two basic rotary-wing UAVs are coaxially driven and single-rotor with tail rotors. There are five different sizes of UAVs based on their payload capacity, from nano to micro and small to big. Vertical takeoff and landing, horizontal takeoff and landing, and short takeoff and landing are all ways that aircraft can take to the air and land. Distance and height are two other primary categories. When choosing a UAV, it is important to consider its dimensions, mass, and propulsion mechanisms. Ornithopters, unmanned aerial vehicles designed to look like birds or insects, are one example of the novel types of UAVs that have emerged in recent years.
1.2. Small Electric Unmanned Aerial Vehicles
The electric UAV is pushed to its limits in all areas of study, including structure, electronics, aerodynamics, and propulsion [1,2,3], because the electric UAV must accommodate multiple sizes and functionalities. Because endurance is a huge concern, unmanned aerial vehicles that need a good power source can only be used for a short duration [4,5]. New research has been conducted, and additional efforts have been made to test the boundaries of the UAV propulsion system [6,7]. The two potential solutions are to either look for a power source with a higher power density or build a more efficient arrangement for the propulsion system. Power sources such as fuel cells, lithium polymer batteries, and solar power have all been the subject of several studies [8,9,10,11] for long-endurance UAVs. On the other side, little research was performed to figure out a good layout for the propulsion system to make it function more effectively.
Nevertheless, most research studies of the earlier work on propulsion systems [12,13,14] had the same principal objective: to increase the system’s endurance and, ultimately, the UAV’s overall performance. According to certain models, the most important factors determining endurance are the vehicle’s mass, structure, and cruising speed [8,15,16]. In the meantime, most models consider the battery requirements and optimize them to deliver the greatest amount of durability. Generally, the UAV propulsion system can draw a constant continuous current from a battery pack. However, the voltage input from the battery pack varies as per the state of the charge level. Therefore, a reduction in current does reduce the power output non-linearly. For example, at the beginning of a mission, a battery pack delivers its peak voltage and reduces over the mission flight phases. In addition, parameters such as the system’s resistance further contribute to a non-linear outcome in power output.
However, each takes a unique approach to solving an issue by improving a different facet of the UAV. Even if the optimization of each component produced satisfactory results, it is essential to conduct a thorough performance analysis of the integrated system as a whole. In order to solve the problem, a better design framework needs to be developed which quantitatively describes the system’s electrical current usage as a critical element in the system’s energy conversion. These goals can be accomplished simultaneously. Previous attempts to create this model have shown promise but are lacking in a few essential components [17,18,19,20]. Determining the system’s working RPM while under load is the most important step in building an effective propulsion system (i.e., propeller). In addition to this, it is necessary to have specifics regarding the components, which the manufacturer typically does not disclose. In addition, one of the most challenging aspects of UAV design has always been finding the ideal motor and propeller combination. The modelling of integrated electric propulsion is the focus of this research—more specifically, the optimal size for propellers, which significantly impacts the efficiency with which propulsion systems operate.
As a result, a recently developed model of an electric propulsion system can estimate the system’s performance and operational range based on the load applied to the system (i.e., chosen propeller size). This model supplies the necessary data and a suitable selection procedure to facilitate the development of an effective propulsion system. The model functions are determined solely by the COTS (commercial off-the-shelf) data inputs, thus allowing for the efficient operating range to be analyzed and calculated. To better understand the resilience of the suggested design framework model, it was tested on 42 different electric propulsion combinations. It is fascinating to learn that the proposed model for an electric propulsion system improved 40 of the 42 systems evaluated by just increasing the size of the propellers.
Previously published articles were primarily focused on performance investigations on drone parts through experimental tests, analytical formulations, and low-complexity-equipped computational approaches [1,2,3,4,5,6,7,8,9,10,11,12,13,14,15,16,17,18,19,20,21,22,23,24,25,26,27,28,29,30,31,32,33,34,35,36,37,38,39,40,41,42,43,44,45,46,47,48,49,50,51,52,53,54]. Apart from these engineering-approaches-based investigations, the trial-and-error methods relaying the development of drones have been used in UAV industries. Only some extended works used computational approaches for one and two parts of the propulsion system of drones. However, this work imposed a computational approach in the entire setup of the propulsion system of small electrical UAVs, so the authors finally found a suitable design framework model. Through this, the upcoming researchers can choose suitable drone parts for their focused applications. The work that is being proposed is divided into five sections: the first section discusses the preface details about UAVs and UAS; the second section discusses the electrical propulsion system and its components; the third section discusses the methods and optimization involved in the design framework of the electrical propulsion system; the fourth section discusses the results and discussions of motor outputs; and the final section discusses the conclusions that were obtained.
2. Electrical Propulsion System of Small UAV
Typically, a propulsion system includes three distinct components: (1) an energy storage component, (2) an energy converter component, and (3) a thrust generator component. Energy storage options for electric propulsion include hybrid batteries, traditional lead–acid batteries, and fuel cells. There are also brushless and brushed DC motors, each with electronic speed controllers, used for energy converters. Finally, the load typical of a propeller provides the thrust generation for the aerial vehicle. The most well-known architecture of UAVs, as seen in Figure 1, is discussed in greater depth in the subsequent subsections of this article. In the end, the propulsion system’s performance is evaluated based on the ratio of thrust to weight, efficiency, and endurance capacity as a whole system. The performance of these parameters should ideally be maximized by a proper design for the propulsion system.
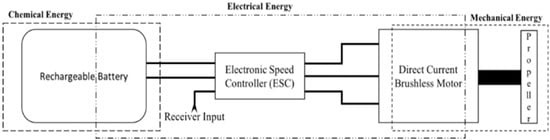
Figure 1.
An electric propulsion system architecture.
2.1. Energy Storage (Battery)
Advancing technologies of solar cells, fuel cells, and hybrid power systems have intriguing qualities. However, a standard rechargeable battery is still the most commonly used UAV power source. UAVs can use a wide variety of different kinds of batteries depending on their needs. Matured battery technologies have outstanding stability characteristics similar to nickel–cadmium (Ni-Cd) and nickel–metal hydride (NiMH) batteries. On the other hand, they have relatively low specific energies and suffer from high self-discharge rates. At the moment, lithium-ion (Li-Ion) or lithium-polymer (Li-Po) batteries are utilized by the majority of electric UAVs. In addition, lithium–sulfur (Li-S) was developed released into the market with good specific energy but suffers from poor cycle durability. The available varieties of COTS batteries and their features are summarized in Table 1 [21].

Table 1.
UAV rechargeable battery and characteristics.
The battery capacity (in Ah), charge rating (in C), and nominal voltage are the three basic pieces of information that are typically provided by the manufacturer of the battery (V). When it comes to developing a propulsion system’s battery pack, the characteristics of the lithium cells about charging and discharging play a vital significance. These help determine the maximum permissible current of the system to identify the operable load. The following is a routine to imitate the battery’s performance [22].
At the beginning of the modelling process, the battery capacity, denoted by and expressed in Ampere-Hours (Ah), was determined using Equation (1). The battery’s total capacity can only be affected by connecting the cells in parallel [23]. The maximum current that may be drawn from the battery is determined by the cell discharge rate, denoted by . These numbers shift depending on the type of cell being examined, regardless of the chemical makeup of the cell. Equation (2) can compute the system’s torque capacity based on the maximum current drawn from the battery, denoted by the symbol . In conclusion, the battery’s voltage is determined by factoring in the voltage loss that occurs owing to the battery’s internal resistance, as demonstrated by Equation (3) [12].
The battery’s internal resistance is the sole thing that causes energy loss. As a result, the efficiency of the battery, represented by Equation (4), may be determined based on the ratio of the power given by each cell (represented by Equation (5)) to the power output by the battery (represented by Equation (6)) [12]. This ratio has an inverse relationship to the current that is being flowed. Determining an approximation of the system endurance () from the battery specifications can be achieved in several ways—the precise estimation obtained using the Peukert equation [14]. The discharge is controlled by a parameter that varies depending on the type of battery and the temperature. Sadly, this metric typically alters for a given battery as it ages and cycles, resulting in a typical capacity reduction as the battery ages and cycles. Equation (7) is sufficient to estimate value for design and other model comparisons [12], as doing so is important for this work.
2.2. Energy Converter—DC Motor
The interaction between permanent magnetic fields and conductors that carry current results can produce mechanical energy in electric motors. Brushes contact the commutator on its rotor to create a circuit in a direct-current (DC) brushed motor. This connects the electrical source to the armature coil windings of the motor. When it comes to a brushless DC motor, the electromagnets are fixed in place and do not rotate. Brushless motors utilize an electronic speed controller (ESC) to distribute power with a solid-state circuit instead of the traditional brush–commutator system. Brushless motors are more efficient and reliable than conventional ones because they have fewer moving parts. On the other hand, brushless motors are typically more difficult to control and come at a higher overall cost to manufacture.
The dynamics of the motors should be incorporated into the full control system of the multirotor to accomplish attitude regulation. The multirotor is powered by a total of four brushless DC motors. A first-order low-pass filter is utilized in most implementations to simulate the dynamics of the motor system. The motor’s electrical and mechanical characteristics are utilized to formulate a mathematical model of the motor. The block diagram representation of the transfer function model for a DC motor with a load is shown in Figure 2. The symbol Vin represents the phase voltage that is supplied, Vb represents the back emf of the phase voltage, τM represents the torque that is developed by the motor, IM represents the moment of inertia of the rotor and the attached propeller, and ωM represents the angular velocity of the propeller.
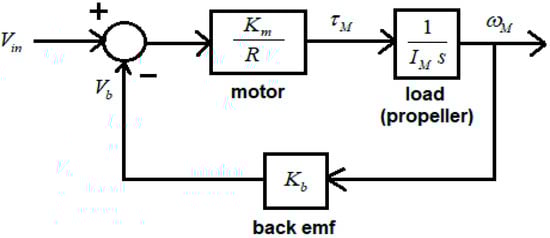
Figure 2.
Block diagram of brushless DC motor for single phase with load attached.
A first-order model of a DC electric motor capable of modelling the vast majority of motors was presented by Drela [24]. This model requires only four measurements of the motor: its resistance, denoted by ; its no-load current, denoted by ; its speed constant, denoted by ; and its maximum operating current. Typically, every COTS manufacturer offers all of these data. Because of the windings in the DC motor, the input voltage from the ESC experiences voltage loss. Equation (8) can be used to estimate the voltage that is produced by the motor, which is denoted by . In the meantime, the supplied current was lost due to a few factors, including hysteresis loss and friction loss [25]. Equation (9) is used to determine the current that is flowing through the motor.
As shown in Equation (10), the motor speed constant, , which the manufacturer supplies, has a relationship that is inversely proportional to the speed constant per second. It is possible to convert the electrical voltage and current input into the torque and RPM output of the motor by utilizing the motor’s torque constant. The rotational speed of the shaft, denoted by KT, can be calculated by multiplying the internal back-EMF voltage of the motor, denoted by , by the Kv (Equation (11)).
The motor current, denoted by , multiplied by the torque constant, denoted by Kt, results in the shaft torque of the motor, denoted by Qm (Equation (12)). This model introduces this new parameter to provide a more accurate propeller-matching parameter. The motor must supply the propeller with adequate torque for the system to work properly. According to Equation (13), shaft power is equal to the motor current multiplied by the back-EMF of the motor. The efficiency of the motor, denoted by the symbol , is defined as the ratio of the shaft’s power output to the ESC’s electrical power input (Equation (14)) [26].
2.3. Energy Converter—Driver (ESC)
The electronic speed controller (ESC) calculates the applied load and dynamically manages the voltage and current supply from the power source to ensure that the DC motor operates as efficiently as possible. The output voltage, regulated under the controller’s throttle signal, ultimately decides how quickly the motor turns. In the meantime, the output current is regulated to meet the propeller’s requirements. In most cases, increasing the voltage results in a reduction in the efficiency of the ESC. Therefore, the efficiency of the ESC is at its highest level in situations where the operating voltage is the same as the supply voltage [27]. Because there are many variations of ESC circuits and operations, accurate modelling of ESC is relatively easy to accomplish. This model simulates the ESC for the voltage loss solely due to resistance. The current multiplied by the ESC resistance gives the voltage loss, denoted by the symbol (Equation (15)). After accounting for voltage loss, the output power can be calculated using Equation (16), which states that the product of the current and ESC voltage is the output power. In the meantime, like other components, efficiency can be defined as the ratio of input power to output power, using Equation (17).
2.4. Thrust Generation (Propeller)
A vehicle’s propulsion through a fluid is provided by a propeller consisting of two or more twisted blades in the shape of airfoils mounted around a shaft and spun in opposite directions. Incoming air particles are given a velocity boost, resulting in a reaction force known as thrust. Imagine for a moment that a stream tube is surrounding it; because of the conservation of mass, the air that flows through the stream tube must remain the same. Without considering compressibility, the increased velocity causes the stream tube that passes through the propeller disc to become more condensed. As shown in Equation (18), the speed of the propeller can be determined by considering its diameter, pitch, and turn rate.
A propulsion system requires a certain amount of torque and current based on the RPM of the propeller, in addition to the thrust generator. The RPM of the propeller determines this requirement. Equation (19) [25] calculates the operating current to estimate the propeller’s power requirement. Theoretically, the propeller absorbs the power to spin at the RPM that was determined. Equation (20) determines the required torque amount after the power requirement value is determined. The amount of current supplied by the motor changes to supply an equivalent amount of torque as demanded by the propeller.
Estimating the amount of thrust a propeller can generate is a complicated process. Gur [28] developed an innovative method for determining the efficiency of propellers. Still, to use it, one needs the aerodynamic data of the propellers, which the manufacturers of propellers typically do not provide. Accordingly, for this model, an average of the efficiency of small-scale propellers was used. These results are based on the data provided by [29]. Equation (21) is then used to determine the thrust of the vehicle.
Another parameter that influences propeller efficiency is the propeller tip speed. The speed of the propeller tip is the entirety of the propeller’s rotational speed and the forward speed of the UAV. Past optimization methods used this parameter to determine the best configuration by using the lowest tip speed possible. This parameter should be lower than the planned Mach speed, i.e., 0.5 Mach, to avoid rapid drag increase. The propeller’s diameter and RPM are required to calculate the propeller tip speed, using Equation (22).
The basic design parameters involved in developing components of the propulsion system, performance-affecting parameters of the propulsion system, and efficiency enhancement factors of the propulsion system were explained in the earlier section. However, the suitable connections between the sub-systems of the propulsion system, developing good rapport between the sub-systems of the propulsion system, and selecting suitable sub-systems for the propulsion system need to be incorporated in previously investigated research. Through these sub-systems’ studies, drones’ trial-and-error-based development in the UAV industry could be avoided. Moreover, appropriate parts for the drone’s propulsion system could be easily chosen for various real-time applications. However, these older models and equations can only model the propulsion system regarding its constituent components. Therefore, having a correct simulation flow is essential for accurate modelling and practical outcomes. Thus, the suitable method and its optimization are framed in this current and so explained in the next section.
3. Method and Optimization
The models and equations presented earlier can only model the propulsion system by its components. Therefore, accurate modelling and possible results can be guaranteed by ensuring accurate simulation flow. Figure 3 illustrates, through MATLAB software, the simulation flowchart for the electric propulsion configuration system discussed here. After that, an optimization method is selected from the list of suitable configuration outputs to achieve the highest level of system optimization, as demonstrated in Figure 4. These two steps of the framework design process of configuring the propulsion system are extremely important to match the propulsion system with the appropriate propeller properly.
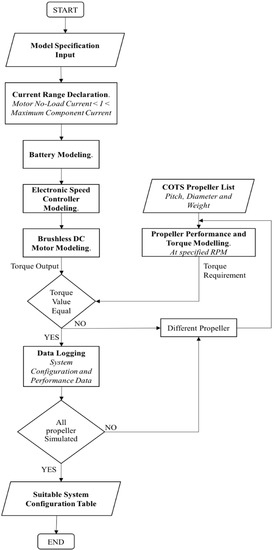
Figure 3.
Procedures involved in the imposed simulation program.
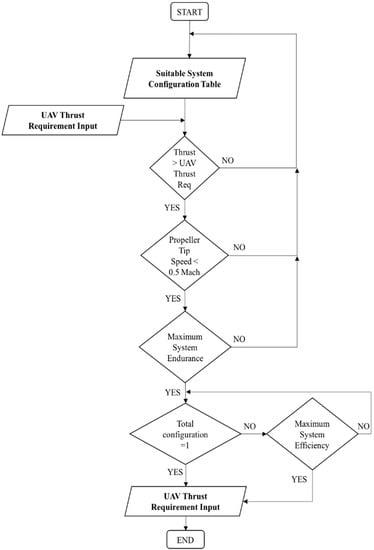
Figure 4.
Procedure for suitable configuration selection.
The first step in the simulation is collecting a list of COTS propellers currently on the market from various manufacturers [29,30]. After that, the model starts operating with a loaded battery, ESC, and motor data. Next, the operating voltage is set to the same value as the supply voltage to simulate a throttle level of 100%. While this happens, the amount of throttle used causes the operating current to shift. In most cases, the range begins with the motor’s no-load current. It ends with the maximum operating current of the component with the lowest value. After that, the simulation is run for each model of the battery, ESC, and motor in that particular order.
The amount of torque and RPM the motor produced results from the simulation. The torque requirement for each listed COTS propeller is determined after calculating the RPM output. After that, the motor’s output torque is matched with the torque requirements of each propeller when it is spinning at the motor’s RPM for each current value. Suppose that the two torque values are the same. In that case, the final step is to log the configuration and operating data into a table. The table includes appropriate propeller configurations and system-performance data. Suppose that there is a difference in the torque value. In that case, the propeller modelling is redone with a different propeller in place of the original one. The program finishes once all commercially available propellers are simulated for the database’s full range of available currents. The most important step is going through the simulation’s output table and choosing the best configuration. The flowchart illustrates the optimization process (Figure 3 and Figure 4). The identification of the thrust requirement of the UAV is the first step in the process of selecting the optimal configuration for the vehicle. After that, suitable configurations are selected based on the available thrust range.
It is essential to carry out this optimization procedure to avoid configurations with high electrical current usage. Then the speed of the propeller tip is analyzed, and any systems with a speed greater than 0.5 Mach are eliminated. Consequently, it is common for unmanned propeller aircraft to be limited to speeds of no more than Mach 0.5. Nevertheless, UAV propellers have gone as fast as Mach 0.8. Still, they could be more popular because of how inefficient they become at that speed [29,30]. It is not favorable for the propeller’s efficiency if the transonic flow is near the blade tips. Since the relative airspeed at any region of a rotor is a vector sum of the maximum velocity and the tangential speed due to rotation, the flow over the blade tip approaches transonic speed well before the UAV. Thus, the flow over the blade tip reaches transonic speed well before the UAV itself. As a result, shock waves are produced when the airflow across the blade reaches its critical speed. These shock waves have caused increased resistance from drag and torque, significantly increasing noise. Ultimately, the configuration is decided according to the overall system’s efficiency and endurance.
The mathematical models of various voltages developed across batteries are typically given in Equations (23)–(25).
The important efficiency of ESC is mathematically given in Equation (26), and all other basic mathematical representations were explained in the previous section.
The final required current and voltage are mathematically represented in Equations (27) and (28). The total electrical current usage is given in Equation (29).
One of the major analytical formulations involved in this work is the thrust requirement of the propeller. Therefore, the analytical formulation is given in Equation (1).
where TPropeller is the thrust requirement by a single propeller in kg, is the thrust to weight ratio, n is the total number of propellers, and is the overall takeoff weight of small electrical UAV. In order to determine the , the historical relationship attainment process was conducted on various relevant UAVs, wherein their overall takeoff weights and payload weights play a major role. The sample analytical formulation between overall takeoff weight and payload weight is expressed in Equation (31).
Lastly, it is observed that incorporating the payload weight is necessary for the thrust requirement of a propeller. Therefore, the authors used the analytical formulation for payload weight, as shown in Equation (32).
Hence, this design framework model incorporates the overall takeoff and payload weights of UAVs.
4. Results and Discussions
The capability and performance of the proposed design framework model were validated by optimizing the propulsion system already present in the UAV. As detailed in this results section, this proposed framework involved choosing and optimizing 42 different systems, including 5 models currently on the market, 5 models that the manufacturers suggested, and 27 models that researchers developed. Before the performance evaluation, validation work was performed for the models of the electrical components, including the voltage and current. Here, the effects of these variables on the thrust capability were presented. A validation of the propeller rotation speeds was performed so that the accuracy of the propeller model could be determined. Different combinations of motors and propellers were modelled in the final step of the modelling process to determine how well the model could perform. Majorly, we executed three validations: (1) validation of operating current, voltage, back-EMF, and thrust were executed; (2) validation of propeller rotation speed was executed; and (3) validations of throttle settings were executed.
These three validations are experimental correlations based on comparisons between our proposed framework model and theexperimental outcomes of [31,32,33]. In the first experimental-correlation-based validation [31], the performances of three motors were discussed. Among these three motors, the first has 19 g of weight, with a resistance rate of 7.7570 Ω and a minimum starting current of 0.08 A. The second motor weighs 56 g and has a resistance rate of 4.5475 Ω and a minimum starting current of 0.05 A. The third motor weighs 52 g and has a resistance rate of 7.3889 Ω and a minimum starting current of 0.035A. Figure 5, Figure 6, Figure 7 and Figure 8 clearly show that the proposed-design-framework-based outcomes are matched with first experimental correlation outcomes [31]. In the second experimental-correlation-based validation [32], the performances of AXI motors were discussed. This work experimentally tested the propeller rotational speed versus the current rate of the ninth model-based solid oxide fuel cell powered 27 inches in diameter and 13-inch pitch-based APC propeller. The proposed design framework for these experimental outcomes was extended to capture the complete results. In the third experimental-correlation-based validation [33], the performances of 690 KV (motor 1) and 600 KV (motor 2) rated motors were discussed. Especially their throttle settings and their major aerodynamic force creations were monitored. Finally, our computational-models-based outcomes were compared with the 6-inch-diameter-based conventional propeller and unique thrust setup. Both of the thrust results were exactly matched with each other. Thus, the proposed design framework can have a high capacity for producing reliable outcomes.
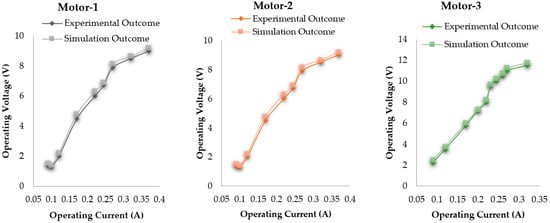
Figure 5.
Simulation vs. experimental of motor—system operating voltage and current.
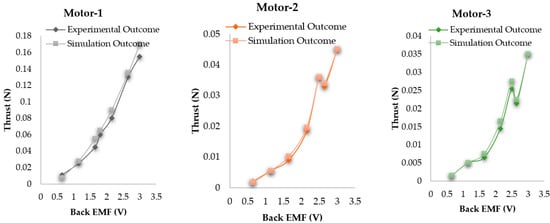
Figure 6.
Simulation vs. experimental of motor—back-EMF and thrust.
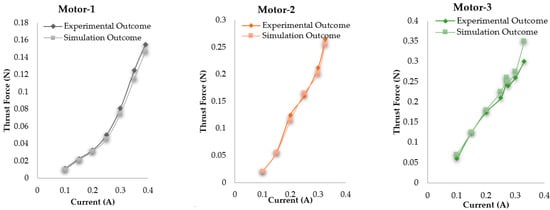
Figure 7.
Simulation vs. experimental of motor—thrust for operating current.
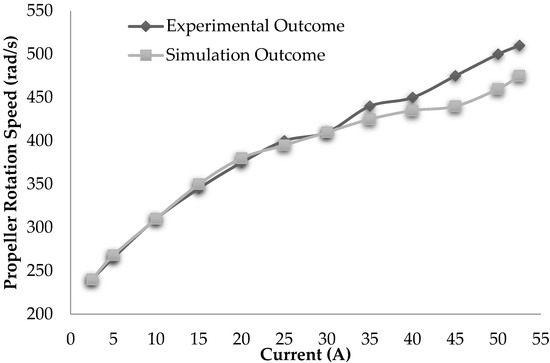
Figure 8.
Simulation vs. experimental—propeller rotation (rad/s) and current.
4.1. Validation of Operating Current, Voltage, Back-EMF, and Thrust
Validation was performed on three motors to determine the operating voltage, current, back-EMF, and thrust. Then Atlam and Kolhe [31] simulated the systems by using the provided system specifications and compared these results to the experimental data. First, the necessary data are collected to validate the operating voltage of the system when it is operating at a particular current. As a result, this verifies the accuracy of the electrical system simulation up to the motor current and back-EMF levels. Figure 5 shows that the modelled voltage corresponds to the experimental data accurately.
Similarly, the relationship between the back-EMF and thrust of the model, which was depicted in Figure 6, and which compares the operating speed of the system (in RPM) to the amount of thrust produced, showed striking similarities. The results of the simulation of thrust generation were shown in Figure 7 for various operating currents. If the current is increased, the motor produces more torque, which causes the propeller to turn more quickly.
Similarly, these results are relatively close to the experimental value, with the error growing larger as the amount of current increased. The validation procedures are outlined in Table 2. The accuracy of the electrical system model is confirmed by finding an average error of less than 2% across all of the investigated parameters. This error must be addressed because it is sufficient to provide insights and studies comparing different options [31].
Table 2.
Motor specifications with their parametric validation (voltage, current, and thrust error in %).
4.2. Validation of Propeller Rotation Speed
The energy conversion from electrical to mechanical is further validated by using Lindahl and Moog’s work [32]. This work simulated a hybrid propulsion system for various operating currents. As a result, the only components simulated in Figure 8 were the ESC, the motor, and the propeller. The data were validated with an error rate that was 2.257% on average.
4.3. Validation of Throttle Settings
The research conducted by Saedan and Puangmali [33] offers a comprehensive analysis of the experimental performance of various DC motors, propellers, and variations based on several different throttle settings. As a result, two different throttle settings were applied to five different motors and propellers in this part of the validation process. The data are summarized in Table 3 [33]. It can be seen that the error in thrust is typically around 10%, even though the size of the propeller, the throttle setting, and the types of motors can all make a difference. The standard deviation of the error was 5.26% for the 80% throttle level and 6.40% for the 90% throttle level. Motor 1 had an error rate of 7.03% when considering all possible motor and propeller combinations. In comparison, Motor 2 had an average error rate of 4.64%. In addition, the perspective error’s standard deviation for the tested propellers was 5.83%.
Table 3.
Validation of propeller and throttle settings error in %.
4.4. Proposed System Model Performance
The proposed method’s effectiveness was evaluated using 42 different propulsion systems of existing UAVs, which were then optimized for performance. In Table 4, each of the 42 different electric propulsion systems’ respective percentages of improvement is tabulated for each of the various parameters. All of the values are presented in percentages to show the improvement made by utilizing the suggested model in comparison to the performance of the initial propulsion system. The bold values indicate a negative improvement. The proposed model system recommended a smaller propeller size than the electric propulsion system initially used.
Table 4.
Percentage of improvements in performance of the proposed framework model.
According to the findings, the operating current of the system is the most important parameter that plays a role in determining how well the system works. The minimum operating current is preferred because a UAV can only carry a limited amount of charge in its battery while in the air. This concept allows the UAV to remain operational longer, giving it greater endurance. Aside from that, each type of electrical component and motor, in particular, has a current range within which it functions most effectively. The current determines the torque a motor can produce and the diameter of the propellers that can be loaded. As a result of the fact that the system must satisfy a minimum thrust requirement, there is a minimum limit that it is required to be achieved for the current.
4.5. Discussion
The electrical current usage dropped by as much as 84%, with an average drop of 26%. The method applied in this framework also successfully increased the endurance of the existing propulsion system by upto 54.7%, with an average increase of 53%. As a consequence of this change, the thrust-to-weight ratio of the systems saw an average improvement of 28%. As a result, the accuracy of this model is 3% when it is used to model electrical systems and 10% when it is used to model mechanical systems. As a result, this method analyses these requirements. As a result, it offers a more effective design for the system to establish the minimum current limit.
Despite this, some systems’ total weight was marginally higher than that of the proposed model due to alternative propeller-size recommendations. These findings provide evidence that the proposed method of designing an electric propulsion system can improve the majority of propulsion systems currently in use. The optimal loading of the propellers is the best method for optimizing the system because it determines the total amount of energy the system consumes and its endurance.
The experimental testing and comparison were both planned with the knowledge of the huge comprehensive investigations between experimental correlation studies and this proposed design framework. The typical experimental setup and its imposed propulsion electrical-system-based components are revealed in Figure 9. The 6-inch-diameter-based conventional drone propeller was chosen for this comprehensive experimental investigation as the base part. Its relevant components, such as the motor and ESCs, were chosen. A unique experimental test setup for thrust measurement was constructed to capture the needful thrust outcomes. Our proposed design framework model imposes all the same parts and their specifications, so the computational outcomes were also obtained. Finally, the thrust results between experimental and computational outcomes are listed in Table 5 [52,53,54].
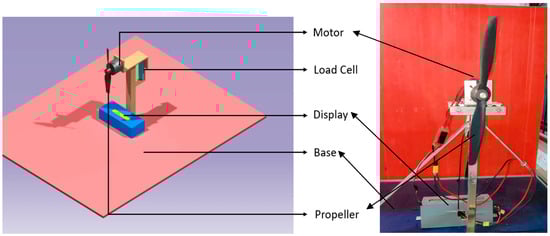
Figure 9.
Experimental model (left) and an actual experimental setup (right).
Table 5.
Comprehensive experimental outcomes of the thrust of various propellers.
All of the experimental outcomes are closely matched with the obtained computational outcomes. Thus, Table 5 shows that the proposed propulsion design framework model can provide reliable outcomes for the drone-based component-selection process.
5. Conclusions
A novel model for a propulsion system that incorporates both electrical and mechanical components was proposed and suggested here. Additionally, a different method of propeller matching was developed and implemented. This design framework model suits the preliminary design process for an effective electric propulsion system’s robust component selection and design configuration. Three independent validations were performed. First, initial checks included operating current, voltage, back-EMF, and thrust. Second, we verified the propeller speed. Third, throttle checks were performed for quality assurance. Our framework model was validated using experimental data and carrying out performance evaluations on 42 different sets of already existing electric propulsion systems. The research led to several discoveries, including enhancements in electrical current consumption, thrust-to-weight ratio, electrical and mechanical modelling, and endurance efficiency. Finally, we compared the findings of our simulation models to those of a regular propeller and a unique thrust arrangement, both of which have a diameter of 6 inches, where the thrust outputs are the same. Based on the findings, the proposed design framework has the potential to yield high-quality outputs for drone parts.
Author Contributions
Conceptualization, S.K. and P.R.; methodology, S.K. and P.R.; software, S.K.; validation, S.K. and P.R.; formal analysis, S.K. and P.R.; investigation, S.K. and P.R.; resources, S.K.; data curation, S.K. and P.R.; writing—original draft preparation, S.K.; writing—review and editing, S.K., P.R. and V.R.; visualization, S.K. and P.R.; supervision, P.R.; project administration, P.R.; funding acquisition, P.R. All authors have read and agreed to the published version of the manuscript.
Funding
This work was supported by the University Sains Malaysia, Bridging GRA with Project No: 304/PAERO/6316608.
Institutional Review Board Statement
Not applicable.
Informed Consent Statement
Not applicable.
Data Availability Statement
The authors confirm that the data supporting the findings of this study are available within the article.
Conflicts of Interest
The authors declare no conflict of interest.
References
- Rajendran, P.; Smith, H. Review of the Elementary Aspect of Small Solar-powered Electric Unmanned Aerial Vehicles. Aust. J. Basic Appl. Sci. 2014, 8, 252–259. [Google Scholar]
- Rajendran, P.; Smith, H. The Development of a Small Solar Powered Electric Unmanned Aerial Vehicle Systems. Appl. Mech. Mater. 2013, 465–466, 345–351. [Google Scholar] [CrossRef]
- Ding, R.; Xiao, L.; Jin, X. Robust Control for Electric Fuel Pump with Variant Nonlinear Loads Based on a New Combined Sliding Mode Surface. Int. J. Control Autom. Syst. 2019, 17, 716–728. [Google Scholar] [CrossRef]
- Rajendran, P.; Smith, H. Experimental Assessment of Various Batteries and Propellers for Small Solar-Powered Unmanned Aerial Vehicle. J. Eng. Technol. Sci. 2018, 50, 382–391. [Google Scholar] [CrossRef]
- Yang, T.; Schinstock, D.E. Systematic design of current control system for permanent magnet synchronous motors. Int. J. Control Autom. Syst. 2013, 11, 1128–1137. [Google Scholar] [CrossRef]
- Rajendran, P.; Mazlan, N.M.; Smith, H. Single Cell Li-Ion Polymer Battery Charge and Discharge Characterisations for Application on Solar-Powered Unmanned Aerial Vehicle. In Key Engineering Materials; Trans Tech Publications Ltd.: Stafa-Zurich, Switzerland, 2017; Volume 728, pp. 428–433. [Google Scholar] [CrossRef]
- Chen, H.; Jiang, B.; Lu, N. A Multi-mode Incipient Sensor Fault Detection and Diagnosis Method for Electrical Traction Systems. Int. J. Control Autom. Syst. 2018, 16, 1783–1793. [Google Scholar] [CrossRef]
- Rajendran, P.; Smith, H. Development of Design Methodology for a Small Solar-Powered Unmanned Aerial Vehicle. Int. J. Aerosp. Eng. 2018, 2018, 2820717. [Google Scholar] [CrossRef]
- Zhang, H.; Song, B.; Li, F.; Xuan, J. Multidisciplinary design optimization of an electric propulsion system of a hybrid UAV considering wind disturbance rejection capability in the quadrotor mode. Aerosp. Sci. Technol. 2021, 110, 106372. [Google Scholar] [CrossRef]
- Zhao, A.; Zhang, J.; Li, K.; Wen, D. Design and implementation of an innovative airborne electric propulsion measure system of fixed-wing UAV. Aerosp. Sci. Technol. 2021, 109, 106357. [Google Scholar] [CrossRef]
- Piljek, P.; Kotarski, D.; Krznar, M. Method for Characterization of a Multirotor UAV Electric Propulsion System. Appl. Sci. 2020, 10, 8229. [Google Scholar] [CrossRef]
- Rajendran, P.; Smith, H.; Yahaya, K.I.; Mazlan, N.M. Electric propulsion system sizing for small solar-powered electric unmanned aerial vehicle. Int. J. Appl. Eng. Res. 2016, 11, 9419–9423. [Google Scholar]
- Gong, A.; Verstraete, D. Development of a dynamic propulsion model for electric UAVs. In Proceedings of the 7th Asia-Pacific International Symposium on Aerospace Technology, Cairns, Australia, 25–27 November 2015. [Google Scholar]
- Gong, A.; Verstraete, D. Extending range and endurance estimates of battery powered electric aircraft. In Proceedings of the 16th Australian International Aerospace Congress, Melbourne, Australia, 23–24 February 2015. [Google Scholar]
- Bosso, A.; Conficoni, C.; Raggini, D.; Tilli, A. A Computational-Effective Field-Oriented Control Strategy for Accurate and Efficient Electric Propulsion of Unmanned Aerial Vehicles. IEEE/ASME Trans. Mechatron. 2020, 26, 1501–1511. [Google Scholar] [CrossRef]
- Ma, Y.; Zhang, W.; Zhang, Y.; Zhang, X.; Zhong, Y. Sizing Method and Sensitivity Analysis for Distributed Electric Propulsion Aircraft. J. Aircr. 2020, 57, 730–741. [Google Scholar] [CrossRef]
- Sliwinski, J.; Gardi, A.; Marino, M.; Sabatini, R. Hybrid-electric propulsion integration in unmanned aircraft. Energy 2017, 140, 1407–1416. [Google Scholar] [CrossRef]
- Dai, X.; Quan, Q.; Ren, J.; Cai, K.-Y. An Analytical Design-Optimization Method for Electric Propulsion Systems of Multicopter UAVs With Desired Hovering Endurance. IEEE/ASME Trans. Mechatron. 2019, 24, 228–239. [Google Scholar] [CrossRef]
- Tu, Y. Design and Implementation of Energy Saving System for Electric Propulsion of Unmanned Vehicle. In IOP Conference Series: Earth and Environmental Science; IOP Publishing Ltd.: Bristol, UK, 2019; Volume 300, p. 042073. [Google Scholar] [CrossRef]
- Xu, D.; Song, X.; Jiang, B.; Yang, W.; Yan, W. Data-driven Sliding Mode Control for MIMO systems and Its Application on Linear Induction Motors. Int. J. Control Autom. Syst. 2019, 17, 1717–1725. [Google Scholar] [CrossRef]
- Abbe, G.; Smith, H. Technological development trends in Solar-powered Aircraft Systems. Renew. Sustain. Energy Rev. 2016, 60, 770–783. [Google Scholar] [CrossRef]
- Fotouhi, A.; Auger, D.J.; Propp, K.; Longo, S.; Wild, M. A review on electric vehicle battery modelling: From Lithium-ion toward Lithium–Sulphur. Renew. Sustain. Energy Rev. 2016, 56, 1008–1021. [Google Scholar] [CrossRef]
- Kroeze, R.C.; Krein, P.T. Electrical battery model for use in dynamic electric vehicle simulations. In Proceedings of the 2008 IEEE Power Electronics Specialists Conference, Rhodes, Greece, 15–19 June 2008; pp. 1336–1342. [Google Scholar] [CrossRef]
- Mark Drela, First-Order DC Electric Motor Model. 2007. Available online: http://web.mit.edu/drela/Public/web/qprop/motor1_theory.pdf (accessed on 1 January 2022).
- Kirtley, J.L., Jr.; Beaty, H.W.; Ghai, N.K.; Leeb, S.B.; Lyon, R.H. The Electric Motor Handbook; The McGraw-Hill Companies, Inc.: Columbus, OH, USA, 1998; ISBN 9780070359710. [Google Scholar]
- Gur, O.; Rosen, A. Optimizing Electric Propulsion Systems for Unmanned Aerial Vehicles. J. Aircr. 2009, 46, 1340–1353. [Google Scholar] [CrossRef]
- Shanmugasundram, R.; Zakaraiah, K.M.; Yadaiah, N. Modeling, simulation and analysis of controllers for brushless direct current motor drives. J. Vib. Control. 2013, 19, 1250–1264. [Google Scholar] [CrossRef]
- Gur, O. Maximum Propeller Efficiency Estimation. J. Aircr. 2014, 51, 2037–2040. [Google Scholar] [CrossRef]
- Brandt, J.; Selig, M. Propeller Performance Data at Low Reynolds Numbers. In Proceedings of the 49th AIAA Aerospace Sciences Meeting including the New Horizons Forum and Aerospace Exposition, Orlando, FL, USA, 4–7 January 2011; AIAA: Reston, VA, USA, 2011; p. 1255. [Google Scholar]
- APC. APC Propeller List. 2016. Available online: http://www.apcprop.com/pindex.asp (accessed on 1 January 2022).
- Atlam, O.; Kolhe, M. Performance evaluation of directly photovoltaic powered DC PM (direct current permanent magnet) motor—Propeller thrust system. Energy 2013, 57, 692–698. [Google Scholar] [CrossRef]
- Lindahl, P.; Moog, E.; Shaw, S.R. Simulation, Design, and Validation of an UAV SOFC Propulsion System. IEEE Trans. Aerosp. Electron. Syst. 2012, 48, 2582–2593. [Google Scholar] [CrossRef]
- Saedan, M.; Puangmali, P. Characterization of motor and propeller sets for a small radio controlled aircraft. In Proceedings of the 2015 10th Asian Control Conference (ASCC), Kota Kinabalu, Malaysia, 31 May 2015–3 June 2015; pp. 1–6. [Google Scholar] [CrossRef]
- Magnussen, Ø.; Ottestad, M.; Hovland, G. Multicopter Design Optimization and Validation. Model. Identif. Control A Nor. Res. Bull. 2015, 36, 67–79. [Google Scholar] [CrossRef]
- Gatti, M.; Giulietti, F.; Turci, M. Maximum endurance for battery-powered rotary-wing aircraft. Aerosp. Sci. Technol. 2015, 45, 174–179. [Google Scholar] [CrossRef]
- Zafar, S.; Gadalla, M. Evaluation of an Integrated Fuel Cell-PV Panel System as a Hybrid UAV Powerplant. In Proceedings of the ASME 2012 International Mechanical Engineering Congress and Exposition, Houston, TX, USA, 9–15 November 2012; pp. 1387–1392. [Google Scholar] [CrossRef]
- Yanik, S.N.; Ozyetis, E.; Ozcan, G.; Alemdaroğlu, N.; Kayran, A.; Kiran, E.; Ozcan, G. Propulsion system model of a mini UAV system. In Proceedings of the 2014 International Conference on Unmanned Aircraft Systems (ICUAS), Orlando, FL, USA, 27–30 May 2014; pp. 1073–1080. [Google Scholar] [CrossRef]
- Ampatis, C.; Papadopoulos, E. Parametric design and optimization of multi-rotor aerial vehicles. In Proceedings of the 2014 IEEE International Conference on Robotics and Automation (ICRA), Hong Kong, China, 31 May–7 June 2014; pp. 6266–6271. [Google Scholar] [CrossRef]
- Furrutter, M.K.; Meyer, J. Small fuel cell powering an unmanned aerial vehicle. In Proceedings of the AFRICON 2009, Nairobi, Kenya, 23–25 September 2009; pp. 1–6. [Google Scholar] [CrossRef]
- Bradley, T.H.; Moffitt, B.A.; Mavris, D.N.; Parekh, D.E. Development and experimental characterization of a fuel cell powered aircraft. J. Power Sources 2007, 171, 793–801. [Google Scholar] [CrossRef]
- Kontogiannis, S.G.; Ekaterinaris, J.A. Design, performance evaluation and optimization of a UAV. Aerosp. Sci. Technol. 2013, 29, 339–350. [Google Scholar] [CrossRef]
- Gadalla, M.; Zafar, S. Analysis of a hydrogen fuel cell-PV power system for small UAV. Int. J. Hydrogen Energy 2016, 41, 6422–6432. [Google Scholar] [CrossRef]
- Xu, Y.; Tong, C.; Li, H. Flight Control of a Quadrotor under Model Uncertainties. Int. J. Micro Air Veh. 2015, 7, 1–19. [Google Scholar] [CrossRef]
- Hoffmann, G.; Huang, H.; Waslander, S.; Tomlin, C. Quadrotor Helicopter Flight Dynamics and Control: Theory and Experiment. In Proceedings of the AIAA Guidance, Navigation and Control Conference and Exhibit, Hilton Head, SC, USA, 20–23 August 2007. [Google Scholar] [CrossRef]
- Eryk Brian Nice, Design of a Four Rotor Hovering Vehicle, in Faculty of the Graduate School; Cornell University: Ithaca, NY, USA, 2004.
- Driessens, S.; Pounds, P.E.I. Towards a more efficient quadrotor configuration. In Proceedings of the 2013 IEEE/RSJ International Conference on Intelligent Robots and Systems, Tokyo, Japan, 3–7 November 2013; pp. 1386–1392. [Google Scholar] [CrossRef]
- Pounds, P.; Mahony, R.; Corke, P. Modelling and control of a large quadrotor robot. Control. Eng. Pract. 2010, 18, 691–699. [Google Scholar] [CrossRef]
- Lee, B.; Park, P.; Kim, K.; Kwon, S. The flight test and power simulations of an UAV powered by solar cells, a fuel cell and batteries. J. Mech. Sci. Technol. 2014, 28, 399–405. [Google Scholar] [CrossRef]
- MotoCalc Projects. 2015. Available online: http://www.motocalc.com/data/project.html (accessed on 1 January 2022).
- AXI Motor Data. 2015. Available online: https://www.modelmotors.cz (accessed on 1 January 2022).
- Hacker-Motor-USA. Hacker Motor Application Table. 2016. Available online: https://hackermotorusa.com/comparison-chart/?v=75dfaed2dded (accessed on 1 January 2022).
- Citroni, R.; Di Paolo, F.; Livreri, P. A Novel Energy Harvester for Powering Small UAVs: Performance Analysis, Model Validation and Flight Results. Sensors 2019, 19, 1771. [Google Scholar] [CrossRef] [PubMed]
- Pham, K.L.; Leuchter, J.; Bystricky, R.; Andrle, M.; Pham, N.N.; Pham, V.T. The Study of Electrical Energy Power Supply System for UAVs Based on the Energy Storage Technology. Aerospace 2022, 9, 500. [Google Scholar] [CrossRef]
- Vijayanandh, R.; Prakash, R.A.; Manivel, R.; Kiran, P.; Sudharsan, R.; Kumar, G.R.; Raffik, R. Design and Parametric Study of Counter-Rotating Propeller of Unmanned Aerial Vehicles for High-Payload Applications based on CFD-MRF Approach. Int. J. Veh. Struct. Syst. 2022, 14, 840–848. [Google Scholar] [CrossRef]


Disclaimer/Publisher’s Note: The statements, opinions and data contained in all publications are solely those of the individual author(s) and contributor(s) and not of MDPI and/or the editor(s). MDPI and/or the editor(s) disclaim responsibility for any injury to people or property resulting from any ideas, methods, instructions or products referred to in the content. |
© 2023 by the authors. Licensee MDPI, Basel, Switzerland. This article is an open access article distributed under the terms and conditions of the Creative Commons Attribution (CC BY) license (https://creativecommons.org/licenses/by/4.0/).