Quantifying Visual Pollution from Urban Air Mobility
Abstract
:1. Introduction
- Distraction and lack of focus
- Stress and anxiety
- Difficulty in processing visual input due to the extensive amount of simultaneous data
- Dangerous distractions, especially in a driving context
- Reduced work efficiency
- A low frame of mind
- Mood disorders and aggression
- Identify and rank factors that contribute to the visual pollution produced by UAVs.
- Test the significance and establish the relationship between a selection of the identified factors.
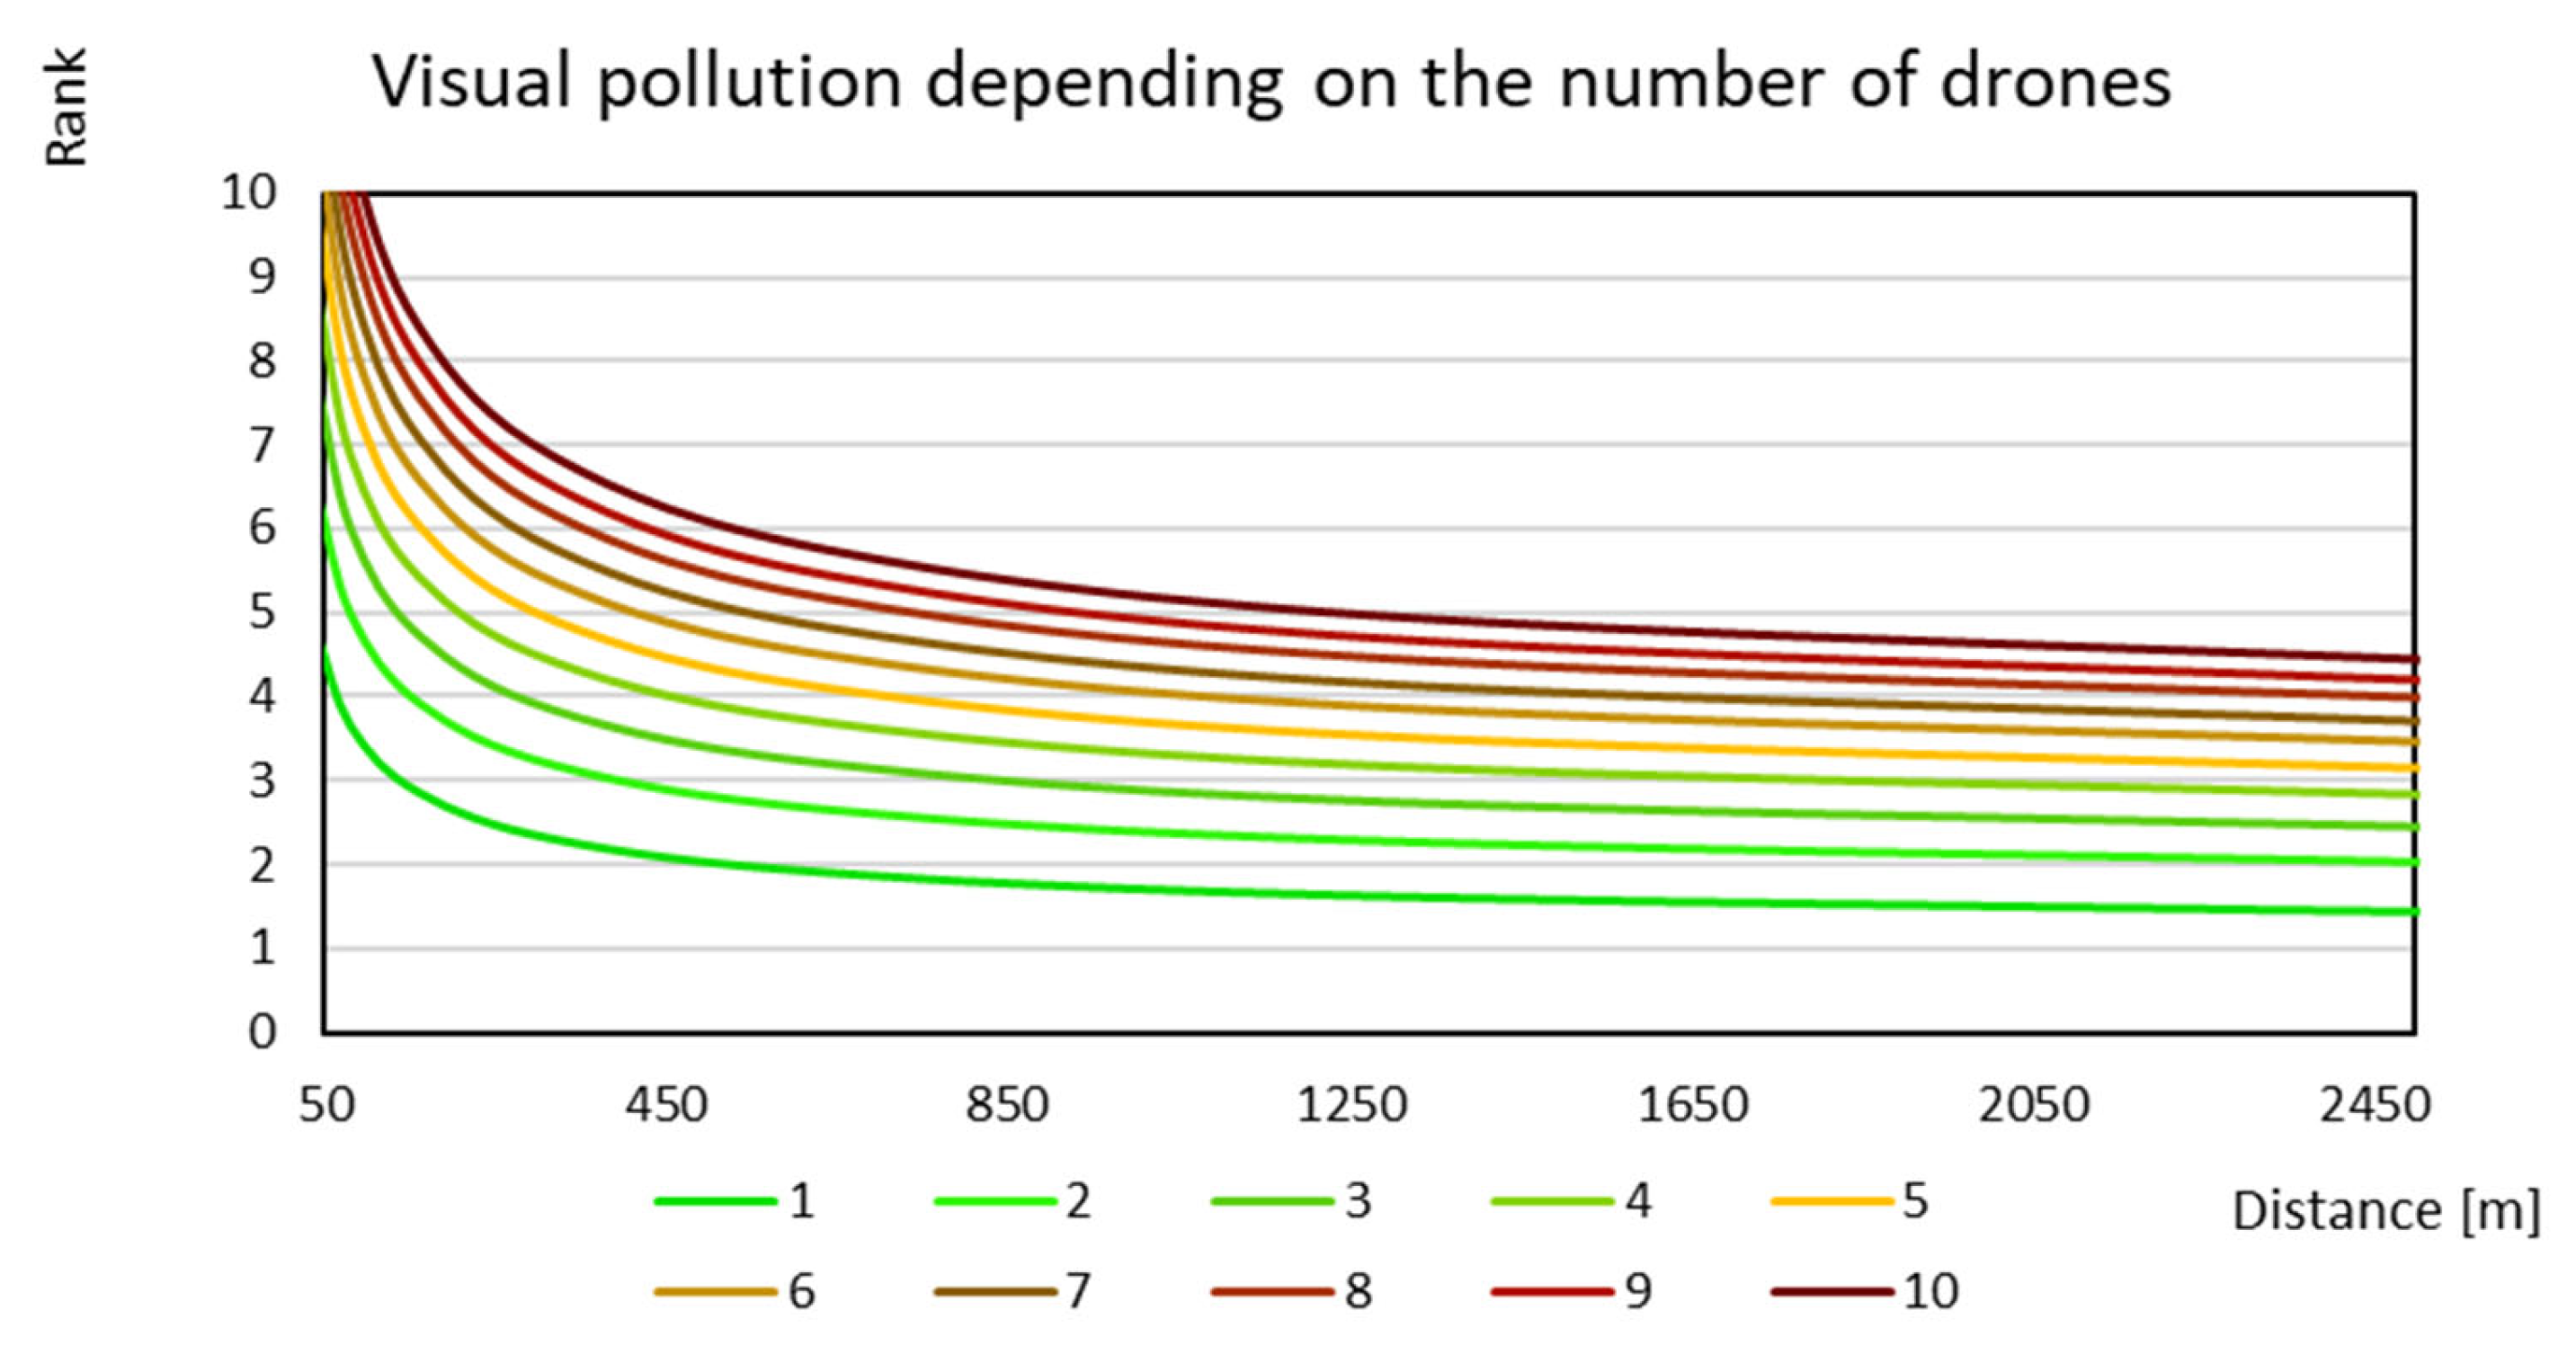
- Construct a numerical visual pollution model that can be used to calculate the visual pollution produced by one or several UAVs.
2. Materials and Methods
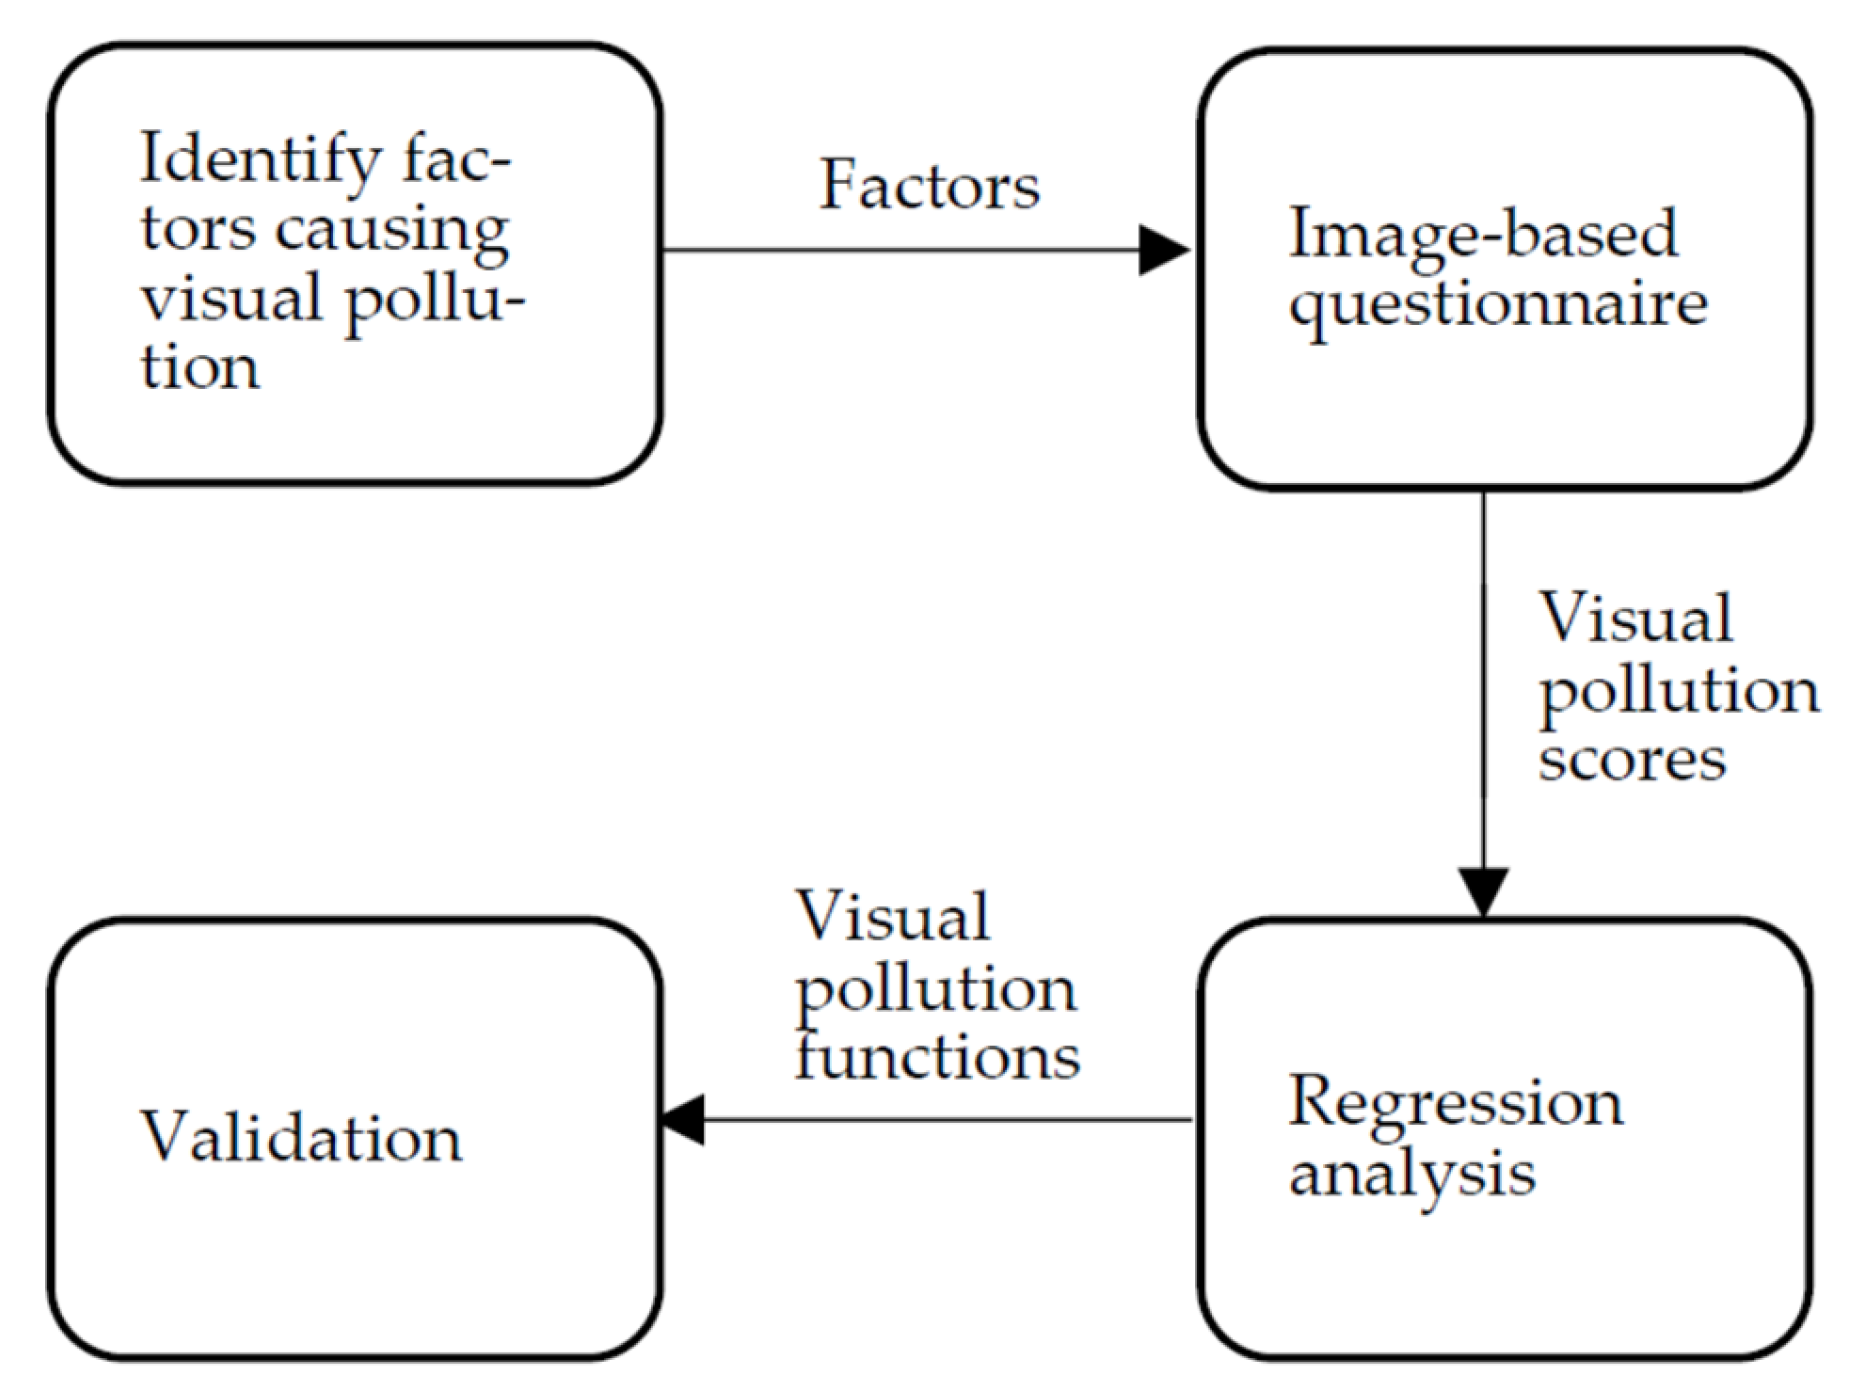
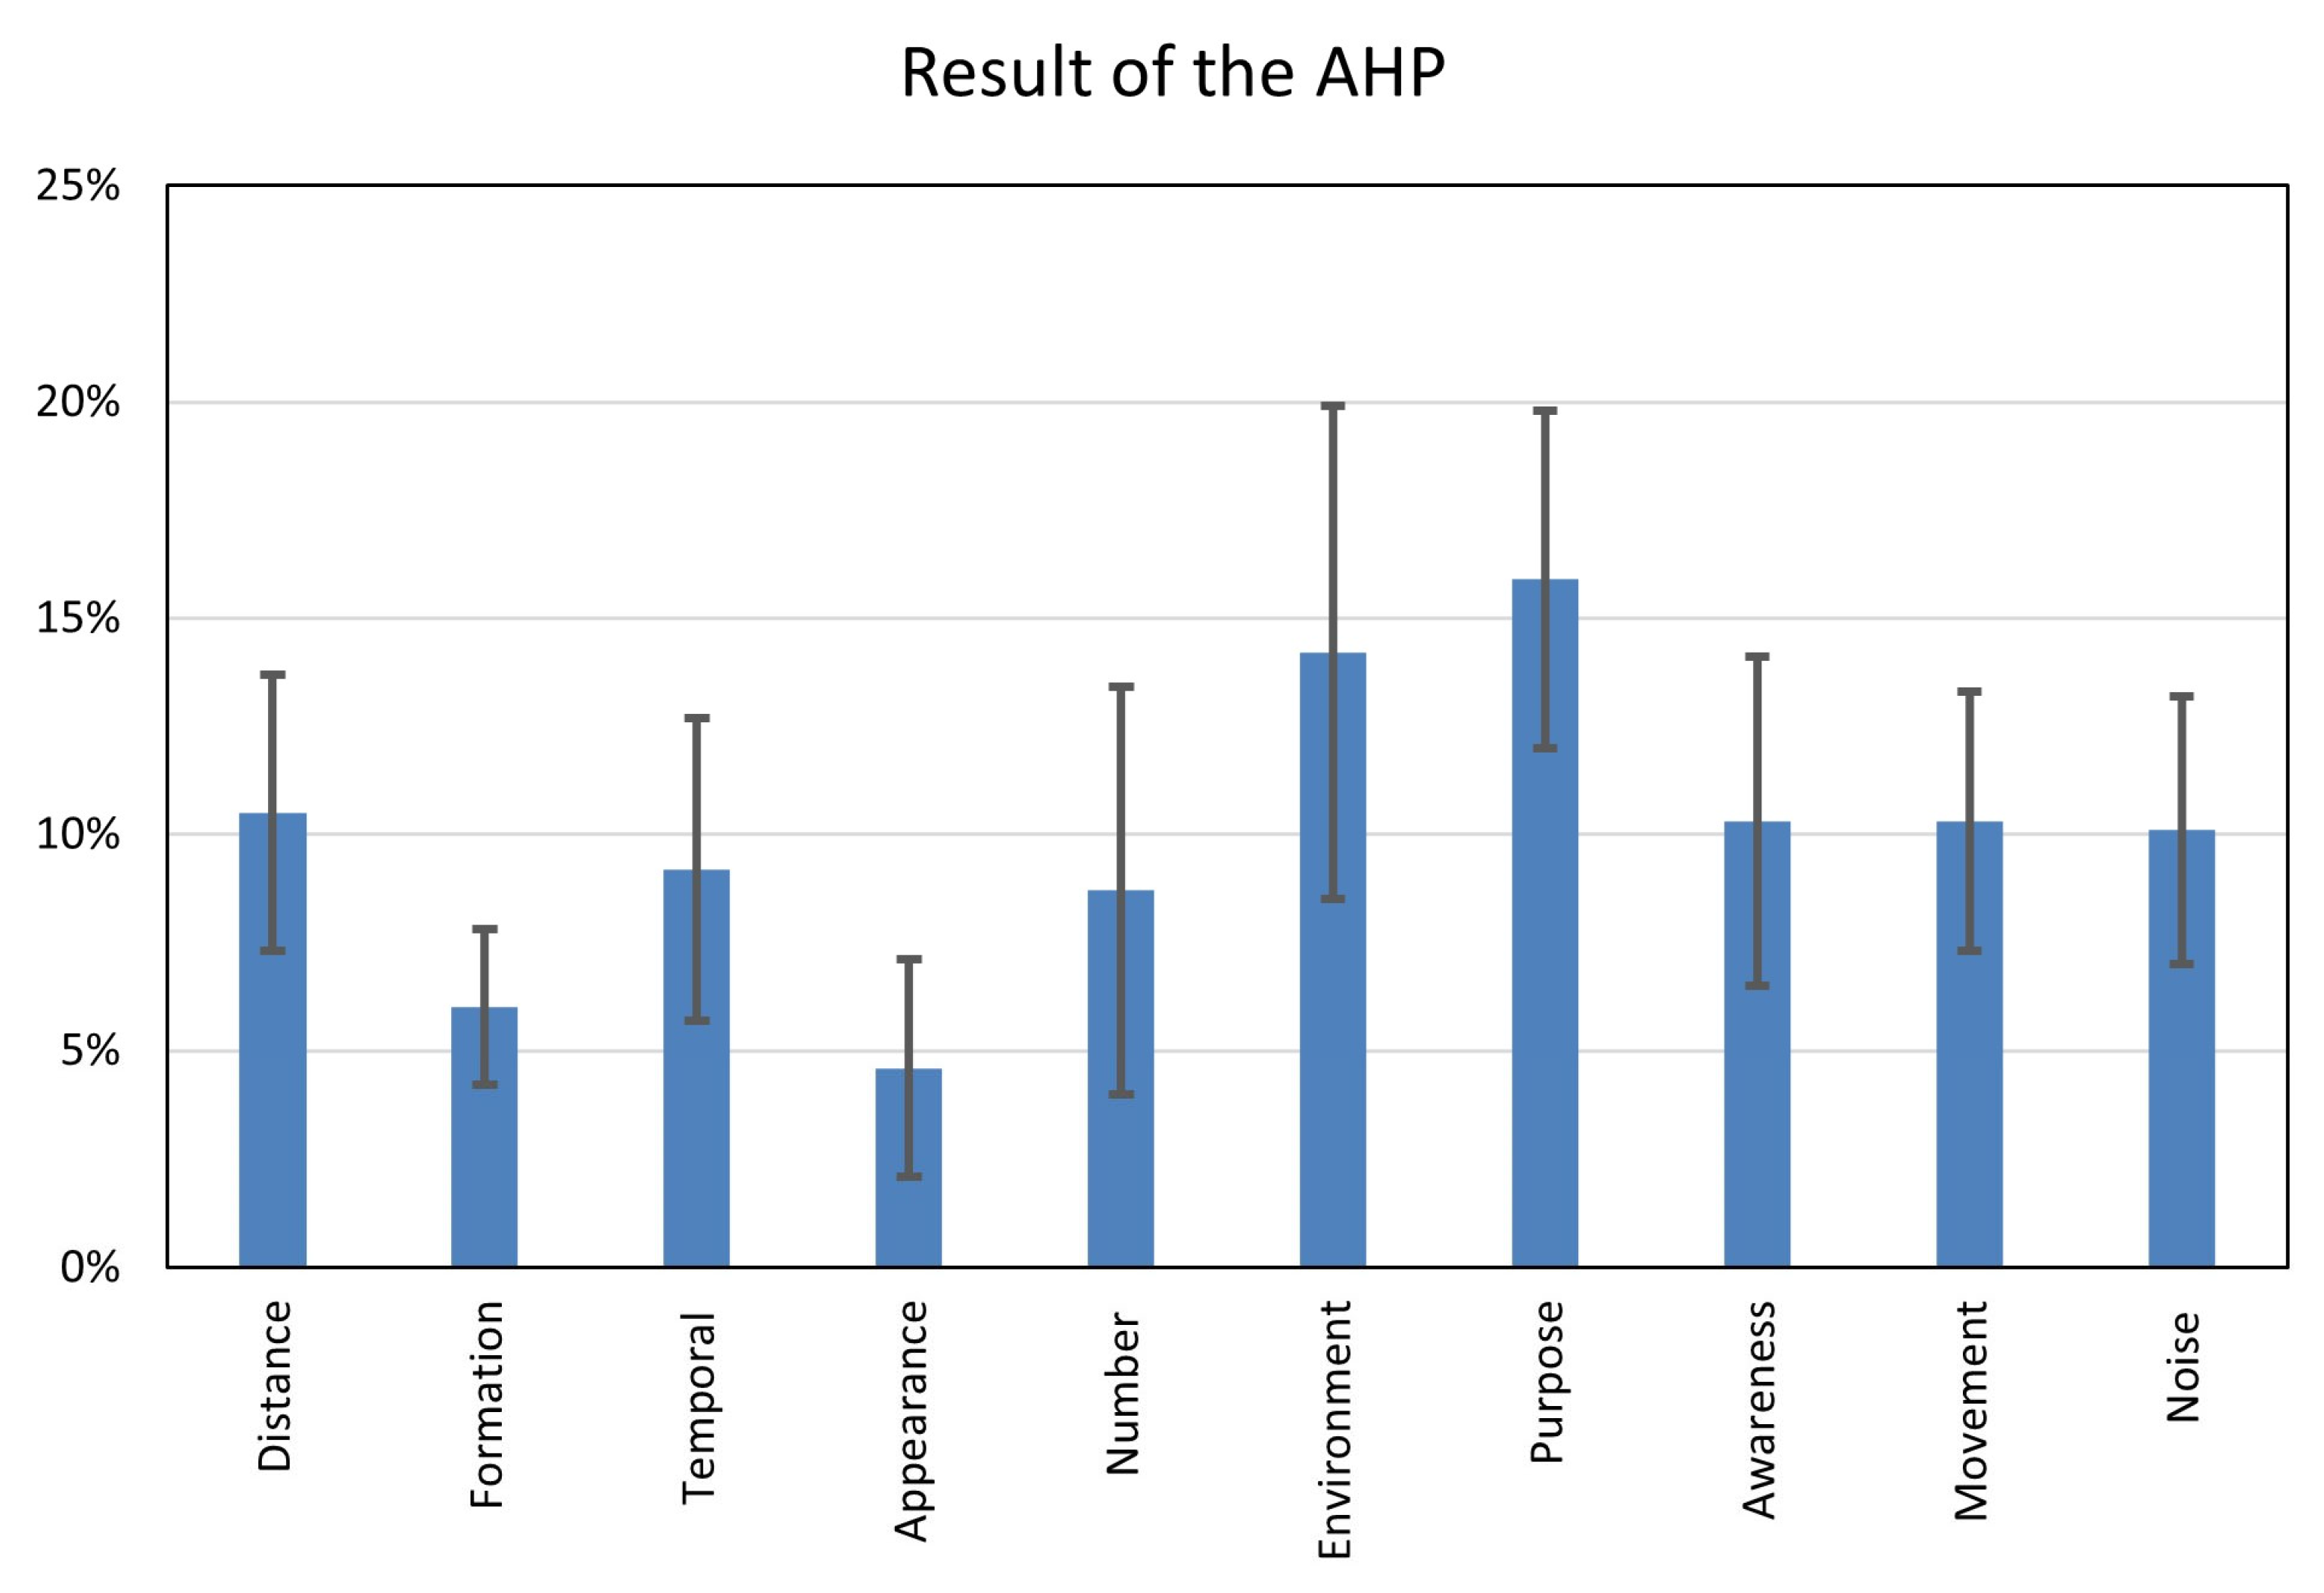
- Identifying the main factors that may cause visual pollution. An expert workshop was held to determine which factors to consider when analyzing visual pollution. During the workshop, the Analytic Hierarchy Process (AHP) methodology [35] was used to select the most important factors to include when constructing a mathematical model for calculating visual pollution. This gave a set of factors that might contribute to visual pollution from UAVs. A subset of these factors was then tested using an image-based questionnaire.
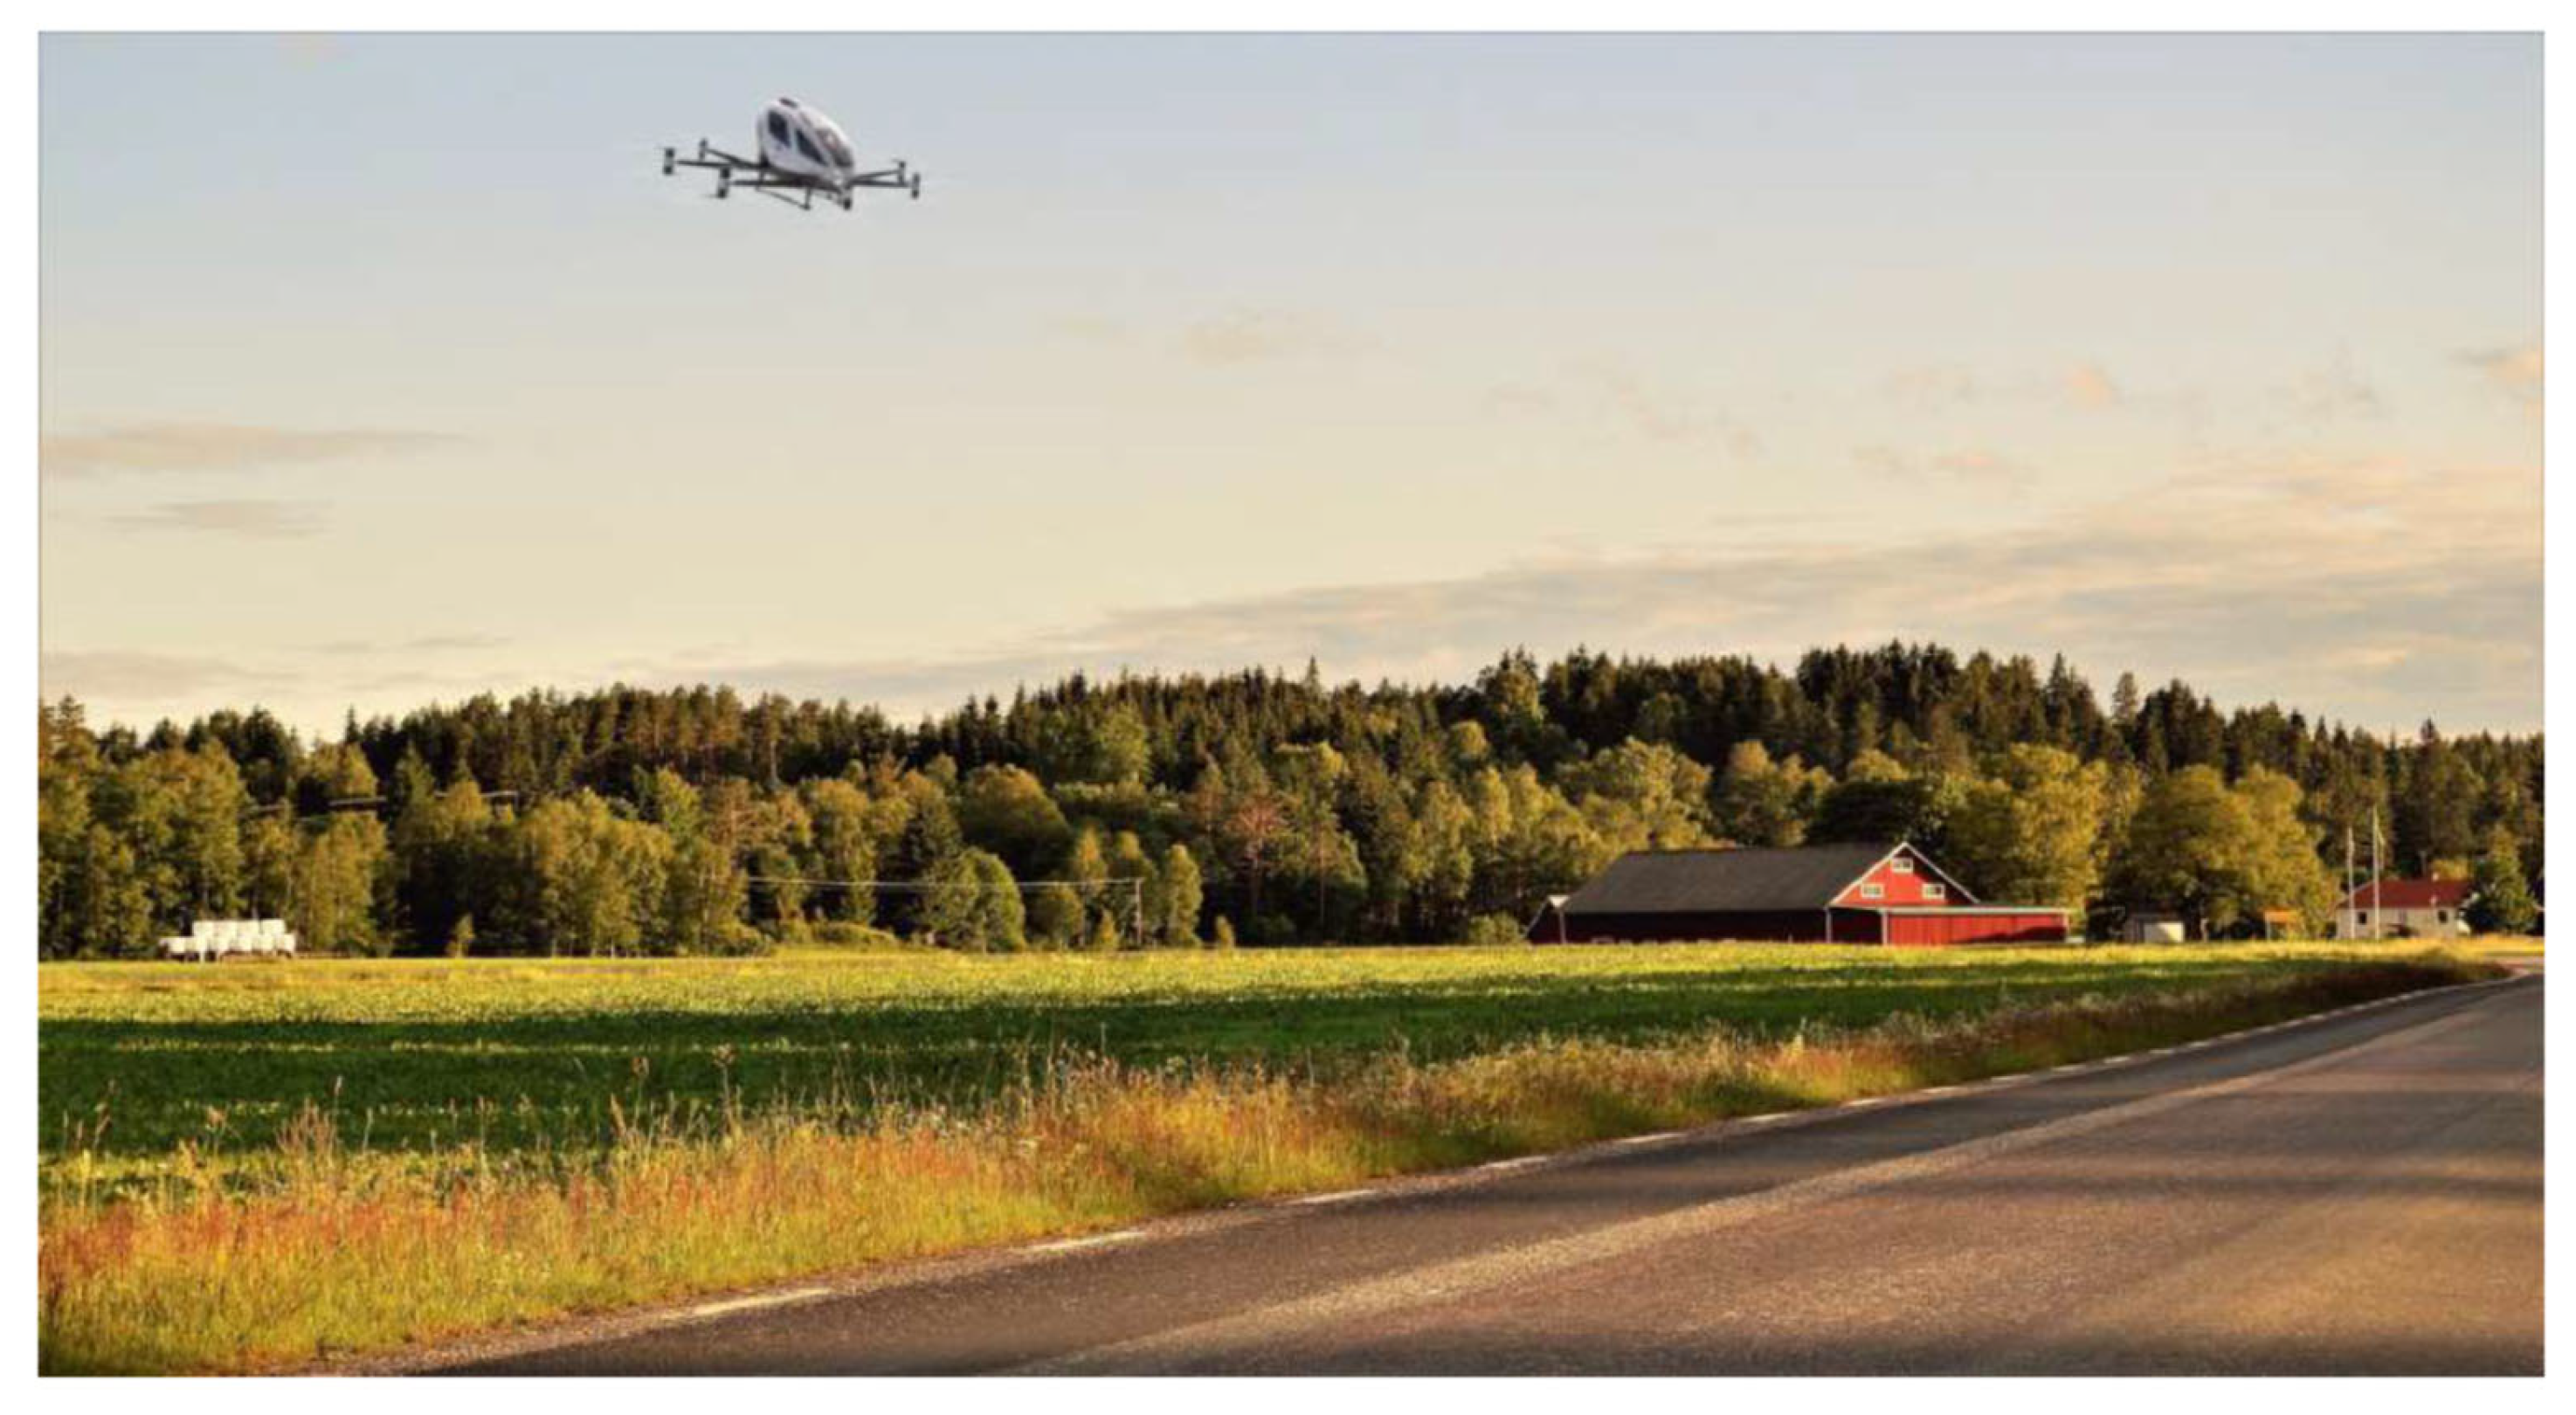
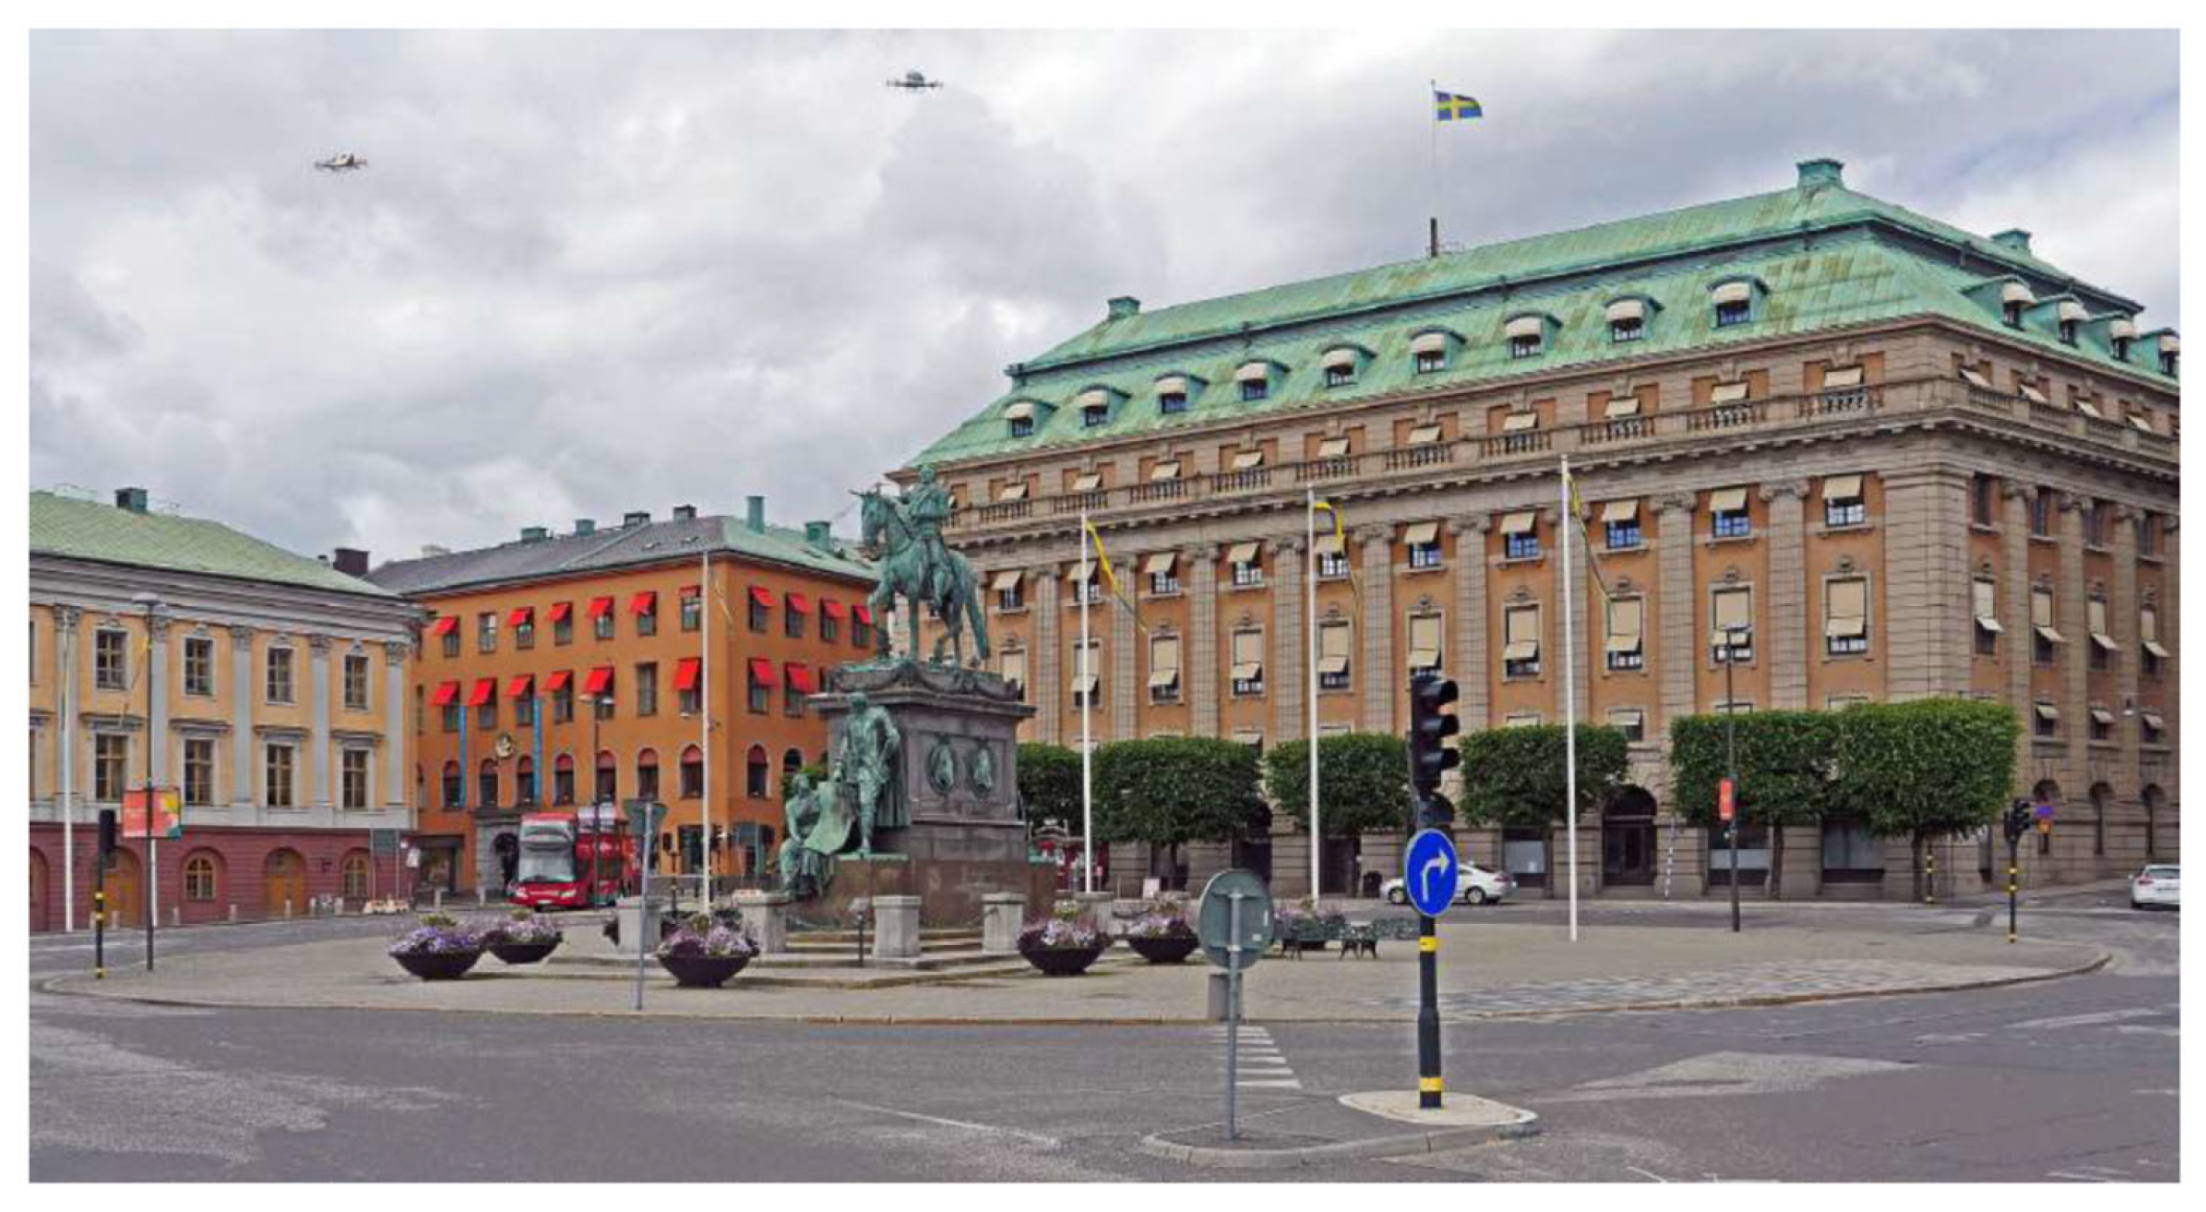
- An image-based questionnaire. A survey was crafted by adding UAVs in different positions and configurations to two backgrounds, one city, and one rural background. This is to see how the different identified factors would affect the perception of citizens. Then, respondents selected mainly by snowball sampling, were asked to rank the visual pollution in each image on a scale from zero to ten.
- Regression analysis. Regression was used to establish a correlation between the different factors and the grade that was obtained through the questionnaire. The objective was to obtain a function that could calculate the visual pollution based on different input values. Based on the results, two different functions were developed.
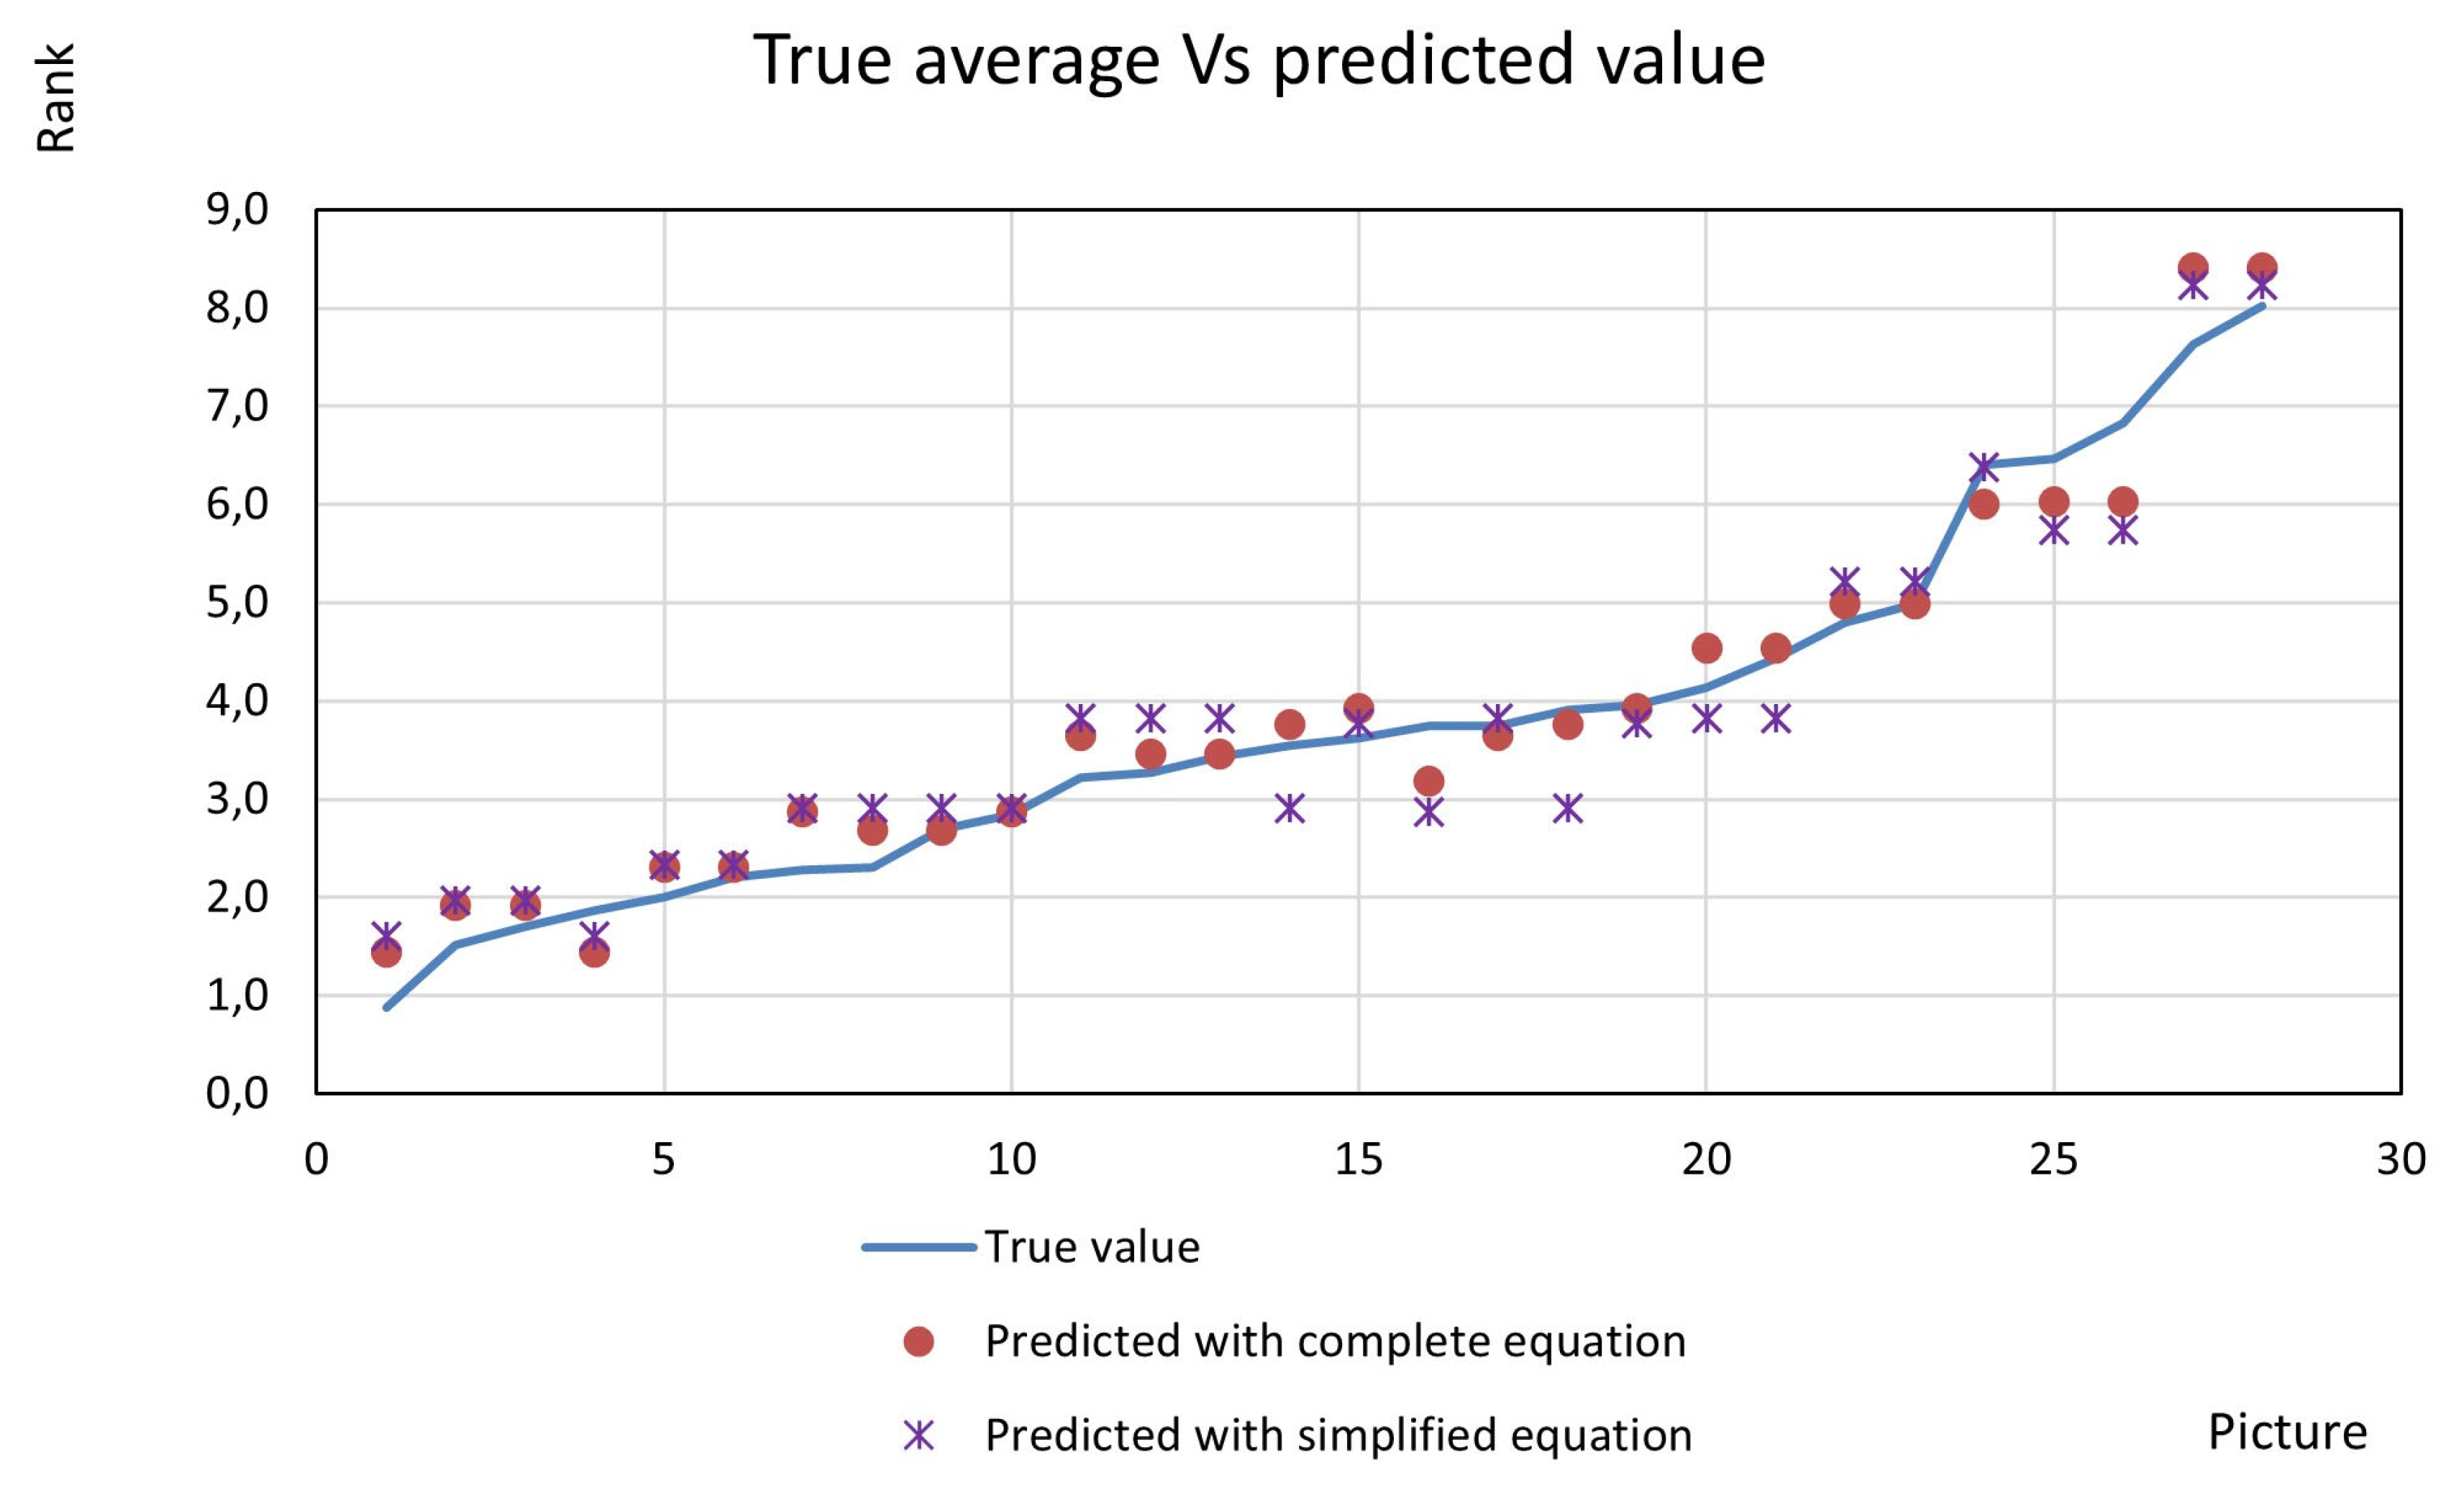
- Validating the results. During the test, four images were ranked by the participants but not considered in the regression, i.e., the images were divided into a training set and a validation set. Using these, it was possible to confirm that the functions can also be used for other scenarios.
2.1. Identifying the Main Factors That May Cause Visual Pollution
2.2. An Image-Based Questionnaire
- What is the level of visual pollution in this image?
- Is this level of visual pollution tolerable?
2.3. Regression Analysis
- RF1: The respondent ranked pictures without UAVs with a mark greater than or equal to 8.
- RF2: The respondent stated that images without UAVs were not tolerable.
- RF3: The respondent had 3 or more clear inconsistencies, e.g., that an image with a rank greater or equal to 8 was tolerable.
- RF4: The participant did not correctly identify the less polluted images. A number of pictures were, on average, low-ranked, and if a participant gave those a higher level than their own average, it was considered an inconsistency. If four or more images were inconsistently ranked, RF4 became active.
- RF5: The participant did not correctly identify the more polluted images. Same as RF4, but for the more polluted images.
- RF6, RF7, RF8, and RF9: The respondent provided responses not in line with the majority, e.g., the level of visual pollution increases when the UAV is further away.
- RF10: The respondent gave the same rank to all the images.
- RF11: The respondent gave more than six “10” ranks.
- Picture: Number from 1 to 28 that represents the order in which the picture was shown in the test.
- Environment: 0—Rural, 1—Urban.
- Distance to the closest UAV.
- The number of UAVs.
- Purpose: 0—No EMS, 1—EMS (if it is an EMS UAV or not)
- Awareness: 0—There is no extra information in the picture. 1—There is extra information provided in the picture.
- ID: Respondent number from 1 to 248.
- Age: 1—Less than 18, 2—From 18 to 30, 3—From 30 to 50, 4—From 50 to 65, 5—More than 65.
- Opinion: 0—No opinion about UAVs, 1—Positive opinion, 2—Negative opinion.
- Knowledge: 1—None, 2—Basic (The participant stated that (s)he could write a paragraph about UAVs), 3—Medium (The participant could write a page about UAVs), 4—Expert (The participant could write five pages about UAVs).
- Rank: Number from 0 to 10, where zero is no pollution, and ten represents strong pollution.
- Tolerable: 0—Not tolerable, 1—Tolerable.
3. Results
3.1. Expert Workshop and Image-Based Questionnaire
3.1.1. Factors Included in the Questionnaire
- Purpose: Purpose was considered as a main factor affecting visual pollution and was thus included in the questionnaire, using two categories: EMS purpose, or not. To introduce the variable, EMS UAVs were colored green and shown in the introduction to make sure that every participant understood the meaning of this color code.
- Environment: It is reasonable to assume that the area in which a UAV is seen might have an influence on the visual pollution score. Thus, two different backgrounds were used, one urban and one rural.
- Awareness: This factor tried to capture the possibility that a UAV might be less of a pollutant if the viewer knows where it is going, its speed, where it comes from, etc. To examine this, four existing images were complemented with information about the UAV’s route, track, weight, speed, flight level, and a hypothetical owner company.
- Number of UAVs: Images with one, two, five, and ten UAVs were added to the questionnaire to investigate how the number of UAVs seen at the same time affects visual pollution.
3.1.2. Factors Not Included in the Questionnaire
- Movement: Although how the UAVs move might have a major influence on visual pollution, due to the static image-based questionnaire methodology, it could not be studied.
- Noise: Some studies (e.g., [30]) already concluded that viewing a noise’s source might increase the noise annoyance. Nevertheless, and for the same reason as for movement, noise was not considered.
- Temporal factors: Visual pollution is not just an instant measure. It is probably more annoying to see a UAV for one minute than one hour. However, this factor was also deemed too difficult to capture using the selected methodology.
- Formation and appearance: According to the results from the AHP rankings, these two factors were perceived as minor when measuring visual pollution. Consequently, only one kind of UAV was used (an EHang 216), and when there were multiple UAVs, they had no specific formation.
3.2. Results from the Questionnaire
3.2.1. General Analysis of Respondents
3.2.2. Comparisons among Different Groups of Respondents
3.2.3. Visual Pollution Function
- Environment: Surprisingly, this factor—considered the second most important during the expert workshop—had almost no influence on the results. There was a difference in the acceptance ratio, showing that, in general, UAVs would be more tolerable in an urban environment. However, this difference was very small (four percentage units) and therefore, the environment variable was not included in the model.
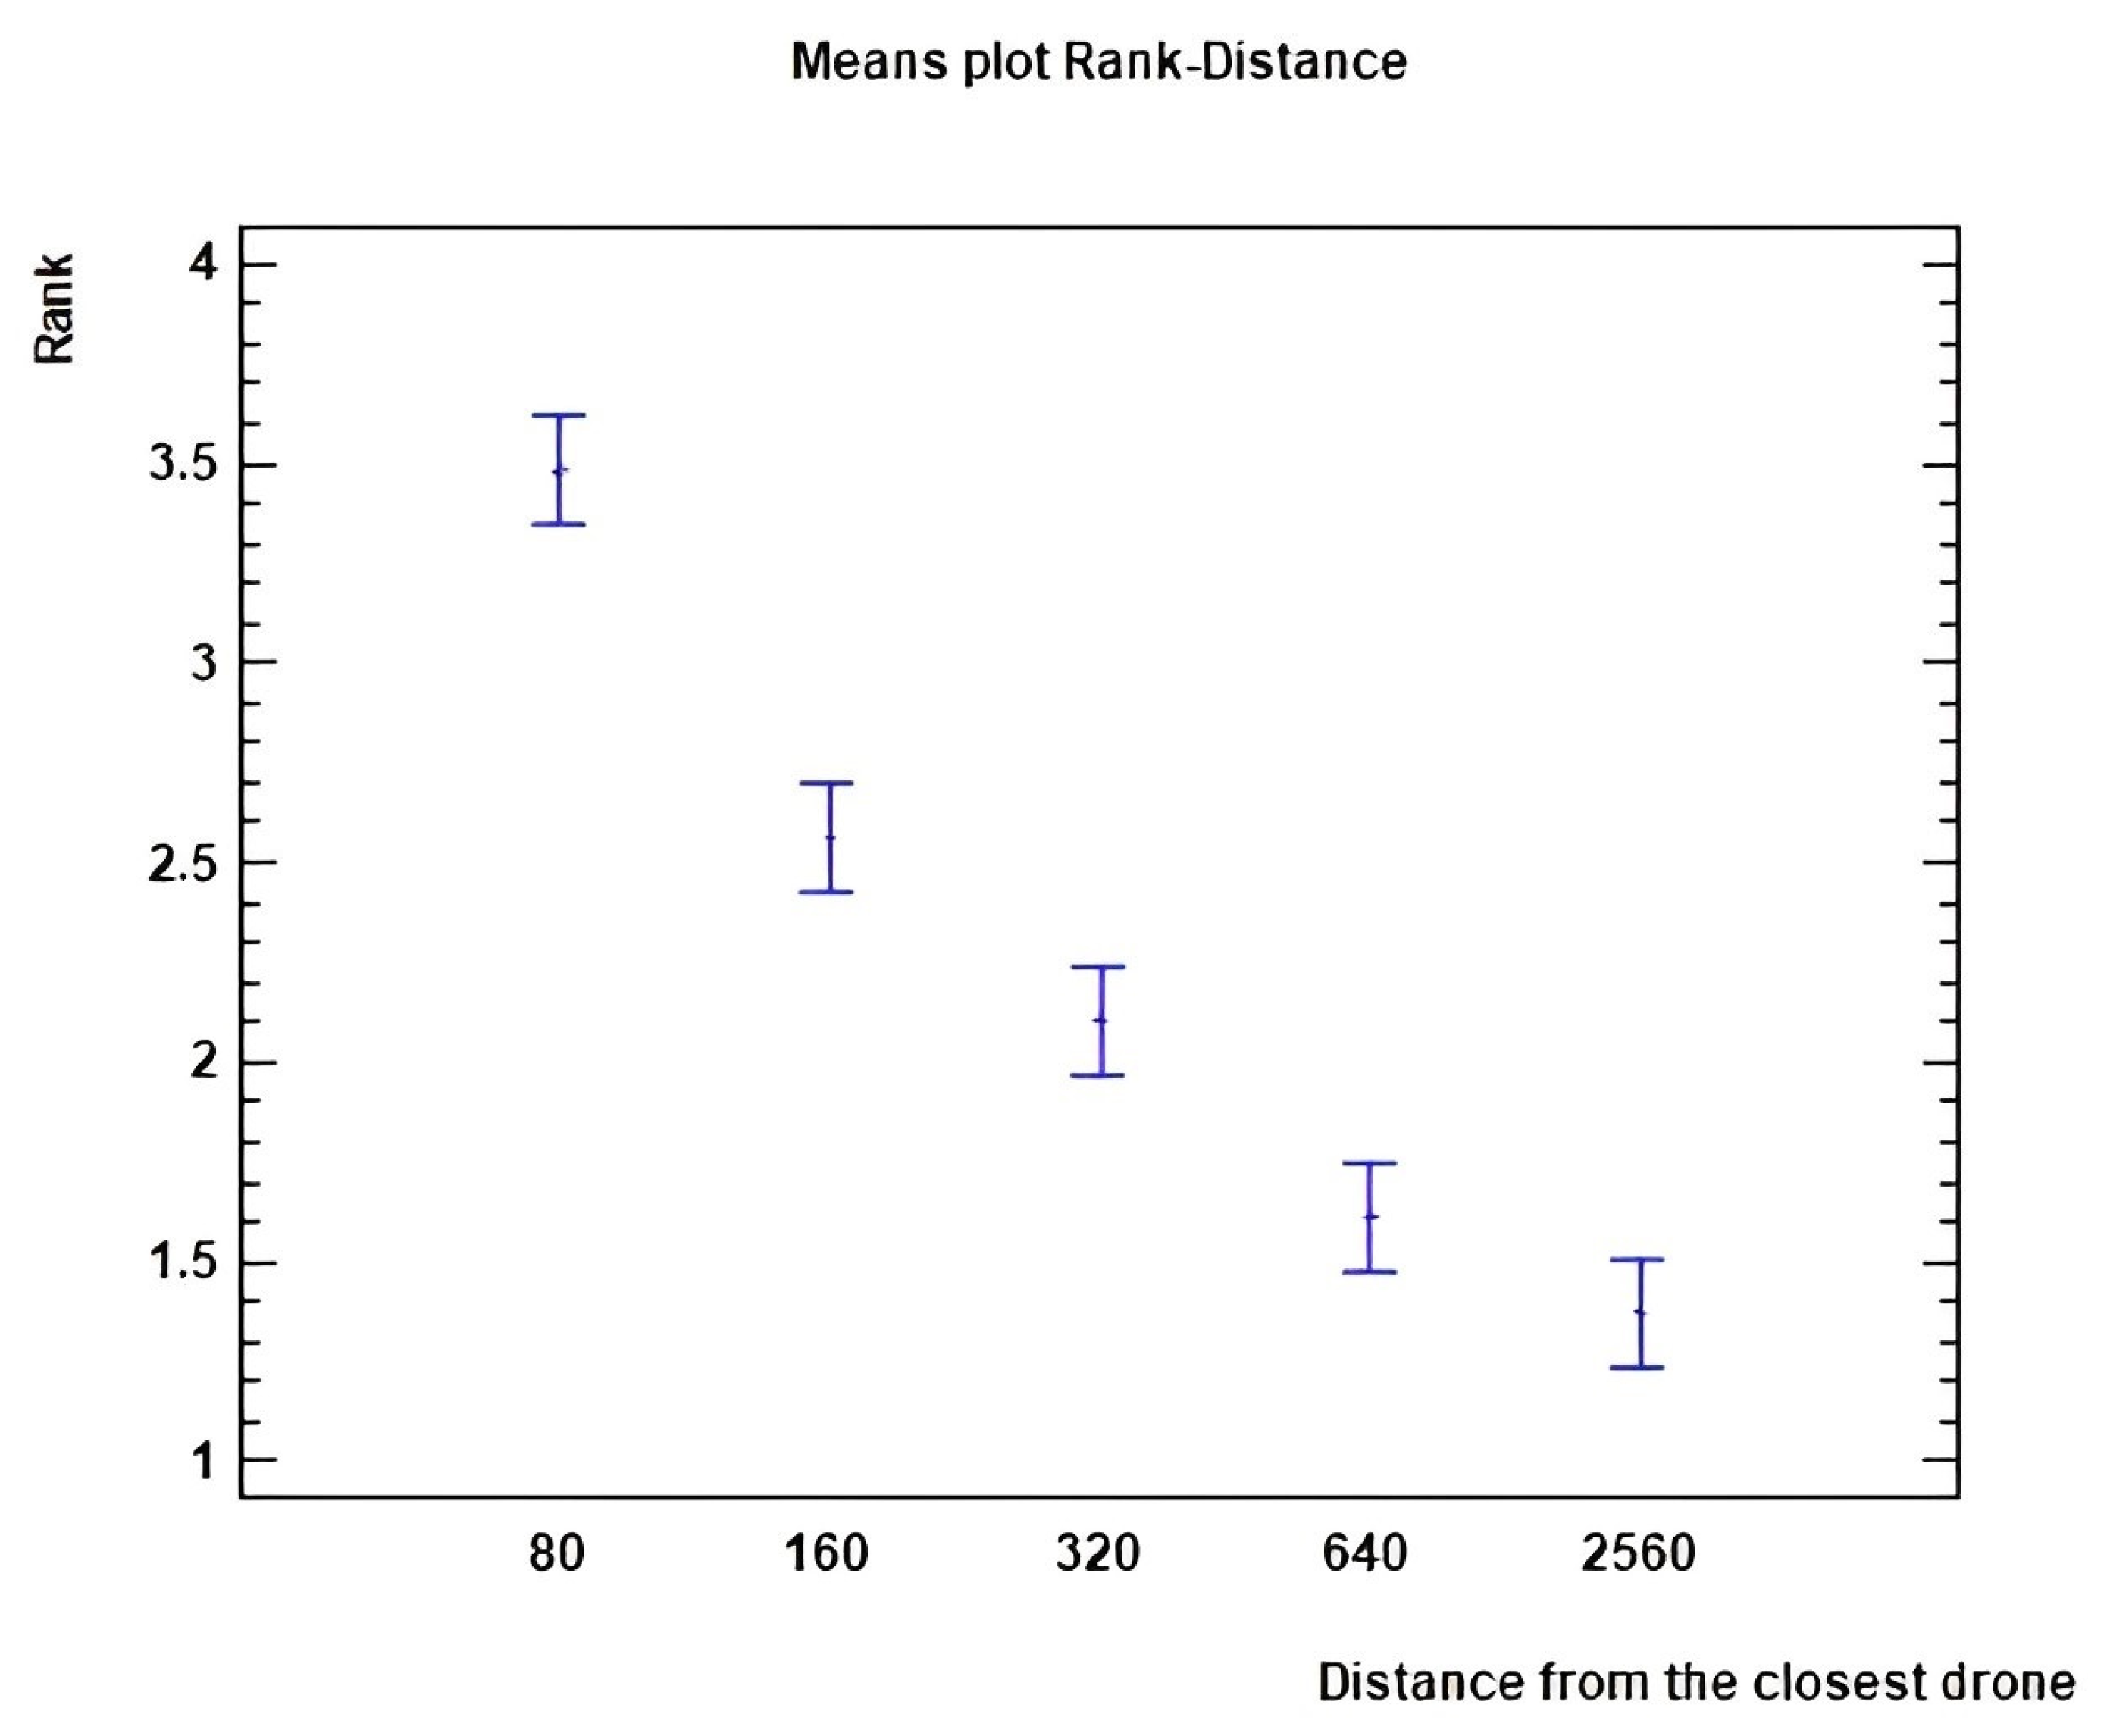
- Distance: Distance was a factor that clearly influenced the level of visual pollution. In Figure 5, the scores (rank) given for one UAV flying at different distances are shown.
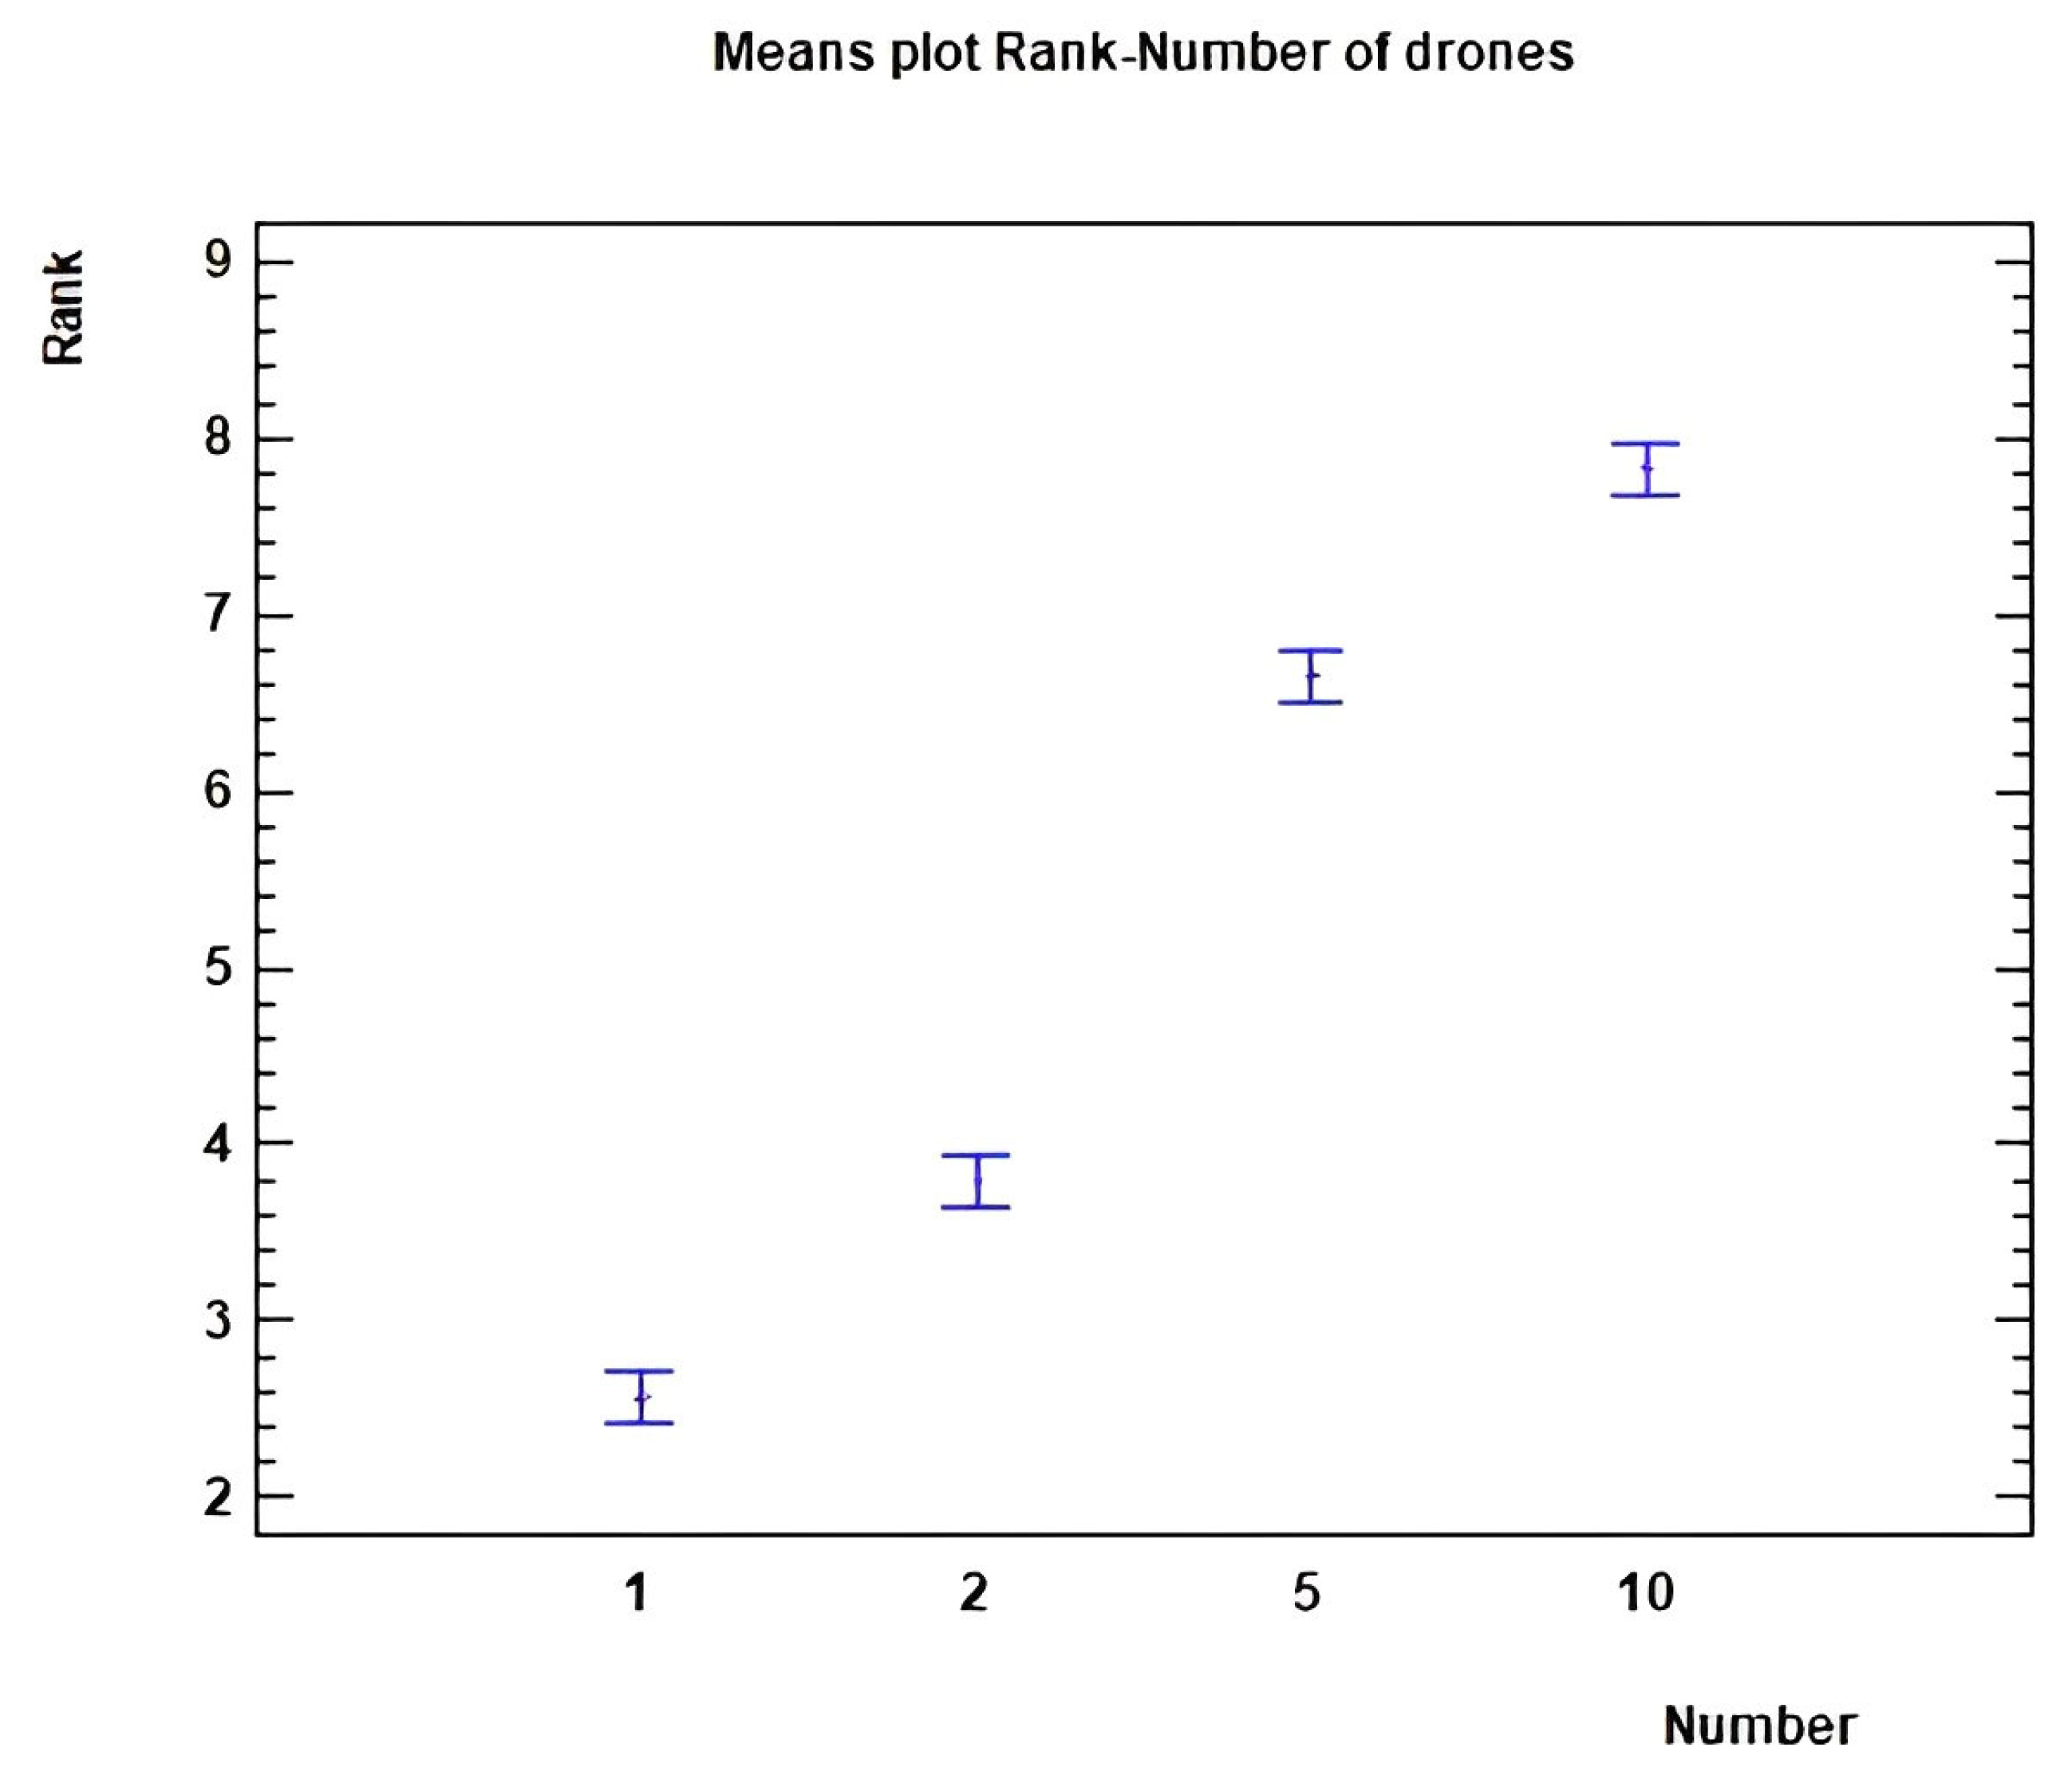
- Number of UAVs: The number of UAVs significantly increases visual pollution according to the results, see Figure 6.
- Purpose: There were no significant differences in the results regarding the purpose of the UAVs. However, the images with EMS UAVs received slightly lower scores than those without EMS UAVs.
- Awareness: In four images, there was extra information about the UAV, which was supposed to decrease visual pollution, familiarizing people with the UAV. However, the result was the opposite. The mean score for the images that had no information was 3.02, and the mean for those with additional information was 4.01. One possible explanation is that the questionnaire design was not optimal, and the respondents did not correctly understand the meaning of the information squares.
3.2.4. Validation of the Results
4. Discussion
5. Conclusions
Supplementary Materials
Author Contributions
Funding
Data Availability Statement
Acknowledgments
Conflicts of Interest
References
- Floreano, D.; Wood, R.J. Science, technology and the future of small autonomous drones. Nature 2015, 521, 460–466. [Google Scholar] [CrossRef] [PubMed] [Green Version]
- Geller, J.; Jiang, T.; Ni, D.; Collura, J. Traffic Management for Small Unmanned Aerial Systems (sUAS): Towards the Development of a Concept of Operations and System Architecture. In Proceedings of the Transportation Research Board 95th Annual Meeting, Washington, DC, USA, 10–14 January 2016. [Google Scholar]
- Merkert, R.; Bushell, J. Managing the drone revolution: A systematic literature review into the current use of airborne drones and future strategic directions for their effective control. J. Air Transp. Manag. 2020, 89, 101929. [Google Scholar] [CrossRef] [PubMed]
- Claesson, A.; Fredman, D.; Svensson, L.; Ringh, M.; Hollenberg, J.; Nordberg, P.; Rosenqvist, M.; Djarv, T.; Österberg, S.; Lennartsson, J. Unmanned aerial vehicles (drones) in out-of-hospital-cardiac-arrest. Scand. J. Trauma Resusc. Emerg. Med. 2016, 24, 124. [Google Scholar] [CrossRef] [PubMed] [Green Version]
- Schierbeck, S.; Hollenberg, J.; Nord, A.; Svensson, L.; Nordberg, P.; Ringh, M.; Forsberg, S.; Lundgren, P.; Axelsson, C.; Claesson, A. Automated external defibrillators delivered by drones to patients with suspected out-of-hospital cardiac arrest. Eur. Heart J. 2022, 43, 1478–1487. [Google Scholar] [CrossRef]
- Mishra, B.; Garg, D.; Narang, P.; Mishra, V. Drone-surveillance for search and rescue in natural disaster. Comput. Commun. 2020, 156, 1–10. [Google Scholar] [CrossRef]
- Claesson, A.; Schierbeck, S.; Hollenberg, J.; Forsberg, S.; Nordberg, P.; Ringh, M.; Olausson, M.; Jansson, A.; Nord, A. The use of drones and a machine-learning model for recognition of simulated drowning victims—A feasibility study. Resuscitation 2020, 156, 196–201. [Google Scholar] [CrossRef]
- Chowdhury, S.; Shahvari, O.; Marufuzzaman, M.; Li, X.; Bian, L. Drone routing and optimization for post-disaster inspection. Comput. Ind. Eng. 2021, 159, 107495. [Google Scholar] [CrossRef]
- Burgues, J.; Hernandez, V.; Lilienthal, A.J.; Marco, S. Smelling Nano Aerial Vehicle for Gas Source Localization and Mapping. Sensors 2019, 19, 478. [Google Scholar] [CrossRef] [Green Version]
- WHO. Environmental Noise Guidelines for the European Region; World Health Organization, Regional Office for Europe: Geneva, Switzerland, 2018. [Google Scholar]
- Schäffer, B.; Pieren, R.; Heutschi, K.; Wunderli, J.M.; Becker, S. Drone noise emission characteristics and noise effects on humans—A systematic review. Int. J. Environ. Res. Public Health 2021, 18, 5940. [Google Scholar] [CrossRef]
- Raghunatha, A.; Thollander, P.; Barthel, S. Addressing the emergence of drones–A policy development framework for regional drone transportation systems. Transp. Res. Interdiscip. Perspect. 2023, 18, 100795. [Google Scholar] [CrossRef]
- González, A.R.; Calle, E.A.D. Contaminación acústica de origen vehicular en la localidad de Chapinero (Bogotá, Colombia). Gestión Ambiente 2015, 18, 17–28. [Google Scholar]
- Nguyen, T.; Nguyen, H.; Yano, T.; Nishimura, T.; Sato, T.; Morihara, T.; Hashimoto, Y. Comparison of models to predict annoyance from combined noise in Ho Chi Minh City and Hanoi. Appl. Acoust. 2012, 73, 952–959. [Google Scholar] [CrossRef]
- Montbrun, N.; Rastelli, V.; Oliver, K.; Chacón, R. Medición del impacto ocasionado por ruidos esporádicos de corta duración. Interciencia 2006, 31, 411–416. [Google Scholar]
- Gennaretti, M.; Serafini, J.; Bernardini, G.; Castorrini, A.; De Matteis, G.; Avanzini, G. Numerical characterization of helicopter noise hemispheres. Aerosp. Sci. Technol. 2016, 52, 18–28. [Google Scholar] [CrossRef] [Green Version]
- Greenwood, E.; Rau, R. A maneuvering flight noise model for helicopter mission planning. J. Am. Helicopter Soc. 2020, 65, 1–10. [Google Scholar] [CrossRef]
- Hossain, M.Y.; Nijhum, I.R.; Sadi, A.A.; Shad, M.T.M.; Rahman, R.M. Visual Pollution Detection Using Google Street View and YOLO. In Proceedings of the 2021 IEEE 12th Annual Ubiquitous Computing, Electronics & Mobile Communication Conference (UEMCON), New York, NY, USA, 1–4 December 2021; pp. 433–440. [Google Scholar]
- Ahmed, N.; Islam, M.N.; Tuba, A.S.; Mandy, M.R.C.; Sujauddin, M. Solving visual pollution with deep learning: A new nexus in environmental management. J. Environ. Manag. 2019, 248, 109253. [Google Scholar] [CrossRef]
- Portella, A.A. Evaluating Commercial Signs in Historic Streetscapes: The Effects of the Control of Advertising and Signage on User’s Sense of Environmental Quality. Ph.D. Thesis, Oxford Brookes University, Oxford, UK, 2007. [Google Scholar]
- Sumartono, S. Visual pollution in the contex of conflicting design requirements. J. Dimens. Seni Rupa Dan Desain 2009, 6, 157–172. [Google Scholar] [CrossRef]
- Yilmaz, D.; Sagsöz, A. In the context of visual pollution: Effects to trabzon city center silhoutte. Asian Soc. Sci. 2011, 7, 98. [Google Scholar] [CrossRef]
- Jensen, C.U.; Panduro, T.E.; Lundhede, T.H. The vindication of Don Quixote: The impact of noise and visual pollution from wind turbines. Land Econ. 2014, 90, 668–682. [Google Scholar] [CrossRef]
- Mohamed, M.A.S.; Ibrahim, A.O.; Dodo, Y.A.; Bashir, F.M. Visual pollution manifestations negative impacts on the people of Saudi Arabia. Int. J. Adv. Appl. Sci. 2021, 8, 94–101. [Google Scholar]
- Chmielewski, S. Chaos in motion: Measuring visual pollution with tangential view landscape metrics. Land 2020, 9, 515. [Google Scholar] [CrossRef]
- Betakova, V.; Vojar, J.; Sklenicka, P. Wind turbines location: How many and how far? Appl. Energ. 2015, 151, 23–31. [Google Scholar] [CrossRef]
- Skenteris, K.; Mirasgedis, S.; Tourkolias, C. Implementing hedonic pricing models for valuing the visual impact of wind farms in Greece. Econ. Anal. Policy 2019, 64, 248–258. [Google Scholar] [CrossRef]
- Wakil, K.; Naeem, M.A.; Anjum, G.A.; Waheed, A.; Thaheem, M.J.; Hussnain, M.Q.U.; Nawaz, R. A hybrid tool for visual pollution assessment in urban environments. Sustainability 2019, 11, 2211. [Google Scholar] [CrossRef] [Green Version]
- Correa, V.F.; Mejía, A.A. Indicadores de contaminación visual y sus efectos en la población. Enfoque UTE 2015, 6, 115–132. [Google Scholar] [CrossRef] [Green Version]
- Schäffer, B.; Pieren, R.; Hayek, U.W.; Biver, N.; Grêt-Regamey, A. Influence of visibility of wind farms on noise annoyance–A laboratory experiment with audio-visual simulations. Landsc. Urban Plan. 2019, 186, 67–78. [Google Scholar] [CrossRef]
- EASA. Urban Air Mobility Survey Evaluation Report; EASA: Cologne, Germany, 2021. [Google Scholar]
- OIG. Public Perception of Drone Delivery in the United States; RARC-WP-17-001; US Postal Service Office of Inspector General: Arlington, VA, USA, 2016.
- Heyman, A.V.; Law, S.; Berghauser Pont, M. How is location measured in housing valuation? A systematic review of accessibility specifications in hedonic price models. Urban Sci. 2018, 3, 3. [Google Scholar] [CrossRef] [Green Version]
- Chmielewski, S.; Lee, D.J.; Tompalski, P.; Chmielewski, T.J.; Wężyk, P. Measuring visual pollution by outdoor advertisements in an urban street using intervisibilty analysis and public surveys. Int. J. Geogr. Inf. Sci. 2016, 30, 801–818. [Google Scholar] [CrossRef]
- Saaty, T.L. How to make a decision: The analytic hierarchy process. Eur. J. Oper. Res. 1990, 48, 9–26. [Google Scholar] [CrossRef]
- Sałabun, W.; Wątróbski, J.; Shekhovtsov, A. Are MCDA Methods Benchmarkable? A Comparative Study of TOPSIS, VIKOR, COPRAS, and PROMETHEE II Methods. Symmetry 2020, 12, 1549. [Google Scholar] [CrossRef]
- Do, D.T.; Nguyen, N.-T. Applying Cocoso, Mabac, Mairca, Eamr, Topsis and weight determination methods for multi-criteria decision making in hole turning process. Stroj. Časopis-J. Mech. Eng. 2022, 72, 15–40. [Google Scholar] [CrossRef]
- Ayan, B.; Abacioglu, S.; Basilio, M.P. A Comprehensive Review of the Novel Weighting Methods for Multi-Criteria Decision-Making. Information (2078–2489) 2023, 14, 285. [Google Scholar] [CrossRef]
- Brunelli, M. Introduction to the Analytic Hierarchy Process; Springer: Berlin/Heidelberg, Germany, 2014. [Google Scholar]
- Goepel, K.D. Implementing the analytic hierarchy process as a standard method for multi-criteria decision making in corporate enterprises—A new AHP excel template with multiple inputs. In Proceedings of the International Symposium on the Analytic Hierarchy Process, Kuala Lumpur, Malaysia, 23–26 June 2013; Creative Decisions Foundation: Kuala Lumpur, Malaysia, 2013; pp. 1–10. [Google Scholar]
- Jenn, N.C. Designing a questionnaire. Malays. Fam. Physician Off. J. Acad. Fam. Physicians Malays. 2006, 1, 32–35. [Google Scholar]
- Brace, I. Questionnaire Design: How to Plan, Structure and Write Survey Material for Effective Market Research; Kogan Page Publishers: London, UK, 2018. [Google Scholar]
- Deutskens, E.; De Ruyter, K.; Wetzels, M.; Oosterveld, P. Response rate and response quality of internet-based surveys: An experimental study. Mark. Lett. 2004, 15, 21–36. [Google Scholar] [CrossRef] [Green Version]
- Gordon, J.S.; McNew, R. Developing the online survey. Nurs. Clin. N. Am. 2008, 43, 605–619. [Google Scholar] [CrossRef]
- Andrews, D.; Nonnecke, B.; Preece, J. Conducting Research on the Internet: Online Survey Design, Development and Implementation Guidelines; Athabasca University: Athabasca, AB, Canada, 2007. [Google Scholar]
- López, A.M.; Comunidad, R.; del Río Alonso, H.D.L.; Ródríguez, C.B.; de Elche, H. Fundamentos Estadísticos Para Investigación. Introducción a R; Bubok Publishing S.L: Murcia, Spain, 2013; ISBN 978-84-686-3629-0. [Google Scholar]
- Keller, M.; Hulínská, Š.; Kraus, J. Integration of UAM into Cities–The Public View. Transp. Res. Procedia 2021, 59, 137–143. [Google Scholar] [CrossRef]
- Heutschi, K.; Ott, B.; Nussbaumer, T.; Wellig, P. Synthesis of real world drone signals based on lab recordings. Acta Acust. 2020, 4, 24. [Google Scholar] [CrossRef]
- Sedov, L.; Polishchuk, V.; Thibault, M.; Maria, U.; Darya, L. Qualitative and quantitative risk assessment of urban airspace operations. In Proceedings of the SESAR Innovation Days (SID 2021), Virtually, 7–9 December 2021. [Google Scholar]
- Chen, J.; Du, C.; Zhang, Y.; Han, P.; Wei, W. A clustering-based coverage path planning method for autonomous heterogeneous UAVs. IEEE Trans. Intell. Transp. Syst. 2021, 23, 25546–25556. [Google Scholar] [CrossRef]
- Van Egmond, P.; Mascarenhas, L. Public and Stakeholder Acceptance–Interim Report; AiRMOUR Deliverable 4.1; European Union: Brussels, Belgium, 2022. [Google Scholar]


| Factor | Criteria | Description |
|---|---|---|
| Appearance | Dimensions | Observable characteristics of the UAV |
| Lights (static or flashing) | ||
| Color or icons | ||
| Awareness | Knowledge about the UAV’s route | Information (e.g., through an app) about the UAV, such as where it is going, where it comes from, its speed, etc. |
| Familiarity with UAVs | ||
| Trust in the application | ||
| Distance | Distance | Distance to the observant and altitude of the UAV |
| Altitude | ||
| Environment | Environment | In which environment the UAV is seen: in the city center, in a rural area, at the beach, etc. |
| What is it compared with? | ||
| Formation | Formation | If the UAVs are flying in a line formation, in groups, completely scattered, etc. |
| Movement | Movement | If the movement of the UAV or its speed has an influence on how it is perceived |
| Noise | Noise | If the noise generated by the UAV increases the visual pollution that it generates |
| Number of UAVs | Number of UAVs | How many UAVs are visible at the same time |
| Purpose | Purpose | If the UAV is carrying cargo, passengers, or is on an EMS mission |
| Temporal component | Pattern | Factors related to the time of exposure or the number of times that a person would see the UAV |
| Time of exposure | ||
| Frequency | ||
| Trajectory |
| Question | Environment | Distance to the Closest UAV | Number of UAVs | Purpose | Awareness |
|---|---|---|---|---|---|
| 1 | Rural | 0 | |||
| 2 | Rural | 80 | 1 | No EMS | No |
| 3 | Urban | 0 | |||
| 4 | Urban | 80 | 1 | No EMS | No |
| 5 | Urban | 160 | 1 | No EMS | No |
| 6 | Urban | 160 | 10 | No EMS | No |
| 7 | Rural | 80 | 2 | No EMS | No |
| 8 | Rural | 640 | 1 | No EMS | No |
| 9 | Urban | 320 | 1 | No EMS | No |
| 10 | Rural | 160 | 1 | No EMS | No |
| 11 | Urban | 80 | 2 | No EMS | No |
| 12 | Rural | 160 | 5 | No EMS | No |
| 13 | Urban | 320 | 2 | No EMS | No |
| 14 | Rural | 80 | 3 | No EMS | No |
| 15 | Rural | 320 | 1 | No EMS | No |
| 16 | Rural | 160 | 10 | No EMS | No |
| 17 | Urban | 640 | 1 | No EMS | No |
| 18 | Urban | 160 | 5 | No EMS | No |
| 19 | Rural | 160 | 2 | No EMS | No |
| 20 | Urban | 160 | 2 | No EMS | No |
| 21 | Rural | 80 | 1 | EMS | No |
| 22 | Rural | 160 | 1 | EMS | No |
| 23 | Urban | 80 | 1 | EMS | No |
| 24 | Urban | 160 | 1 | EMS | No |
| 25 | Urban | 80 | 1 | No EMS | Yes |
| 26 | Urban | 160 | 1 | No EMS | Yes |
| 27 | Rural | 80 | 1 | No EMS | Yes |
| 28 | Rural | 160 | 1 | No EMS | Yes |
| Image | Distance [m] | Number of UAVs | True Average | Predicted Complete Model | Error [%] | Predicted Simplified Model | Error [%] |
|---|---|---|---|---|---|---|---|
| 7 | 80 | 2 | 4.8 | 5.0 | 3.9 | 5.2 | 8.8 |
| 11 | 80 | 2 | 5.0 | 5.0 | 0.1 | 5.2 | 4.6 |
| 13 | 320 | 2 | 3.7 | 3.2 | 15.0 | 2.9 | 23.1 |
| 14 | 80 | 3 | 6.4 | 6.0 | 6.1 | 6.4 | 0.2 |
Disclaimer/Publisher’s Note: The statements, opinions and data contained in all publications are solely those of the individual author(s) and contributor(s) and not of MDPI and/or the editor(s). MDPI and/or the editor(s) disclaim responsibility for any injury to people or property resulting from any ideas, methods, instructions or products referred to in the content. |
© 2023 by the authors. Licensee MDPI, Basel, Switzerland. This article is an open access article distributed under the terms and conditions of the Creative Commons Attribution (CC BY) license (https://creativecommons.org/licenses/by/4.0/).
Share and Cite
Thomas, K.; Granberg, T.A. Quantifying Visual Pollution from Urban Air Mobility. Drones 2023, 7, 396. https://doi.org/10.3390/drones7060396
Thomas K, Granberg TA. Quantifying Visual Pollution from Urban Air Mobility. Drones. 2023; 7(6):396. https://doi.org/10.3390/drones7060396
Chicago/Turabian StyleThomas, Kilian, and Tobias A. Granberg. 2023. "Quantifying Visual Pollution from Urban Air Mobility" Drones 7, no. 6: 396. https://doi.org/10.3390/drones7060396
APA StyleThomas, K., & Granberg, T. A. (2023). Quantifying Visual Pollution from Urban Air Mobility. Drones, 7(6), 396. https://doi.org/10.3390/drones7060396


