Article

Fast Opium Poppy Detection in Unmanned Aerial Vehicle (UAV) Imagery Based on Deep Neural Network

1
School of Computer Science, Hubei University of Technology, Wuhan 430068, China
2
State Key Laboratory of Information Engineering in Surveying, Mapping, and Remote Sensing, Wuhan University, Wuhan 430079, China
*
Author to whom correspondence should be addressed.
These authors contributed equally to this work.
Drones 2023, 7(9), 559; https://doi.org/10.3390/drones7090559
Submission received: 1 August 2023 / Revised: 22 August 2023 / Accepted: 29 August 2023 / Published: 30 August 2023

Abstract

:
Opium poppy is a medicinal plant, and its cultivation is illegal without legal approval in China. Unmanned aerial vehicle (UAV) is an effective tool for monitoring illegal poppy cultivation. However, targets often appear occluded and confused, and it is difficult for existing detectors to accurately detect poppies. To address this problem, we propose an opium poppy detection network, YOLOHLA, for UAV remote sensing images. Specifically, we propose a new attention module that uses two branches to extract features at different scales. To enhance generalization capabilities, we introduce a learning strategy that involves iterative learning, where challenging samples are identified and the model’s representation capacity is enhanced using prior knowledge. Furthermore, we propose a lightweight model (YOLOHLA-tiny) using YOLOHLA based on structured model pruning, which can be better deployed on low-power embedded platforms. To evaluate the detection performance of the proposed method, we collect a UAV remote sensing image poppy dataset. The experimental results show that the proposed YOLOHLA model achieves better detection performance and faster execution speed than existing models. Our method achieves a mean average precision (mAP) of 88.2% and an F1 score of 85.5% for opium poppy detection. The proposed lightweight model achieves an inference speed of 172 frames per second (FPS) on embedded platforms. The experimental results showcase the practical applicability of the proposed poppy object detection method for real-time detection of poppy targets on UAV platforms.

1. Introduction

Poppy is the source of various sedatives and narcotics, such as morphine, codeine, and thebaine. Planting poppies without the permission of relevant authorities is illegal in China. However, poppies, being a plant with medicinal value, are privately grown in some rural areas in China. The illicit cultivation of poppies poses a huge threat to society, and they cause serious harm to people’s physical and mental health [1]. Anti-drug efforts must be controlled at the source of illegal poppy cultivation, which has become a primary task for drug enforcement agencies. Existing opium poppy detection methods rely on field photography and manual collection, which require lots of manpower and material resources. Furthermore, Poppies are often planted in hidden areas in order to avoid inspection by anti-drug department. Traditional object detectors are inefficient and difficult to detect accurately [2,3]. Moshia et al. [4] conducted an analysis of opium poppy cultivation in Mexico using deep learning techniques. Their study focused solely on distinguishing between corn seedlings and opium poppies.
In recent decades, the rapid development of remote sensing satellites has positioned them as a crucial technology for combating illegal poppy cultivation. Demir et al. [2] have proposed using high-resolution remote sensing satellite images to detect poppy. Their approach has provided a fundamental basis for utilizing remote sensing techniques to detect poppy cultivation in flat regions. Liu et al. [5] collected a remote sensing image dataset of poppies using satellite imagery and employed the SSD model for poppy detection. However, their approach proves ineffective in detecting low-density poppy cultivation in rural areas. There is still illegal poppy cultivation in some rural areas, and it is hard to find by remote sensing satellite because of its scarcity, low density, and interference by other plant species.
Unmanned aerial vehicle (UAV) is more flexible and mobile than remote sensing satellite, and their high-resolution images can help to detect poppies in areas that are hard to see. Zhou et al. [1] employed UAV for monitoring illicit poppy cultivation. Iqbal et al. [6] utilized unmanned systems to estimate the height and yield of cultivated poppy plants. Luo et al. [7] employed a semantic segmentation model for pixel-level extraction of poppy regions and proposed a TransAttention U-Net model. However, poppies at various growth stages bear a striking resemblance to vegetation in terms of shape, rendering existing object detection methods potentially inadequate for accurately identifying poppies.
Preventing illicit poppy cultivation and providing accurate location information to law enforcement personnel still necessitates the design of low-power models suitable for drone platforms. While the aforementioned methods have achieved promising results, existing approaches remain challenging to apply on drone platforms for eradicating illicit poppy cultivation. The pursuit of lightweight and low-power models has been a prominent research focus.
Figure 1 shows some poppy image samples captured by UAV. It can be observed that different growth stages, irregular shapes, low density, and surrounding vegetation interference make it challenging for existing deep learning models to accurately detect poppies. In addition, UAV platforms typically have limited computing power, making it difficult to support the fast inference of convolution neural network (CNN)-based models. Even object detection methods like the YOLO-series models [8,9,10,11,12] struggle to achieve fast detection of poppy targets in UAV imagery. Therefore, designing an object detection model with strong generalization performance, high detection accuracy, and fast inference speed is the goal of this work. This paper introduces a framework for opium poppy detection, named YOLOHLA, which leverages the YOLO model and the newly proposed attention mechanism (High–Low scale attention module, HLA). In order to improve the generalization performance of the detector, we propose a novel training strategy to optimize the model based on repetitive learning (RL). Finally, in order to successfully deploy on low-power UAV platforms, we propose a lightweight YOLOHLA-based structured pruning method. The main contributions are as follows:
(1)
To address the challenge posed by the varying size of opium poppies in different growth stages and its impact on detection performance, we introduce a novel attention model. This model integrates high-resolution and low-resolution features to bolster the model’s localization capabilities.
(2)
We propose a new training strategy to address the problem of poor accuracy of existing models because of occlusion and confused vegetation. Referring to human learning methods, we use a training strategy based on repetitive learning to find the hidden features of hard examples.
(3)
We design a lightweight opium poppy detection model (YOLOHLA-tiny) based on structured model pruning, which can achieve fast inference on embedded device platforms.

2. Related Works

2.1. UAV Remote Sensing

With the development of unmanned aerial vehicle (UAV) remote sensing technology, researchers are using UAV to solve some problems in many fields, e.g., agricultural production, Earth observation, and disaster monitoring [13,14,15]. Feng et al. [16] used UAV remote sensing to achieve urban vegetation mapping. Ye et al. [17] proposed a UAV-based remote sensing image processing method for the recognition of banana fusarium, their method provided guidance for banana cultivation. Alvarez-Vanhard et al. [18] argued that the combination of UAV and remote sensing satellite is potentially valuable for Earth observation. Maes and Steppe [19] gave a detailed analysis of the application of UAV remote sensing technology in precision agricultural production. In the field of plant disease detection, Wang et al. [20] proposed an automatic classification method for cotton root rot disease based on UAV remote sensing images. Pu et al. [21] proposed a UAV platform flow-susceptibility detection and counting model based on YOLO. Their method was successfully applied in practical detection scenarios. The above cases show that UAV remote sensing technology has been widely used in many fields and has achieved excellent effects, especially in the monitoring of plant diseases in precision agriculture. In recent years, with the development of deep learning technology, many object detection algorithms have been used in various fields [22,23,24,25,26,27,28,29,30,31], including smart agriculture, industrial production, medical image processing, remote sensing image processing, and more. With the rapid development of drones in various fields, communication security has gradually become an important research area in drone transmission [32], especially in crucial sectors such as military applications [33].
YOLO family [8,9,10,11,12] is one of the most popular object detection methods. Many scholars improve the detection ability of the YOLO model by designing excellent feature extraction modules and inserting attention mechanisms to meet the needs of different task scenarios. However, it is still necessary to design a professional object detection model for UAV poppy detection.

2.2. Opium Poppy Detection Based on CNN

Some scholars have conducted research related to opium poppy detection. For example, Wang et al. [34] proposed an improved YOLOV3 model to achieve rapid and accurate image processing in low-altitude remote sensing poppy inspection. Zhou et al. [3] proposed an SPP-GIoU-YOLOv3-MN model-based YOLOV3, Spatial Pyramid Pooling (SPP) unit, and Generalized Intersection over Union (GIoU) for UAV opium poppy detection and achieved a better performance than general YOLOv3. Wang et al. [35] proposed an opium poppy image detection system based on YOLOV5s and DenseNet121, which reduced the number of incorrectly detected images by 73.88% and greatly reduced the workload of subsequent manual screening of remote sensing images. Rominger et al. [36] suggested using UAV imagery to study endangered plant species such as opium poppy. They used images with a resolution of 50 m to find marked poppy plants and then used 15 m images to locate them accurately. He et al. [37] proposed to use hyperspectral imaging and spectral matching classification techniques to identify poppies and distinguish them from the surrounding environments. Pérez-Porras et al. [38] proposed an early opium poppy detection method and used YOLOV3, V4, and V5 frameworks as basic models to perform extensive comparative experiments. They concluded that the YOLOV5s model has higher performance in speed and accuracy.

2.3. Model Pruning

Due to the relatively larger number of parameters in CNN compared to traditional methods, it requires a significant amount of computational power, posing a major challenge for low-power and computationally limited UAV platforms. To address this, many researchers have adopted model pruning techniques to reduce the parameter count of CNN models. Li et al. [39] have made pioneering contributions in the field of model pruning. They proposed an efficient CNN pruning method that reduced the computational cost of the ResNet110 by up to 38% while maintaining almost the same model recognition accuracy. Liu et al. [40] rethought model pruning and emphasized the importance of balancing three aspects: large model size, learning importance weights, and the pruned model’s structure. Xia et al. [41] proposed a task-specific pruning model, employing a progressive pruning approach from coarse to fine. Regarding model pruning for UAV platforms, many researchers have also explored this area. For instance, Zhang et al. [42] conducted model pruning based on YOLOv3 and designed a “Narrower, Faster, and Better” inference model specifically tailored for UAV platforms. Recently, Li et al. [43] proposed an efficient UAV tracking system, in which they also employed model pruning techniques to reduce the parameters of the tracking model. The pruned model demonstrated excellent performance across multiple datasets.
Among the aforementioned related works, model pruning methods are highly suitable for low-power embedded platforms. Therefore, in this paper, we also propose a model pruning-based rapid opium poppy object detection method tailored for UAV platforms.

3. Materials and Methods

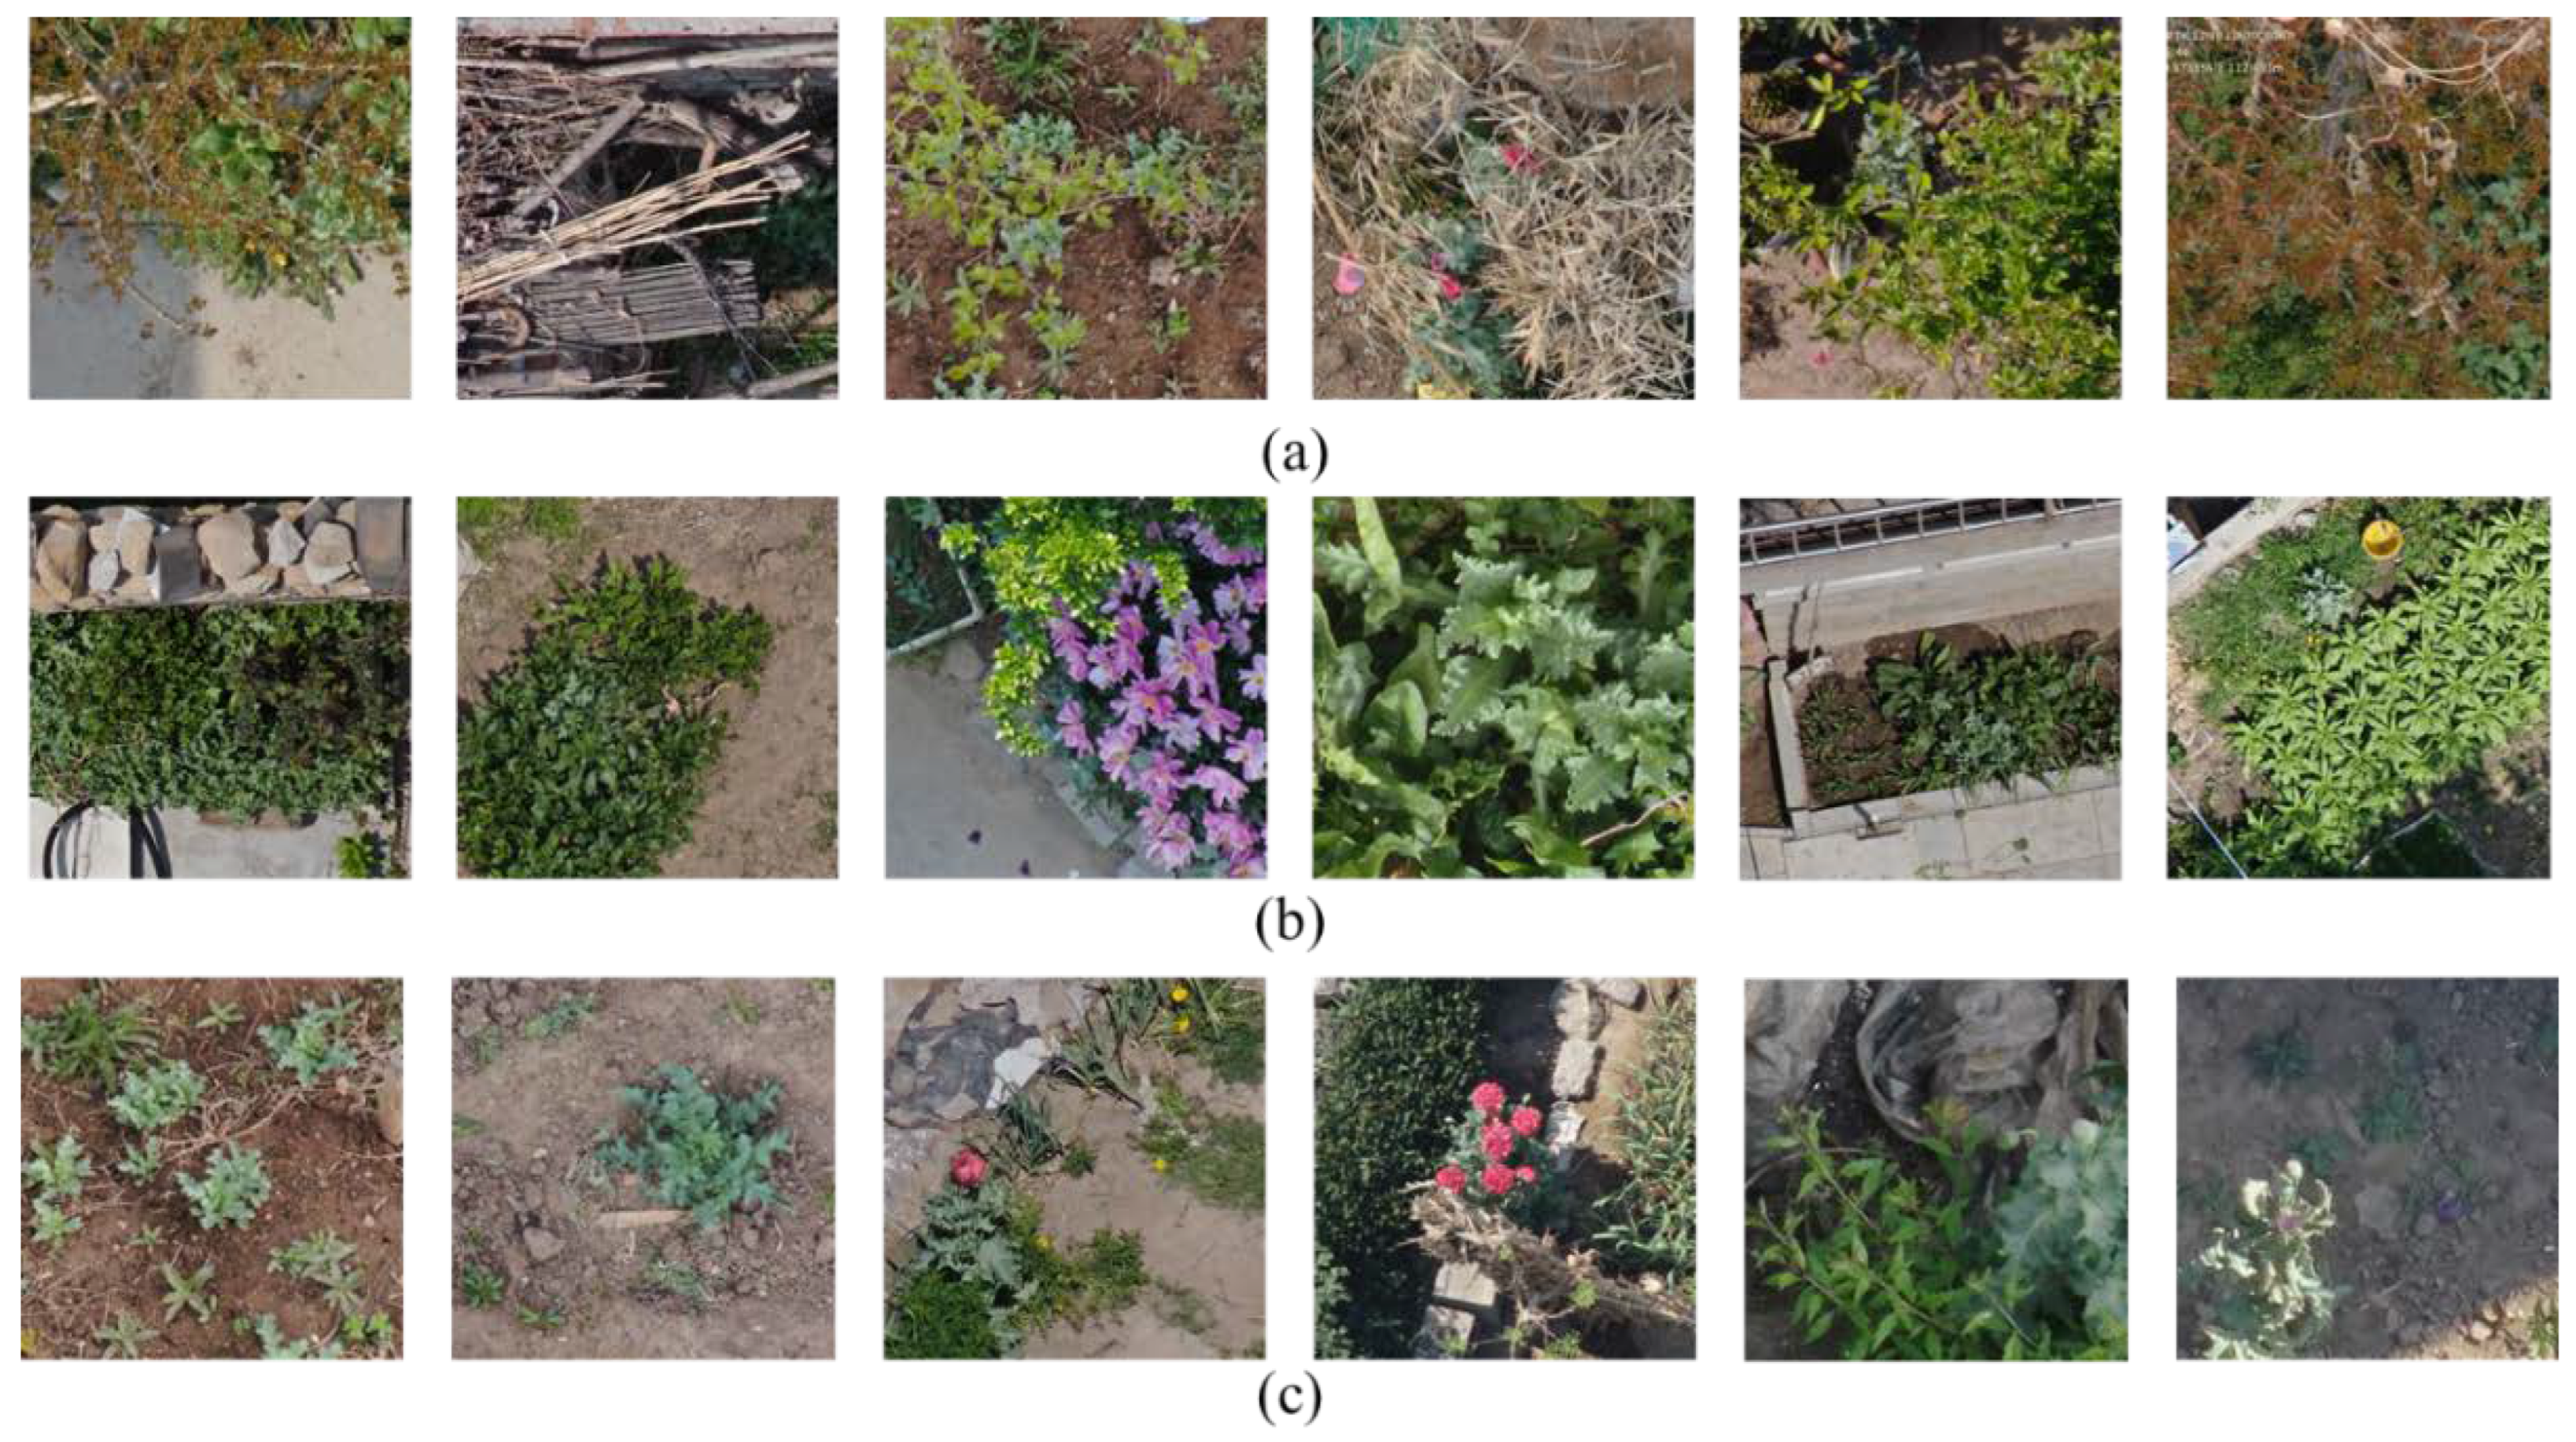
3.1. Image Acquisition and Processing

In this work, images are acquired from Qingdao, Taian, and Yantai in Shandong Province, China. The drone we use is DJL Matrice 300 RTK equipped with an optic camera. The dataset consists of 549 UAV images, each with a size of 5184 × 3888 pixels. Limited by the memory, we use the overlapping segmentation method to segment the original image, and the overlap is 300 pixels, as shown in Figure 2. Each image is divided into small patches, there are a total of 2975 images with the size of 2000 × 2000 pixels. Images are manually labeled with the open-source tool LabelMe [44]. The dataset is divided into training and test sets with proportions of 80% and 20%, respectively. During the training stage, we divide the training set into training and validation parts, and the test set is only used to test the generality of the model.

3.2. HLA Module

It is difficult for UAV to capture a complete image because people usually plant opium poppies in hidden places to avoid detection. Moreover, there are differences in the shape and texture of poppies due to the imaging angles and growth stages. Therefore, existing object detection models are difficult to apply to poppy detection in real scenes.
For this reason, we proposed an HLA module that uses two branches to capture high-scale and low-scale representations, respectively. Figure 3 presents the structure of the proposed HLA module. Given an input feature map x, x R c × w × h , where c is the number of input channels, h and w denote height and width, respectively. We use a convolution layer (Conv) with kernel size of 1 × 1 to capture the high-scale representations ( x h ). For the low-scale features, an average pooling player (POOL) and a Conv module with kernel size of 1 × 1 are used to get x l . Then, x l and x h can be defined as follows:
x h = C o n v ( x ) ,
x l = C o n v ( P O O L ( x ) ) ,
where x h R c × w × h , x l R c × w 2 × h 2 . We then extract the global features of x h and x l by global average pooling (GAP) operation, and use the fully connected layer (FC) to capture the latent representations to generate the feature vectors v h and v l ,
v h = F C ( G P ( x h ) ) ,
v l = F C ( G P ( x l ) ) .
Next, we fuse v h and v l by vector addition operation and use a ReLU ( γ ) module to achieve linear rectification. We can get,
V x , h = γ ( v h + v l ) .
V x , h is fed into two Conv modules (kernel size is 1 × 1) and follows a sigmoid function ( δ ) to generate the importance of each channel. The process is defined as follows,
p = δ ( C o n v ( γ ( C o n v ( V x , h ) ) ) ) .
The importance maps of input features can be obtained,
m a p = x × p .
Finally, the output y is obtained based on the residual connection.
y = m a p + x .
According to the above steps, high-scale features and low-scale features are combined in the importance feature maps, which is of great significance for the model to detect opium poppies with different scales and shapes. The attention mechanism module can be trained to make the regions of interest more prominent, similar to how human eyes tend to focus more on objects of interest. Our attention module achieves this by extracting features from two different scales and compressing them into 1-D feature vectors. The 1-D vectors possess a global receptive field, which is more conducive for CNN to learn the regions of interest. To better illustrate the role of HLA, Figure 4 provides a visual comparison of the input and output feature maps of the HLA module. It can be observed that the HLA module effectively filters out some background noise interference, allowing the model to focus more on the poppy regions.

3.3. YOLOHLA Network

Figure 5 presents the structure of the proposed YOLOHLA. To extract the semantic features of the poppy, we use a backbone to downsample the input images. To meet the multi-scale object detection requirements, the upsampling branch of the Neck module is used to decouple the features extracted by the backbone network. The information obtained from the decoupled features at different scales is obtained by downsampling. We then use three detection heads to generate the detailed coordinates and class confidence.
In this paper, based on the existing works [12], we adopt a similar backbone structure as YOLOV5s. The Backbone is composed of four CBS modules, three RB modules, and an SPPF module. CBS contains a convolution layer, a batch normalization layer, and a SiLU module [45]. RB is composed of multiple CBS modules and residual units, as shown in Figure 6. SPPF contains three max-pooling modules to capture the representation information at three scales, respectively. The neck module consists of two branches, an upsampling branch and a downsampling branch. The former employs two UP modules to upsample features four times, and an HLC module is used to improve the representation ability. HLC includes the proposed HLA module, which will make it easier to extract features at different scales. The features obtained by the first branch in the Neck module are decoupled to obtain the location-sensitive and class-sensitive features. In the second branch, we use three HLC modules to enhance the representation ability of the model. Moreover, two CBS modules are used to downsample these features, in order to obtain information of interested objects. Finally, we use three conventional convolution layers to regress the coordinates and categories of the objects.

3.4. Repetitive Learning

There are different stages of growth for poppies, such as seedling, flowering, and fruiting, resulting in objects with different shape and texture features. Furthermore, poppies are usually mixed with the surrounding vegetation. Therefore, it is difficult for a model trained only once to effectively capture the invariant features of poppies. For this reason, we proposed a novel RL strategy to enhance the learning ability of the model.
The core idea of RL is to keep learning the latent representation of the object and add the hard samples to the training dataset for the next training until the model reaches a best-fitting state. Here, hard samples are found by the model in continuous learning. A hard sample is an image that cannot be accurately detected by detectors. Assuming that the test dataset is C, the training dataset is A, and the validation dataset is B. At the n-th training round, let the training dataset be A n and the validation dataset be B n . The hard samples from the dataset B n will be taken and put into A n at the round n + 1. It is assumed that the hard sample at each round is E n . We then can get the dataset at round n + 1.
A n + 1 = A n + E n ,
B n + 1 = B n   E n .
The accuracy of the detector on the test set C is recorded in each round. In case the accuracy curve reaches saturation or when the validation set B n is below a threshold, training would be stopped. In order to inherit the knowledge that has been learned previously, we use the previous weight as the initial condition for the next training. In the initial state, the ratio of A to B is 2:8. The reason for this is that we want the model to learn and find harder samples in the set (A + B). Therefore, the proportion of the training set A 0 is small. In the experiment, we take 10% of the total number of samples and put them in the training set as hard samples for repetitive learning.
Figure 7 presents the process of the repetitive learning strategy. We need to partition the original dataset into a training dataset and a test dataset, where the ratio is kept small primarily to identify more hard samples from the validation dataset. The first step is model training, from which we obtain trained weights. The second step involves testing the model’s accuracy on the test dataset and recording the results. The third step entails identifying hard samples from the validation dataset. The fourth step is to assess whether the model’s accuracy meets the desired target based on the recorded results from the second step. If not, the hard samples from the validation dataset are added to the training dataset for repetitive learning.
Different from existing methods that train the model multiple times to improve the detection performance, our repetitive learning method requires repartition of the dataset at each training, and some hard samples are taken out of the validation dataset and put into the training dataset. Based on the proposed method, most of the hard samples can be found, and the model is retrained on them to improve the performance of the opium poppy detection task. In order to show the extraction of effective features by our method each time, Figure 8 illustrates the feature responses after multi-round learning. The accuracy of object detection is gradually improved with each round of learning, and the feature response becomes increasingly intense.

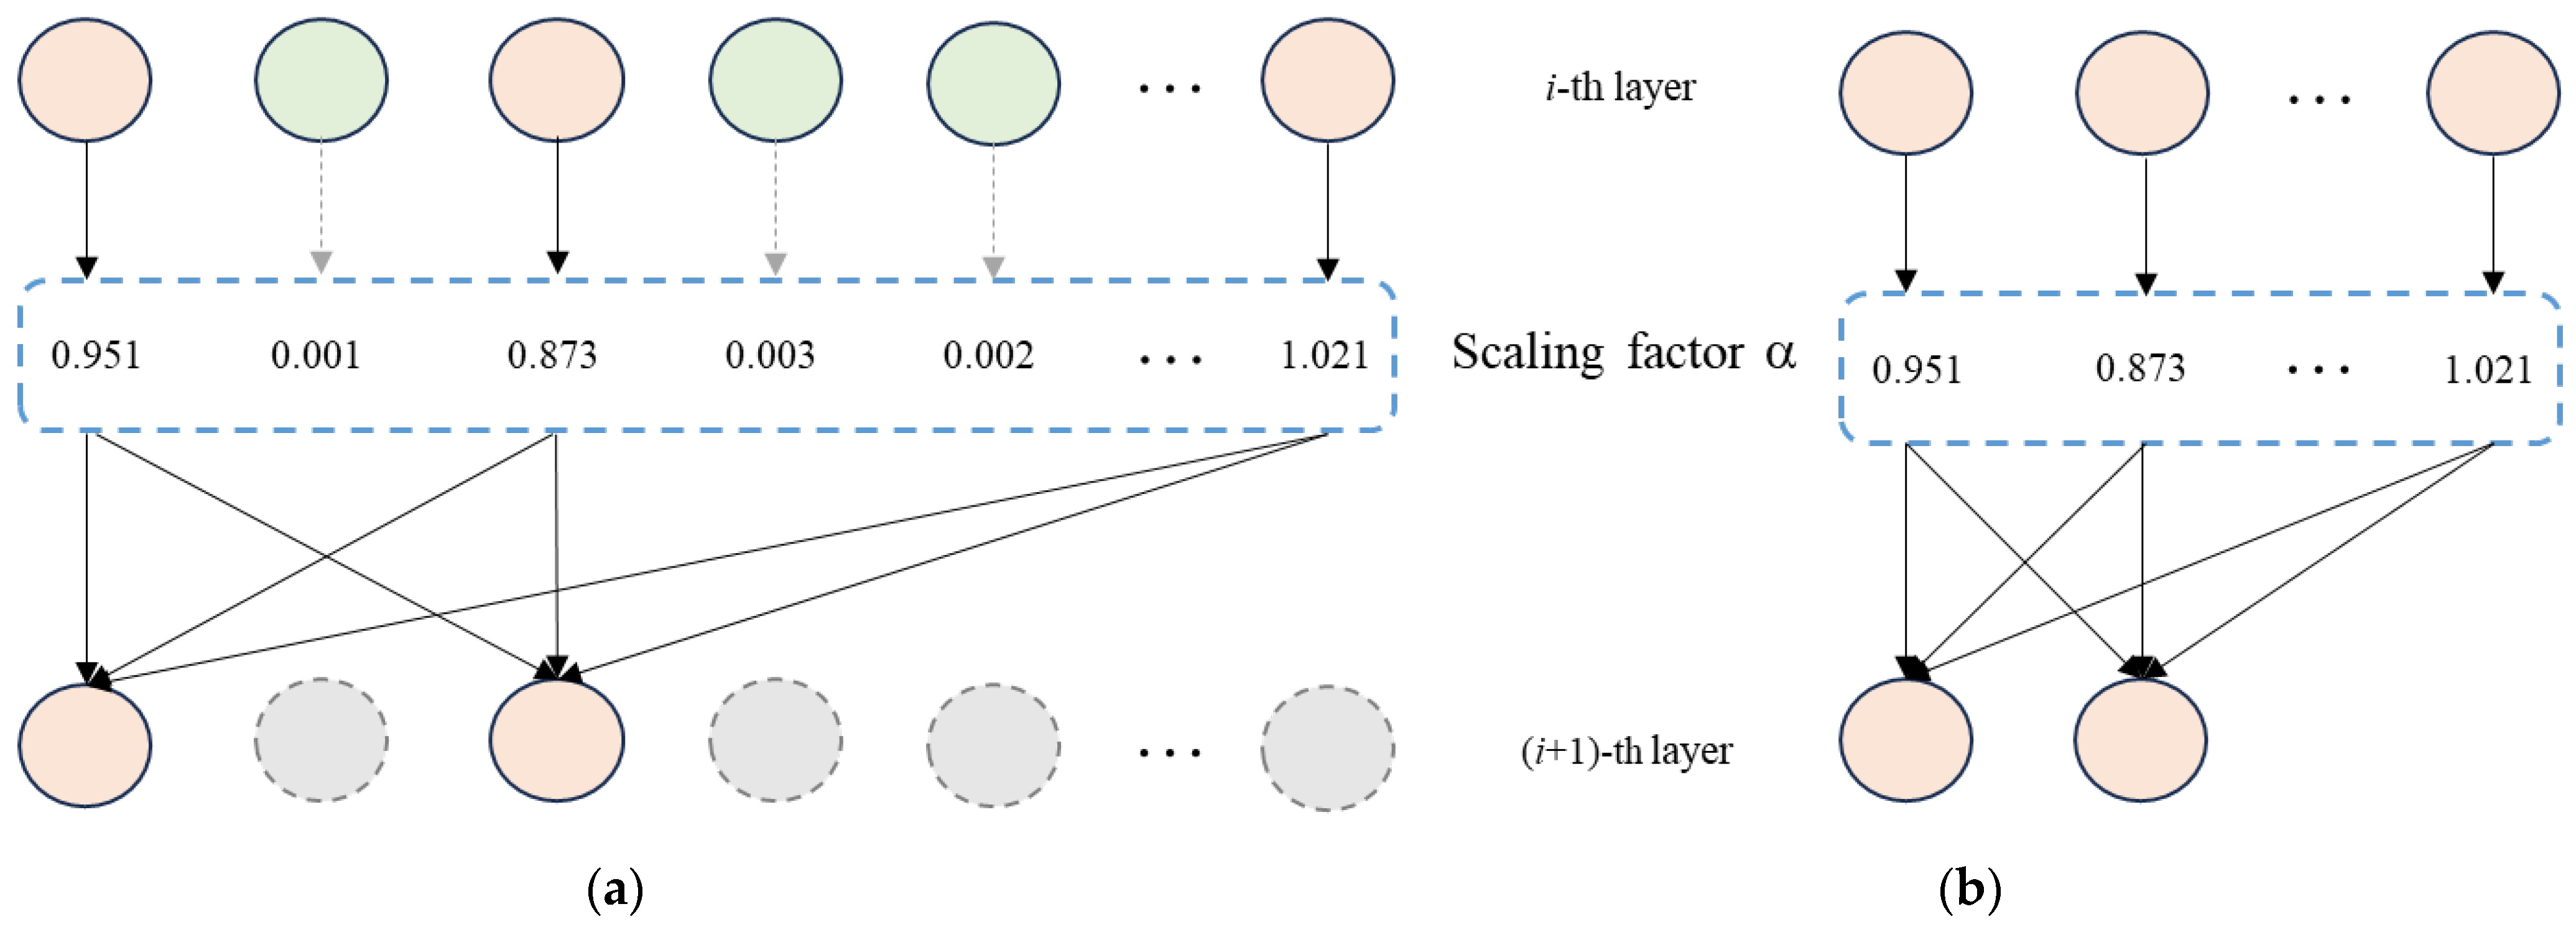
3.5. Structured Pruning of YOLOHLA

On limited computing resources, unmanned platforms face challenges in providing sufficient power to achieve real-time object detection tasks with CNN models. Models obtained by altering filter groups and feature channel numbers in the network are capable of running without the need for specialized algorithms or hardware. This is known as structured model pruning [46]. Based on the structured pruning method, we propose a lightweight model (YOLOHLA-tiny) to achieve rapid poppy detection on low-power platforms.
Sparsity training involves learning channel sparsity in deep neural networks to identify channels that need to be pruned, thereby achieving model pruning. It mainly involves adding regularization constraints to the BN layers to induce channel sparsity in the model. The level of sparsity determines whether the model pruning can achieve the desired results. In other words, the goal is to minimize the accuracy loss in the pruned model. For this purpose, we set a sparsity factor p to control the sparsity of the model. The formula is as follows:
L = l ( w ) + p × s i g n ( γ ) ,
where l ( w ) is the loss function, and s i g n ( γ ) is the constraint. In multiple experiments, we found that setting p = 0.0001 allows the model to achieve the best performance. BN layer can be defined as follows:
X o u t = α × X i n p u t μ σ 2 + ϵ + β ,
where α represents the scaling factor, β represents the shift factor, μ, σ 2 represents the mean and variance, and ε is a constant.
Assuming the initial weights obtained after the first training of the model are denoted as W 0 , according to Equation (11), we can apply L1 regularization to constrain the coefficients of BN layers, resulting in sparse model weights W 0 . Assuming the pruning rate is denoted as pr, the pruning threshold (PI) can be defined as follows:
P I = p r × i = 1 n α ,
where n is the number of channels. From Equation (12), it can be observed that X o u t is positively correlated with the scaling factor α. Therefore, when α approaches zero, it indicates that the corresponding channel can be pruned. After sparse training and under the regularization constraint, we can obtain a model with many scaling factors close to 0. Each channel has a unique scaling factor α, and for channels with α below the threshold PI, pruning is required. Following this principle, we can prune W 0 to obtain W 1 . Due to the accuracy drop caused by the loss of a large number of channels, we employ fine-tuning to optimize the model’s accuracy and obtain the weights W 1 . To achieve a more lightweight model, we typically repeat the above process of pruning the model multiple times.
Figure 9 illustrates the schematic diagram of model pruning; we can prune the channels and weights corresponding to scaling factors that are close to 0. The pruning ratio (pr) is determined based on the sorted order of all scaling factors. If the pr is set to 50%, it means that we will remove the first 50% of the channel connections, including input and output channels, as well as the corresponding convolutional kernels.

4. Experimental Results and Analysis

In this section, the experimental setup of this work is described in Section 4.1, and the evaluation criteria of detectors are presented in Section 4.2. The comparison results are given in Section 4.3 and Section 4.4, respectively. In Section 4.5, we present the experimental results and comparisons on the embedded platform.

4.1. Implementation Details

In this work, the hardware and software configurations for training are as follows:
(1)
Microsoft Corporation, Redmond, Washington, USA, CPU, Inter i7-12700F @ 48G;
(2)
NVIDIA Corporation, Santa Clara, California, USA, graphics card, GeForce RTX 3090 @ 24GB GPU;
(3)
operating system, 64-bit Ubuntu 20.04.2 LTS;
(4)
CUDA version 11.6;
(5)
Pytorch version 1.8.2.
In order to ensure the fairness of the experiment, all models are trained and tested on the same equipment, and the training strategy is the same for all models. The input size of the images is resized to 640 × 640 pixels, the training epoch is 300, and the batch size is 32. In experiments with repetitive learning, the initial learning rate is 20% of the previous one, and the minimum learning rate is 0.0001.
k = min ( 0.2 n 1 × 0.01 ,   0.0001 ) ,
where n is the number of rounds of repetitive learning.

4.2. Metrics

To evaluate the performance of the model, precision (P), recall (R), mean average precision (mAP) and F1 score (F1) are used as evaluation metrics. Their expressions are as follows:
P = TP TP + FP   ,
R = TP TP + FN     ,
A P = 0 1 P ( R ) dR   ,
m A P = 1 C i = 1 C A P i   ,
F 1 = 2 PR P + R ,
where TP represents positive and positive samples, FP represents negative and positive samples, FN represents negative and negative samples, i denotes the i-th category, and C is the number of classes. For model inference speed, we use frames per second (FPS) to evaluate the performance of the model.

4.3. Comparison of Different Detectors

In this section, we perform comparative experiments based on the proposed method, and existing popular detectors includes YOLOV4-tiny [11], YOLOV5s [12], YOLOV6s [47], YOLO7-tiny [48], YOLOV8 (https://github.com/ultralytics/ultralytics, accessed on 14 April 2023), PP-PicoDet [49], NanoDet (https://github.com/RangiLyu/nanodet, accessed on 21 February 2021), DETR [41], Faster R-CNN [50], and RetinaNet [51], to evaluate the effectiveness of the proposed method.
Table 1 presents experimental results with different detectors; the proposed method has the best mAP for opium poppy detection. The F1 value and mAP value of YOLOHLA are 0.882 and 0.855, respectively. Compared with YOLOV6-tiny, the precision and mAP are both increased by 0.9%, but the F1 score is reduced by 1.6%. In terms of the inference time, our method is faster than YOLOV6-tiny. It is worth noting that we adopt YOLOV5s as the baseline, but our YOLOHLA is much better than YOLOV5s. The proposed RL method further improves the detection accuracy of the model and achieves the best accuracy in all metrics compared with YOLOHLA.
Figure 10 shows the Precision and Recall (PR) curves of different methods. The proposed HLA significantly improves the recall and precision for poppy detection. With the RL training strategy, the performance of the YOLOHLA can be improved further. This also shows that our method has better detection performance. Figure 11 illustrates the recognition effects comparison with different detectors. We can find that the existing detectors have a poor performance compared with our model. There is always a false detection in each of them.

4.4. Comparison of Model Pruning

Figure 12 shows the comparison of each convolutional layer before and after pruning. Due to the YOLOHLA model having fewer channels in the shallow convolution layers, each channel contributes significantly to the model. Therefore, the number of channels pruned in the shallow layers is almost negligible. For deeper convolutional layers, they possess a relatively higher number of channels, serving as a primary source of parameter redundancy. Thus, a larger pruning ratio is set for these layers. According to Figure 12, it can be observed that after pruning, some convolutional channels in the model are noticeably removed.
Table 2 presents the result comparison with different pruning methods. It can be observed that after pruning 50% of the channels, our model reduced the parameter by 62.5%, with only a slight decrease of 0.8% in mAP. The pruned YOLOHLA achieved a 41% increase in speed. We also compared the structured pruning method [46] with two popular pruning models Torch pruning [39] and DepGraph [52]. Based on the experimental results in Table 2, it can be observed that the structured pruning approach we adopted has better performance in pruning the YOLOHLA model. Our lightweight model effectively reduces the parameters while ensuring detection accuracy. Figure 13 provides a visual comparison of the three pruning methods. It can be observed that YOLOHLA-tiny still achieves good detection results for poppies in some occluded or cluttered areas.

4.5. Results on Embedded Device

YOLOHLA-Tiny is a poppy object detection model designed for UAV platforms. Therefore, we further validated its inference performance on embedded computing platforms. We used NVIDIA Jetson Orin (https://www.nvidia.cn/autonomous-machines/embedded-systems/jetson-orin/, accessed on 14 April 2023) as the experimental platform and conducted tests to compare YOLOHLA, YOLOHLA-Tiny, and other pruned models, as shown in Table 3. Our method achieved a detection speed of over 170 fps, resulting in a 34.7% increase in model inference speed compared to before pruning. When compared with the Torch pruning method, our detection speed improved by more than two times. The above results indicate that our YOLOHLA-Tiny model retains a significant advantage in poppy detection on embedded platforms.

5. Ablation Studies

5.1. Impact of Attention Mechanism

To estimate the validity and feasibility of the proposed HLA module, multiple attention models are used for comparative experiments, including squeeze and excitation (SE) [53], coordinate attention (CA) [54], efficient channel attention (ECA) [55], and convolutional block attention module (CBAM) [56].
We first compared the performances based on YOLOV5s and SE, CA, ECA and CBAM. Table 4 reports the results of different attention modules on the UAV remote sensing image dataset. Our method has the highest mAP among all attention modules, which is 2.5% higher than YOLOV5s + CA. Although the F1 score of our method is slightly lower than the SE module, our method has a lower level of complexity.
Table 5 presents the comparison results based on YOLOV6-Tiny. It should be noted that in the experiment, we replaced the RepBlock of YOLOV6 [46] with the proposed HLC module, and the others remained unchanged. Our method achieves the best results in both F1 and mAP metrics. Our model is slightly slower than SE, but our method improves F1 and mAP by 1.4% and 1.2%, respectively.

5.2. Impact of Repetitive Learning

Repetitive learning involves the iterative process of identifying challenging samples through continuous learning and optimizing the model based on prior knowledge. In order to validate the effectiveness of the proposed training strategy, we verify the effect in two aspects. The first one randomly divides the dataset (it contains set A and set B) to train the model and test the performance on the test set. The second is to find the hard samples, but without prior knowledge. Figure 14 illustrates the comparison results of the two methods (Orange and Blue) and our method (Green). Four models are used to verify the performance of repetitive learning. Our method shows a significant improvement in performance compared with conventional training methods. Especially, our training strategy has significant advantages over the YOLOV5s and YOLOV6-tiny models. Figure 15 illustrates the visual ablation comparison with our methods. YOLOV5s with HLA and RL method performs a better performance than YOLOV5s. For the case that has a similar texture and color, using the proposed RL strategy can recognize all the objects.

5.3. Impact of Pruning Ratio

The pruning ratio pr is a crucial parameter that controls model pruning. A larger value of pr indicates that the model will discard more convolutional kernels and parameters, significantly reducing the model’s parameter count. However, it may also impact the detection performance of the model. Table 6 shows the impact of different values of pr on model accuracy and inference speed. It can be observed that when pr = 50%, the parameters of model reduce by more than half, but the detection accuracy decreases by almost half as well. By fine-tuning and retraining the model, the detection accuracy can be restored to a level similar to that before pruning, but the inference speed improves by 23% compared to the original model.

6. Discussions

6.1. Comparisons on VisDrone2019 Dataset

To better verify the effectiveness of our proposed method, we conducted comparative experiments on VisDrone2019 dataset [57]. The VisDrone2019 dataset primarily consists of visible light imagery collected from drone platforms and comprises 10 different categories. Table 7 presents the comparative results of different detection models. It is important to note that we used lightweight models, which resulted in relatively lower average accuracy across the 10 categories. We can observe that the method proposed in this paper remains competitive, with the average detection accuracy for the 10 categories also outperforming existing methods.

6.2. Limitations

We introduce a concept of re-learning to enhance the detection accuracy of the model; however, this approach has certain limitations. Firstly, our method requires iterative training of object detection models, which consumes a considerable amount of time compared to end-to-end training models. Additionally, in real-world scenarios, drones capture images at large scales with wide coverage, where the scale of poppy targets could be relatively small. This could affect the model’s detection performance.

7. Conclusions

In this paper, we proposed a YOLO-based model with HLA for UAV remote sensing image opium poppy detection. A new attention module (HLA) is proposed that combines high-scale and low-scale features to enhance the ability of detector. Furthermore, in order to enhance the learning ability of the model, we propose a repetitive learning strategy to train the model, through continuous learning to accumulate knowledge and find the hard samples and then repeating learning on the hard samples to enhance the representation ability. Furthermore, we employ structured pruning methods to prune the proposed YOLOHLA model. By comparing with existing methods, our pruned YOLOHLA model can achieve faster and more accurate poppy detection on an embedded platform.
In order to validate the performance of the proposed method, we collect a poppy detection dataset from UAV remote sensing imagery, which contains many hard samples, such as poppies in different growth periods, occlusions, and so on. Our method achieves an F1 score of 0.855 and a mAP of 0.882. The proposed method surpasses the existing detectors, such as YOLOV5s and YOLOV6-tiny, and achieves state-of-the-art performance on the opium poppy dataset. We conducted tests on a low-power embedded computing platform, and after model pruning, our method achieved an inference speed of 172 fps with 0.834 mAP. Extensive experiments show that our method is more suitable for opium poppy detection.
Our approach also has some limitations, especially in the detection of large-scale drone images. In future work, we will enhance the inference efficiency and detection accuracy of the proposed model for detecting poppies in large-scale images. We aim to migrate the algorithm to embedded devices, enabling real-time online poppy detection and recognition on drone platforms. Furthermore, we will also explore by applying our method to the detection and recognition of other crops, such as apples, oranges, and corn.

Author Contributions

Z.Z.: Conceptualization, Resources, Project administration, Funding acquisition. W.X.: Methodology, Software, Writing—original draft. G.X.: Resources, Software, Writing—original draft. S.X.: Methodology, Writing—original draft, Writing—review & editing. All authors have read and agreed to the published version of the manuscript.

Funding

This research was funded by the National Key R&D Program of China (2022YFB3902800), the National Natural Science Foundation of China (No. 61901307), Scientific Research Foundation for Doctoral Program of Hubei University of Technology (Nos. XJ2022005901, BSQD2020054).

Data Availability Statement

The author is not authorized to disclose the data.

Acknowledgments

The authors would like to thank the Shandong GEO-Surveying & Mapping Institute for providing the data used in this paper.

Conflicts of Interest

The authors declare that they have no known competing financial interest or personal relationship that could have appeared to influence the work reported in this paper.

References

  1. Bajpai, S.; Gupta, A.P.; Gupta, M.M.; Kumar, S. Inter-relationships between morphine and codeine in the Indian genetic resources of opium poppy. J. Herbs Spices Med. Plants. 2001, 8, 75–81. [Google Scholar] [CrossRef]
  2. Demir, S.; Başayiğit, L. Determination of opium poppy (Papaver somniferum) parcels using high-resolution satellite imagery. J. Indian Soc. Remote Sens. 2019, 47, 977–987. [Google Scholar] [CrossRef]
  3. Zhou, J.; Tian, Y.; Yuan, C.; Yin, K.; Yang, G.; Wen, M. Improved UAV opium poppy detection using an updated YOLOv3 model. Sensors 2019, 19, 4851. [Google Scholar] [CrossRef]
  4. Moshia, M.E.; Newete, S.W. Mexican poppy (Argemone mexicana) control in cornfield using deep learning neural networks: A perspective. Acta Agric. Scand. Sect. B—Soil. Plant Science 2019, 69, 228–234. [Google Scholar] [CrossRef]
  5. Liu, X.; Tian, Y.; Yuan, C.; Zhang, F.; Yang, G. Opium Poppy Detection Using Deep Learning. Remote Sens. 2018, 10, 1886. [Google Scholar] [CrossRef]
  6. Iqbal, F.; Lucieer, A.; Barry, K.; Wells, R. Poppy Crop Height and Capsule Volume Estimation from a Single UAS Flight. Remote Sens. 2017, 9, 647. [Google Scholar] [CrossRef]
  7. Luo, Z.; Yang, W.; Guo, R.; Yuan, Y. TransAttention U-Net for Semantic Segmentation of Poppy. Electronics 2023, 12, 487. [Google Scholar] [CrossRef]
  8. Redmon, J.; Divvala, S.; Girshick, R.; Farhadi, A. You only look once: Unified, real-time object detection. In Proceedings of the 2016 IEEE Conference on Computer Vision and Pattern Recognition (CVPR), Las Vegas, NV, USA, 27–30 June 2016; pp. 779–788. [Google Scholar]
  9. Redmon, J.; Farhadi, A. YOLO9000: Better, faster, stronger. In Proceedings of the IEEE Conference on Computer Vision and Pattern Recognition (CVPR), Honolulu, HI, USA, 21–26 July 2017; pp. 7263–7271. [Google Scholar]
  10. Redmon, J.; Farhadi, A. Yolov3: An incremental improvement. arXiv 2018, arXiv:1804.02767. [Google Scholar]
  11. Bochkovskiy, A.; Wang, C.Y.; Liao, H.Y.M. Yolov4: Optimal speed and accuracy of object detection. arXiv 2020, arXiv:2004.10934. [Google Scholar]
  12. Jocher, G.; Stoken, A.; Borovec, J.; NanoCode012; ChristopherSTAN; Changyu, L.; Laughing; Tkianai; Hogan, A.; Lorenzomammana; et al. ultralytics/yolov5, version 3.1.; Bug Fixes and Performance Improvements; Zenodo: Geneve, Switzerland, 2020.
  13. Tijtgat, N.; Van Ranst, W.; Goedeme, T.; Volckaert, B.; De Turck, F. Embedded real-time object detection for a UAV warning system. In Proceedings of the IEEE International Conference on Computer Vision (ICCV), Venice, Italy, 22–29 October 2017; pp. 2110–2118. [Google Scholar]
  14. Bejiga, M.B.; Zeggada, A.; Melgani, F. Convolutional neural networks for near real-time object detection from UAV imagery in avalanche search and rescue operations. In Proceedings of the 2016 IEEE International Geoscience and Remote Sensing Symposium (IGARSS), Beijing, China, 10–15 July 2016; pp. 693–696. [Google Scholar]
  15. Bao, W.; Zhu, Z.; Hu, G.; Zhou, X.; Zhang, D.; Yang, X. UAV remote sensing detection of tea leaf blight based on DDMA-YOLO. Comp. Electron. Agric. 2023, 205, 107637. [Google Scholar] [CrossRef]
  16. Feng, Q.; Liu, J.; Gong, J. UAV remote sensing for urban vegetation mapping using random forest and texture analysis. Remote Sens. 2015, 7, 1074–1094. [Google Scholar] [CrossRef]
  17. Ye, H.; Huang, W.; Huang, S.; Cui, B.; Dong, Y.; Guo, A.; Ren, Y.; Jin, Y. Recognition of banana fusarium wilt based on UAV remote sensing. Remote Sens. 2020, 12, 938. [Google Scholar] [CrossRef]
  18. Alvarez-Vanhard, E.; Corpetti, T.; Houet, T. UAV & satellite synergies for optical remote sensing applications: A literature review. Sci. Remote Sens. 2021, 3, 100019. [Google Scholar]
  19. Maes, W.H.; Steppe, K. Perspectives for remote sensing with unmanned aerial vehicles in precision agriculture. Trends Plant. Sci. 2019, 24, 152–164. [Google Scholar]
  20. Wang, T.; Thomasson, J.A.; Yang, C.; Isakeit, T.; Nichols, R.L. Automatic classification of cotton root rot disease based on UAV remote sensing. Remote Sens. 2020, 12, 1310. [Google Scholar] [CrossRef]
  21. Pu, H.; Chen, X.; Yang, Y.; Tang, R.; Luo, J.; Wang, Y.; Mu, J. Tassel-YOLO: A New High-Precision and Real-Time Method for Maize Tassel Detection and Counting Based on UAV Aerial Images. Drones 2023, 7, 492. [Google Scholar] [CrossRef]
  22. Mao, H.; Yao, S.; Tang, T.; Li, B.; Yao, J.; Wang, Y. Towards real-time object detection on embedded systems. IEEE Trans. Emerg. Top. Comput. 2016, 6, 417–431. [Google Scholar] [CrossRef]
  23. Xiang, S.; Liang, Q.K.; Fang, L. Discrete Wavelet Transform-Based Gaussian Mixture Model for Remote Sensing Image Compression. IEEE Trans. Geosci. Remote Sens. 2023, 61, 3000112. [Google Scholar] [CrossRef]
  24. Xiang, S.; Liang, Q.K. Remote sensing image compression with long-range convolution and improved non-local attention model. Signal Process. 2023, 209, 109005. [Google Scholar] [CrossRef]
  25. Gou, G.; Wang, X.; Sui, H.; Wang, S.; Zhang, H.; Li, J. OwlFusion: Depth-Only Onboard Real-Time 3D Reconstruction of Scalable Scenes for Fast-Moving MAV. Drones 2023, 7, 358. [Google Scholar] [CrossRef]
  26. Wu, X.; Sahoo, D.; Hoi, S.C.H. Recent Advances in Deep Learning for Object Detection. Neurocomputing 2020, 396, 39–64. [Google Scholar] [CrossRef]
  27. Chen, S.; Zou, X.; Zhou, X.; Xiang, Y.; Wu, M. Study on fusion clustering and improved YOLOv5 algorithm based on multiple occlusion of Camellia oleifera fruit. Comp. Electron. Agric. 2023, 206, 107706. [Google Scholar] [CrossRef]
  28. Liang, Q.K.; Xiang, S.; Hu, Y.; Coppola, G.; Zhang, D.; Sun, W. PD2SE-Net: Computer-assisted plant disease diagnosis and severity estimation network. Comp. Electron. Agric. 2019, 157, 518–529. [Google Scholar] [CrossRef]
  29. Wu, Q.; Liu, Y.; Li, Q.; Jin, S.; Li, F. The application of deep learning in computer vision. In Proceedings of the 2017 Chinese Automation Congress (CAC), Jinan, China, 20–22 October 2017; pp. 6522–6527. [Google Scholar]
  30. Gu, J.; Wang, Z.; Kuen, J.; Ma, L.; Shahroudy, A.; Shuai, B.; Liu, T.; Wang, X.; Wang, G.; Cai, J.; et al. Recent advances in convolutional neural networks. Pattern Recognit. 2018, 77, 354–377. [Google Scholar]
  31. Reckling, W.; Mitasova, H.; Wegmann, K.; Kauffman, G.; Reid, R. Efficient Drone-Based Rare Plant Monitoring Using a Species Distribution Model and AI-Based Object Detection. Drones 2021, 5, 110. [Google Scholar] [CrossRef]
  32. Krichen, M.; Adoni, W.Y.; Mihoub, A.; Alzahrani, M.Y.; Nahhal, T. Security Challenges for Drone Communications: Possible Threats, Attacks and Countermeasures. In Proceedings of the 2022 2nd International Conference of Smart Systems and Emerging Technologies (SMARTTECH), Riyadh, Saudi Arabia, 9–11 May 2022; pp. 184–189. [Google Scholar]
  33. Ko, Y.; Kim, J.; Duguma, D.G.; Astillo, P.V.; You, I.; Pau, G. Drone Secure Communication Protocol for Future Sensitive Applications in Military Zone. Sensors 2021, 21, 2057. [Google Scholar] [CrossRef] [PubMed]
  34. Wang, C.; Wang, Q.; Wu, H.; Zhao, C.; Teng, G.; Li, J. Low-altitude remote sensing opium poppy image detection based on modified YOLOv3. Remote Sens. 2021, 13, 2130. [Google Scholar] [CrossRef]
  35. Wang, Q.; Wang, C.; Wu, H.; Zhao, C.; Teng, G.; Yu, Y.; Zhu, H. A Two-Stage Low-Altitude Remote Sensing Papaver Somniferum Image Detection System Based on YOLOv5s+ DenseNet121. Remote Sens. 2022, 14, 1834. [Google Scholar] [CrossRef]
  36. Rominger, K.; Meyer, S.E. Application of UAV-based methodology for census of an endangered plant species in a fragile habitat. Remote Sens. 2019, 11, 719. [Google Scholar] [CrossRef]
  37. He, Q.; Zhang, Y.; Liang, L. Identification of poppy by spectral matching classification. Optik 2020, 200, 163445. [Google Scholar] [CrossRef]
  38. Pérez-Porras, F.J.; Torres-Sánchez, J.; López-Granados, F.; Mesas-Carrascosa, F.J. Early and on-ground image-based detection of poppy (Papaver rhoeas) in wheat using YOLO architectures. Weed Sci. 2023, 71, 50–58. [Google Scholar] [CrossRef]
  39. Li, H.; Kadav, A.; Durdanovic, L.; Samet, H.; Graf, H.P. Pruning Filters for Efficient ConvNets. In Proceedings of the 5th International Conference on Learning Representations (ICLR), Toulon, France, 24–26 April 2017. [Google Scholar]
  40. Liu, Z.; Sun, M.; Zhou, T.; Huang, G. Trevor Darrell, Rethinking the Value of Network Pruning. arXiv 2018, arXiv:1810.05270. [Google Scholar]
  41. Xia, M.; Zhong, Z.; Chen, D. Structured Pruning Learns Compact and Accurate Models. arXiv 2022, arXiv:2204.00408. [Google Scholar]
  42. Zhang, P.; Zhong, Y.; Li, X. SlimYOLOv3: Narrower, Faster and Better for Real-Time UAV Applications. In Proceedings of the IEEE/CVF International Conference on Computer Vision Workshop, Seoul, Republic of Korea, 27–28 October 2019. [Google Scholar]
  43. Li, J.; Zhang, K.; Gao, Z.; Yang, L.; Zhuo, L. SiamPRA: An Effective Network for UAV Visual Tracking. Electronics 2023, 12, 2374. [Google Scholar] [CrossRef]
  44. Russell, B.C.; Torralba, A.; Murphy, K.P.; Freeman, W.T. LabelMe: A database and web-based tool for image. Int. J. Comput. Vis. 2005, 77, 157–173. [Google Scholar] [CrossRef]
  45. Elfwing, S.; Uchibe, E.; Doya, K. Sigmoid-weighted linear units for neural network function approximation in reinforcement learning. Neural Netw. 2018, 107, 3–11. [Google Scholar] [CrossRef] [PubMed]
  46. Liu, Z.; Li, J.; Shen, Z.; Huang, G.; Yan, S.; Zhang, C. Learning Efficient Convolutional Networks through Network Slimming. In Proceedings of the IEEE International Conference on Computer Vision (ICCV), Venice, Italy, 22–29 October 2017; pp. 2755–2763. [Google Scholar]
  47. Li, C.; Li, L.; Jiang, H.; Weng, K.; Geng, Y.; Li, L.; Ke, Z.; Li, Q.; Cheng, M.; Nie, W.; et al. YOLOv6: A single-stage object detection framework for industrial applications. arXiv 2022, arXiv:2209.02976. [Google Scholar]
  48. Wang, C.Y.; Bochkovskiy, A.; Liao, H.Y.M. YOLOv7: Trainable bag-of-freebies sets new state-of-the-art for real-time object detectors. arXiv 2022, arXiv:2207.02696. [Google Scholar]
  49. Yu, G.; Chang, Q.; Lv, W.; Xu, C.; Cui, C.; Ji, W.; Dang, Q.; Deng, K.; Wang, G.; Du, Y.; et al. PP-PicoDet: A Better Real-Time Object Detector on Mobile Devices. arXiv 2021, arXiv:2111.00902. [Google Scholar]
  50. Ren, S.Q.; He, K.M.; Girshick, R.; Sun, J. Faster R-CNN: Towards Real-Time Object Detection with Region Proposal Networks. IEEE Trans. Pattern Anal. Mach. Intell 2017, 39, 1137–1149. [Google Scholar] [CrossRef]
  51. Zhang, H.; Chang, H.; Ma, B.; Shan, S.; Chen, X. Cascade retinanet: Maintaining consistency for single-stage object detection. arXiv 2019, arXiv:1907.06881. [Google Scholar]
  52. Fang, G.; Ma, X.; Song, M.; Mi, M.B.; Wang, X. DepGraph: Towards Any Structural Pruning. In Proceedings of the IEEE/CVF Conference on Computer Vision and Pattern Recognition (CVPR), Vancouver, BC, Canada, 17–24 June 2023; pp. 16091–16101. [Google Scholar]
  53. Hu, J.; Shen, L.; Sun, G. Squeeze-and-excitation networks. In Proceedings of the 2018 IEEE/CVF Conference on Computer Vision and Pattern Recognition, Salt Lake City, UT, USA, 18–23 June 2018; pp. 7132–7141. [Google Scholar]
  54. Hou, Q.; Zhou, D.; Feng, J. Coordinate attention for efficient mobile network design. In Proceedings of the 2021 IEEE/CVF Conference on Computer Vision and Pattern Recognition (CVPR), Nashville, TN, USA, 20–25 June 2021; pp. 13713–13722. [Google Scholar]
  55. Wang, Q.; Wu, B.; Zhu, P.; Li, P.; Zuo, W.; Hu, Q. ECA-Net: Efficient channel attention for deep convolutional neural networks. In Proceedings of the 2020 IEEE/CVF Conference on Computer Vision and Pattern Recognition (CVPR), Seattle, WA, USA, 13–19 June 2020; pp. 11534–11542. [Google Scholar]
  56. Woo, S.; Park, J.; Lee, J.Y.; Kweon, I.S. Cbam: Convolutional block attention module. In Proceedings of the European Conference on Computer Vision(ECCV), Munich, Germany, 8–14 September 2018; pp. 3–19. [Google Scholar]
  57. Zhu, P.; Wen, L.; Du, D.; Bian, X.; Fan, H.; Hu, Q.; Ling, H. Detection and Tracking Meet Drones Challenge. IEEE Trans. Pattern Anal. Mach. Intell. 2022, 44, 7380–7399. [Google Scholar] [CrossRef] [PubMed]
Figure 1. Samples of opium poppies. (a) occlusion, (b) confused vegetation, (c) different growth periods.
Drones 07 00559 g001
Figure 2. Data collection and processing. The numbers 1–6 indicate the index of the block.
Drones 07 00559 g002
Figure 3. Structure of the proposed HLA module.
Drones 07 00559 g003
Figure 4. Visualization comparison of feature maps for HLA input and output. The first row displays the input feature maps, while the second row showcases the visualized feature maps extracted by HLA.
Drones 07 00559 g004
Figure 5. The architecture of the proposed YOLOHLA. “↑” denotes the upsampling operation with the nearest interpolation, “↓” is the downsampling operation with convolution layer.
Drones 07 00559 g005
Figure 6. Components of each module. “Conv” denotes the convolution layer, “BN” is the batch normalization, “SiLU” is the activation layer, “Concat” is the concatenation operation, and ⊕ is the addition operation.
Drones 07 00559 g006
Figure 7. Process of repetitive learning. The yellow circles represent missed detection objects, and the red circles represent false detection objects.
Drones 07 00559 g007
Figure 8. Visual samples. The first, third, and fifth rows represent the feature response. The second, fourth, and sixth rows represent the detection results. The yellow circles represent missed detection objects.
Drones 07 00559 g008
Figure 9. Channel pruning process. The dashed lines represent channels with lower scaling factors, which will be discarded. (a) The sparsified model after sparse training. (b) The pruned model.
Drones 07 00559 g009
Figure 10. Precision and Recall curves.
Drones 07 00559 g010
Figure 11. Visualization results with different detectors. The dashed yellow circles represent the mis-detected objects, and the solid yellow circles represent the missed objects. (a) YOLOV5s. (b) YOLOV6-tiny. (c) YOLOV7-tiny. (d) YOLOHLA.
Drones 07 00559 g011
Figure 12. Comparison of each convolutional layer before and after pruning. The X-axis shows the index of the convolution, and the Y-axis shows the number of channels of the convolution.
Drones 07 00559 g012
Figure 13. Visualization comparison of object detection results after pruning. (a) Torch Pruning. (b) DepGraph. (c) Our method. The orange circles represent falsely detected objects. The yellow circle represents missed detection, and the orange circle represents false detection.
Drones 07 00559 g013
Figure 14. Results from different baselines based on repetitive learning. Orange curve denotes the first method that divided dataset randomly. Blue curve denotes the second method that find the hard samples, but without prior knowledge. Green curve is the proposed RL method.
Drones 07 00559 g014
Figure 15. Visual comparison (YOLOV5s is the baseline). (a) YOLOV5s. (b) YOLOV5s + HLA. (c) YOLOV5s + HLA + RL.
Drones 07 00559 g015
Table 1. Comparison results with different detectors on the test dataset (Input size 640 × 640).
ModelFLOPsParam.FPSPRF1mAP
YOLOV4-tiny20.6 G8.69 M2170.8400.7490.7920.837
YOLOV5s15.9 G6.70 M2940.7850.7790.7820.818
YOLOV6-tiny36.5 G14.94 M1690.8820.8610.8710.873
YOLOV7-tiny13.2 G5.74 M3700.7400.6990.720 0.755
YOLOV8s28.6 G10.65 M1450.8250.7520.7720.831
PP-PicoDet8.3 G5.76 M2510.8080.7340.7690.792
NanoDet3.4 G7.5 M1960.7840.7440.7630.714
DETR100.9 G35.04 M1170.8120.7630.7870.852
Faster R-CNN81.9 G36.13 M400.8240.7920.8080.842
RetinaNet91.0 G41.13 M410.8130.8280.8200.795
YOLOHLA13.8 G5.72 M3230.8390.7700.8030.842
YOLOHLA + RL13.8 G5.72 M3230.8910.8220.8550.882
Table 2. Comparative results with different pruning methods. (“Model size” refers to the number of bytes occupied by the model).
MethodsPRF1mAPFPSModel Size
YOLOHLA0.8390.7700.8030.84232320.8 MB
Torch pruning 0.7850.7150.7480.80333315.9 MB
DepGraph 0.7680.6920.7280.76638410.2 MB
YOLOHLA-Tiny0.8430.7310.7830.8344567.8 MB
Table 3. Comparison results with different pruning methods on NVIDIA Jeston Orin platform (Input size: 640 × 640).
MethodsPRF1mAPFPS
YOLOHLA0.8390.7700.8030.842128
Torch pruning0.7850.7150.7480.80378
DepGraph0.7680.6920.7280.766154
YOLOHLA-Tiny0.8430.7310.7830.834172
Table 4. Comparison results using YOLOV5s and different attention modules on the test dataset.
ModelPRF1mAPFPS
YOLOV5s + SE0.7950.7300.7610.795278
YOLOV5s + CA0.8510.7660.8060.842133
YOLOV5s + ECA0.8430.7190.7760.822286
YOLOV5s + CBAM0.8400.7200.7750.819294
YOLOV5s + HLA0.8390.7700.8030.842323
Table 5. Comparison results using YOLOV6-Tiny and different attention modules on the test dataset.
ModelPRF1mAPFPS
YOLOV6-Tiny + SE0.9010.8290.8640.870169
YOLOV6-Tiny + CA0.8850.8110.8460.877159
YOLOV6-Tiny + ECA0.9010.840.8690.868167
YOLOV6-Tiny + CBAM0.9060.8290.8660.866159
YOLOV6-Tiny + HLA0.9080.8510.8780.882154
Table 6. Comparison of different pruning ratios. (“Model size” refers to the number of bytes occupied by the model).
Pruning RatiosPRF1mAPFPSModel Size
YOLOHLA0.8390.7700.8030.84232320.8 MB
pr = 10%0.7860.7590.7720.81837017.7 MB
pr = 20%0.7820.5680.6580.7238514.5 MB
pr = 30%0.7640.5760.6570.65040112.1 MB
pr = 40%0.6700.5020.5740.5444179.8 MB
pr = 50%0.4890.4810.4850.4274567.8 MB
Finetuning (pr = 50%)0.8430.7310.7830.8344567.8 MB
Table 7. Comparisons of VisDrone2019 dataset.
MethodsPRF1mAP
YOLOV5S0.4320.3420.3820.328
YOLOV6-tiny0.4760.40.4350.371
YOLOV7-tiny0.4890.3710.4220.36
YOLOHLA0.4870.410.4390.375
Disclaimer/Publisher’s Note: The statements, opinions and data contained in all publications are solely those of the individual author(s) and contributor(s) and not of MDPI and/or the editor(s). MDPI and/or the editor(s) disclaim responsibility for any injury to people or property resulting from any ideas, methods, instructions or products referred to in the content.

