Article

Enhancing the Performance of Unmanned Aerial Vehicle-Based Estimation of Rape Chlorophyll Content by Reducing the Impact of Crop Coverage

1
School of Agricultural Engineering, Jiangsu University, Zhenjiang 212013, China
2
State Key Laboratory for Theory and Technology of Intelligent Agricultural Machinery and Equipment, Jiangsu University, Zhenjiang 212013, China
3
Jiangsu Province and Education Ministry Co-Sponsored Synergistic Innovation Center of Modern Agricultural Equipment, Zhenjiang 212013, China
4
Faculty of Computing, Harbin Institute of Technology, Harbin 150001, China
*
Author to whom correspondence should be addressed.
Drones 2024, 8(10), 578; https://doi.org/10.3390/drones8100578
Submission received: 29 August 2024 / Revised: 27 September 2024 / Accepted: 8 October 2024 / Published: 12 October 2024
(This article belongs to the Special Issue UAS in Smart Agriculture: 2nd Edition)

Abstract

:
Estimating leaf chlorophyll content (LCC) in a timely manner and accurately is of great significance for the precision management of rape. The spectral index derived from UAV images has been adopted as a non-destructive and efficient way to map LCC. However, soil background impairs the performance of UAV-based LCC estimation, limiting the accuracy and applicability of the LCC estimation model, and this issue remains to be addressed. Thus, this research was conducted to study the influence of soil pixels in UAV RGB images on LCC estimation. UAV campaigns were conducted from overwintering to flowering stages to cover the process of soil background being gradually covered by rapeseed plants. Three planting densities of 11.25, 18.75, and 26.26 g/m2 were chosen to further enrich the different soil background percentage levels, namely, the rape fractional vegetation coverage (FVC) levels. The results showed that, compared to the insignificant difference observed for the ground measured LCC at a certain growth stage, a significant difference was found for most of the spectral indices extracted without soil background removal, indicating the influence of soil background. Removing soil background during the extraction of the spectral index enhanced the LCC estimation accuracy, with the coefficient of determination (R2) increasing from 0.58 to 0.68 and the root mean square error (RMSE) decreasing from 5.19 to 4.49. At the same time, the applicability of the LCC estimation model for different plant densities (FVC levels) was also enhanced. The lower the planting density, the greater the enhancement. R2 increased from 0.53 to 0.70, and the RMSE decreased from 5.30 to 4.81 under a low planting density of 11.25 g/m2. These findings indicate that soil background removal significantly enhances the performance of UAV-based rape LCC estimation, particularly under various FVC conditions.

1. Introduction

Oilseed rape, as one of the major oilseed crops across the world, has exhibited an increasing yield in recent years because of the increasing global demand for food and fuel [1,2]. Compared to cereal crops, oilseed rape requires much more nitrogen [3]. To maximize oilseed yield, over-fertilization has become a common agronomic operation for practical rape planting in China, resulting in serious environmental problems such as soil compaction, greenhouse gas emissions, and water contamination [4,5]. Thus, for precise nitrogen fertilizer management, it is very important to estimate rape nitrogen nutrition status quickly and accurately.
Leaf chlorophyll content (LCC) has been confirmed in previous studies to indicate the nitrogen nutritional status of crops [6]. Traditional LCC detection methods rely on chemical analysis, which is difficult to apply at the farm scale [7,8]. A portable chlorophyll-measuring instrument (SPAD-502) can determine LCC based on the absorption and reflection characteristics of crop pigment groups in certain band regions, and has been widely adopted around the world [9,10]. However, in precision agriculture, spatial–temporal LCC distributions are required for the generation of prescription maps and thus for guiding precise nitrogen fertilizer application.
Remote sensing-based mapping approaches have been adopted in previous studies using various platforms to monitor crop growth status [8,11]. Satellite images have been used on a large scale. Images acquired from ground-based vehicles are applied in greenhouse scenes. However, for crop monitoring at the farm scale, images with high spatial–temporal resolution are required. Unmanned aerial vehicles (UAVs) are more effective for this than satellites and ground-based platforms, allowing for the acquisition of LCC information with high spatial–temporal resolution [12].
Hyperspectral [13,14] and multispectral [12,15] cameras have been commonly integrated on UAV platforms to map LCC in previous studies. Similar to the measuring principle of SPAD-502, a vegetation index calculated using a combination of the reflectance of two or more bands has been a common choice for estimating crop LCC [16]. For example, maize chlorophyll content was estimated based on vegetation indices derived from UAV hyperspectral images [13]. Vegetation indices derived from UAV multispectral images have been chosen to estimate the chlorophyll content of spring wheat [17]. Although crop LCC has been successfully estimated in previous studies based on UAV hyperspectral or multispectral remote sensing technology, the high price of the above equipment has been a hindrance for farmers needing to monitor crop growth status in practical planting scenarios. The potential to use vegetation indices derived from UAV RGB images to estimate crop LCC should be explored because this would be cheaper.
Additionally, vegetation indices have been directly derived from UAV images and then adopted to estimate LCC without considering the influence of soil background pixels [9,18]. After emergence, the percentage of plant pixels gradually increases until full coverage throughout the growing season, and the percentage of soil background pixels gradually decreases. During this period, the influence of each type of pixel on the directly derived vegetation index also changes dynamically with their changing percentages. This is why a vegetation index extracted without background removal could be successfully applied to monitor crop fractional vegetation coverage (FVC) in previous studies [19,20,21]. Its successful use for FVC estimation indicates that, when a vegetation index extracted without background removal is adopted to estimate crop LCC, the different soil background percentages (i.e., the different FVC levels) will have an impact. There is no research explicitly examining the pattern with which soil background pixels influence LCC estimation performance. Thus, it is critical to study the influence of soil background on LCC estimation to enhance the latter’s accuracy and applicability.
In this study, UAV campaigns and ground LCC sampling were conducted from the overwintering stage to the flowering stages. The main process of changes in FVC for rapeseed plants until full coverage was investigated. At the same time, three rapeseed planting densities were set to further enrich the different FVC levels at a certain growth stage. The main objectives were (1) to explore the response of FVC, LCC, and vegetation indices to plant density across the FVC full covering process; (2) to evaluate the influence of soil background pixels on the ability to use the vegetation index to estimate LCC; and (3) to establish a rape LCC estimation model based on low-cost UAV RGB images by overcoming the influence of soil background pixels.

2. Materials and Methods

2.1. Study Area and Experimental Design

In this study, the data were collected from the experimental field located in Zhenjiang, Jiangsu Province, China (32°12′19.49″ N, 119°17′46.19″ E, elevation 8 m) with four rape varieties: Qinyou 1718 (Species 1), Detian 158 (Species 2), Suyou 1908 (Species 3), and Ningza 158 (Species 4). Oilseed rape is an important economic crop in Jiangsu Province. It ranks first in China in terms of average yield per hectare, at 2800 kg/ha. Three rapeseed planting densities of 11.25, 18.75, and 26.26 g/m2 were set for each variety to explore the influence of soil background on LCC estimation. Three replicates were adopted for each variety and each planting density, resulting in a total of 36 plots with 25 m2 each (10 m × 2.5 m). The rapeseeds were manually sown on 17 October 2023. The seedling emergence and harvest dates were 29 October 2023 and 24 May 2024, respectively. Figure 1 shows the overview of the experimental design.

2.2. Measurement of Rape Leaf Chlorophyll Content

The widely used chlorophyll content sensor SPAD (Soil and Plant Analyzer Development) 502 Plus was adopted to characterize rape LCC between 11:00 and 13:00 (sunny) on 27 January 2024 (overwintering stage), 17 February 2024 (stem elongation stage), 8 March 2024 (stem elongation stage), 16 March 2024 (stem elongation stage), and 29 March 2024 (flowering stage). The corresponding days after sowing (DAS) were 102, 123, 143, 151, and 164, respectively. As shown in Figure 1, three subareas in each plot were selected to measure rape LCC. The middle site of the first fully expanded leaf for each rapeseed plant was chosen to measure chlorophyll content, and three plants were diagonally selected in each subarea. All the SPAD values of rape measured in each sampling subarea were averaged. A total of 540 LCC samples were collected across the three stages.

2.3. Acquisition of UAV RGB Orthomosaic

Simultaneously, UAV RGB images of the rape field were captured using a DJI Zenmuse L1 camera (Da-Jiang Innovations, Shenzhen, China). The UAV platform was an M300 RTK with a longest flight time of 55 min. UAV flights were implemented between 11:00 and 13:00 at a height of 30 m with heading and side overlaps of 85%, resulting in a ground sample distance of 8 mm. To obtain an orthomosaic of the whole rape field, Pix4DMapper version 4.5.6 was adopted to mosaic these UAV RGB images. To enhance the geographic location accuracy of the orthomosaics, the geo-locations of ground control points (Figure 1) were measured using an RTK differential GNSS device (CHCNAV, Shanghai, China).

2.4. Acquisition of Rape Fractional Vegetation Coverage

After cropping the orthomosaic for each subarea (Figure 1), the fixed-threshold method proposed by Niu et al. [22] was adopted to acquire rape FVC. This method assumes that the vegetation and soil background pixels in a certain image color space or index channel follow a two-component Gaussian mixture model. The classification threshold for discriminating vegetation and background pixels can be calculated by fitting the two-component Gaussian mixture model. The authors also found that a fixed classification threshold exists and could be obtained through statistical analysis. Finally, an excess green index (ExG) value of 11.03 was taken as the fixed classification threshold for the acquisition of rape FVC. To verify the accuracy of the above fixed-threshold method, 60 out of 540 subareas’ images were chosen to obtain referenced FVC values using the supervised classification method. The coefficient of determination (R2) and root mean square error (RMSE) between the results of the two methods were 0.95 and 0.04, indicating that rape FVC was accurately determined using the fixed-threshold method.

2.5. Extraction of Spectral Indices from UAV RGB Images

To explore the influence of rape FVC on LCC estimation and establish a robust estimation model, the three bands of the RGB images were used to compute eight vegetation indices (Table 1). To further mine the potential of this method, UAV RGB images were also turned to different color spaces. The H and A channels were extracted from HSV and Lab color spaces, respectively. Thereafter, all the vegetation indices and color indices were noted as spectral indices. To extract spectral indices from UAV RGB images, two methods were adopted. One was directly deriving spectral indices from the subarea’s orthomosaic that was normally adopted in previous studies. The other method was choosing only the rape pixels in the subarea’s orthomosaic to extract spectral indices. The same method as depicted in Section 2.4 was adopted for the recognition of rape pixels.

2.6. Modeling and Statistical Analysis

LCC estimation models were established using support vector machines (SVMs) and random forest (RF) algorithms (Figure 2). The performance of multivariate linear regression (MLR) algorithms was compared with that of SVM and RF. Three LCC models were constructed with RStudio using the “e1071”, “randomForest”, and “lm” packages. In the process of implementing the SVM algorithm in RStudio, the radial basis function was adopted and the two hyperparameters penalty parameter C and kernel parameter g were selected as the kernel function, with their values set to 1 and 0.067, respectively. The RF algorithm, which integrates multiple decision trees, is suitable for constructing a model based on high-dimensional data with less overfitting problems. In the process of implementing the RF algorithm in RStudio, the number of decision trees was set to the default value (500) and the number of variables per node was set to the square root of the number of input variables.
For establishing the LCC estimation models, all the data were divided into three groups: a training set, validation set, and testing set. The training and validation sets were used to establish training models and validate their accuracy. The testing set was used to test the applicability of the models to a new dataset. Data collected from replicas 1 and 3 were used as the training and validation sets with a ratio of 2:1. Data collected from replica 2 were used as the testing set. The accuracy of the rape LCC estimation models was evaluated using R2 and the RMSE.
R 2 = i = 1 n ( y ^ i y ¯ ) i = 1 n ( y i y ¯ )
R M S E = i = 1 n ( y ^ i y i ) 2 n
where y ^ i is the LCC predicted using the SVR, RF, and MLR models; y i is the LCC measurements obtained in the field; y ¯ is the average of the LCC measurements; and n is the total number of LCC measurements.

3. Results

3.1. Response of Rape Fractional Vegetation Coverage to Planting Density

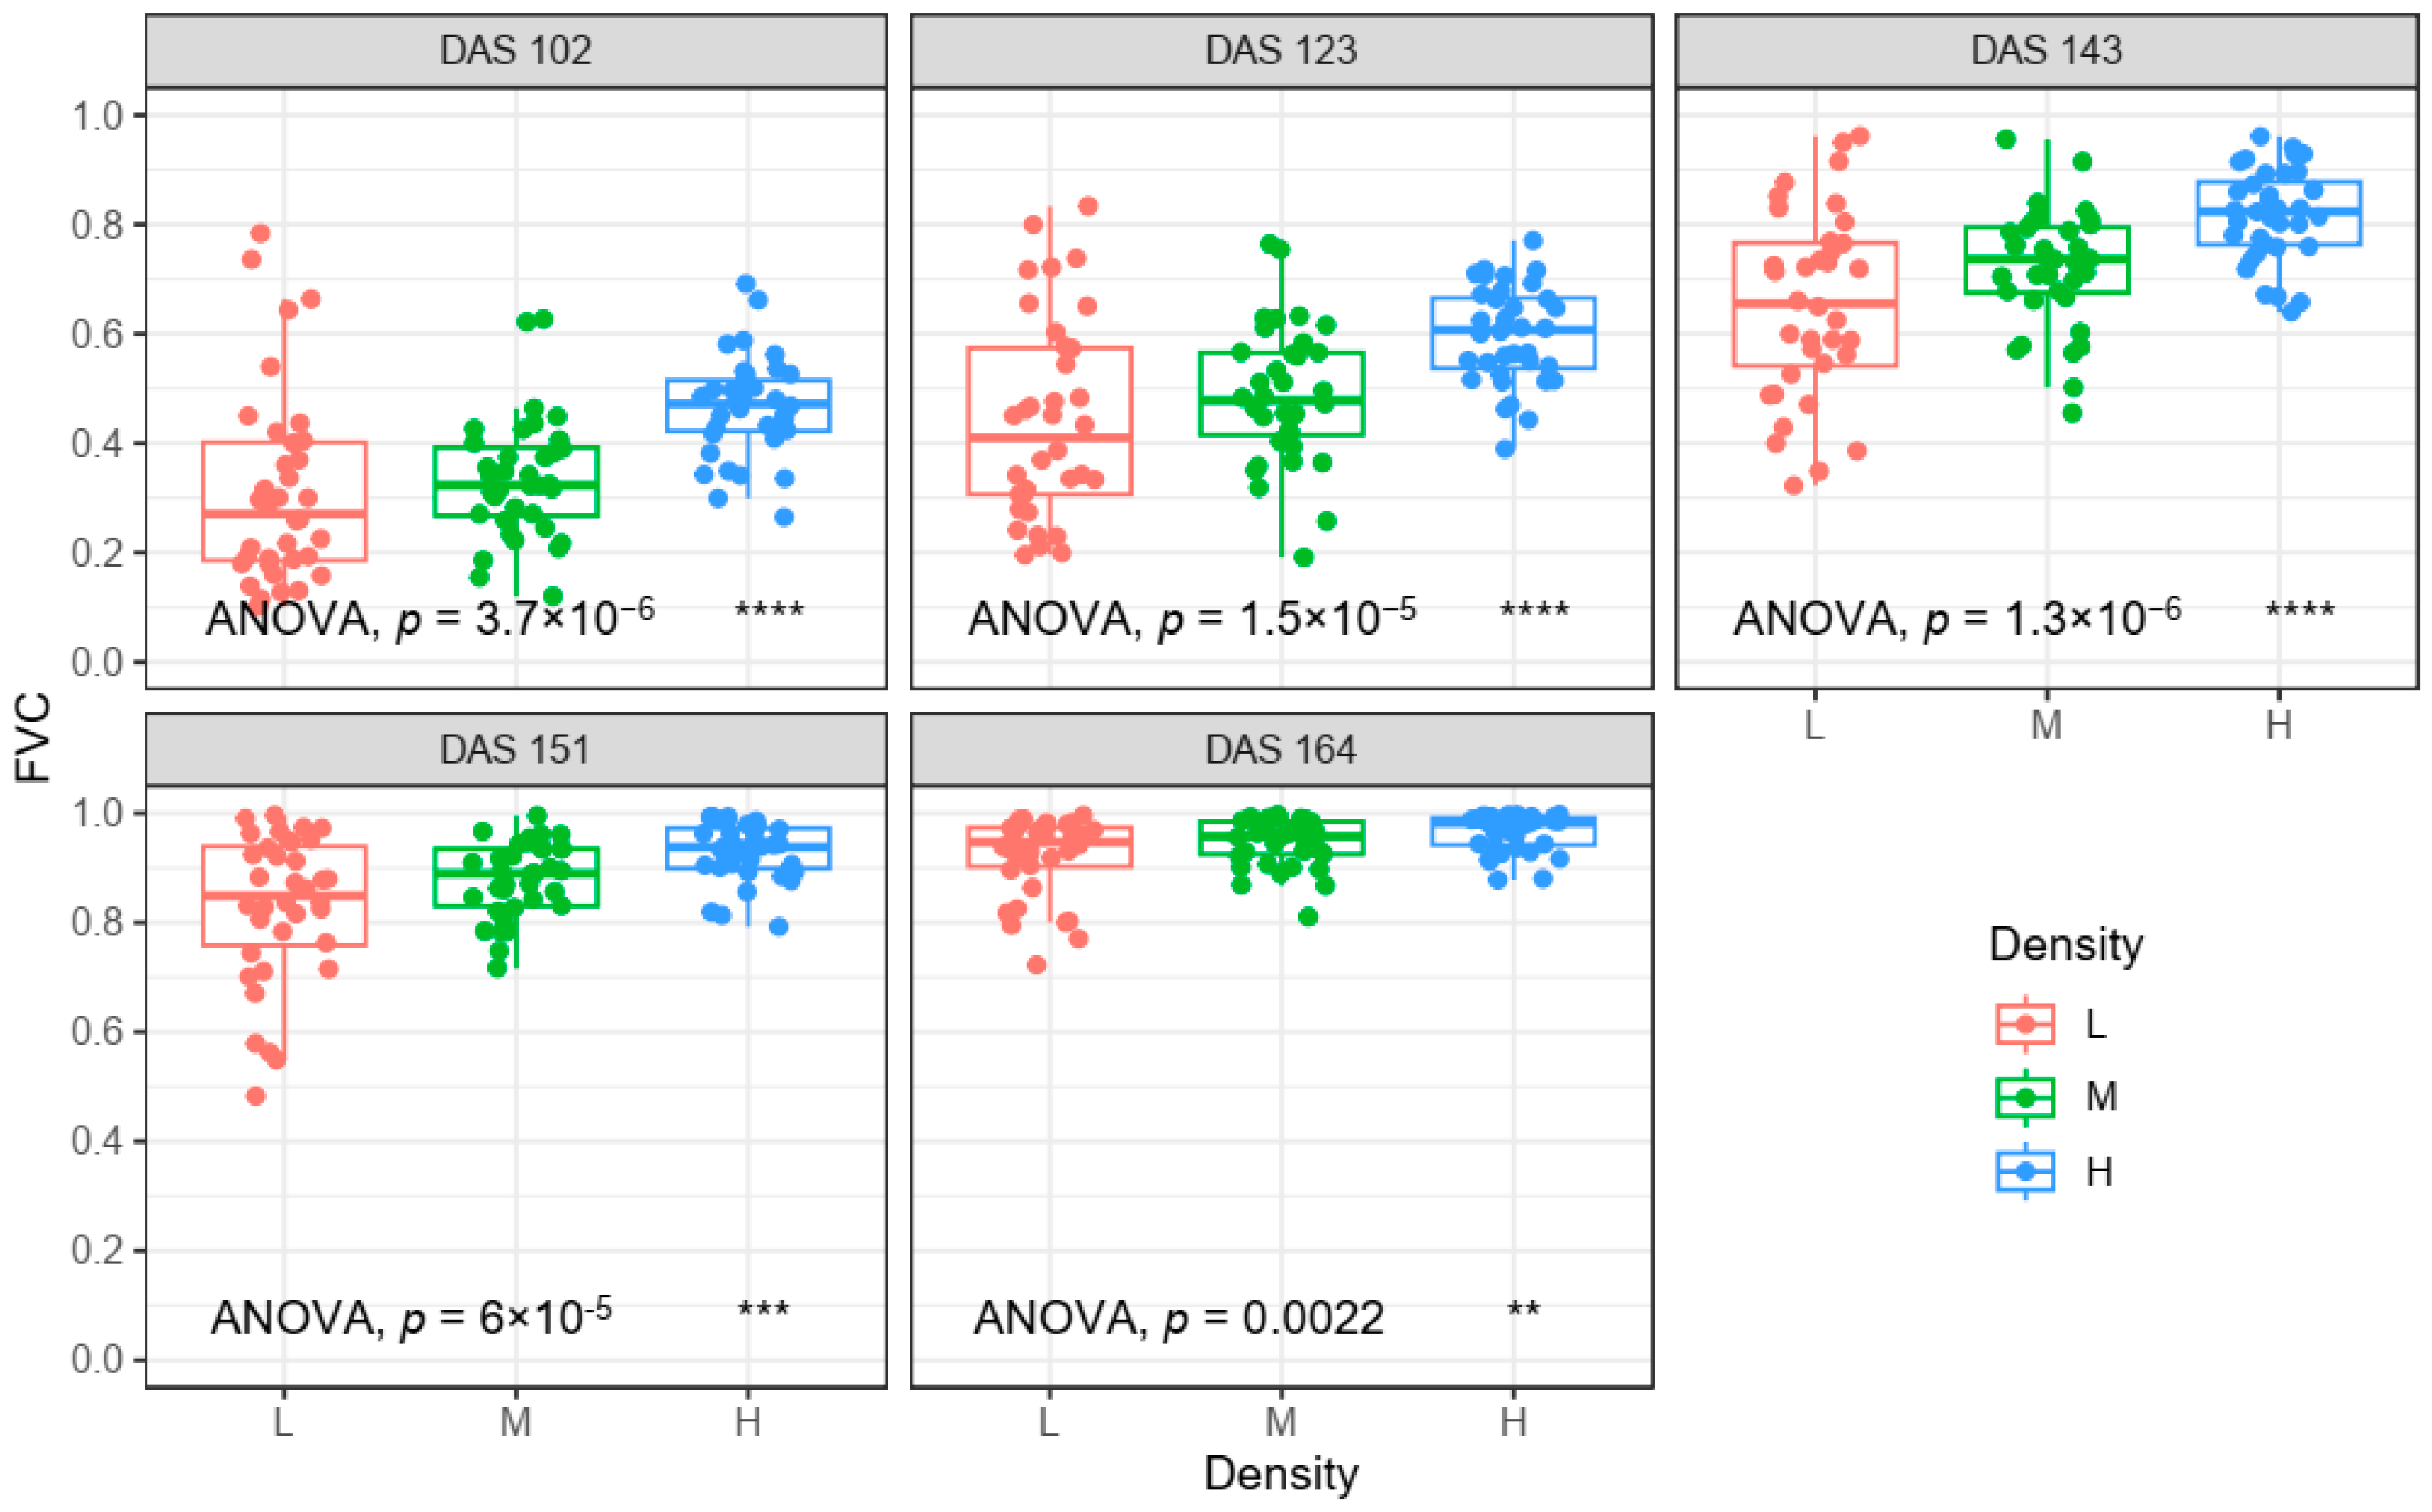
Figure 3 shows the FVC distribution for each planting density and its temporal variation across the five data collection dates. Except for the flowering stage (DAS 164), a clear upward trend in FVC could be observed for the three planting densities. The high planting density of 26.26 g/m2 always had the highest FVC values for each date, with median values of 0.47, 0.61, 0.82, 0.94, and 0.98, respectively. For the moderate planting density of 18.75 g/m2, the corresponding median values were 0.32, 0.48, 0.74, 0.89, and 0.96, respectively. The low planting density of 11.25 g/m2 always had the lowest FVC values, with median values of 0.27, 0.41, 0.65, 0.85, and 0.95, respectively. At the same time, it could be observed that, due to the three planting densities and the two-month time span (overwintering to flowering stages), a reliable FVC scope was captured with minimum, 25th percentile, 50th percentile, 75th percentile, and maximum values of 0.10, 0.47, 0.74, 0.92, and 0.99, respectively. For each date, the significant difference in FVC could be observed for the three planting densities with p values less than 0.01.

3.2. Response of Rape Leaf Chlorophyll Content to Planting Density

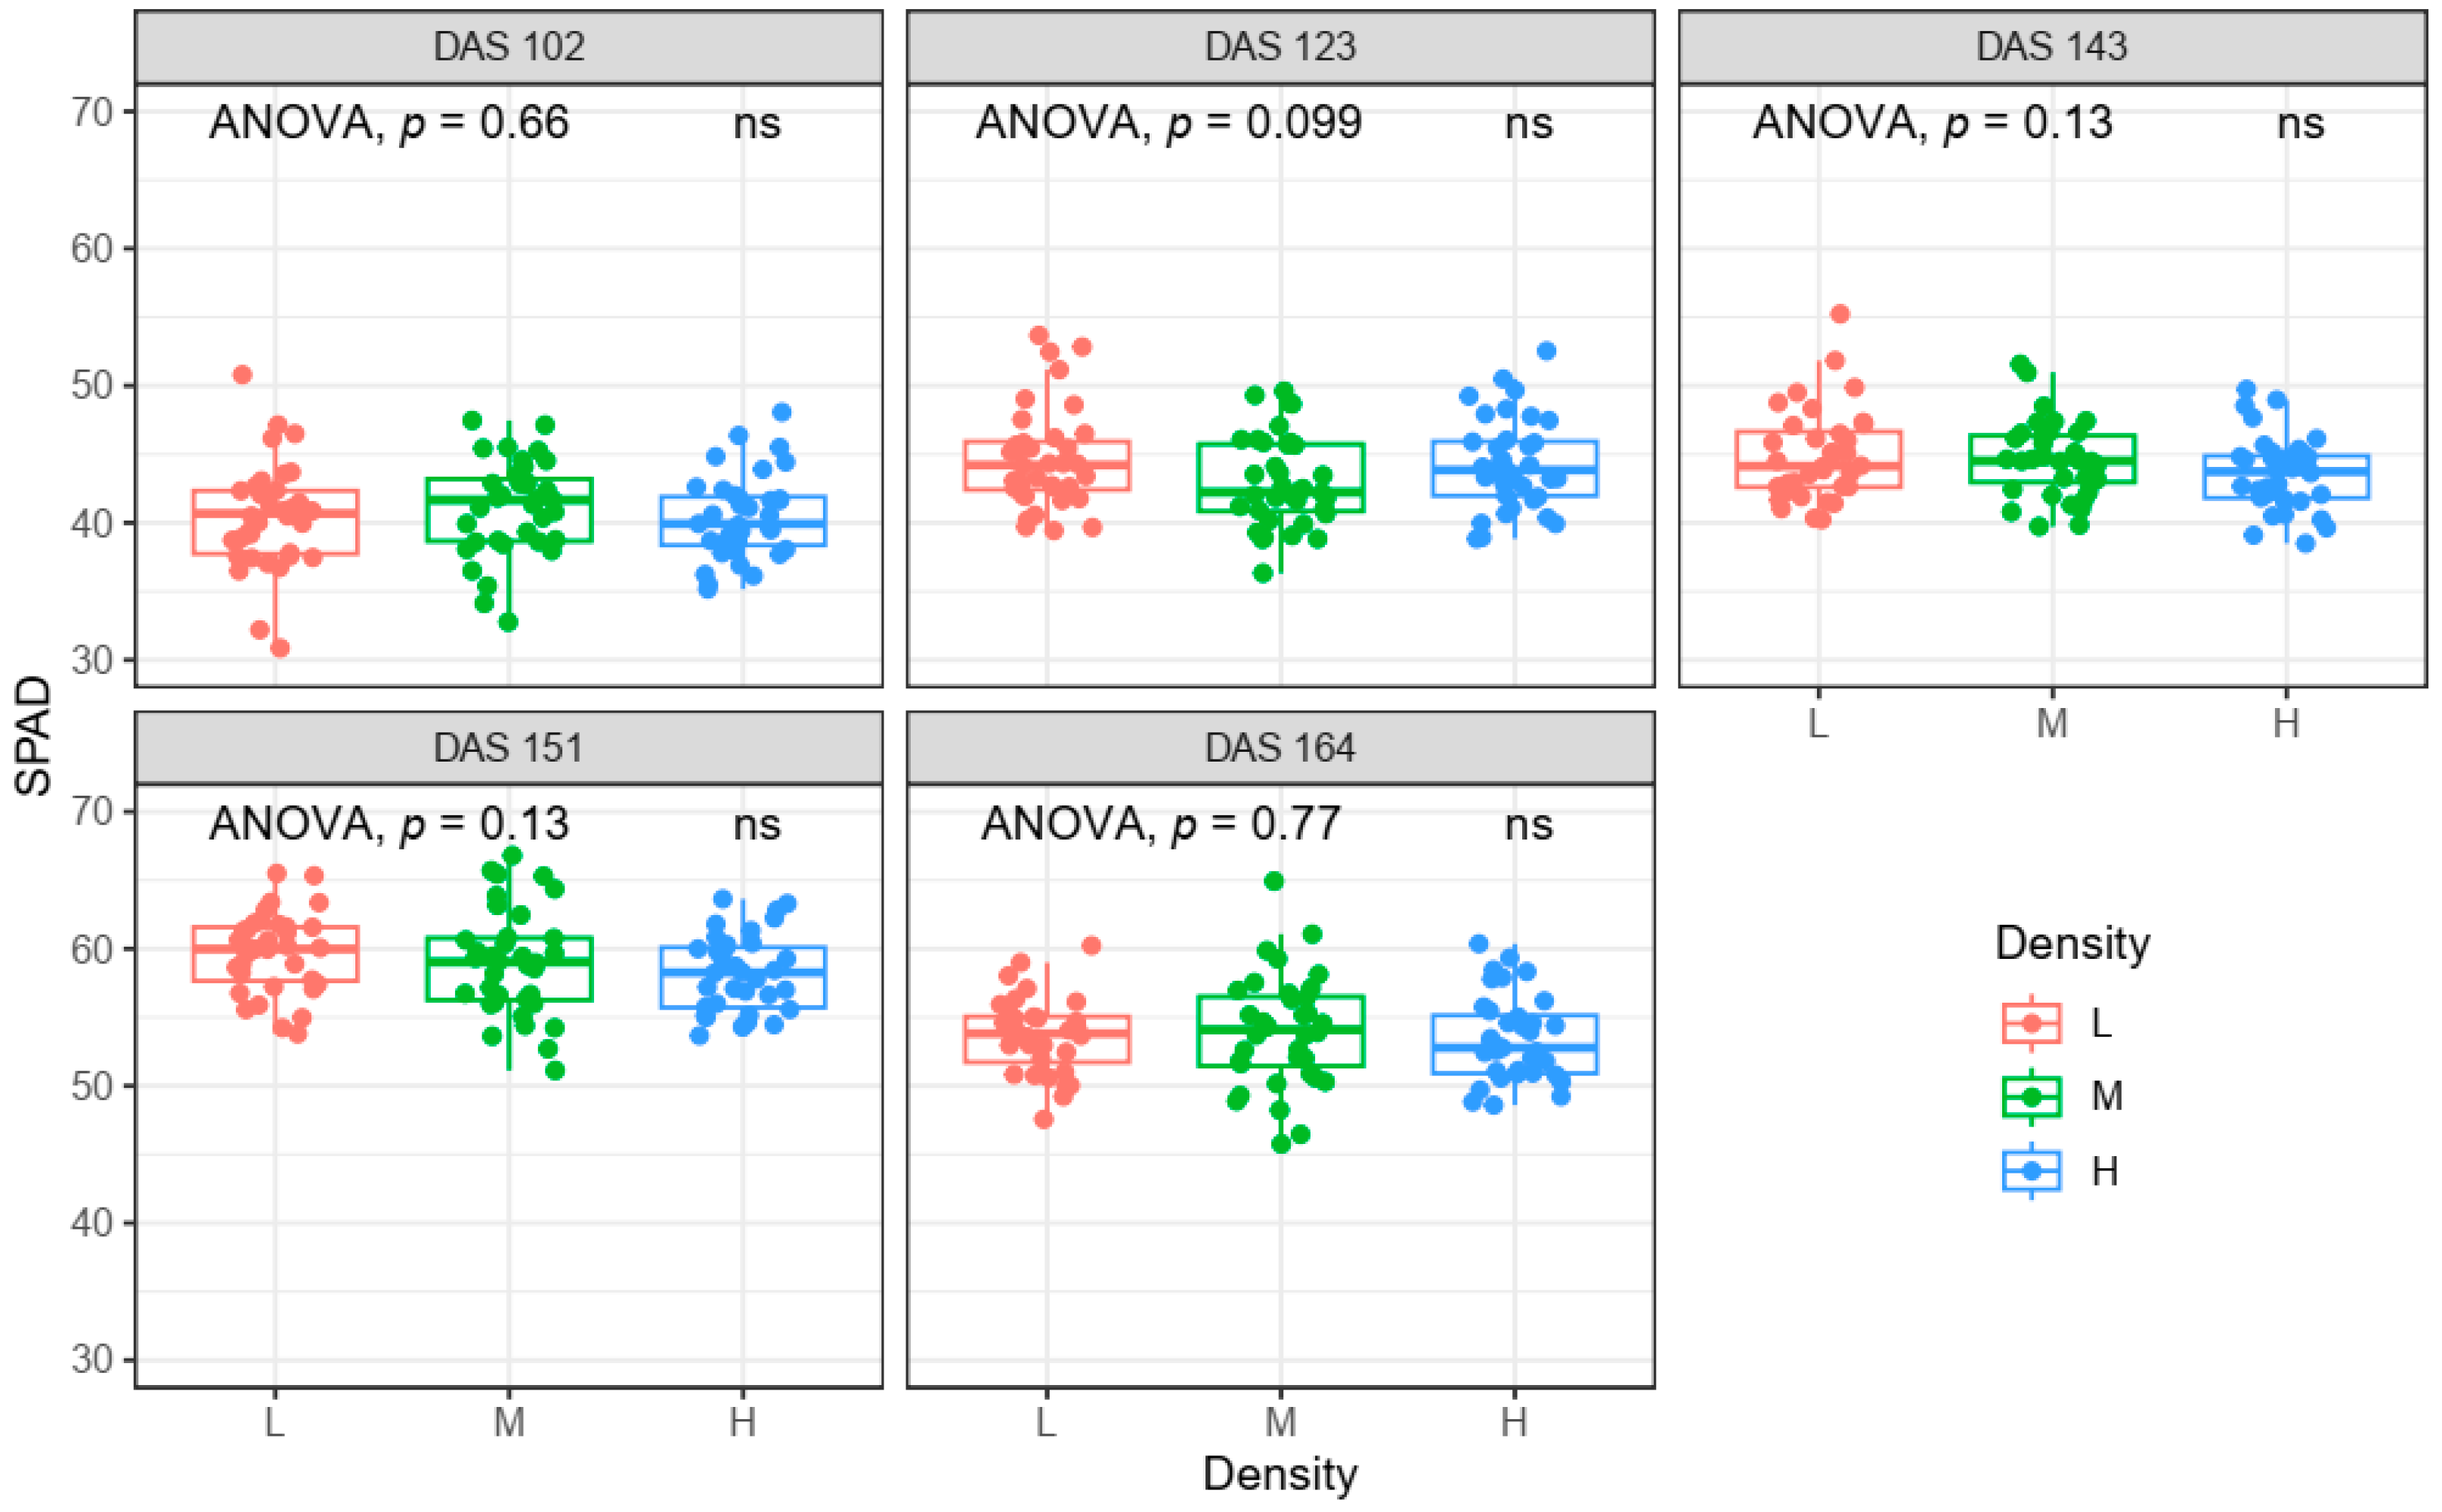
Figure 4 shows the distribution of rape LCC for each planting density and its temporal variation over the five data collection dates. Different to FVC, for each date, there was no significant difference observed for LCC when taking planting density as the factor, with all the p values greater than 0.05. Regarding the temporal variation, LCC showed a trend from rising to declining. The lowest LCC was observed on 27 January 2024 (the overwintering stage) with mean values of 40.48, 40.81, and 40.04 for planting densities of 11.25, 18.75, and 26.26 g/m2, respectively. The highest LCC was observed on 16 Mar 2024 (the stem elongation stage) with corresponding mean values of 59.71, 58.99, and 58.17, respectively. When all the LCC data were pooled together, a fine numerical scope was also captured with minimum, 25th percentile, 50th percentile, 75th percentile, and maximum values of 26.13, 42.05, 16.13, 54.65, and 66.80, respectively.

3.3. One-Way ANOVA of Spectral Indices by Taking Planting Density as the Factor

To explore whether the planting density significantly influenced the spectral indices, the latter were subjected to analysis of variance (ANOVA) by taking planting density as the factor. As shown in Table 2, when spectral indices were directly extracted from the subarea’s orthomosaic without removing the soil background pixels, there were significant differences for most of the spectral indices on most of the data collection dates, indicating that planting density had a significant influence. Due to the full coverage status of rape plants on 29 March 2024 (the flowering stage), it was reasonable that most of the spectral indices showed insignificant differences. When the background pixels were removed during the extraction of spectral indices, the influence of planting density on spectral indices was reduced. Among the ten spectral indices, the background removal effects were more obvious for H, A, ExG, and ExGR. Taking the A channel as an example, the significance level was reduced from p ≤ 0.0001 to p ≤ 0.05 on 27 January 2024, from p ≤ 0.001 to p > 0.05 on 27 February 2024, from p ≤ 0.001 to p > 0.05 on 8 March 2024, and from p ≤ 0.05 to p > 0.05 on 16 March 2024.

3.4. Analysis of the Correlation between Chlorophyll Content and Each Spectral Index

The correlation between each individual spectral index and LCC is shown in Figure 5. Spectral indices were extracted from the subarea’s orthomosaic by removing background pixels (Figure 5b) or not (Figure 5a). A significant correlation between LCC and each spectral index could be observed in both cases. Specifically, when spectral indices were extracted without soil background removal, the A channel was negatively correlated with LCC, with the highest absolute r value of 0.65, followed by NGDBI, with an r value of 0.63, and ExG, with an r value of 0.61. The weakest correlation with LCC was found for VARI, with an r value of 0.34. When soil background pixels were removed, the highest correlation with LCC was also observed for the A channel, with an r value of −0.61, followed by ExG, with an r value of 0.52, and ExGR, with an r value of 0.48. At the same time, except for the correlation between the H channel and LCC, whose r value was sharply reduced from 0.59 to 0.07, all the correlations were slightly reduced after the removal of soil background pixels. For example, the r value of ExG’s correlation with LCC was reduced from 0.61 to 0.52, and the r value of VARI’s correlation with LCC was reduced from 0.34 to 0.33. Considering the influence of planting density (Table 2) and the correlations with LCC, the A channel, ExG, and ExGR were chosen to establish rape LCC estimation models.

3.5. Rape Leaf Chlorophyll Content Estimation Results Based on Validation and Test Datasets

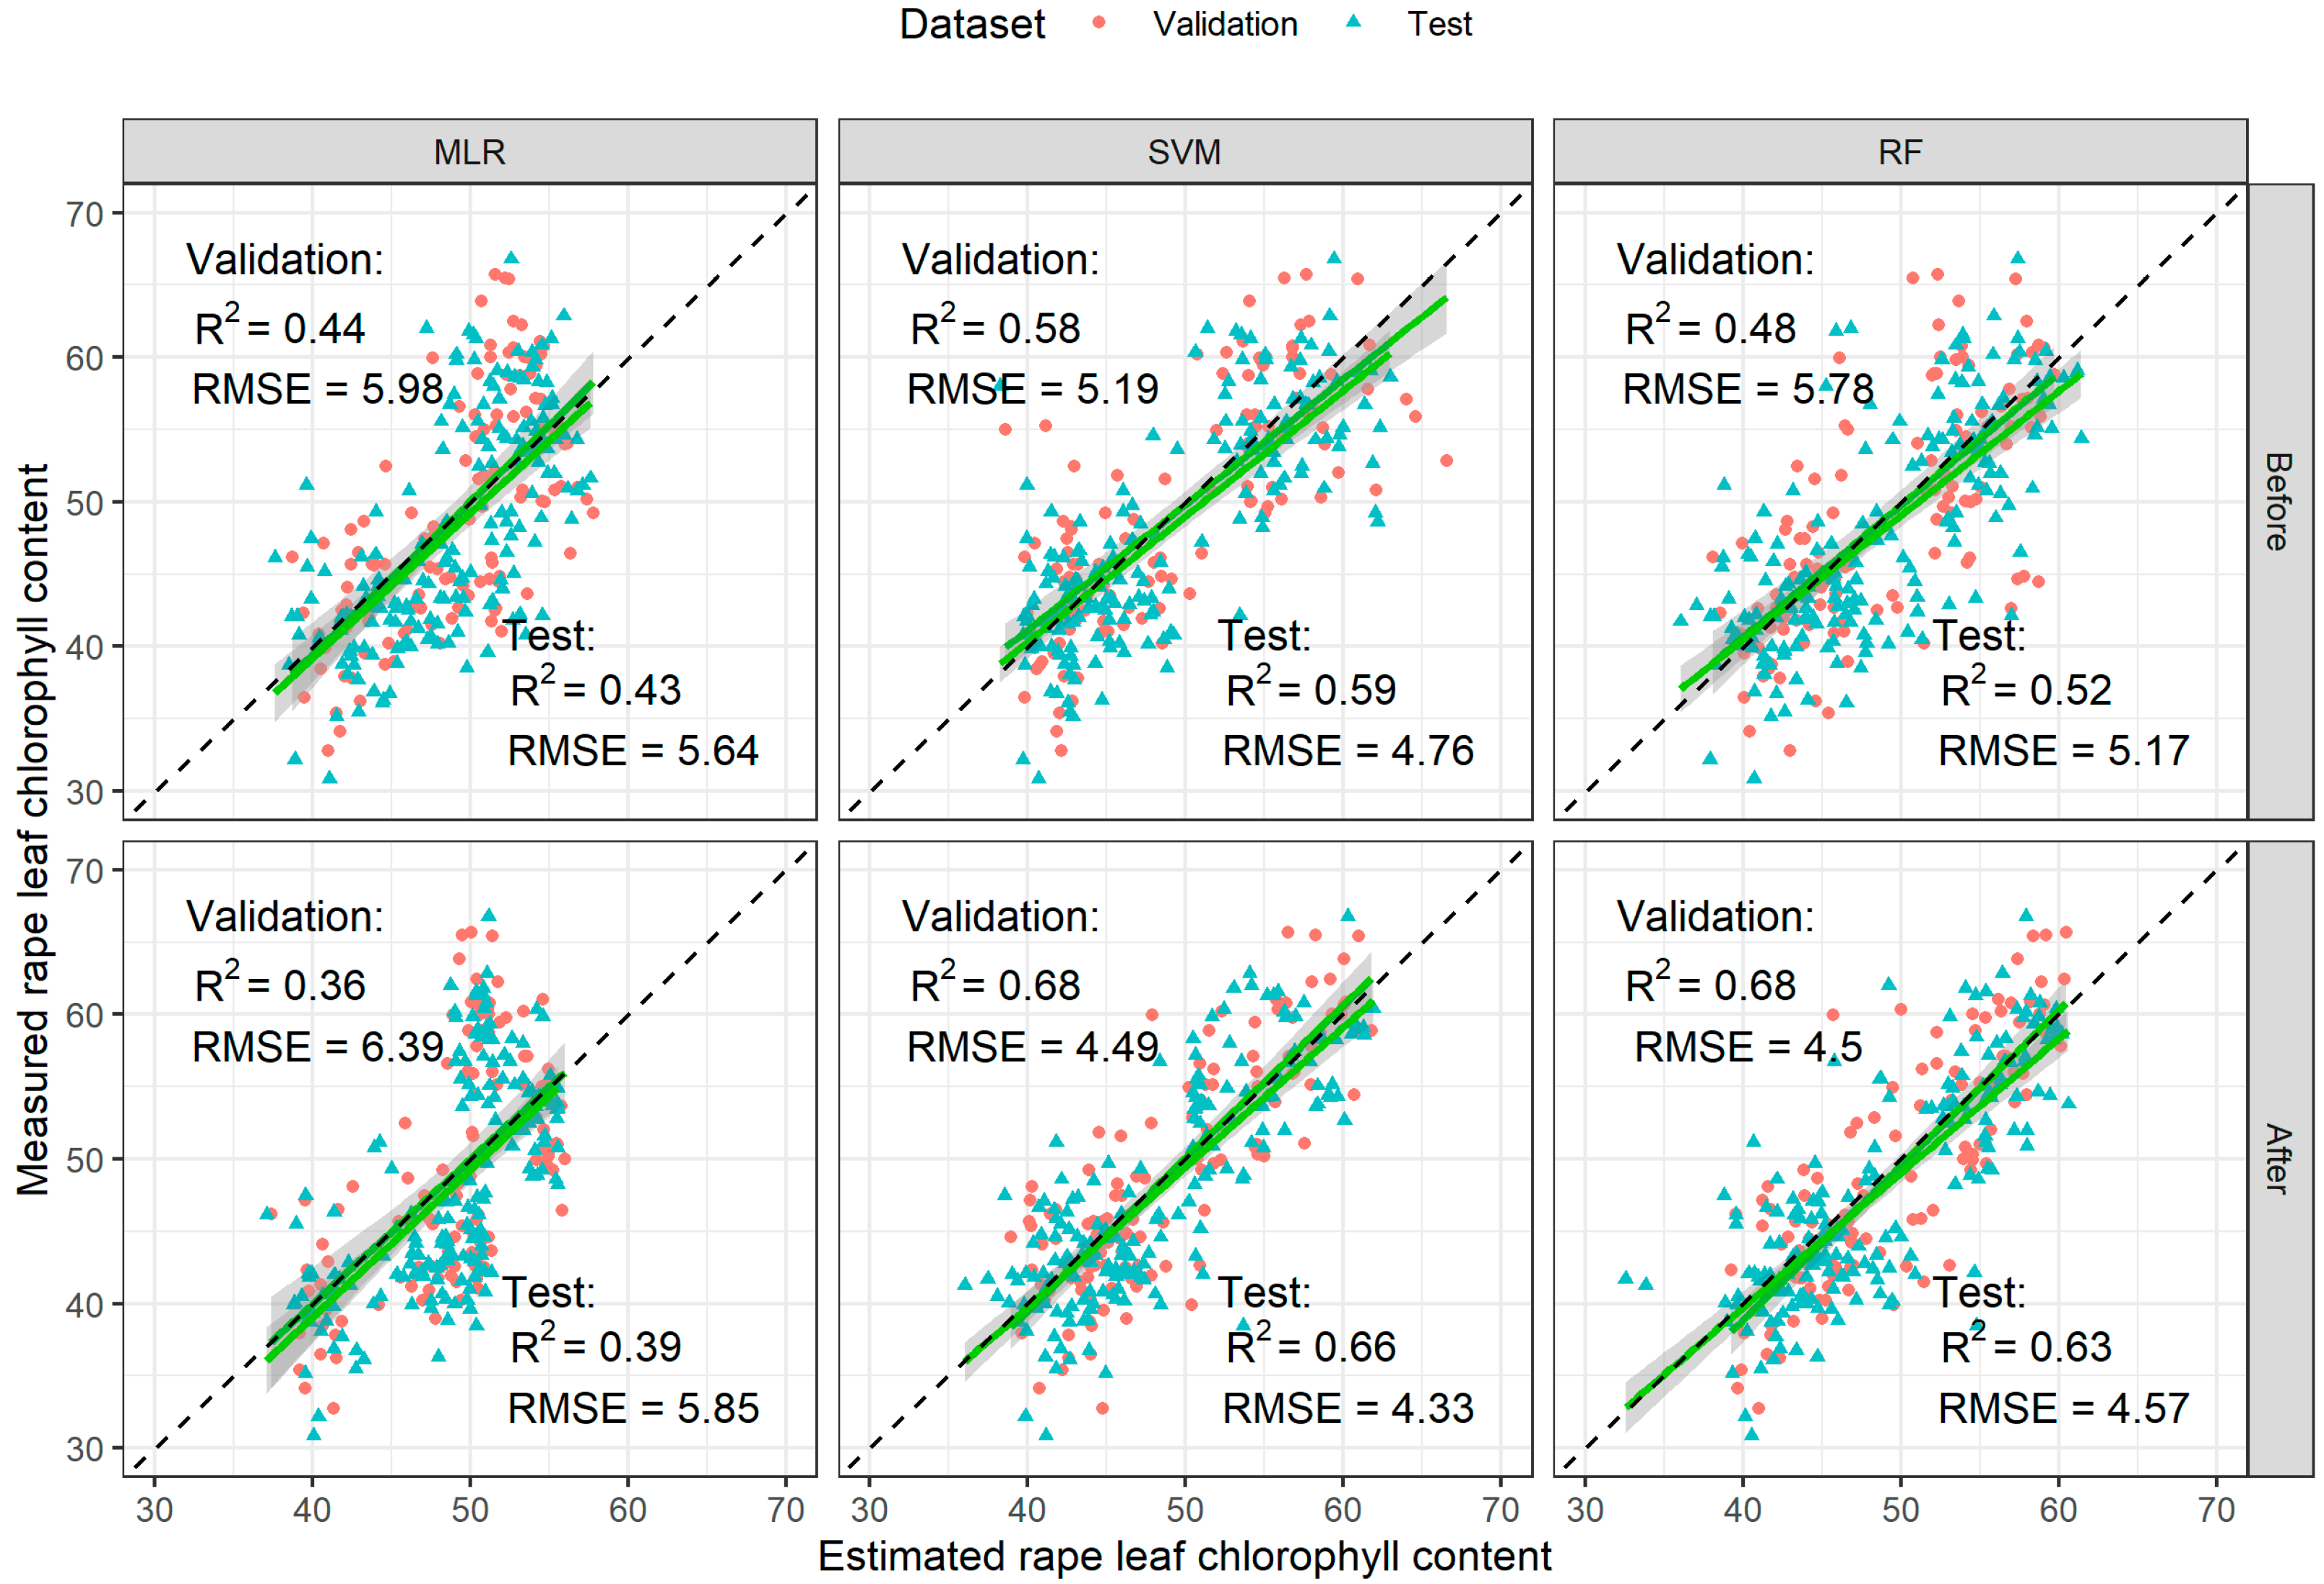
Comparisons were conducted among rape LCC training models established based on three algorithms and spectral indices with or without soil background removal (Figure 6). For the validation dataset, when spectral indices were extracted without background removal, the SVM algorithm outperformed the other two algorithms, with an R2 of 0.58, followed by the RF algorithm, with an R2 of 0.48, and the MLR algorithm, with an R2 of 0.44. The corresponding RMSEs were 5.19, 5.78, and 5.98, respectively. When spectral indices were extracted with background removal, the SVM algorithm still had the best estimation performance, with the highest R2 of 0.68 and lowest RMSE of 4.49. The performance of the RF algorithm was also enhanced, with the R2 being increased from 0.48 to 0.68 and RMSE being decreased from 5.78 to 4.50. By contrast, worse performance was observed for the MLR algorithm, with the R2 being decreased from 0.44 to 0.36 and RMSE being increased from 5.98 to 6.39. Similar results were observed for the test dataset. The SVM algorithm still performed the best whether or not the soil background pixels were removed. The background removal process also enhanced the LCC estimation accuracy. The R2 for the SVM model was increased from 0.59 to 0.66, and the corresponding RMSE was decreased from 4.76 to 4.33. Overall, the rape LCC estimation performance was enhanced by removing soil background pixels during the spectral index extraction process.

4. Discussion

Accurately estimating LCC, an essential indicator of crop nutrition and photosynthetic capacity, is very important for guiding precise field management. Generally, when spectral indices were used to estimate LCC in previous studies, these indices were directly derived from UAV remote sensing images without considering the influence of background pixels. How the background pixels influence the LCC estimation performance had not been explored; thus, this was worth exploring to further improve the accuracy and applicability of LCC estimation models.

4.1. Elimination of the Influence of Soil Background on the Spectral Index

In this study, a rape field experiment was conducted from the overwintering (27 January 2024) to flowering stages (29 March 2024), including the main process of change for rapeseed plants gradually covering the soil during their growth (Figure 3). Three planting densities of 11.25, 18.75, and 26.26 g/m2 were established to further enrich the FVC levels in a certain growth period. For ground sampling LCC data (Figure 4), although temporal variation was observed from overwintering to flowering stages, there was no significant difference among the three planting densities in a certain growth period. Therefore, it was necessary to reduce the influence of the different FVC levels and to try to maximize the capture of information produced by LCC itself.
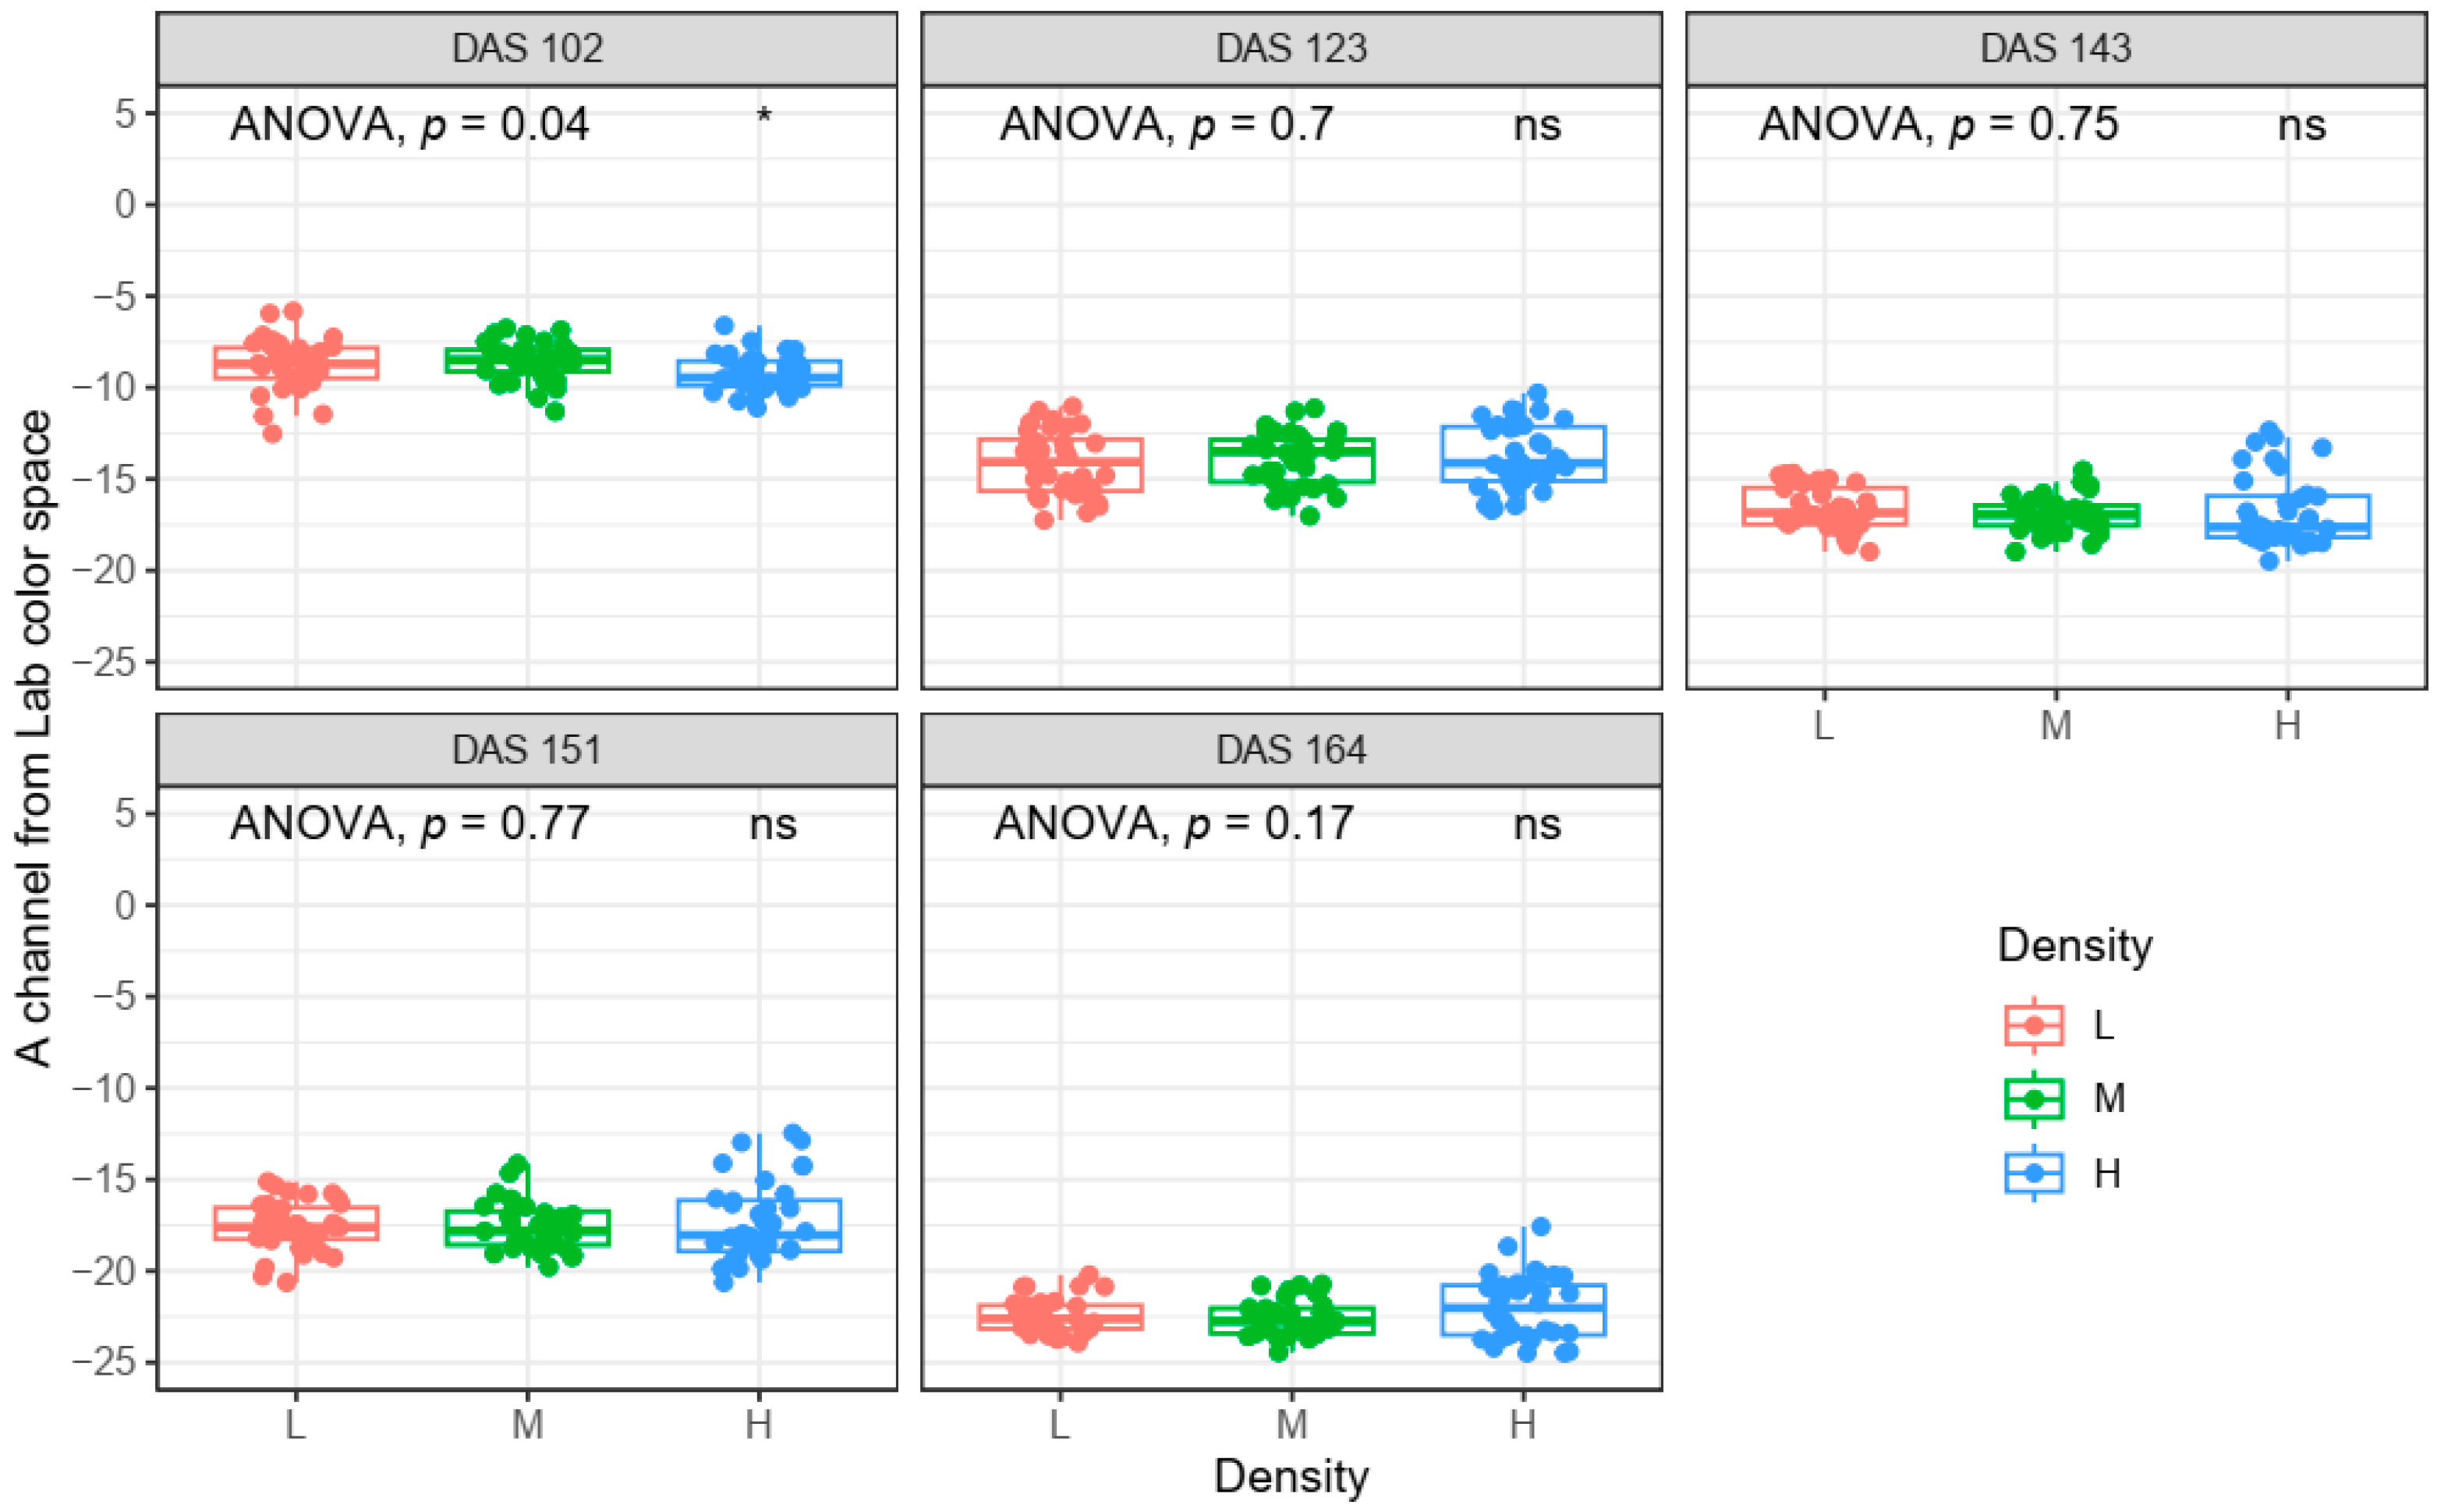
As demonstrated in previous studies, spectral indices directly extracted without background removal are closely related to FVC [19,20,21]. Before crop plants reach full coverage, the directly derived spectral indices are influenced by both the percentage of soil background and crop growth status [30]. In this study, because the rape did not suffer from other stress except for the different planting densities, an insignificant difference was observed for LCC (Figure 4). Table 2 shows that significant differences could be observed for most of the spectral indices extracted without background removal, and background removal could reduce these differences. Taking the A channel as an example (Figure 7 and Figure 8), after background removal, the mean values of the A channel on DAS 102 for planting densities of 11.25, 18.75, and 26.26 g/m2 changed from −0.42, −0.80, and −2.68 to −8.76, −8.55, and −9.23, respectively. Consistent with the results of Qiao et al. [31], there was a large difference in the spectral reflectance of the crop canopy when the soil pixels were ignored. Background removal is also necessary to capture more information produced by LCC itself.

4.2. Enhancing the Leaf Chlorophyll Content Estimation Performance through Background Removal

Although the background removal process was applied to spectral indices and the differences caused by different FVC levels (different plant densities) were reduced, there was still a strong correlation between each spectral index and LCC (Figure 5). A possible reason for the above phenomenon is that the FVC and LCC had similar trends of change during the period from emergence to full coverage (Figure 3 and Figure 4). Namely, the FVC and LCC both had upward trends during DAS 102 to 151. Similar change curves were observed in previous studies [32,33]. At the same time, it could be observed that the correlation with LCC was slightly reduced after background removal. For example, the highest correlation was reduced from −0.65 to −0.61 (A channel).
However, the lower correlation did not result in weaker LCC estimation performance. As shown in Figure 6, compared to that for spectral indices extracted without background removal (for which the highest R2 was 0.58, with a corresponding RMSE of 5.19), a higher estimation performance was found for spectral indices extracted with background removal, with the highest R2 being 0.68 and a corresponding RMSE of 4.49. The reason could be that there was a non-linear relationship between each spectral index and LCC. Evidence for this can also be observed in Figure 5. Compared to the two non-linear machine learning algorithms, a weaker estimation performance was observed for the MLR algorithm. A similar result was found by Qiao et al. [34]. The maize chlorophyll estimation model constructed based on a linear algorithm was also less accurate than the two non-linear models.
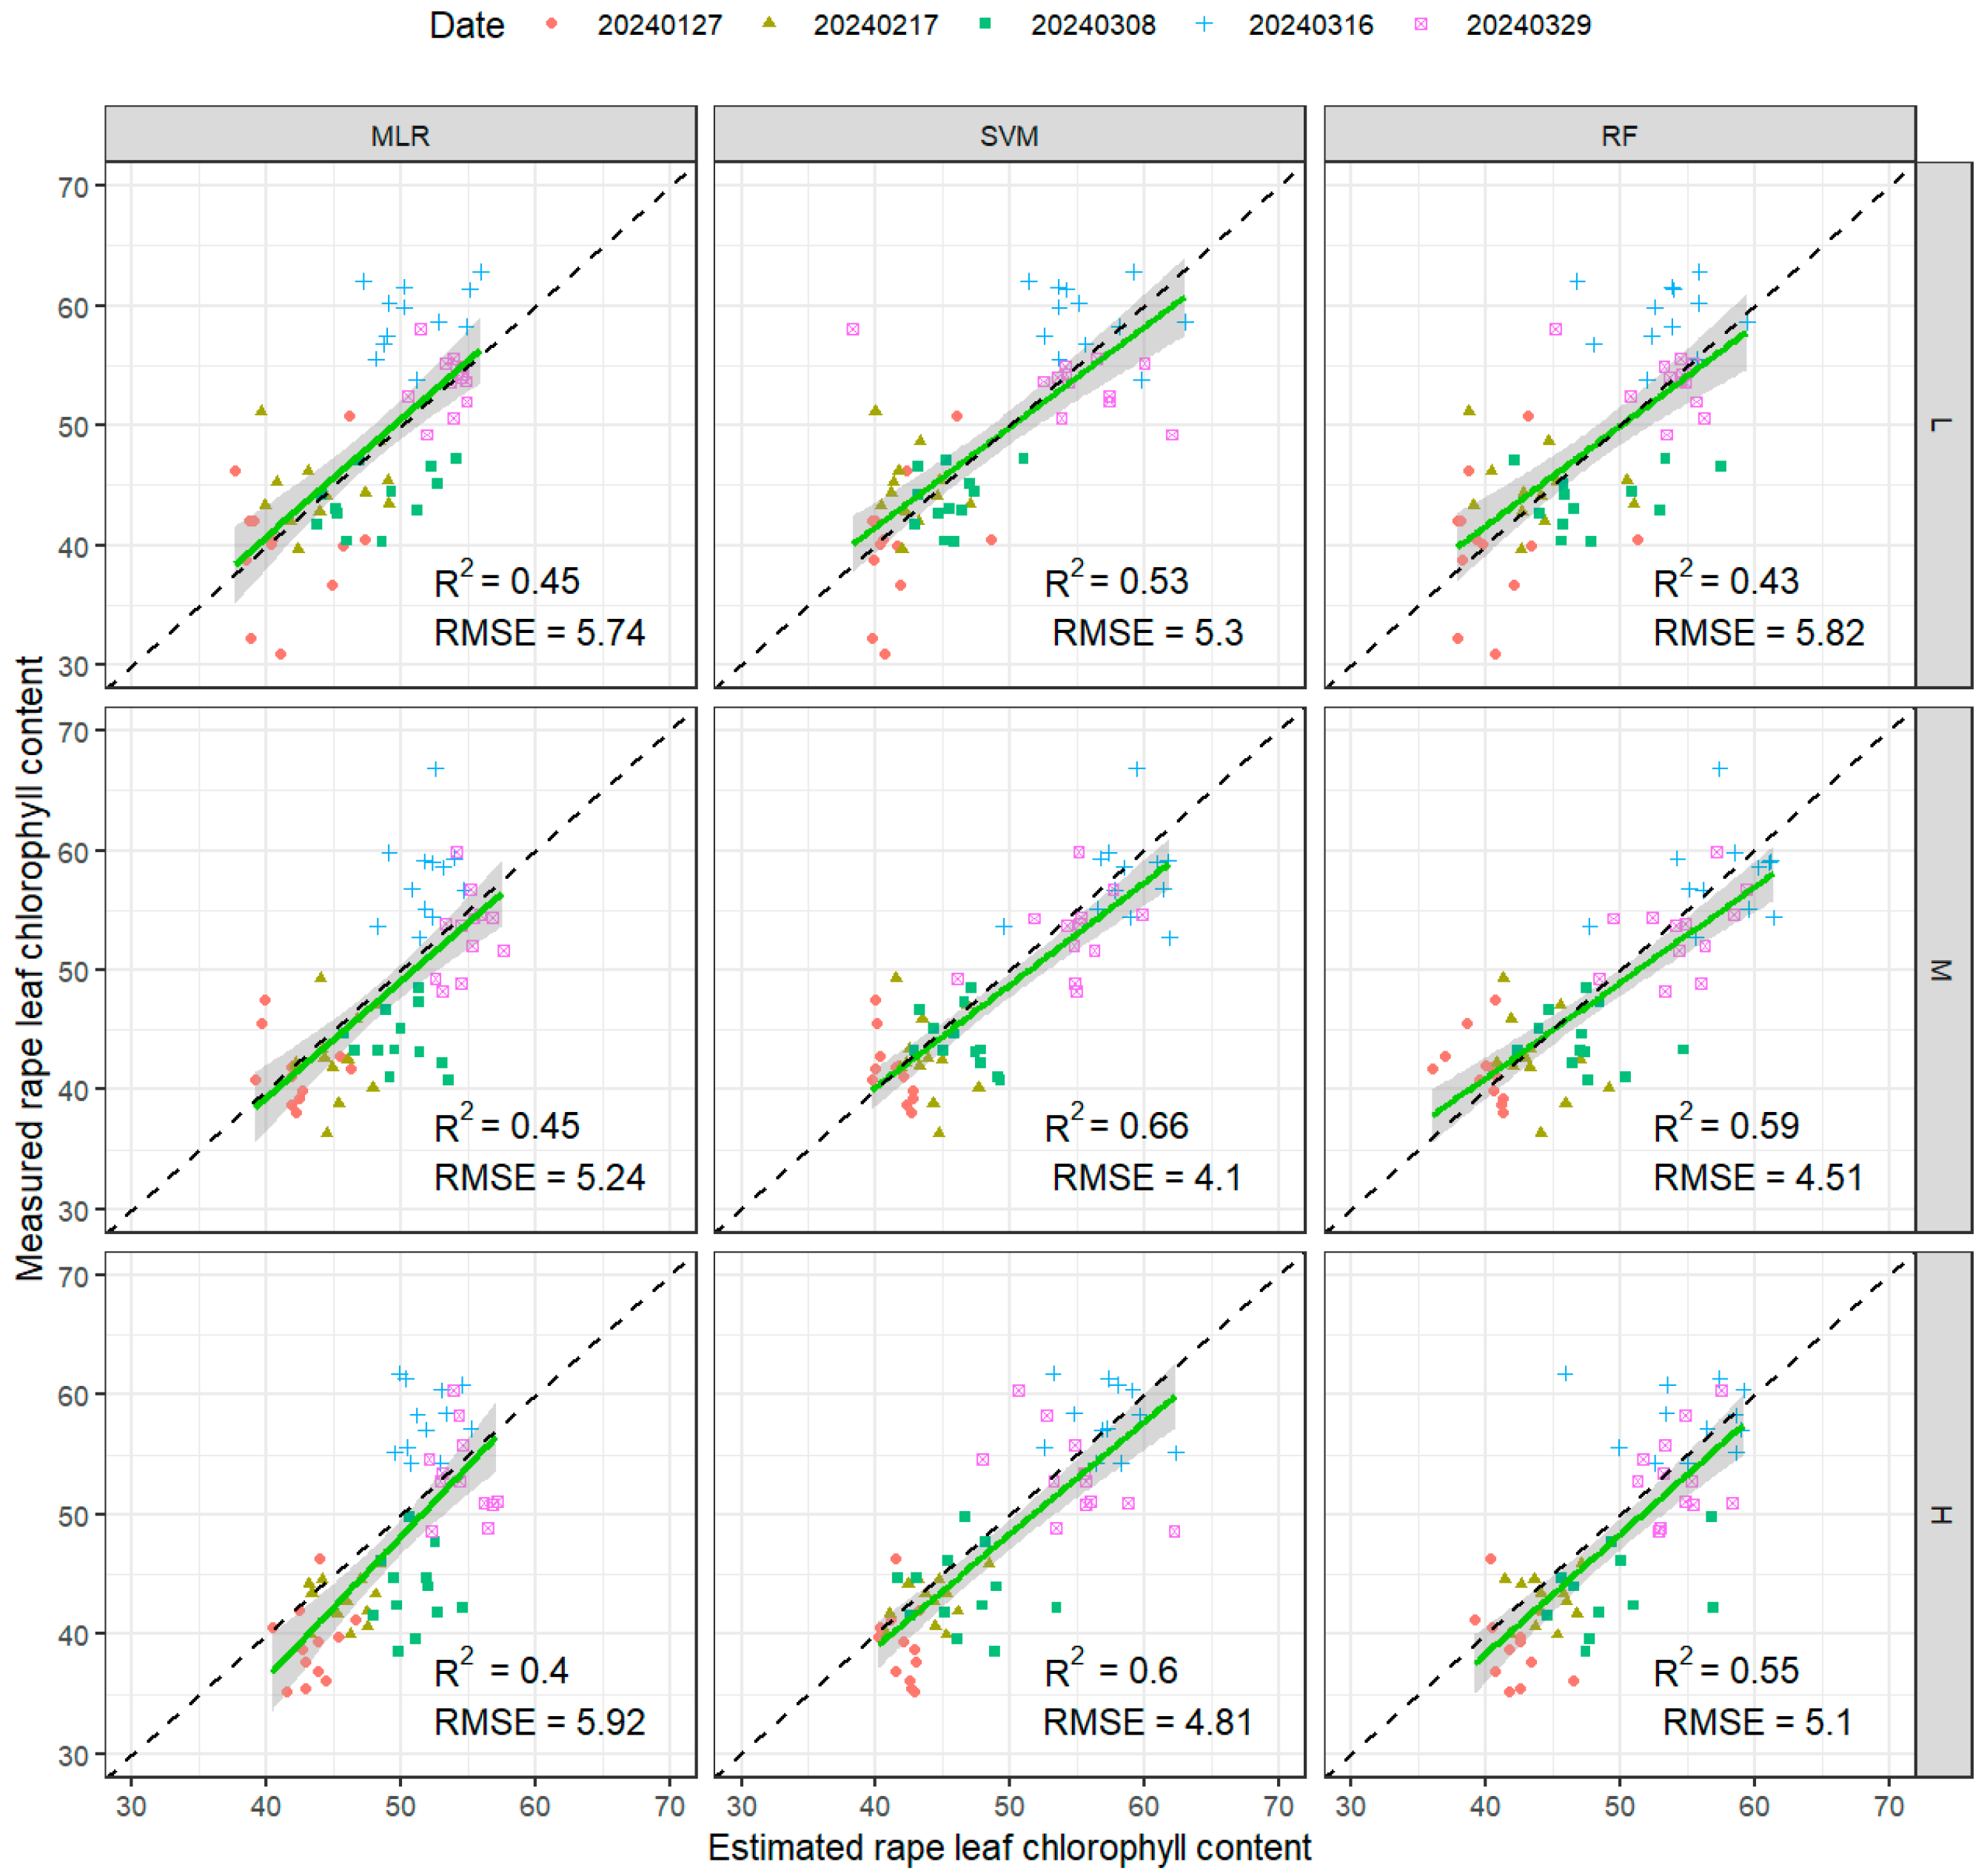
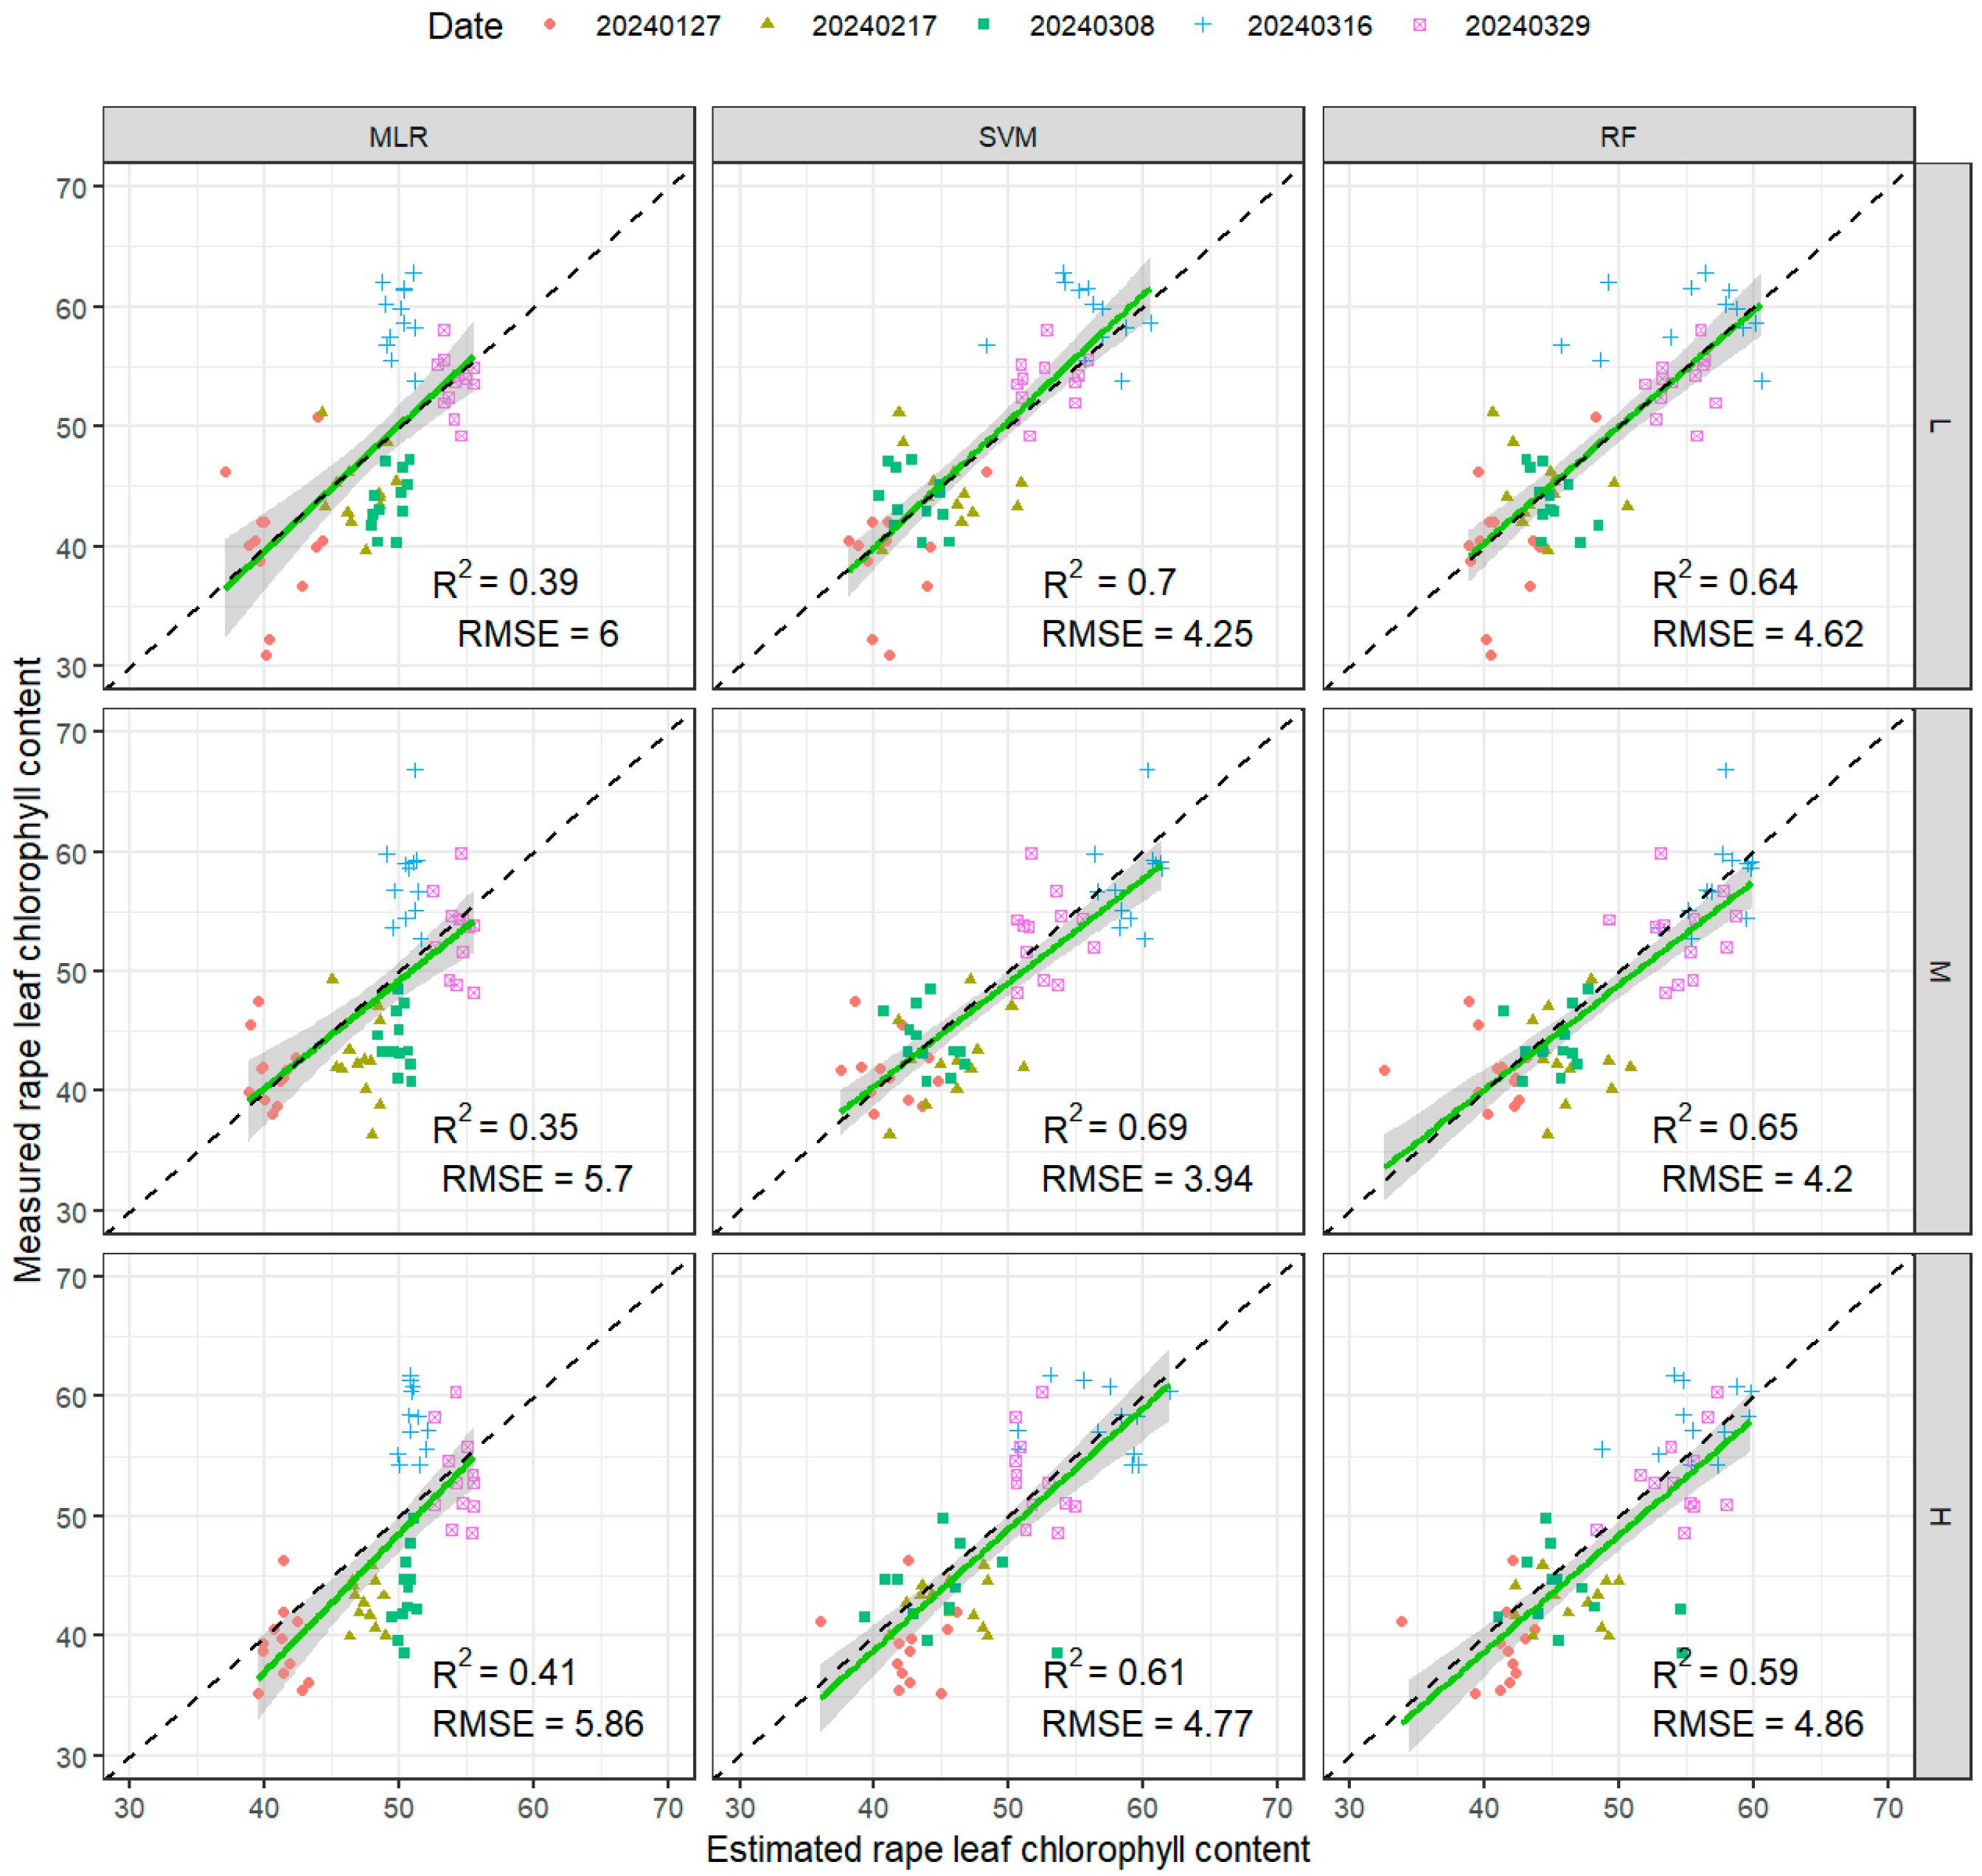
In addition to the enhancement of LCC estimation accuracy, the model’s applicability for different planting densities was enhanced. As shown in Figure 9 and Figure 10, when the established model was used to estimate rape LCC under different planting densities based on the validation dataset, a higher estimation performance was also observed for spectral indices extracted with background removal, especially under low planting density. Specifically, taking the SVM model as an example, the R2 was increased by 0.17 and the RMSE was decreased by 0.49 under the low planting density of 11.25 g/m2 when the soil background was removed during the extraction of spectral indices. For the moderate planting density of 18.75 g/m2, the R2 was increased by 0.03 and the RMSE was decreased by 0.16. The smallest enhancement was observed for a high planting density of 26.26 g/m2, with an increase of 0.01 in R2 and decrease of 0.04 in RMSE. This phenomenon was reasonable because the lower the planting density, the higher the percentage of soil background, resulting in a greater influence on the spectral indices.

4.3. Application Potential and Limitations

Overall, although spectral indices extracted without background removal could be used to estimate rape LCC, background removal could improve the estimation accuracy and the model’s applicability for different planting densities, especially under low planting density. Compared to MLR and RF, the SVM algorithm was better for accurately and stably estimating rape LCC under various FVC levels. Combined with the spatial–temporal advantages of UAV remote sensing technology for crop information acquisition, the optimal rape LCC estimation model established in this study could guide precise field management. For example, in the practical rape planting scenario, nitrogen fertilizer should be applied after the overwintering stage to guarantee that the growth needs in the stem elongation stage are met. Because of the close relationship with crop nitrogen nutrition status, accurately estimating rape LCC at the overwintering stage could provide important information for precise nitrogen fertilizer management. The LCC map could be converted into a nitrogen fertilizer prescription map based on the relationship between chlorophyll content and nitrogen fertilizer supply. In the future, translating the LCC into the nitrogen fertilizer requirement should be an important research topic. In addition, the different FVC levels in this study were caused by different planting densities and growth stages; more factors (such as nitrogen stress and water stress) should be considered in the future to further enhance the stability of the rape LCC estimation model.

5. Conclusions

In this study, the impact of soil background on spectral indices was explored to enhance the accuracy of UAV-based LCC estimation models and their applicability. The results show that, at each growth stage, when the plant density was taken as the factor, an insignificant difference was observed for the ground measured LCC, and significant differences could be observed for most of the spectral indices extracted without soil background removal except for the flowering stage. The different soil background percentages (namely the different FVC levels) impacted the spectral indices. The above impacts could be eliminated by removing soil background pixels. The A channel had the highest correlation with rape LCC whether or not the soil background was removed. A higher LCC estimation performance was observed for spectral indices extracted with background removal. In addition, the applicability of the LCC estimation model for different rape planting densities was enhanced, especially for low planting density. These findings provide a reference for the rapid and non-destructive estimation of rape LCC based on the low-cost UAV RGB platform, and indicates a way to enhance the accuracy and applicability of UAV-based LCC estimation models.

Author Contributions

Conceptualization, Y.N., A.W. and L.Z.; funding acquisition, L.X. (Lizhang Xu) and L.Z.; methodology, Y.N., L.X. (Longfei Xu) and L.Z.; project administration, L.X. (Lizhang Xu); supervision, Q.Z.; validation, S.H.; writing—original draft, Y.N. and L.Z.; writing—review and editing, Y.Z., L.X. (Lizhang Xu), Q.Z., A.W. and S.H. All authors have read and agreed to the published version of the manuscript.

Funding

This work was financially supported by the National Natural Science Foundation of China (No. 32401695, 52309051), the Natural Science Foundation of Jiangsu Province (No. BK20240878, BK20230548), the Science and Technology Major Project of Anhui Province (202203a06020025), and the China Postdoctoral Science Foundation (No. 2024M751186, No. 2024M751188).

Data Availability Statement

The original contributions presented in this study are included in the article. Further inquiries can be directed to the corresponding authors.

Acknowledgments

The authors are thankful to all those who provided valuable suggestions for this research.

Conflicts of Interest

The authors declare that they have no known competing financial interests or personal relationships that could have appeared to influence the work reported in this paper.

References

  1. Lu, C.; Napier, J.A.; Clemente, T.E.; Cahoon, E.B. New frontiers in oilseed biotechnology: Meeting the global demand for vegetable oils for food, feed, biofuel, and industrial applications. Curr. Opin. Biotechnol. 2011, 22, 252–259. [Google Scholar] [CrossRef] [PubMed]
  2. Marchand, L.; Pelosi, C.; González-Centeno, M.R.; Maillard, A.; Ourry, A.; Galland, W.; Teissedre, P.-L.; Bessoule, J.-J.; Mongrand, S.; Morvan-Bertrand, A.; et al. Trace element bioavailability, yield and seed quality of rapeseed (Brassica napus L.) modulated by biochar incorporation into a contaminated technosol. Chemosphere 2016, 156, 150–162. [Google Scholar] [CrossRef]
  3. Rathke, G.W.; Behrens, T.; Diepenbrock, W. Integrated nitrogen management strategies to improve seed yield, oil content and nitrogen efficiency of winter oilseed rape (Brassica napus L.): A review. Agric. Ecosyst. Environ. 2006, 117, 80–108. [Google Scholar] [CrossRef]
  4. Miao, Y.; Stewart, B.A.; Zhang, F. Long-term experiments for sustainable nutrient management in China. A review. Agron. Sustain. Dev. 2011, 31, 397–414. [Google Scholar] [CrossRef]
  5. Zhao, B.-Z.; Zhang, J.-B.; Flury, M.; Zhu, A.-N.; Jiang, Q.-A.; Bi, J.-W. Groundwater Contamination with NO3-N in a Wheat-Corn Cropping System in the North China Plain. Pedosphere 2007, 17, 721–731. [Google Scholar] [CrossRef]
  6. Fernandes, F.M.; Soratto, R.P.; Fernandes, A.M.; Souza, E.F.C. Chlorophyll meter-based leaf nitrogen status to manage nitrogen in tropical potato production. Agron. J. 2021, 113, 1733–1746. [Google Scholar] [CrossRef]
  7. Bian, M.; Ma, Y.; Fan, Y.; Chen, Z.; Yang, G.; Feng, H. Estimation of Potato Chlorophyll Content Based on UAV Multi-source Sensor. Trans. Chin. Soc. Agric. Mach. 2023, 54, 240–248. [Google Scholar]
  8. Maimaitijiang, M.; Sagan, V.; Sidike, P.; Daloye, A.M.; Erkbol, H.; Fritschi, F.B. Crop monitoring using satellite/UAV data fusion and machine learning. Remote Sens. 2020, 12, 1357. [Google Scholar] [CrossRef]
  9. Yin, H.; Huang, W.; Li, F.; Yang, H.; Li, Y.; Hu, Y.; Yu, K. Multi-temporal UAV Imaging-Based Mapping of Chlorophyll Content in Potato Crop. PFG—J. Photogramm. Remote Sens. Geoinf. Sci. 2023, 91, 91–106. [Google Scholar] [CrossRef]
  10. Wahab, I.; Hall, O.; Jirström, M. Remote Sensing of Yields: Application of UAV Imagery-Derived NDVI for Estimating Maize Vigor and Yields in Complex Farming Systems in Sub-Saharan Africa. Drones 2018, 2, 28. [Google Scholar] [CrossRef]
  11. Zhang, H.; Tang, Z.; Wang, B.; Kan, H.; Sun, Y.; Qin, Y.; Meng, B.; Li, M.; Chen, J.; Lv, Y. A 250m annual alpine grassland AGB dataset over the Qinghai-Tibetan Plateau (2000–2019) based on in-situ measurements, UAV images, and MODIS Data. Earth Syst. Sci. Data Discuss. 2022, 15, 821–846. [Google Scholar] [CrossRef]
  12. Zhao, X.; Li, Y.; Chen, Y.; Qiao, X.; Qian, W. Water Chlorophyll a Estimation Using UAV-Based Multispectral Data and Machine Learning. Drones 2023, 7, 2. [Google Scholar] [CrossRef]
  13. Sun, Q.; Gu, X.; Chen, L.; Xu, X.; Wei, Z.; Pan, Y.; Gao, Y. Monitoring maize canopy chlorophyll density under lodging stress based on UAV hyperspectral imagery. Comput. Electron. Agric. 2022, 193, 106671. [Google Scholar] [CrossRef]
  14. Kang, Y.S.; Ryu, C.S.; Cho, J.G.; Park, K.S. Predicting Apple Tree Macronutrients Using Unmanned Aerial Vehicle-Based Hyperspectral Imagery to Manage Apple Orchard Nutrients. Drones 2024, 8, 369. [Google Scholar] [CrossRef]
  15. Fu, B.; Li, S.; Lao, Z.; Yuan, B.; Liang, Y.; He, W.; Sun, W.; He, H. Multi-sensor and multi-platform retrieval of water chlorophyll a concentration in karst wetlands using transfer learning frameworks with ASD, UAV, and Planet CubeSate reflectance data. Sci. Total Environ. 2023, 901, 165963. [Google Scholar] [CrossRef]
  16. Wang, Y.; Yang, Z.; Gert, K.; Khan, H.A. The impact of variable illumination on vegetation indices and evaluation of illumination correction methods on chlorophyll content estimation using UAV imagery. Plant Methods 2023, 19, 51. [Google Scholar] [CrossRef]
  17. Wu, Q.; Zhang, Y.; Zhao, Z.; Xie, M.; Hou, D. Estimation of Relative Chlorophyll Content in Spring Wheat Based on Multi-Temporal UAV Remote Sensing. Agronomy 2023, 13, 211. [Google Scholar] [CrossRef]
  18. Narmilan, A.; Gonzalez, F.; Salgadoe, A.S.A.; Kumarasiri, U.W.L.M.; Weerasinghe, H.A.S.; Kulasekara, B.R. Predicting Canopy Chlorophyll Content in Sugarcane Crops Using Machine Learning Algorithms and Spectral Vegetation Indices Derived from UAV Multispectral Imagery. Remote Sens. 2022, 14, 1140. [Google Scholar] [CrossRef]
  19. Jay, S.; Baret, F.; Dutartre, D.; Malatesta, G.; Héno, S.; Comar, A.; Weiss, M.; Maupas, F. Exploiting the centimeter resolution of UAV multispectral imagery to improve remote-sensing estimates of canopy structure and biochemistry in sugar beet crops. Remote Sens. Environ. 2019, 231, 110898. [Google Scholar] [CrossRef]
  20. Chen, J.; Yi, S.; Qin, Y.; Wang, X. Improving estimates of fractional vegetation cover based on UAV in alpine grassland on the Qinghai–Tibetan Plateau. Int. J. Remote Sens. 2016, 37, 1922–1936. [Google Scholar] [CrossRef]
  21. Zhang, D.; Mansaray, L.R.; Jin, H.; Sun, H.; Kuang, Z.; Huang, J. A universal estimation model of fractional vegetation cover for different crops based on time series digital photographs. Comput. Electron. Agric. 2018, 151, 93–103. [Google Scholar] [CrossRef]
  22. Niu, Y.; Zhang, H.; Han, W.; Zhang, L.; Chen, H. A Fixed-Threshold Method for Estimating Fractional Vegetation Cover of Maize under Different Levels of Water Stress. Remote Sens. 2021, 13, 1009. [Google Scholar] [CrossRef]
  23. Gitelson, A.A.; Kaufman, Y.J.; Stark, R.; Rundquist, D. Novel algorithms for remote estimation of vegetation fraction. Remote Sens. Environ. 2002, 80, 76–87. [Google Scholar] [CrossRef]
  24. Hague, T.; Tillett, N.D.; Wheeler, H. Automated crop and weed monitoring in widely spaced cereals. Precis. Agric. 2006, 7, 21–32. [Google Scholar] [CrossRef]
  25. Tucker, C.J. Red and photographic infrared linear combinations for monitoring vegetation. Remote Sens. Environ. 1979, 8, 127–150. [Google Scholar] [CrossRef]
  26. Woebbecke, D.M.; Meyer, G.E.; Von Bargen, K.; Mortensen, D.A. Color indices for weed identification under various soil, residue, and lighting conditions. Trans. ASAE 1995, 38, 259–269. [Google Scholar] [CrossRef]
  27. Meyer, G.E.; Neto, J.C. Verification of color vegetation indices for automated crop imaging applications. Comput. Electron. Agric. 2008, 63, 282–293. [Google Scholar] [CrossRef]
  28. Gamon, J.A.; Surfus, J.S. Assessing leaf pigment content and activity with a reflectometer. New Phytol. 1999, 143, 105–117. [Google Scholar] [CrossRef]
  29. Hunt, E.R.; Cavigelli, M.; Daughtry, C.S.T.; McMurtrey, J.E.; Walthall, C.L. Evaluation of digital photography from model aircraft for remote sensing of crop biomass and nitrogen status. Precis. Agric. 2005, 6, 359–378. [Google Scholar] [CrossRef]
  30. Wu, Q.; Sun, H.; Li, M.-z.; Song, Y.-y.; Zhang, Y.-e. Research on maize multispectral image accurate segmentation and chlorophyll index estimation. Spectrosc. Spectr. Anal. 2015, 35, 178–183. [Google Scholar]
  31. Qiao, L.; Gao, D.; Zhang, J.; Li, M.; Sun, H.; Ma, J. Dynamic Influence Elimination and Chlorophyll Content Diagnosis of Maize Using UAV Spectral Imagery. Remote Sens. 2020, 12, 2650. [Google Scholar] [CrossRef]
  32. Zhou, L.; Nie, C.; Su, T.; Xu, X.; Song, Y.; Yin, D.; Liu, S.; Liu, Y.; Bai, Y.; Jia, X.; et al. Evaluating the Canopy Chlorophyll Density of Maize at the Whole Growth Stage Based on Multi-Scale UAV Image Feature Fusion and Machine Learning Methods. Agriculture 2023, 13, 895. [Google Scholar] [CrossRef]
  33. Han, M.; Zhang, H.; DeJonge, K.C.; Comas, L.H.; Gleason, S. Comparison of three crop water stress index models with sap flow measurements in maize. Agric. Water Manag. 2018, 203, 366–375. [Google Scholar] [CrossRef]
  34. Qiao, L.; Tang, W.; Gao, D.; Zhao, R.; An, L.; Li, M.; Sun, H.; Song, D. UAV-based chlorophyll content estimation by evaluating vegetation index responses under different crop coverages. Comput. Electron. Agric. 2022, 196, 106775. [Google Scholar] [CrossRef]
Figure 1. UAV image of experimental field (a), experimental design (b), location of sampling sites in each field plot (c), and image of the ground control points (d).
Drones 08 00578 g001
Figure 2. Workflow for analyzing the impact of soil background pixels on the performance of the rape leaf chlorophyll content (LCC) model. SI: spectral index.
Drones 08 00578 g002
Figure 3. Response of rape fractional vegetation coverage to planting density on each collection date. L, M, and H represent the low (11.25 g/m2), moderate (18.75 g/m2), and high (26.26 g/m2) planting densities, respectively. ANOVA: analysis of variance. ****, ***, and ** represent p values less than or equal to 0.0001, 0.001, and 0.01, respectively.
Drones 08 00578 g003
Figure 4. Response of rape leaf chlorophyll content (SPAD) to planting density on each collection date. ns: p > 0.05.
Drones 08 00578 g004
Figure 5. Coefficients of the correlation (r) between rapeseed leaf chlorophyll content and each spectral index. (a) Spectral indices were extracted without background removal; (b) spectral indices were extracted after background removal.
Drones 08 00578 g005
Figure 6. Rape leaf chlorophyll content estimation results obtained based on UAV RGB-derived spectral indices and machine leaning regression algorithms. Before or after indicates that the soil background pixels were not or were removed during the extraction of spectral indices. MLR, RF and SVM represent multivariate linear regression, random forest and support vector machine algorithms.
Drones 08 00578 g006
Figure 7. Response of A channel directly extracted from UAV RGB images to planting density on each collection date. ****, ***, and * represent p values less than or equal to 0.0001, 0.001, and 0.05, respectively. ns: p > 0.05.
Drones 08 00578 g007
Figure 8. Response of A channel extracted from UAV RGB images with background removal to planting density on each collection date. * represent p values less than or equal to 0.05. ns: p > 0.05.
Drones 08 00578 g008
Figure 9. Rape leaf chlorophyll content estimation results obtained based on spectral indices which were extracted without background removal during the model validation process.
Drones 08 00578 g009
Figure 10. Rape leaf chlorophyll content estimation results obtained based on spectral indices which were extracted after background removal during the model validation process.
Drones 08 00578 g010
Table 1. Spectral indices selected in this study.
Spectral IndexEquation
Visible atmospherically resistant index [23] V A R I = ( G R ) / ( G + R B )
Vegetative index [24] V E G = G / ( R 0.667 B ( 1 0.667 ) )
Green–red vegetation index [25] G R V I = ( R G ) / ( R + G )
Excess green index [26] E x G = 2 G R B
Excess G minus excess red index [27] E x G R = 3 G 2.4 R B
Red–green ratio index [28] R G R I = R / G
Normalized blue–red difference index [23] N G R D I = ( G R ) / ( G + R )
Normalized blue–green difference index [29] N G B D I = ( G B ) / ( G + B )
Table 2. One-way ANOVA of spectral indices by taking planting density as the factor. Before or after indicates that the soil background pixels were not or were removed during the extraction of spectral indices. ****, ***, **, and * represent p values less than or equal to 0.0001, 0.001, 0.01, and 0.05, respectively. ns: p > 0.05.
Spectral Index2024-01-272024-02-272024-03-082024-03-162024-03-29
BeforeAfterBeforeAfterBeforeAfterBeforeAfterBeforeAfter
H channel****ns****ns*********nsnsns
A channel********ns***ns*nsnsns
VARI*****ns**************nsns
RGRI*******ns*****************ns
NGBDI************************nsns
NGRDI*******ns*****************ns
GRVI*******ns*****************ns
ExG*******ns**nsnsnsnsns
ExGR*********ns****ns**nsnsns
VEG*********ns******************ns
Disclaimer/Publisher’s Note: The statements, opinions and data contained in all publications are solely those of the individual author(s) and contributor(s) and not of MDPI and/or the editor(s). MDPI and/or the editor(s) disclaim responsibility for any injury to people or property resulting from any ideas, methods, instructions or products referred to in the content.