Article

Using Unmanned Aerial Systems Technology to Characterize the Dynamics of Small-Scale Maize Production Systems for Precision Agriculture

1
Department of Agronomy, Iowa State University, 1009 Agronomy Hall, Ames, IA 50011, USA
2
Iowa Soybean Association, 1255 SW Prairie Trail Parkway, Ankeny, IA 50023, USA
3
Corteva Agriscience, 329 York Ave, Morton, IL 61550, USA
4
Department of Soil Science, Faculty of Agriculture, Food and Consumer Sciences, Nyankpala Campus, University for Development Studies, Tamale P.O. Box TL 1882, Ghana
5
Indigo AG, Inc., 500 Rutherford Ave, Ste 201, Charlestown, MA 02129, USA
*
Author to whom correspondence should be addressed.
Drones 2024, 8(11), 633; https://doi.org/10.3390/drones8110633
Submission received: 24 September 2024 / Revised: 25 October 2024 / Accepted: 28 October 2024 / Published: 1 November 2024
(This article belongs to the Special Issue UAS in Smart Agriculture: 2nd Edition)

Abstract

:
Precision agriculture (PA) utilizes spatial and temporal variability to improve the sustainability and efficiency of farming practices. This study used high-resolution imagery from UAS to evaluate maize yield variability across three fields in Ghana: Sombolouna, Tilli, and Yendi, exploiting the potential of UAS technology in PA. Initially, excess green index (EGI) classification was used to differentiate between bare soil, dead vegetation, and thriving vegetation, including maize and weeds. Thriving vegetation was further classified into maize and weeds, and their corresponding rasters were developed. Normal difference red edge (NDRE) was applied to assess maize health. The Jenks natural breaks algorithm classified maize rasters into low, medium, and high differential yield zones (DYZs). The percentage of bare spaces, maize, weed coverages, and total maize production was determined. Significant variations in field conditions showed Yendi had 34% of its field as bare, Tilli had the highest weed coverage at 22%, and Sombolouna had the highest maize crop coverage at 73.9%. Maize yields ranged from 860 kg ha−1 in the low DYZ to 4900 kg ha−1 in the high DYZ. Although yields in Sombolouna and Tilli were similar, both fields significantly outperformed Yendi. Scenario analysis suggested that enhancing management practices to elevate low DYZs to medium levels could increase production by 2.1%, while further improvements to raise low and medium DYZs to high levels could boost productivity by up to 20%.

1. Introduction

Precision agriculture (PA) is increasingly appealing as a viable option for meeting the food demands of a growing global population [1] and environmental sustainability [2]. This is especially significant in Africa, where achieving continuous agricultural growth requires the effective use of resources, which emphasizes the crucial need for the complete adoption of PA [3]. As proposed by [4], a comprehensive definition of PA is: “a management strategy that uses electronic information and other technologies to gather, process, and analyze spatial and temporal data to guide targeted actions that improve efficiency, productivity, and sustainability of agricultural operations”. This definition combines information and technology-based farm management systems that identify, analyze, and protect land resources [5].
Historically, PA was developed in the 1980s and 1990s, primarily for large-scale industrial farming in developed countries. PA was driven by advancements in GPS, geographic information systems (GIS), and variable-rate technologies (VRT), allowing farmers to apply inputs like fertilizers and water more efficiently by monitoring variations in soil conditions and crop health [6]. However, small-scale farming systems in Africa and the developing world faced several key barriers during this period. The high costs of PA technologies presented a significant challenge. Tools such as GPS-guided tractors, yield monitors, and drones were unaffordable for smallholder farmers, who often operate with limited financial resources. Also, as noted by [4], the initial phase of PA focused on large, mechanized farms in developed countries, leaving smallholder farms behind.
A significant barrier to the development of PA in Subsaharan Africa has been the limited access to essential infrastructure, such as electricity, internet connectivity, and data management systems, which are critical for the effective operation of PA tools. In rural parts of Africa and the developing world, poor infrastructure and limited technical expertise prevented the widespread adoption of PA. Researchers such as [7] emphasized that these gaps in infrastructure exacerbated the digital divide, further marginalizing smallholder farmers from the benefits of PA. Low literacy rates and minimal training in digital literacy also limited the capacity of smallholder farmers to use these tools effectively [8].
PA has recently gained traction in small-scale farming systems in Africa and other developing regions. This is mainly due to the introduction of cost-effective, accessible technologies tailored to the needs of smallholder farmers. The rapid growth of mobile phone penetration has become a game-changer for small-scale farmers. Digital platforms like M-Farm in Kenya and Farmsio in India now allow farmers to access real-time data on crop prices, weather forecasts, and farming advisory services, all through mobile devices [9].
The development of low-cost sensor technologies has revolutionized the ability of smallholder farmers to adopt PA. Soil moisture sensors and portable nutrient testing kits are now more affordable and user-friendly. Smallholders can use these tools to monitor their fields and make decisions on input management, such as fertilizer application and irrigation scheduling [10]. These innovations have positively affected small-scale farming systems’ yields and resource use efficiency.
The use of remote sensing, through satellite imagery and drones, has also contributed to the increased adoption of PA in small-scale systems. These technologies enable farmers to monitor crop health, soil moisture, and yield potential without expensive on-ground sensors [11]. CGIAR’s GeoFarmer platform, for instance, is helping smallholder farmers in Africa access satellite imagery for precision decision making [12]. One significant aspect of PA’s evolution has been designing tools and systems that can be used on smaller, fragmented farms. As stated by Zheng [13], technologies like drone-based imaging, combined with machine learning, can effectively monitor even small plots of land. These tools allow farmers to assess variability across their fields and target specific areas with precise inputs.
The PA concept recognizes spatial variations in soil properties, crop performance, and yields with an attempt to identify the spatial location and extent of these variations [14]. The goal of efficient farming systems is to decrease variability in managing and optimizing the inherent spatial and temporal differences within a field, as suggested by [2,15,16,17]. In these studies, fields are managed by classifying fields into regions of broad similarity referred to as soil management zones (SMZ), defined by [18] as subregions with similar combinations of yield-limiting factors within a field. Individual subregions can be managed uniformly using a single set of management practices [19], which can be construed as the underlying principle behind PA. Single, or a combination of data layers can delineate SMZs [20].
To effectively optimize agricultural productivity, it is essential to differentiate between SMZs and differential yield zones (DYZs), as each addresses distinct aspects of field variability. Soil management zones focus on soil properties and their management variations, while DYZs emphasize crop productivity and yield potential variations within the field. SMZs are based on intrinsic properties of the soil, such as nutrient content, pH, and texture. On the contrary, the concept of DYZs is based on observed variations in crop yield over time [21]. DYZ identification aims to recognize consistently high or low productivity areas and tailor management practices [22].
Potential data sources commonly used to define SMZs include topography [23], aerial photographs, and yield maps [24]. Due to its effectiveness in characterizing and mapping out specific surface soil properties, apparent electrical conductivity has become an important data source for delineating SMZs [25,26].
While these methods discussed above have been successfully used to delineate soil management units, remote sensing presents a viable but inexpensive and noninvasive means to delineate SMZs [27]. Traditionally, remote sensing relied on satellite geospatial imagery. However, this data source is often constrained by several factors. First, the low or coarse spatial and temporal resolution of most open-source and commercial multispectral data. This can be more critical in small-scale Subsaharan agricultural systems. The authors in ref. [16] pointed out that low-resolution imagery is insufficient for smallholder farms because it lacks the detail required for site-specific management, a core aspect of precision agriculture. The authors in ref. [28] argued that low-resolution satellite imagery is ineffective in fragmented agricultural landscapes, where small, noncontiguous plots require precise mapping of farm boundaries.
During the past two to three decades, the field of unmanned aerial systems (UAS) has expanded considerably. There has been the development of low-cost observational platforms for agricultural and environmental monitoring [29]. Advancements in sensor attributes such as weight, spectral and radiometric resolutions, and battery autonomy. have facilitated exponential applications of unmanned aerial vehicles (UAV) in agriculture, as they can be easily used to continuously monitor crop growth evolution during the season, even in small-scale farmer fields [30]. Also, UAV-based remote sensing has relatively low operational costs and generates near real-time data to overcome satellite remote sensing. High-resolution imagery can also be obtained using UAS technology due to low flight altitude, according to [31]. More importantly, multispectral, high-spatial-resolution data that can be acquired with UAVs may be combined with satellite data for scale-up applications in large areas [32,33].
Remote sensing has been used to determine spatial patterns in crop performance through spectral vegetation indices (VIs). The normal difference vegetation index (NDVI) is derived based on light intensities reflected from canopies in the visual and near-infrared range [34,35]. This index has enormous potential to derive information on the dynamic changes in different vegetation types. Consequently, NDVI has been a good index for investigating spatial and temporal variations in other vegetation types. However, it has been observed that NDVI saturates when estimating biomass in fully developed canopies [36].
Other VIs have been designed to investigate spatial and temporal variations, including the normalized difference red edge (NDRE), which centers around 740 nanometers [37]. The NDRE is suggested to be the most suitable index to investigate crop growth variation throughout the growing [38]. The EGI is used chiefly to determine greenness [39,40]. The index was used by [41] to differentiate living plant vegetation from background soil and dead vegetation. Researchers, including [42,43,44,45], used this VI to develop strategic weed mapping and management programs.
The primary objective of this research is to develop and validate a straightforward UAS-based protocol to identify, quantify, and characterize spatial variability in maize yields between and within fields while exploring the relationships between yield variations and the spatial distribution of bare areas, weeds, and the target crop. The study aims to assess whether the UAS-based protocol can accurately detect spatial variability in yields, distinguish differences between fields, and correlate these variations within-field factors such as bare areas, weed density, and crop distribution. Additionally, the research emphasizes the implications of these spatial patterns on overall maize productivity, hypothesizing that (1) the UAS-based protocol will accurately detect and quantify spatial variability in maize yields within and between fields, demonstrating a high correlation with traditional yield-monitoring methods and (2) the UAS-based protocol will be effective in distinguishing yield differences between fields by accurately mapping the spatial patterns of weeds, bare areas, and crop density, providing actionable insights for precision management.

2. Materials and Methods

2.1. Study Site

This research was part of the Feed the Future initiative, a global program led by the U.S. Government aimed at combating hunger and improving food security. The study specifically targeted fields of certified seed maize (Zea mays L.) producers located in three areas of Ghana: Sombolouna and Tilli in the Upper East Region and Yendi in the Northern Region (Figure 1), whose site-specific details are provided in Table 1. Sombolouna and Tilli are positioned within the Volta Basin agroecological zone, known for its relatively fertile soils, formed in weathered granite, greenstone, and phyllites. In contrast, Yendi is situated in the Guinea Savanna agroecological zone, characterized by less fertile soils with parent materials rich in iron and aluminum oxides and a mineral composition dominated by quartz [46].

2.2. Unmanned Aerial Systems Technology: Image Capture

A handheld Garmin SD MAP 64sc global positioning system (GPS) was employed to survey the coordinates of producer field boundaries. Subsequently, flight plans for a fixed-wing eBee UAS, a cost-effective agricultural drone. This drone provides an extended flight time of up to 55 min and can cover up to 160 hectares (395 acres). Flight plans were formulated based on the previously ground surveyed GPS coordinates. To ensure uniformity, identical flight plans and parameters (Table 2) were applied to all maize fields in the three aerial surveys conducted in each location during the growing season.

2.3. Image Processing and Spatial Analysis

2.3.1. Creation and Description of Orthomosaics

All images were captured at each maize field’s R2 or blister stage. Every image captured was annotated with GPS coordinates and precision metrics, the latter facilitated by the internal global positioning system of the UAV. The photos were seamlessly combined using the Pix4D mapper software [47], relying on tie points identified in overlapping images. This amalgamation process resulted in the formation of red, green, and blue (RGB) three-dimensional point clouds, representing the surface contours of objects in three-dimensional space [48]. Subsequently, Pix4D software was employed to generate seamless RGB GeoTIFF orthomosaics from these point clouds.

2.3.2. Excess Green Index Classification of Differential Yield Zones

Tree removal from the orthomosaics was a prerequisite to spatial analysis because healthy and nonhealthy tall tree signatures can have confounding effects on the outputs of the subsequent classification of components on the landscape. As a process, the orthomosaics were exported into ArcGIS Pro. Trees were visually identified, and their polygon shape files were created. The ArcGIS Pro ERASE tool manually deleted all tree polygons to create treeless orthomosaics. EGI, the predominant index for assessing greenness [41,42], was used to distinguish between background bare soil, deceased vegetation, and thriving vegetation comprising maize plants and weeds. EGI was calculated using the equation in Table 3, which relies on the normalized values of the green, red, and blue bands obtained from Equations (1)–(3).

2.3.3. Classification and Characterization of EGI

Examining land surface cover dynamics involved a two-step binary classification process using the EGI as input. In the initial classification, entire fields were categorized into bare soil and green vegetation, while the subsequent classification further divided green vegetation into maize crop and weed cover. This binary classification approach employed threshold values, iteratively adjusted between component classes until visual verification validated the accuracy of breaks and boundaries.
The raster was superimposed on the high-resolution RGB orthomosaic, and breaks were fine-tuned until a visual alignment between bare soil and vegetated areas was achieved. Once confirmed, a standalone raster was generated using the reclassify tool in ArcGIS Pro, with the first binarization assigning a value of 1 to vegetation and no data to bare soil. The raster calculator multiplied the original EGI raster by the vegetation raster, yielding a raster of EGI values for vegetation.
Using the earlier methodology, the vegetation EGI raster was binarized in the second classification into maize and weeds. This time, maize was reclassified as 1, and weeds were designated as no data. The ultimate outcomes or products of the EGI classification process were rasters depicting bare soil, maize coverage, and the extent of weed infestation in the fields.
The NDRE was used to evaluate plant health [39]. This index, calculated using the equation in Table 3, resembles NDVI, with the distinction that the red edge band is utilized instead of the red band in the derivation of NDVI.

2.3.4. Identification and Generalization of Differential Yield Zones (DYZs)

Identifying differential yield zones (DYZs) in the three fields involved two steps using the raster calculator. Firstly, maize rasters from the EGI and the NDRE were generated for each field. The resulting NDRE rasters underwent classification using the Jenks natural breaks algorithm [49] based on productivity levels, categorizing them into potentially low, medium, and high DYZs based on crop health [50]. Given the high resolution of imagery collected through the UAS technology (<10 cm/pixel on average), pixel-based maps derived from UAV data contained intricate details impractical for small-scale farmers’ use as a base to make management decisions. Consequently, the need arose to generalize the DYZs while preserving the integrity of the original high-resolution spatial zones.
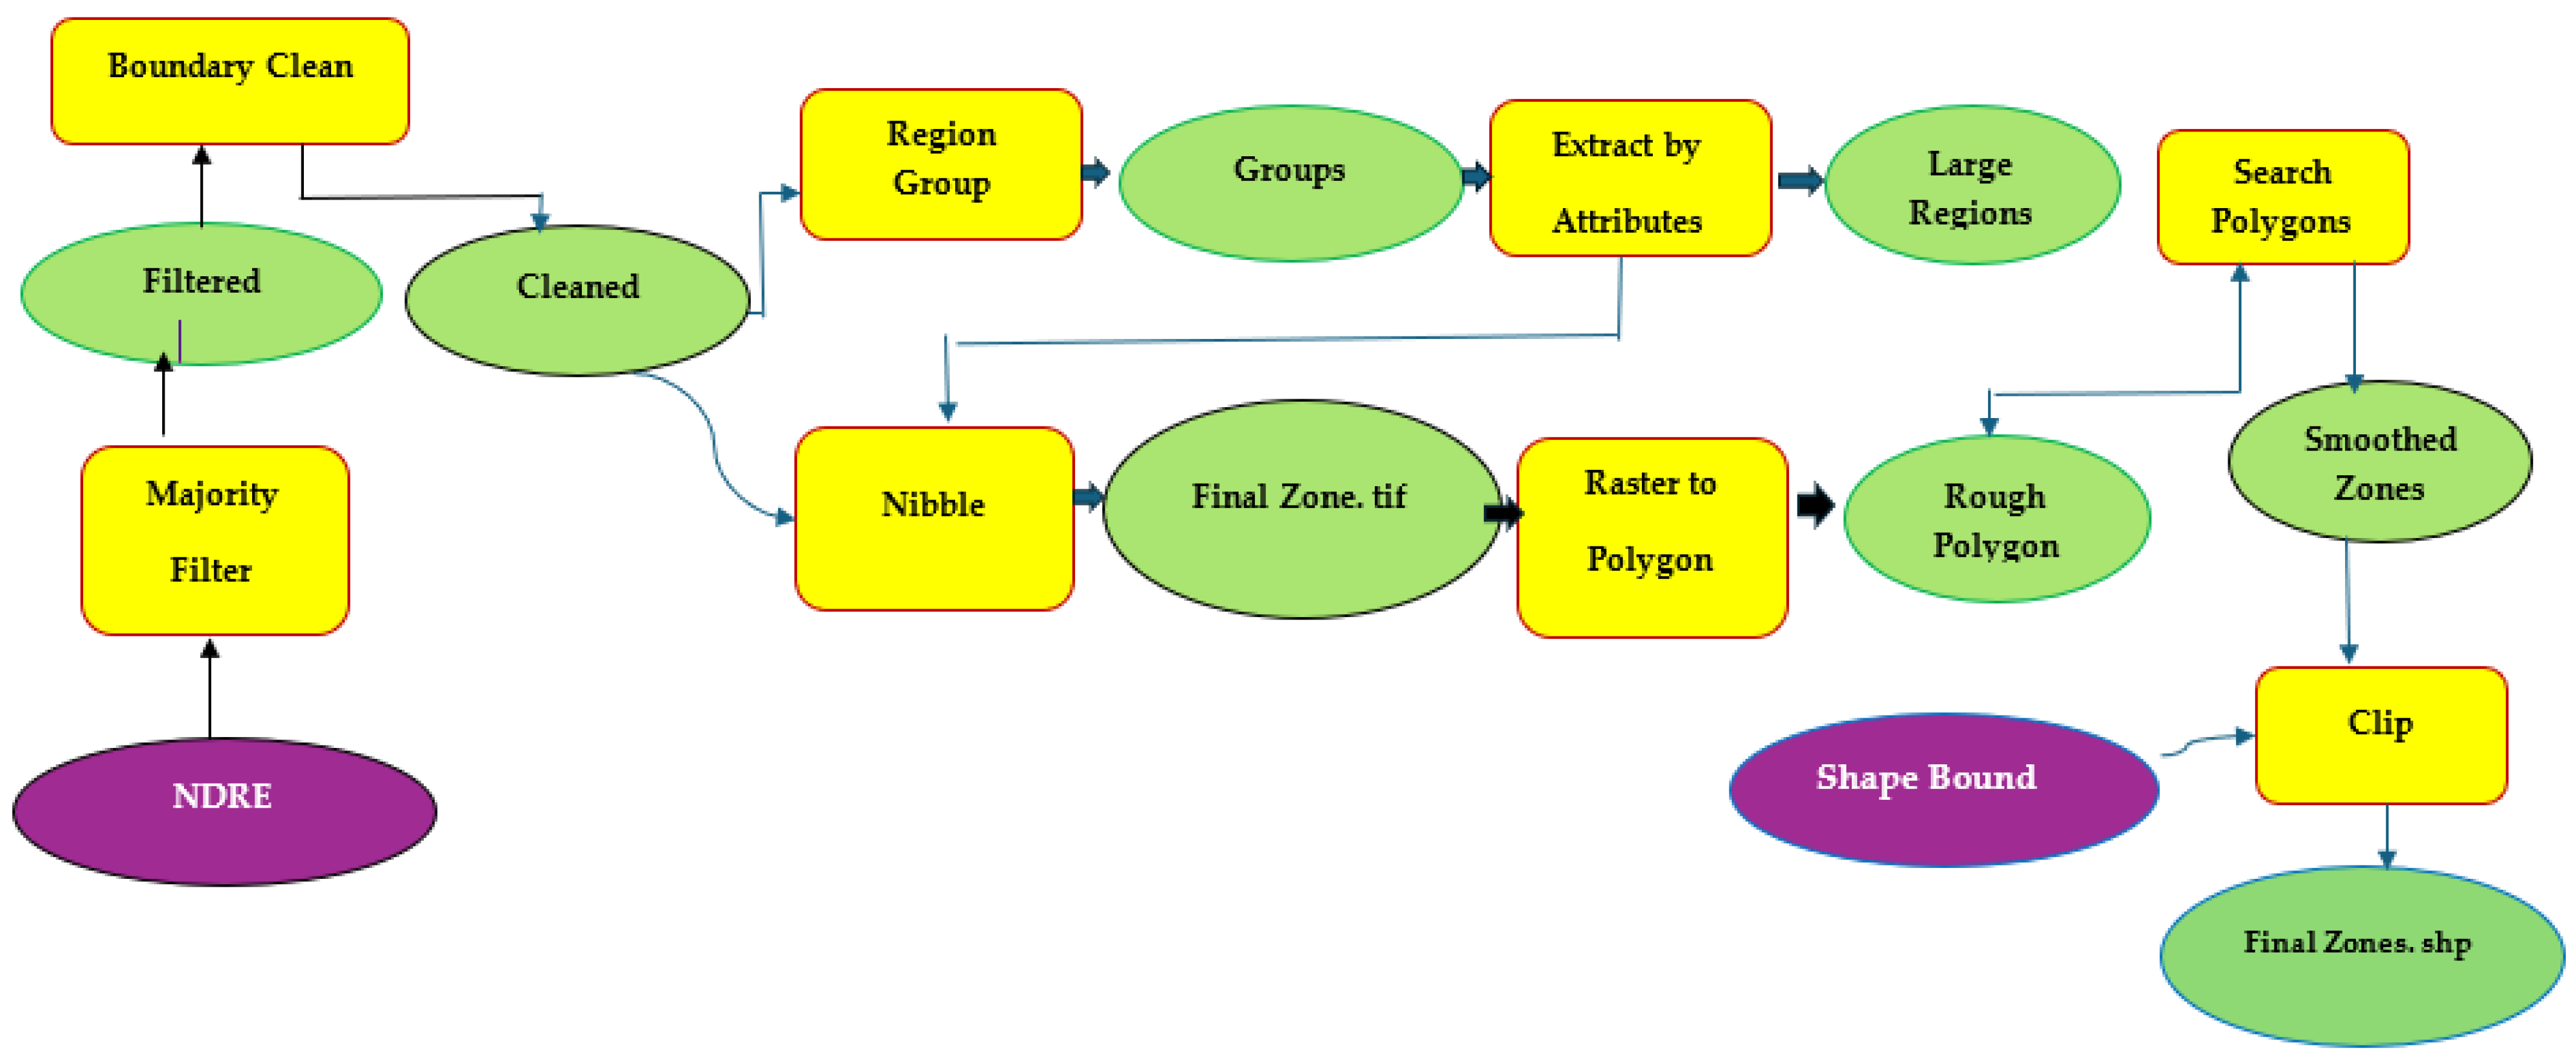
The systematic flow diagram in Figure 2 provides a comprehensive overview of the generalization steps employed.
The GIS zonal statistics tool examined raster maps derived from the classified EGI maps. This analysis calculated the percentages of bare areas, maize plant cover, and weed coverage within each zone based on the generalized maps. In the concluding step, land cover rasters served as the input values, the file containing differential yield zones was utilized to calculate the values, and the resulting output raster consisted of average values for the selected land cover types in each zone.

2.3.5. Maize Plant Population Count and Yield Assessment

Due to the lack of a clear and organized planting plan for maize, initial attempts to use automated methods for determining plant populations were unsuccessful. Consequently, as discussed earlier in this paper, a manual plant counting approach was implemented, utilizing the high-resolution and georectified orthomosaics produced from UAS data. A 0.0064-hectare polygon template was created in ArcGIS and overlaid on corresponding areas within each maize field, aligned with the three zones on the orthomosaics. Maize plants within the polygons were manually counted, and the average count was scaled to a per-hectare basis.
Toward the end of the growing season, three 2 m × 2 m sampling plots were identified within pre-established DYZs in each maize field. Maize plants in subplots were harvested, and cobs were separated from stover. All ears were manually shelled, and kernel weights were recorded. The M3GTM (Dickey-john) device was employed to determine the moisture content of the maize grain at harvest. The final weight of maize grain was obtained by adjusting the field weight to 15% moisture content.

2.3.6. Statistical Analysis

Analysis of variance (ANOVA) was used to test yield differences and mean separations were calculated using Tukey’s studentized range with an alpha of 0.05 differences [51].

2.3.7. Scenario Analysis

The methodology evaluated the stepwise impacts of addressing yield-limiting factors in maize production through environmentally sustainable and profitable land management practices. In the first scenario, it was assumed that all production factors in the lower-yielding zones across all fields would be improved to match the levels of the medium-yield zones. The second scenario applied a similar approach, aiming to enhance production conditions across all fields to reach those of the high-yield zones. Predicted yields for these scenarios were then estimated for all fields.

3. Results

3.1. Orthomosaics and Zonation

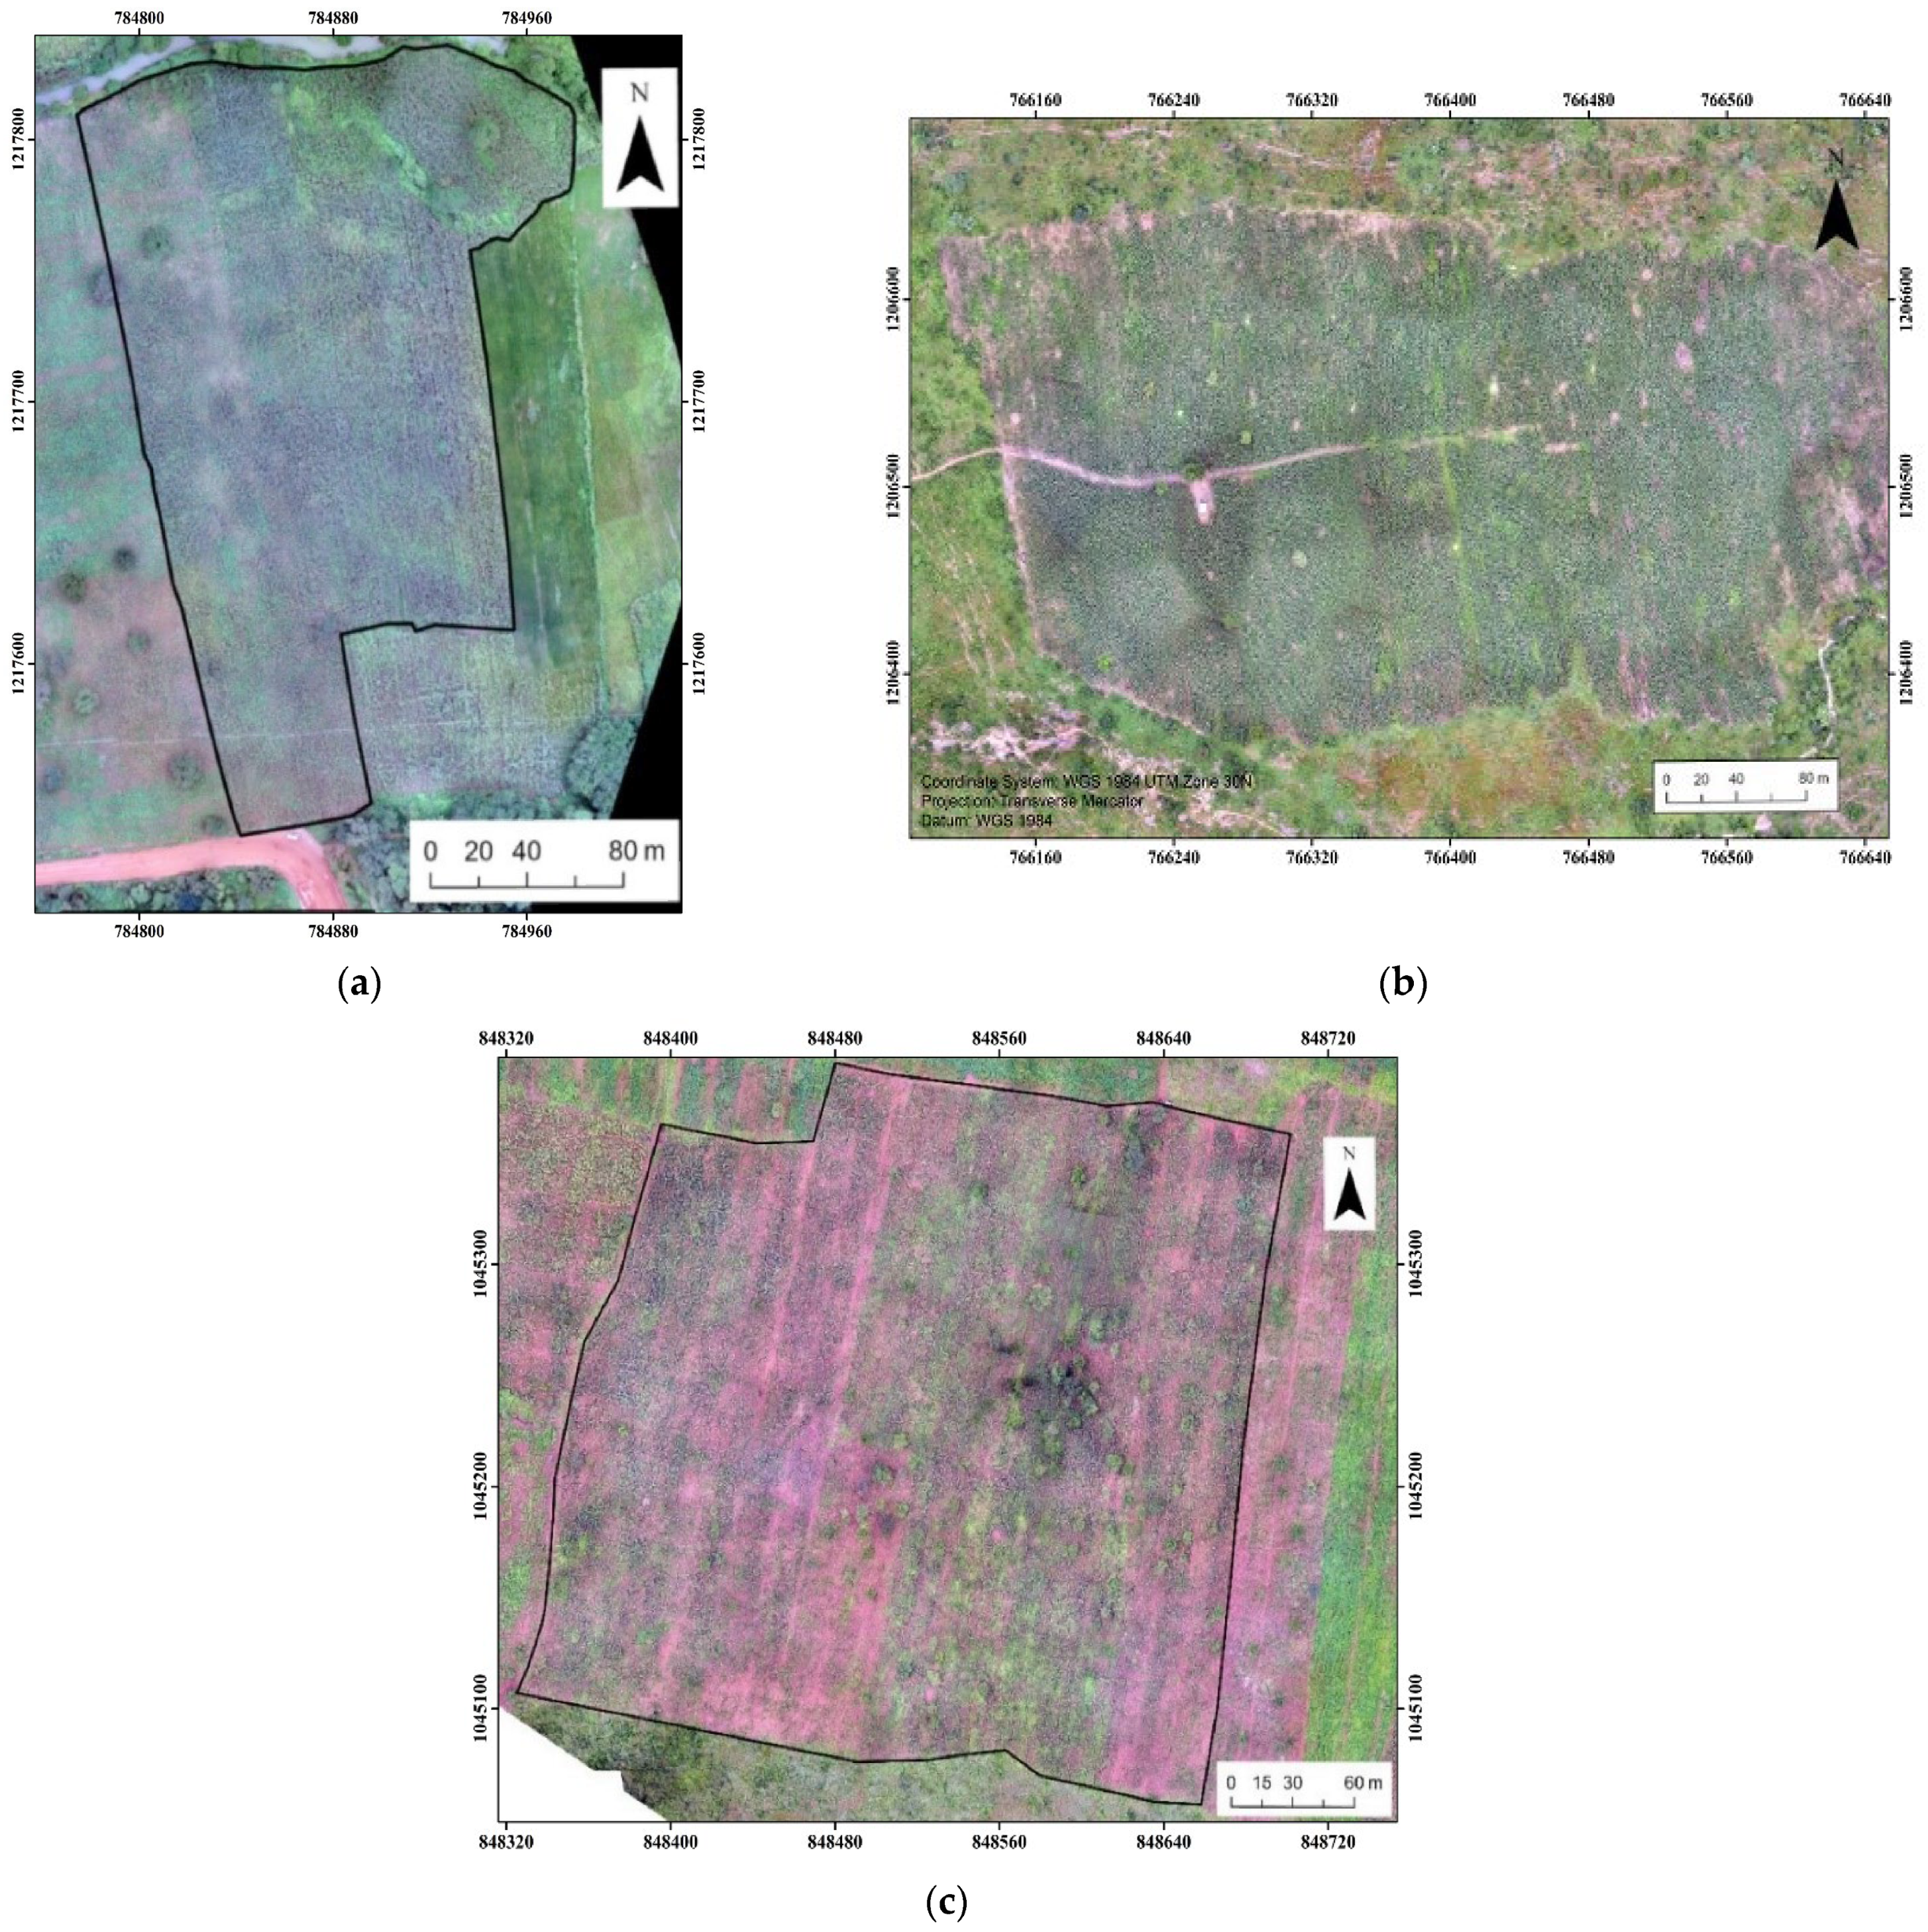
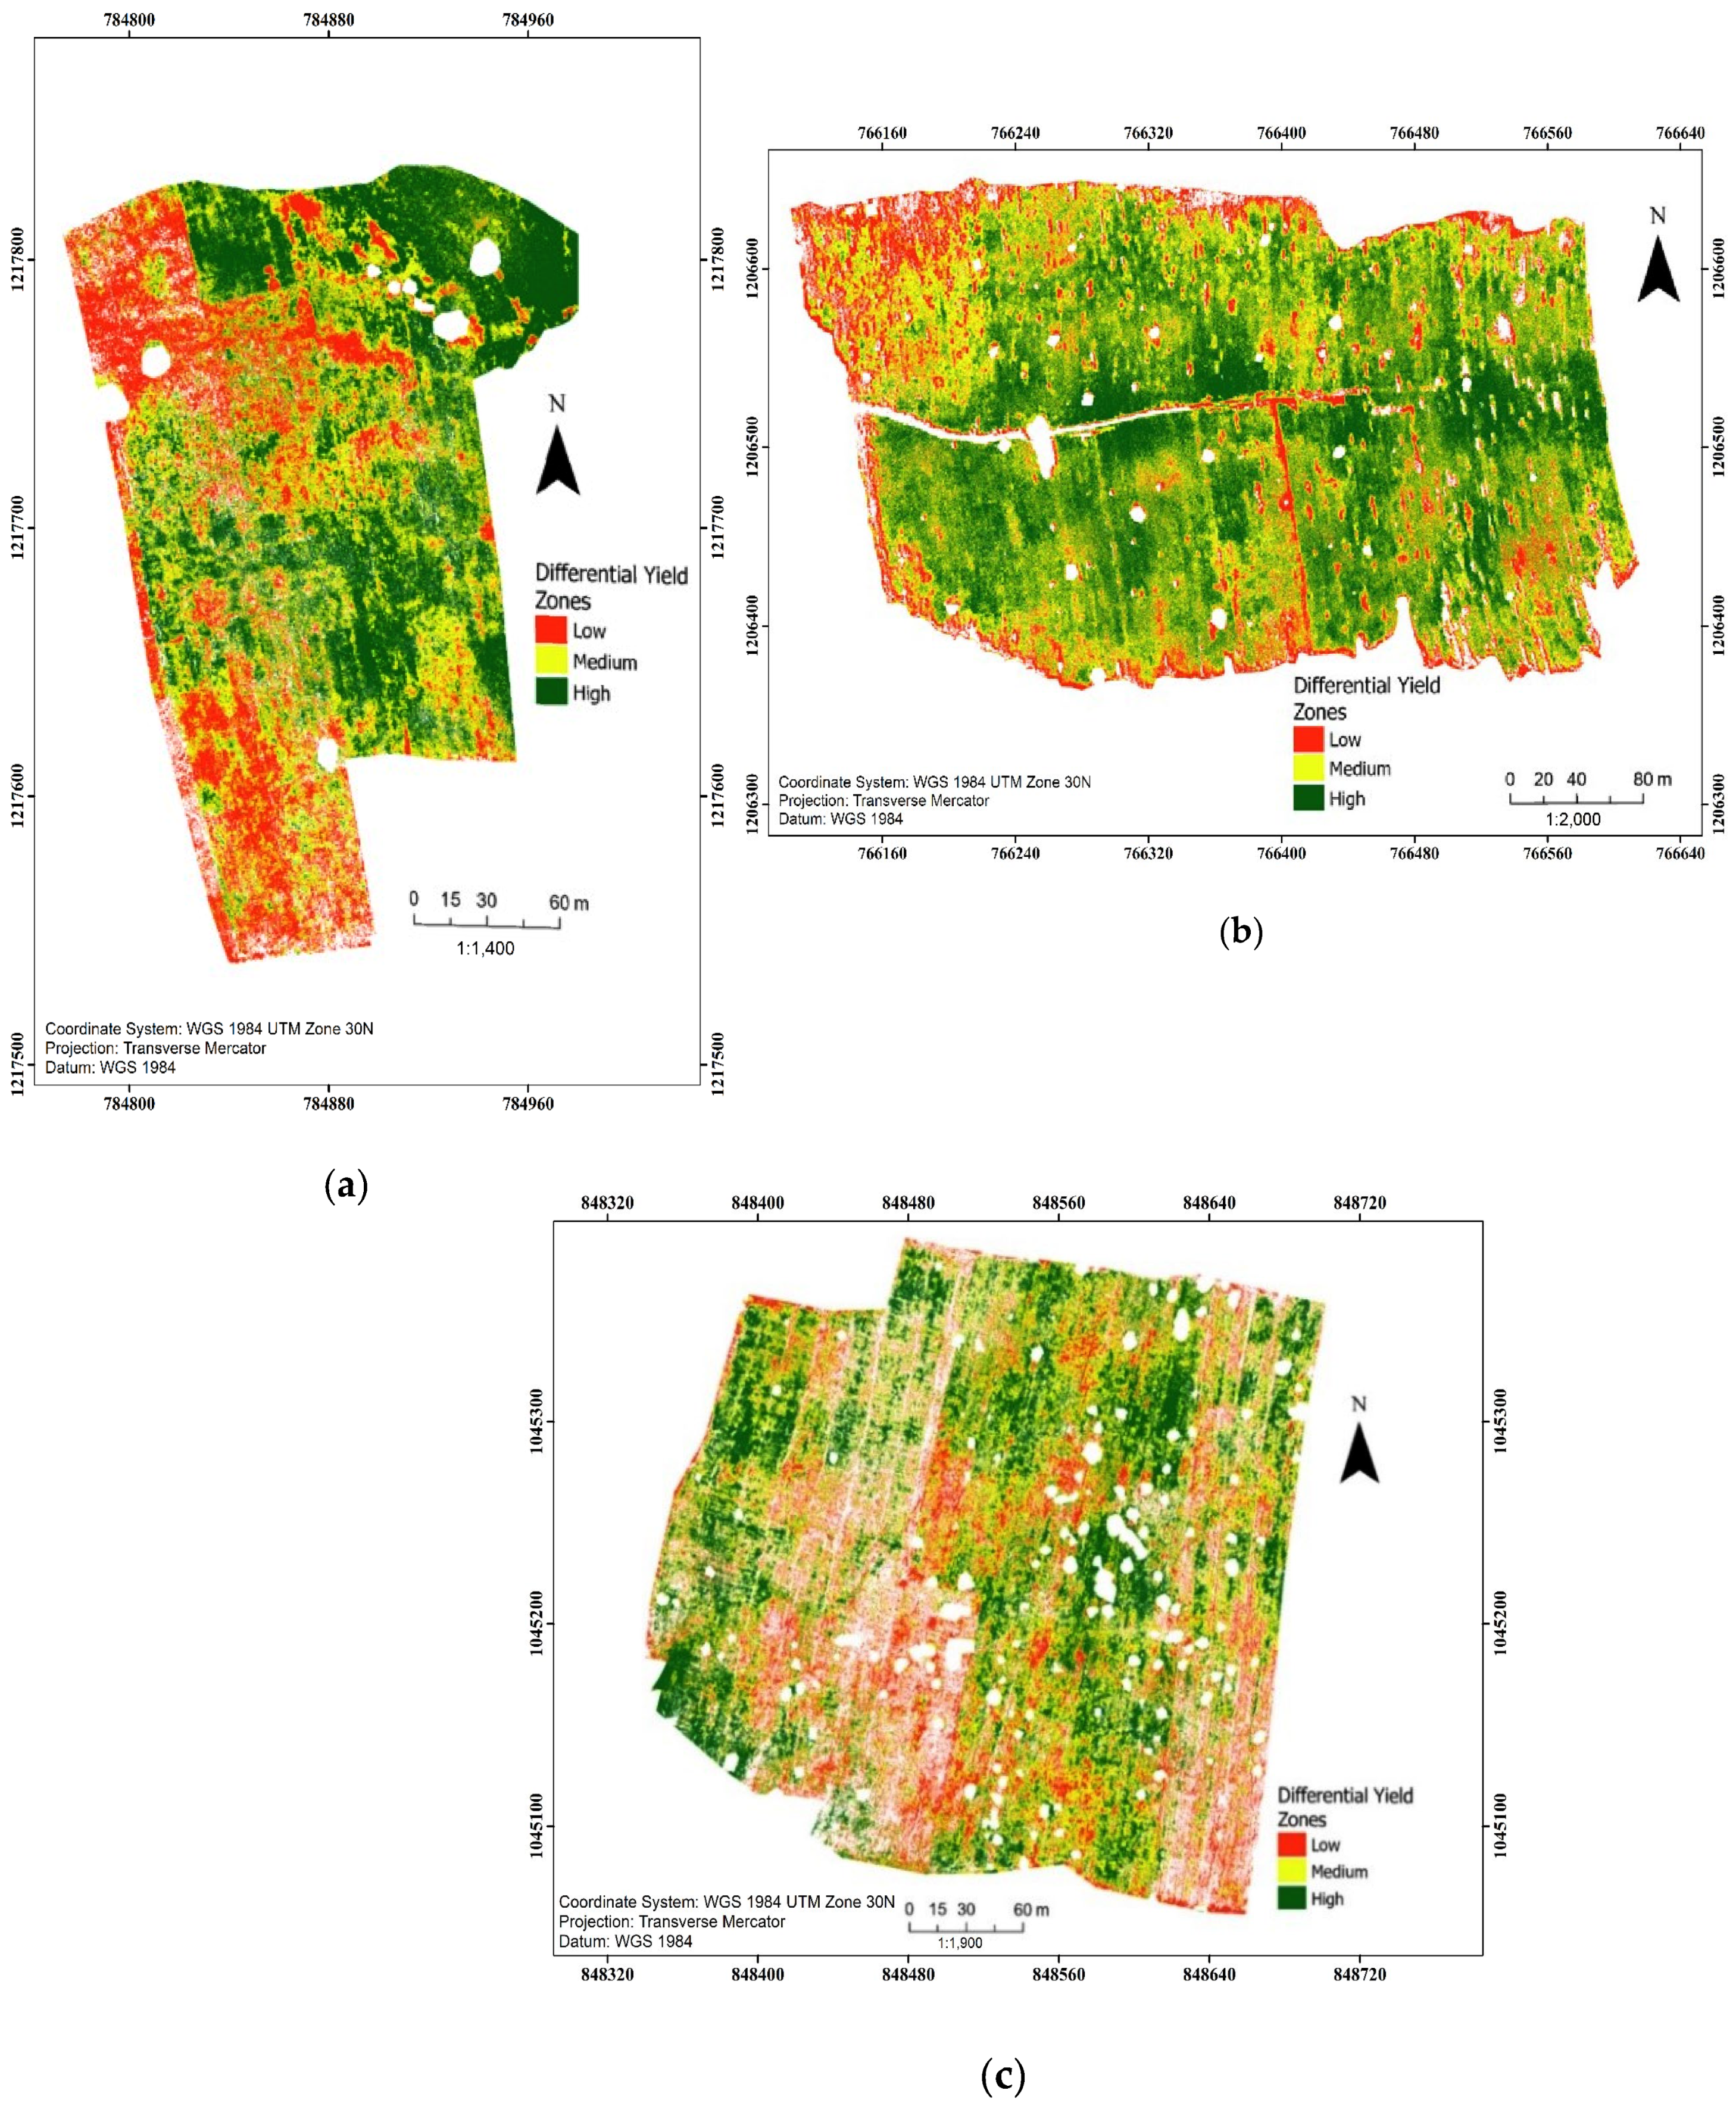
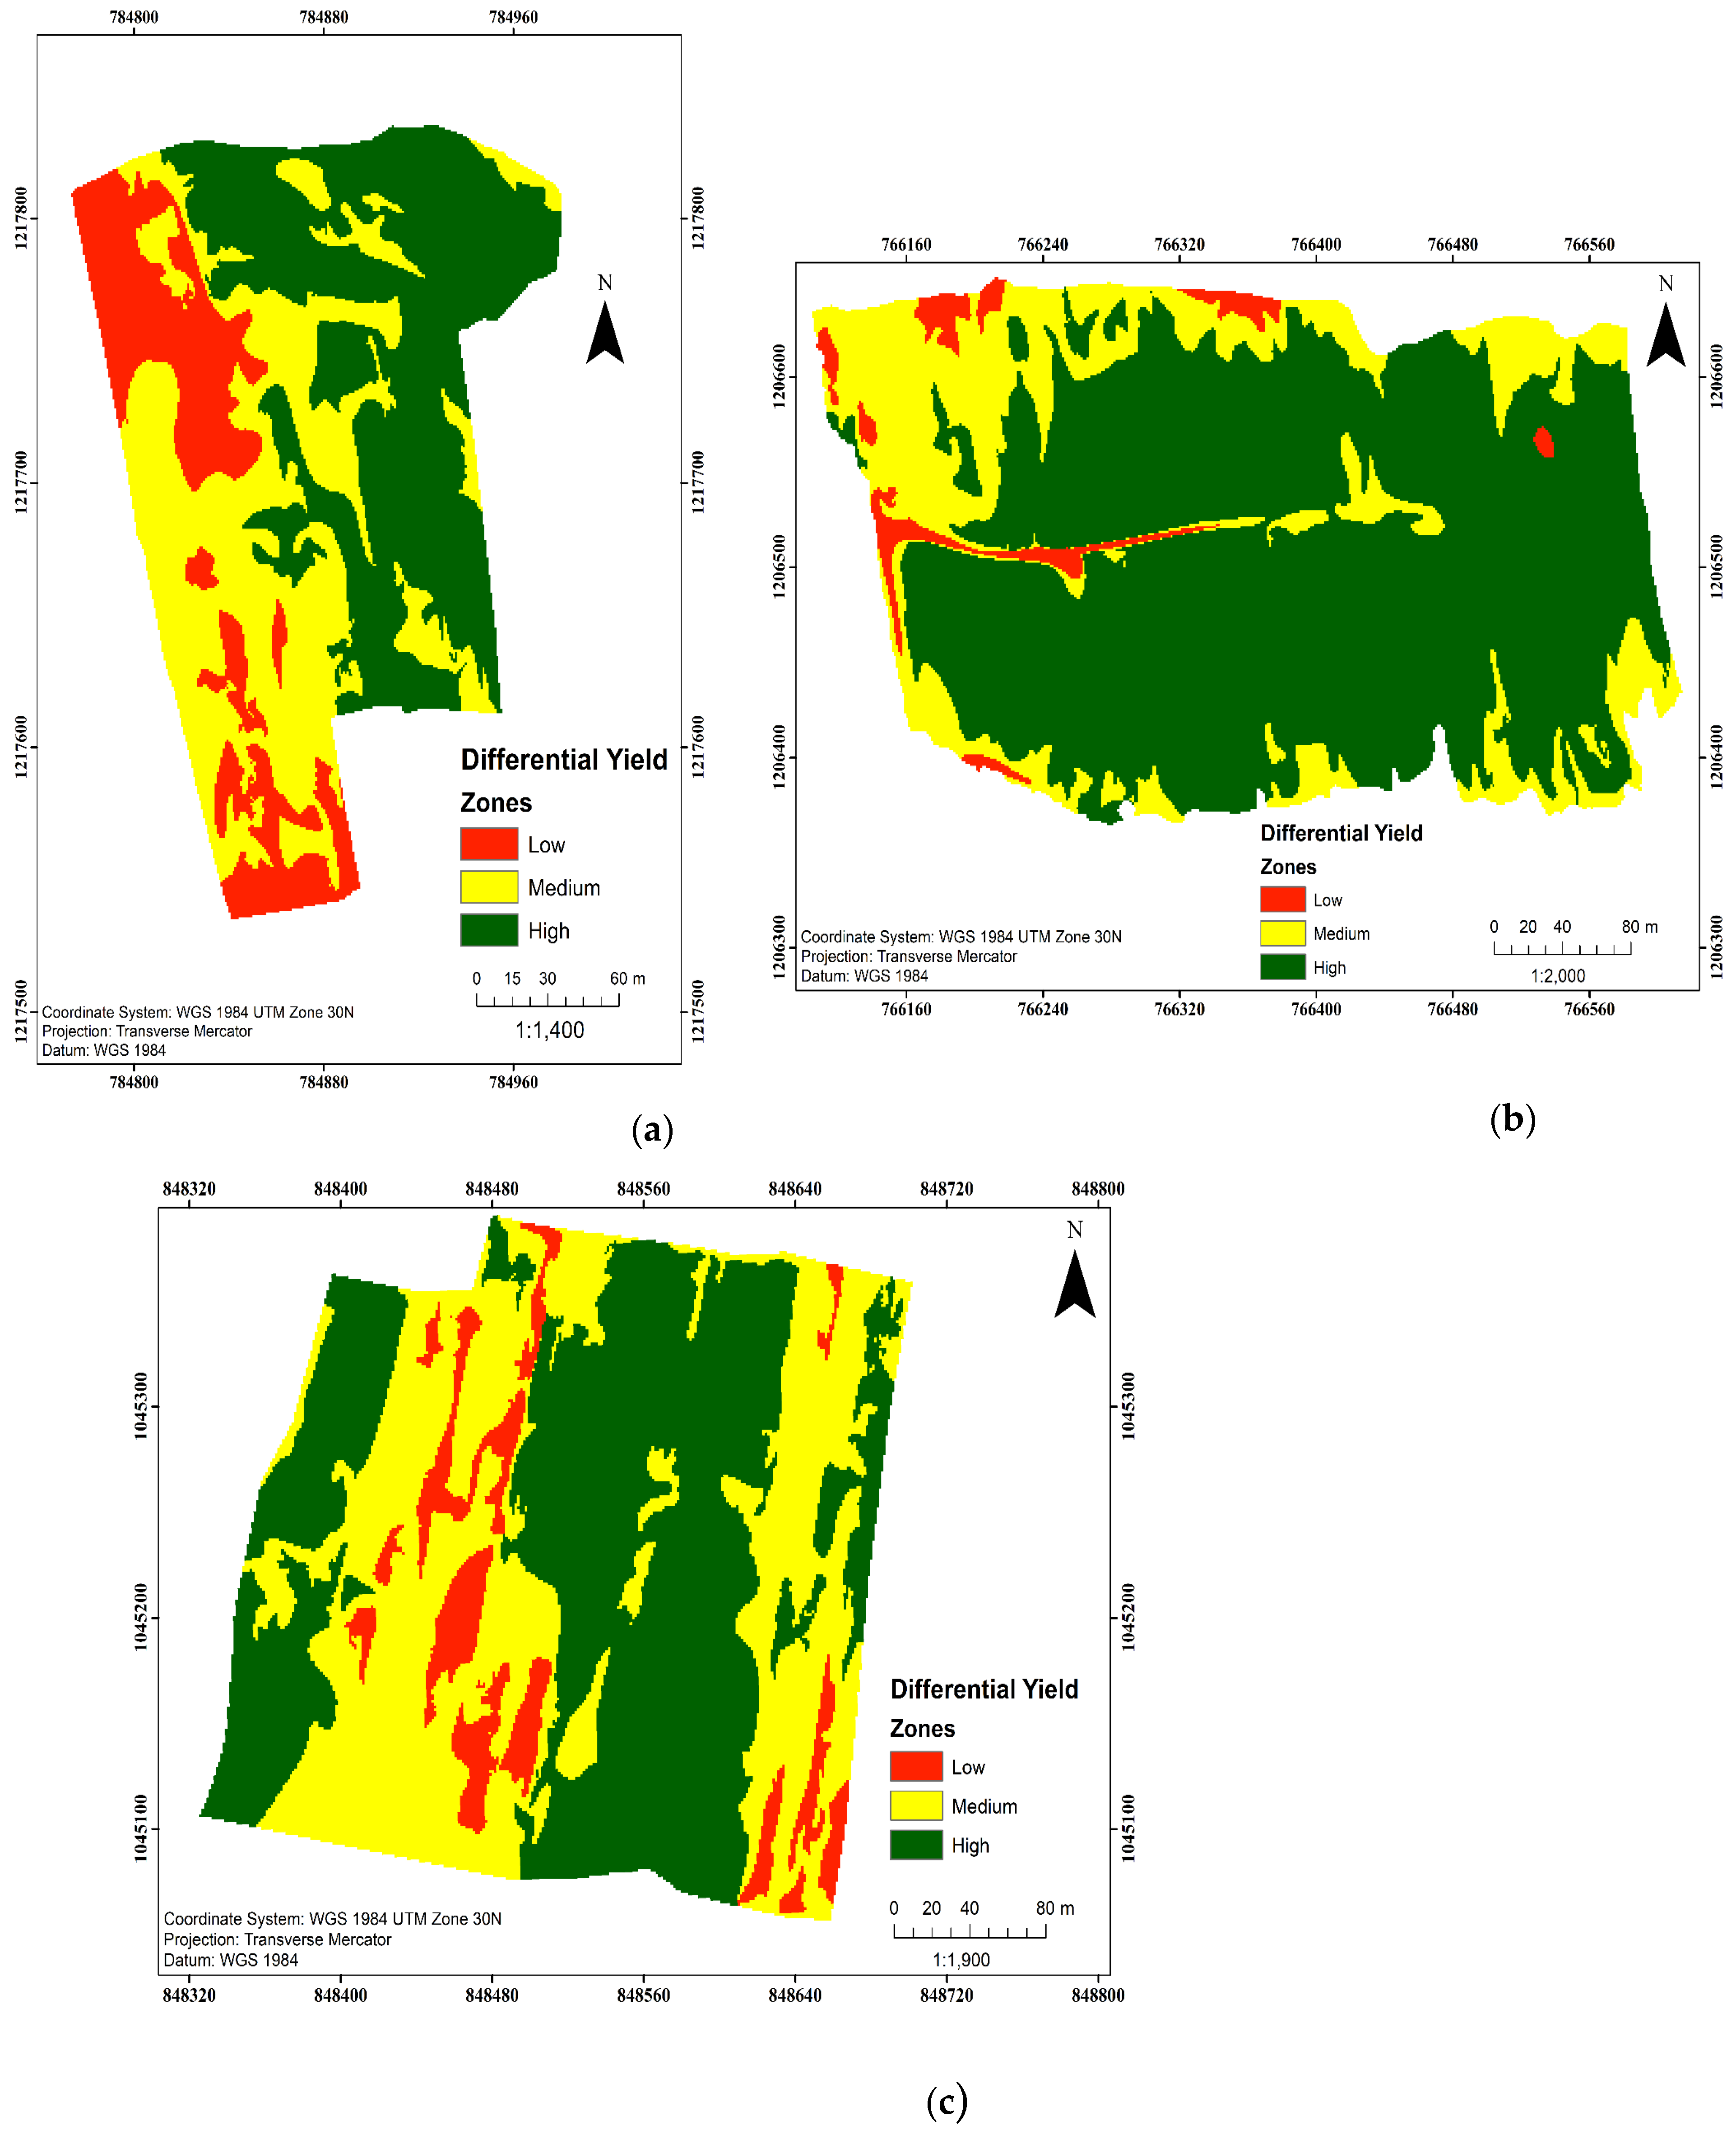
The original orthomosaics, derived from georeferenced aerial data captured by the UAS, are depicted in Figure 3a–c for Sombolouna, Tilli, and Yendi, respectively. Figure 4a–c illustrate the initial detailed classified maps of maize fields into low, medium, and high DYZs, following the materials and methods section description. The generalized DYZ maps, where pixels are grouped to form three distinct, spatially contiguous, and agronomically homogeneous zones, are displayed in Figure 5a–c for Sombolouna, Tilli, and Yendi, respectively.

3.2. Spatial Distribution of Differential Yield Zones in Fields

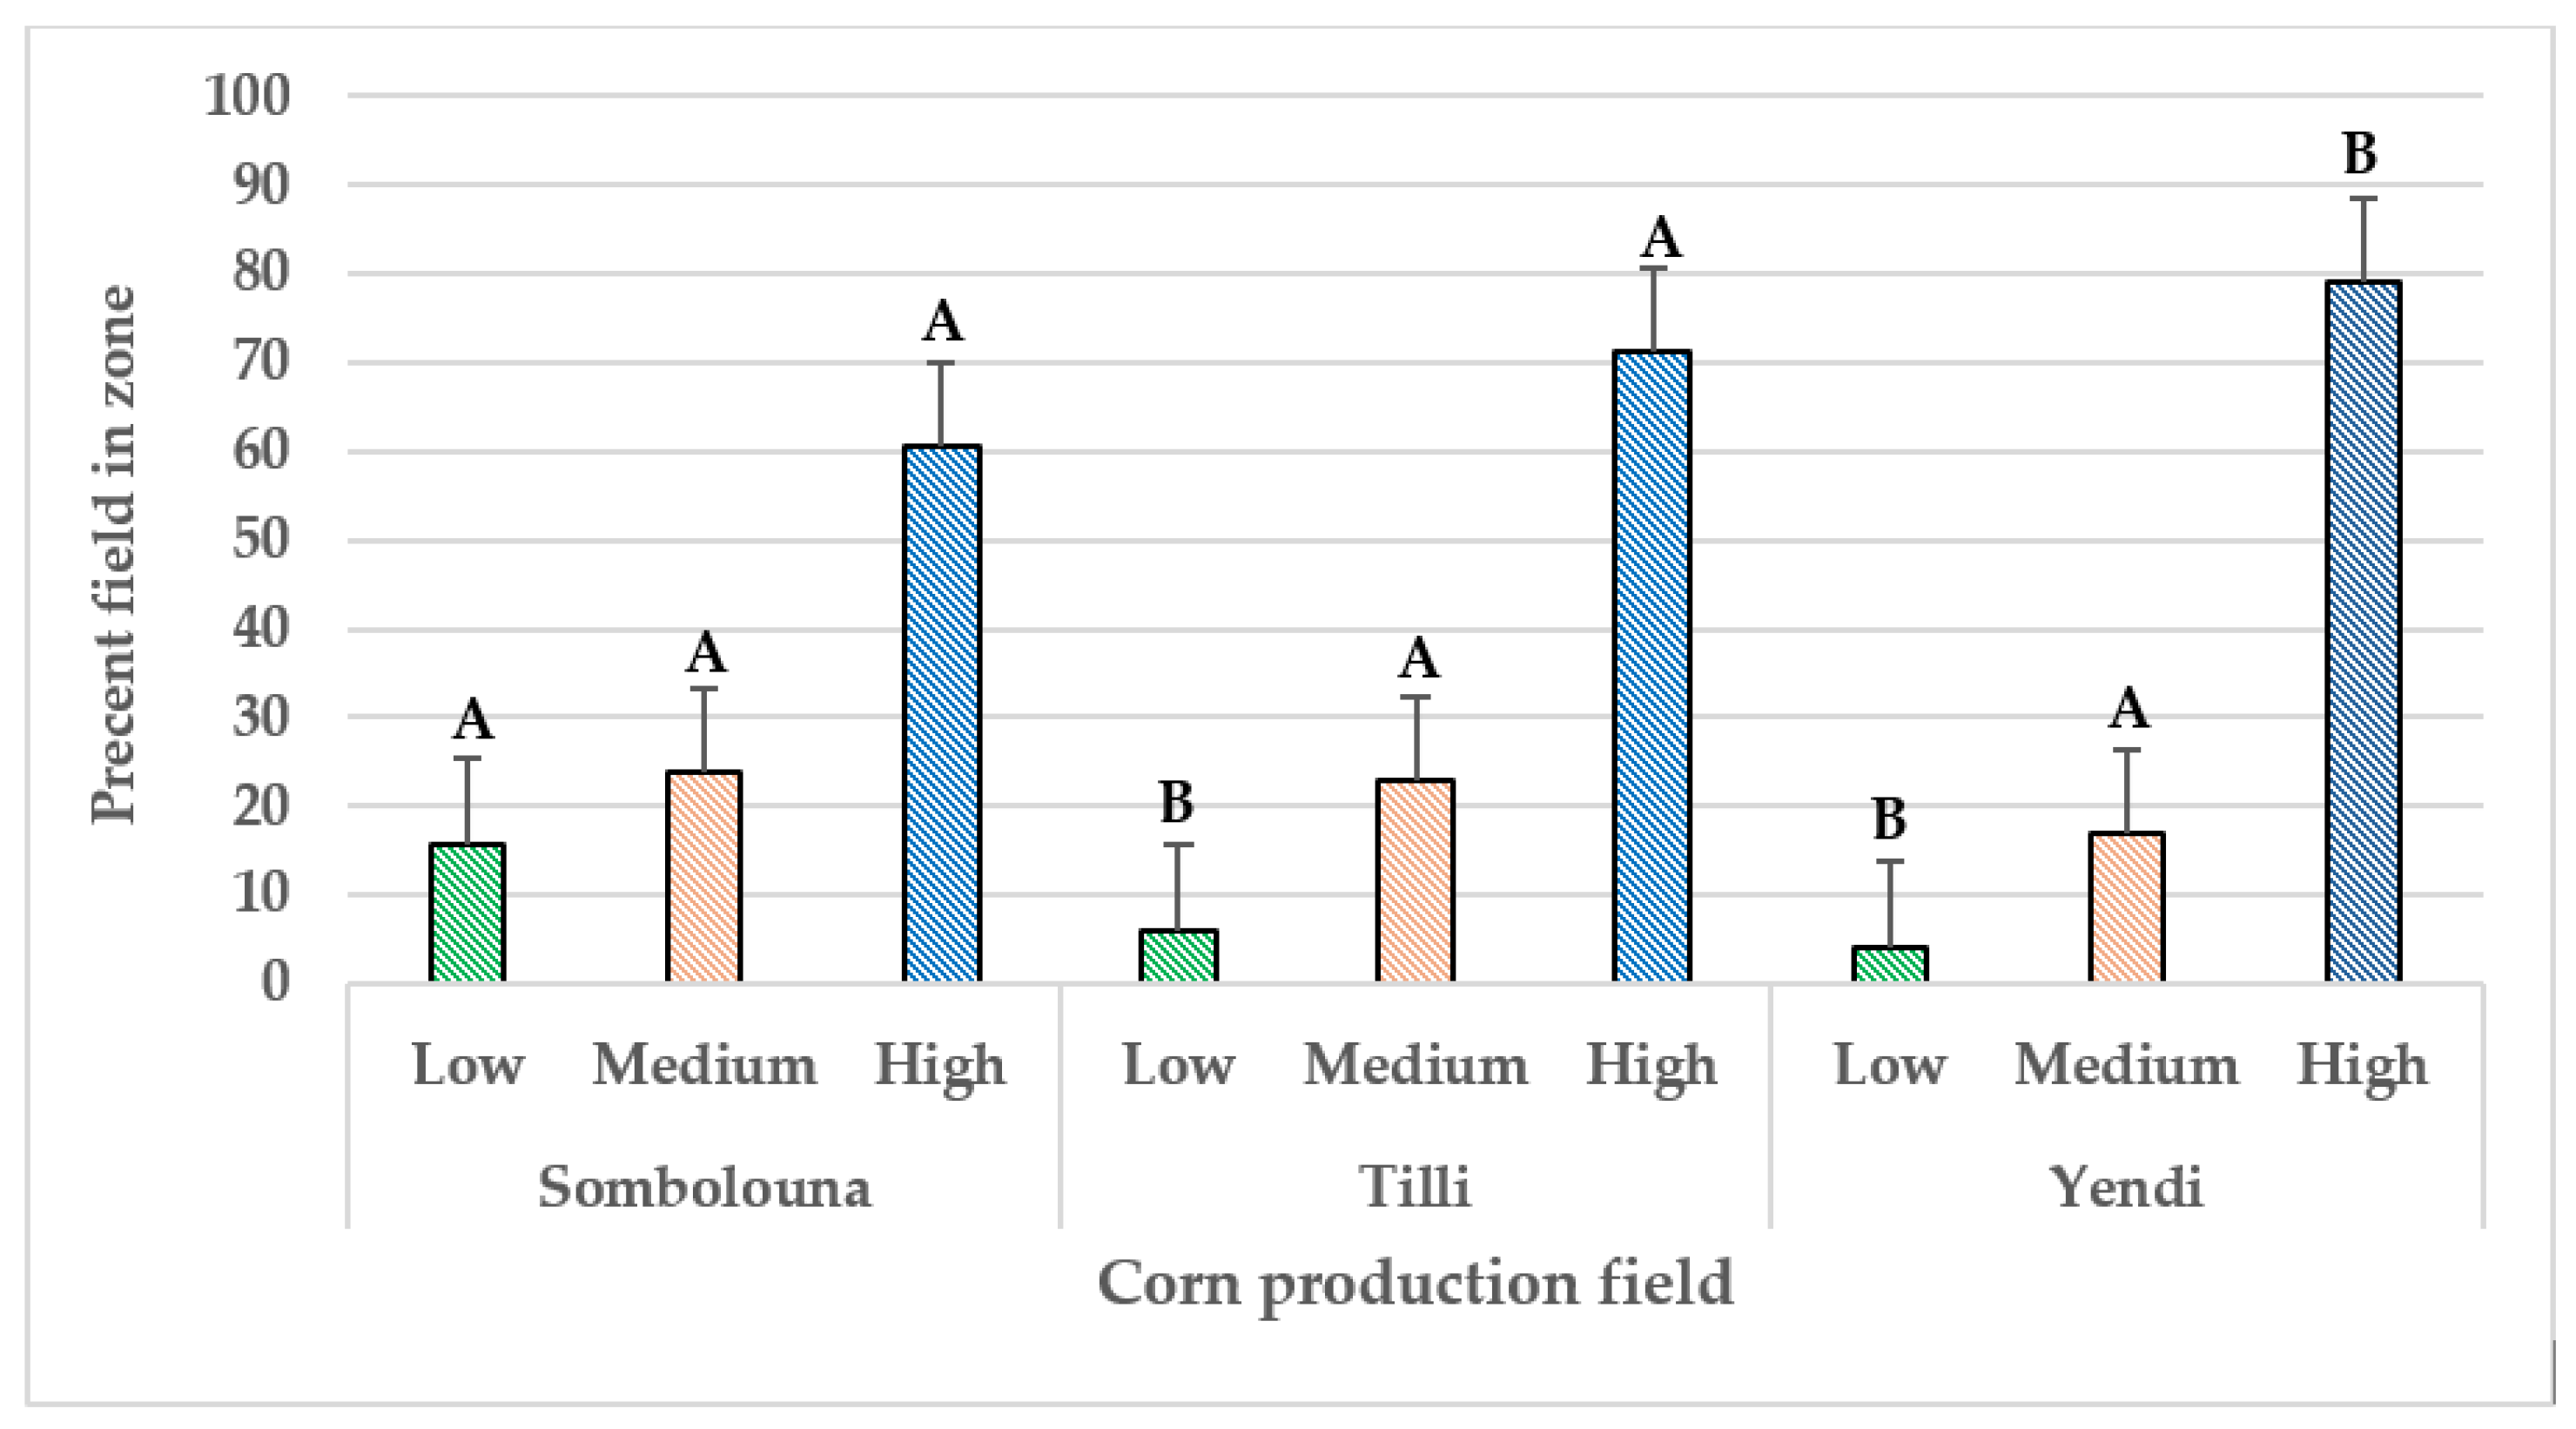
The analysis of the spatial distribution of DYZs across three maize production fields—Sombolouna, Tilli, and Yendi—indicated a predominance of high-yield zones as the leading category in all fields (Figure 6).
The extent of these high-yield zones varied significantly, with Yendi exhibiting the most significant proportion, covering 79.0% of the field area, followed by Sombolouna with 60.5%, and Tilli occupying an intermediate position. Using Tukey’s pairwise multiple comparison tests, the statistical analysis confirmed that the coverage of high-yield zones at Yendi was significantly greater than that observed at Sombolouna and Tilli.
Medium-yield zones were less dominant, with their coverage ranging from 16.9% at Yendi to 23.8% at Sombolouna. However, no statistically significant differences were found between the fields in the medium-yield zone coverage, indicating a relatively uniform distribution of medium-yield areas across the study sites.
In contrast, the low-yield zones were the least prevalent but showed noteworthy differences in their spatial distribution. Sombolouna had the highest coverage of low-yield zones at 15.8%, significantly more significant than the coverage observed in Tilli (6.0%) and Yendi (4.1%).

3.3. Bare Areas in Fields

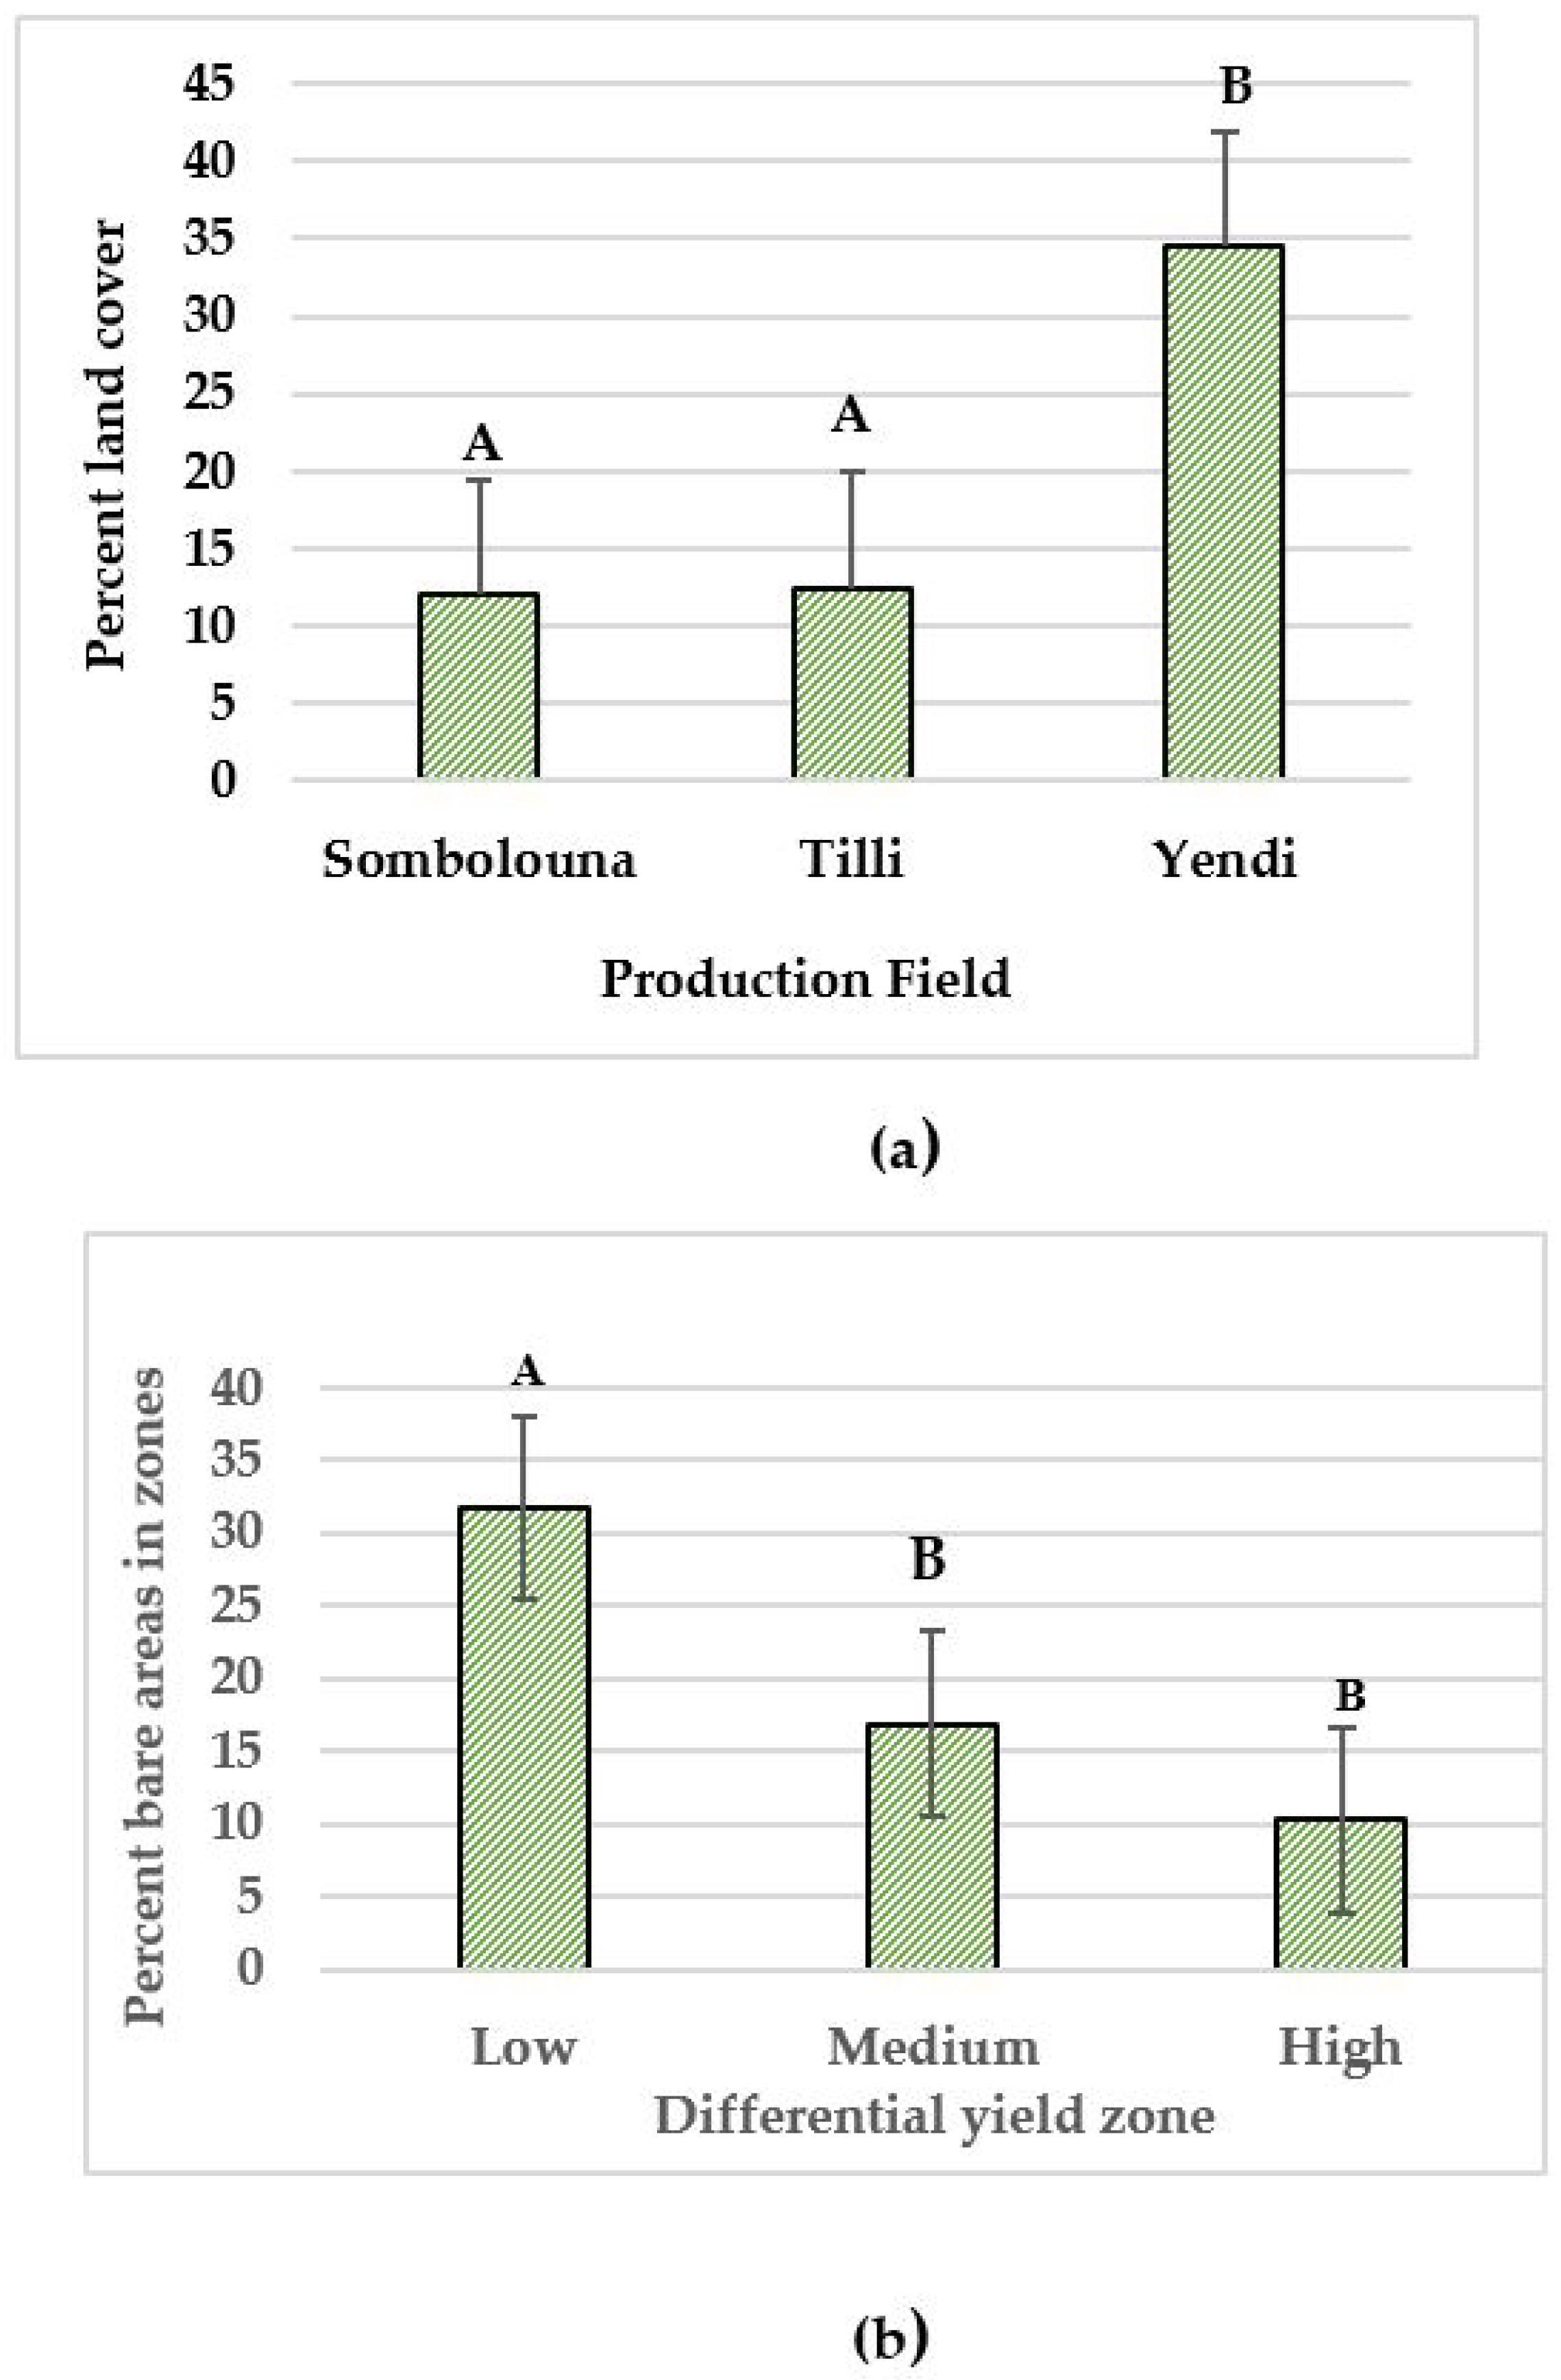
Upon detailed visual inspection of the original orthomosaics for the three maize production fields—Sombolouna, Tilli, and Yendi (Figure 3a–c)—noticeable gaps were observed within the maize stands, indicating areas where plants were either absent or poorly established. Figure 7a presents the spatial distribution of these bare areas across the fields, revealing that Yendi had the highest % of unoccupied spaces, at 34%.
This was substantially higher than Sombolouna and Tilli, which had bare spaces covering 12.5% and 12.0% of their respective field areas. This stark contrast suggests a significant variability in field conditions or management practices that may influence plant establishment, particularly in Yendi.
The analysis of the distribution of bare spaces within the differential yield zones (DYZs) further highlights the relationship between these unoccupied areas and yield potential. Figure 7b shows that the lowest yield zones across all fields had the highest proportion of bare spaces, averaging 31.7%. This observation suggests that gaps in the maize stands are strongly associated with areas of lower yield potential, which may be due to underlying issues such as poor soil conditions, inadequate water retention, or other stress factors affecting plant growth.
Conversely, the medium and high DYZs exhibited lower proportions of bare areas, with averages of 16.9% and 10.3%, respectively. Statistical analysis revealed no significant differences in the coverage of the bare regions between medium and high DYZs, indicating that, while gaps are present in these zones, their impact on yield potential is less pronounced than the lowest DYZs.

3.4. Total Vegetation Cover

Figure 8 illustrates the overall vegetation cover in the three maize production fields, detailing the specific contributions of maize and weeds. The fields at Sombolouna and Tilli exhibit notably higher vegetation cover, with 88% and 87.5%, respectively, in contrast to Yendi, which has a lower overall cover of 65.7%. A closer look at the field-level breakdown reveals that Tilli has a significantly higher weed coverage at 22%, compared to 14.1% at Sombolouna and 12.6% at Yendi. Regarding maize cover, Sombolouna has the highest proportion at 73.9%, significantly more significant than Tilli’s 64.6% and Yendi’s 53.9%. This suggests that while overall vegetation is high at Tilli, a more substantial portion comprises weeds. In contrast, Sombolouna has the highest proportion of maize cover, reflecting more effective crop establishment and management practices than other fields.
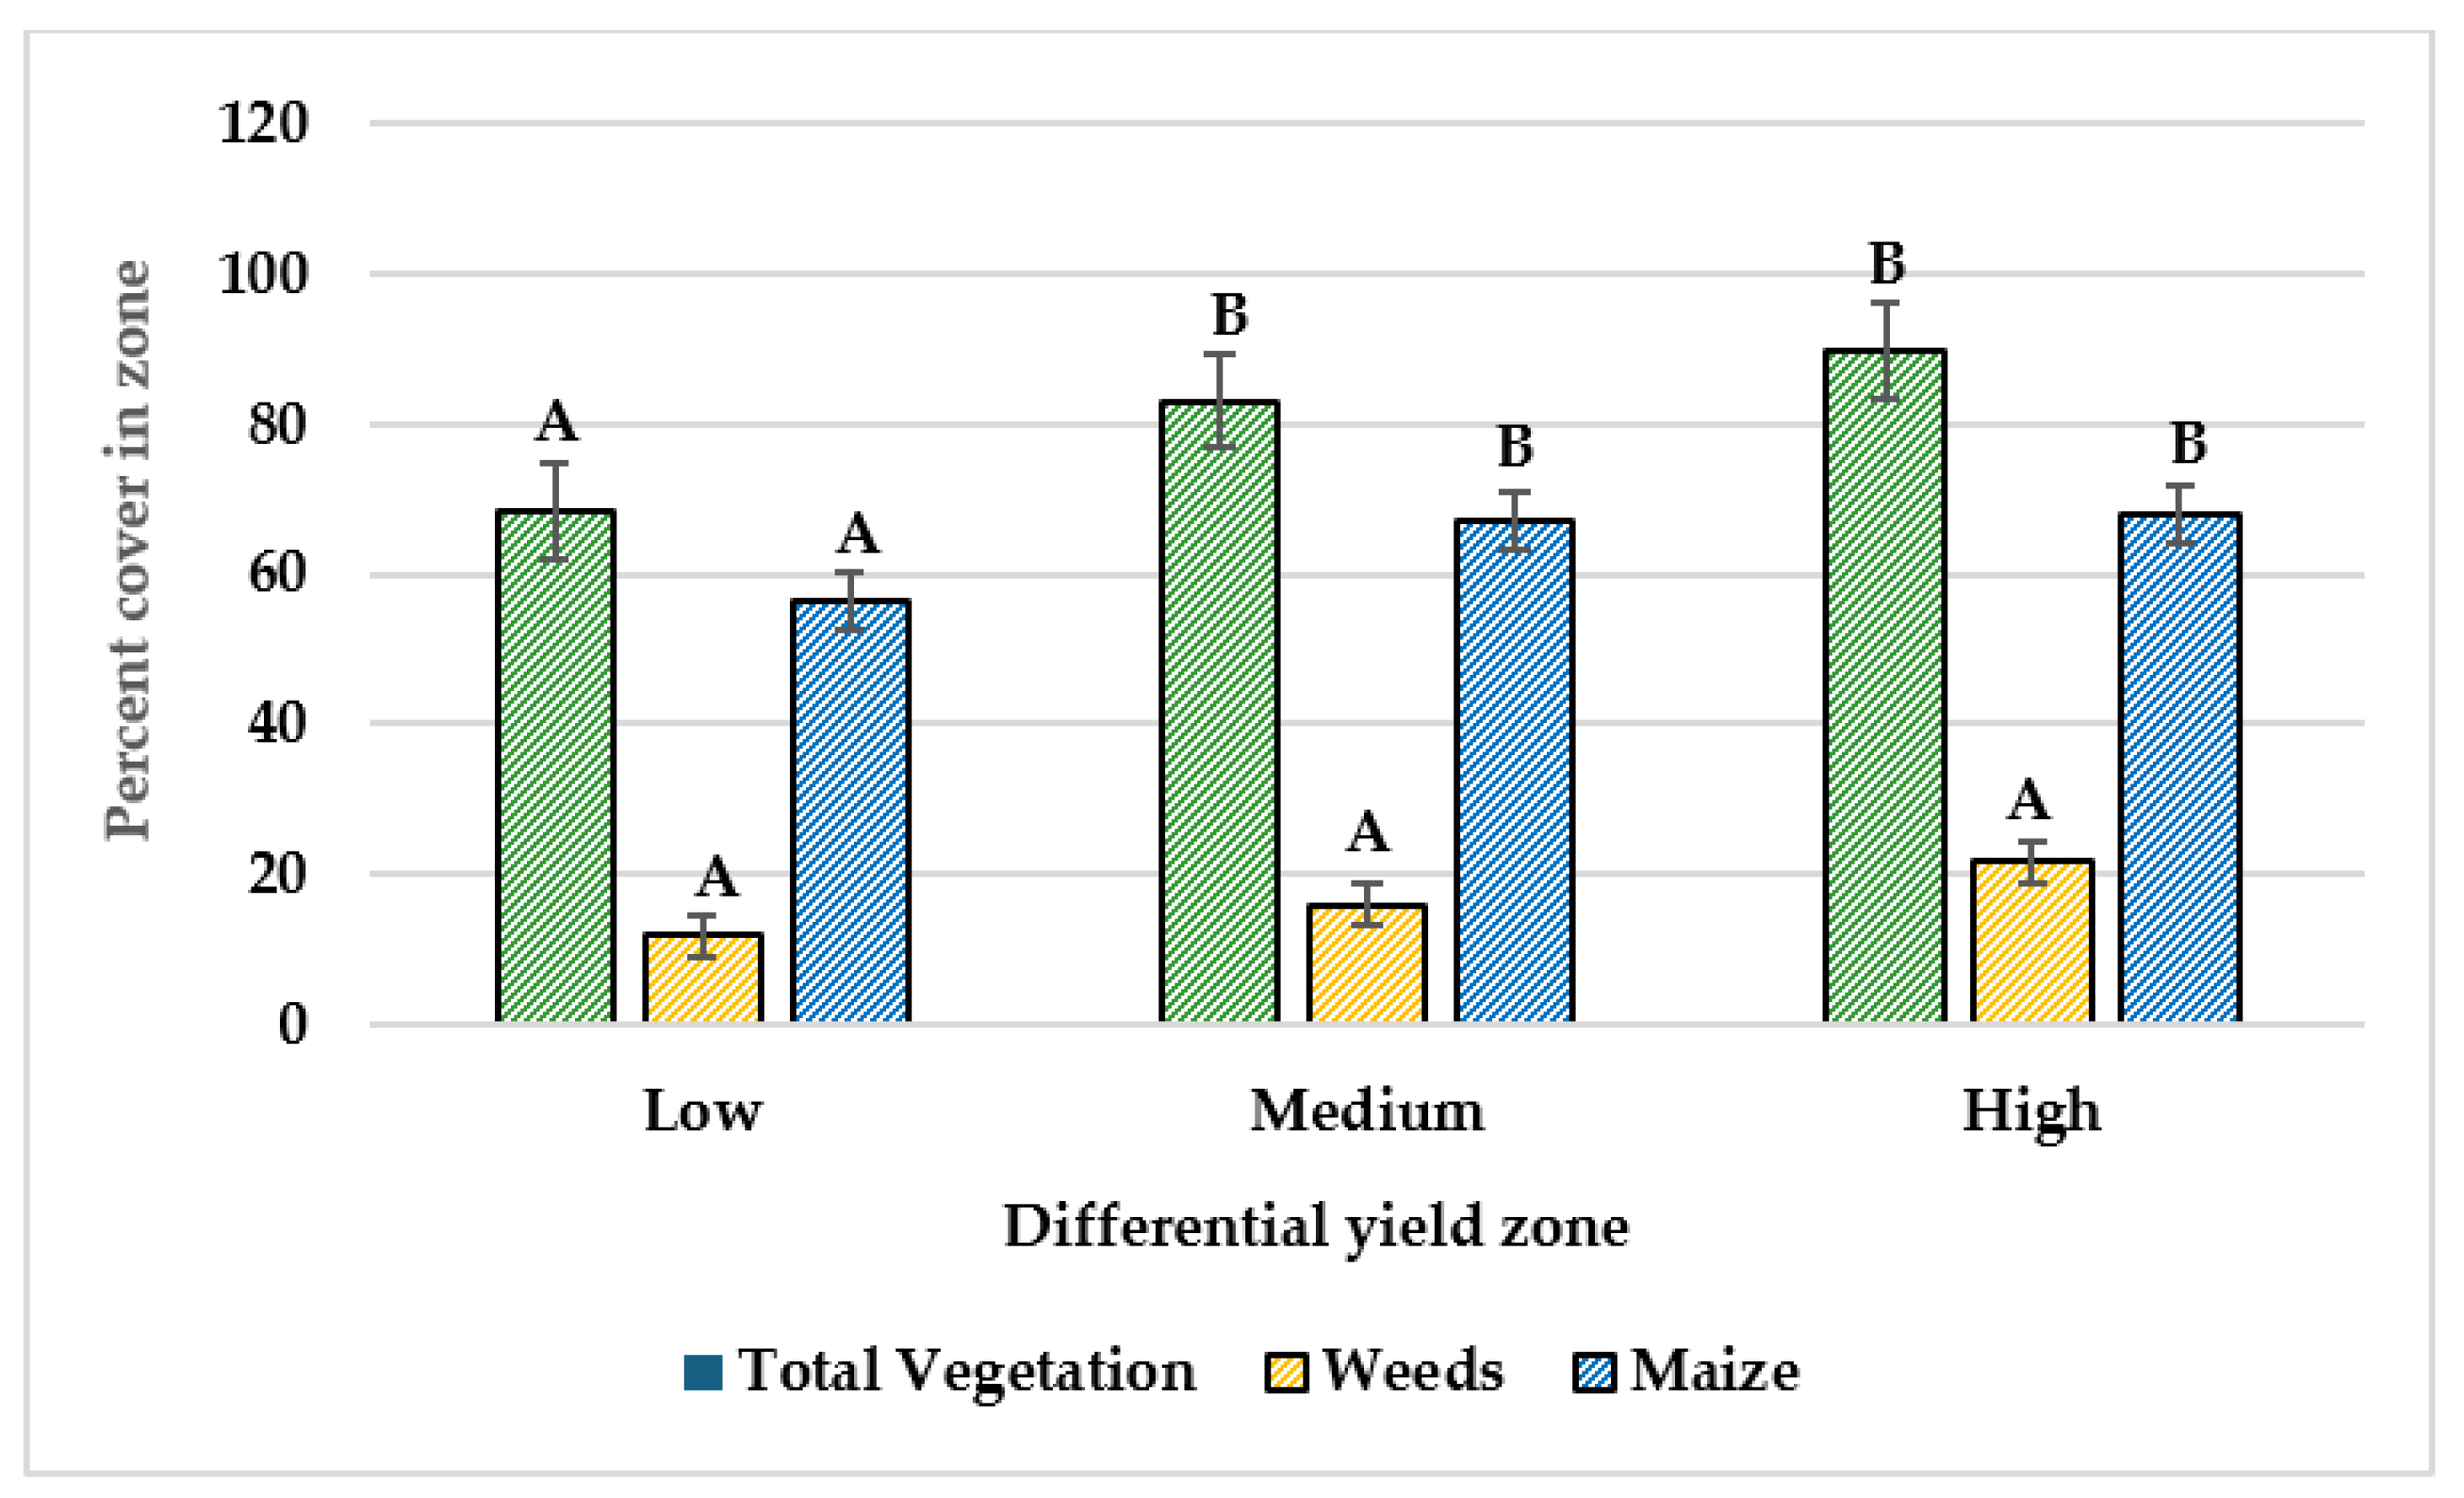
Approximately 67.1% of the maize crop was found in the medium DYZ and 68.0% in the high DYZ, with no statistically significant difference (Figure 9). However, both values were significantly higher than the maize coverage in the low DYZs, which stood at 56.5%. Although the zone did not affect the percent distribution of weeds, the highest weed infestation, at 21.7%, was observed in the high DYZ.

3.5. Maize Population Density

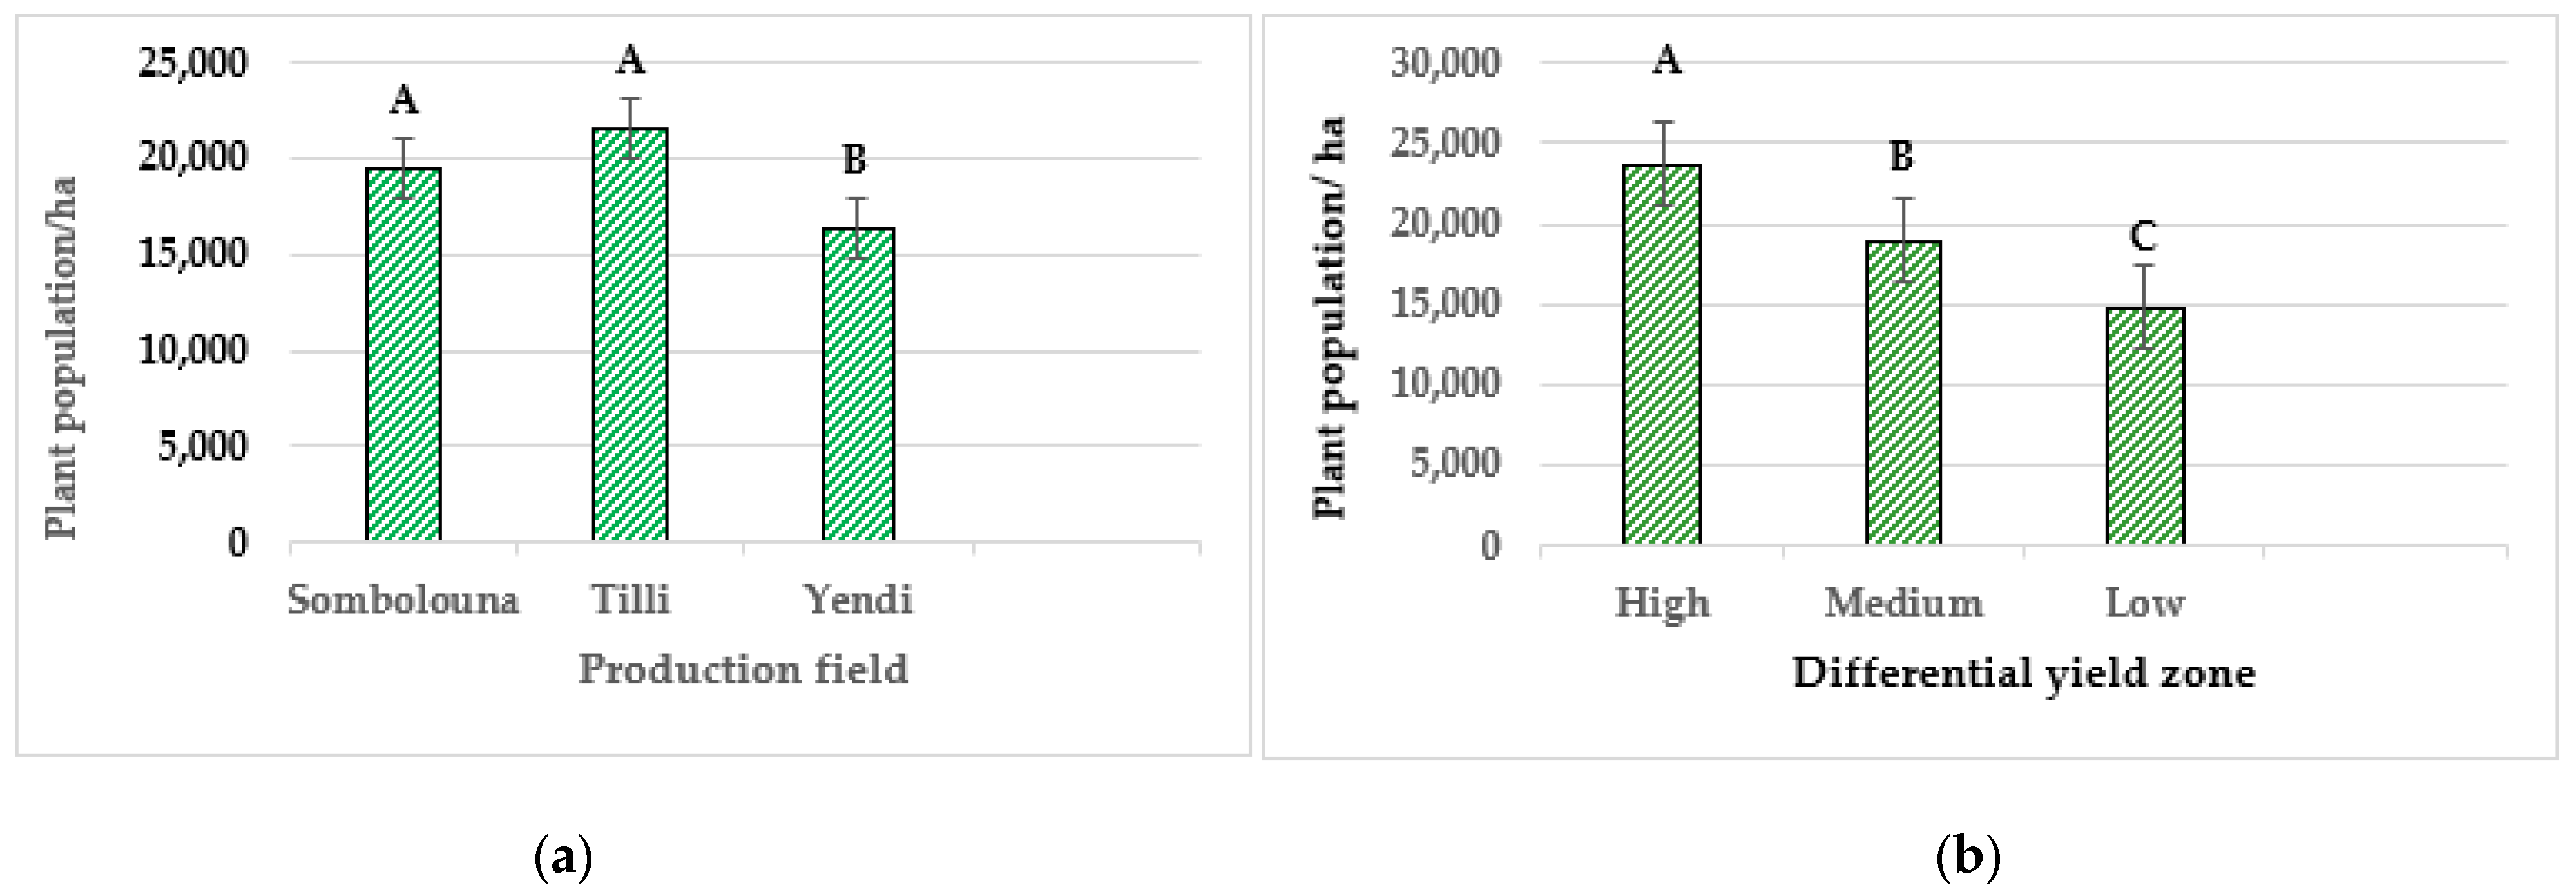
The highest estimated plant population density was observed at Tilli, reaching 21,563 plants per hectare (Figure 10). However, this density was not significantly different from the 19,497 plants per hectare recorded at Sombolouna. The lowest maize population density was found at Yendi, with 16,389 plants per hectare. An apparent variation in plant densities was observed across different zones, following the expected pattern: high DYZ with 23,723 plants per hectare, medium DYZ with 18,941 plants per hectare, and low DYZ with 14,774 plants per hectare.

3.6. Maize Grain Yield and Land Productivity

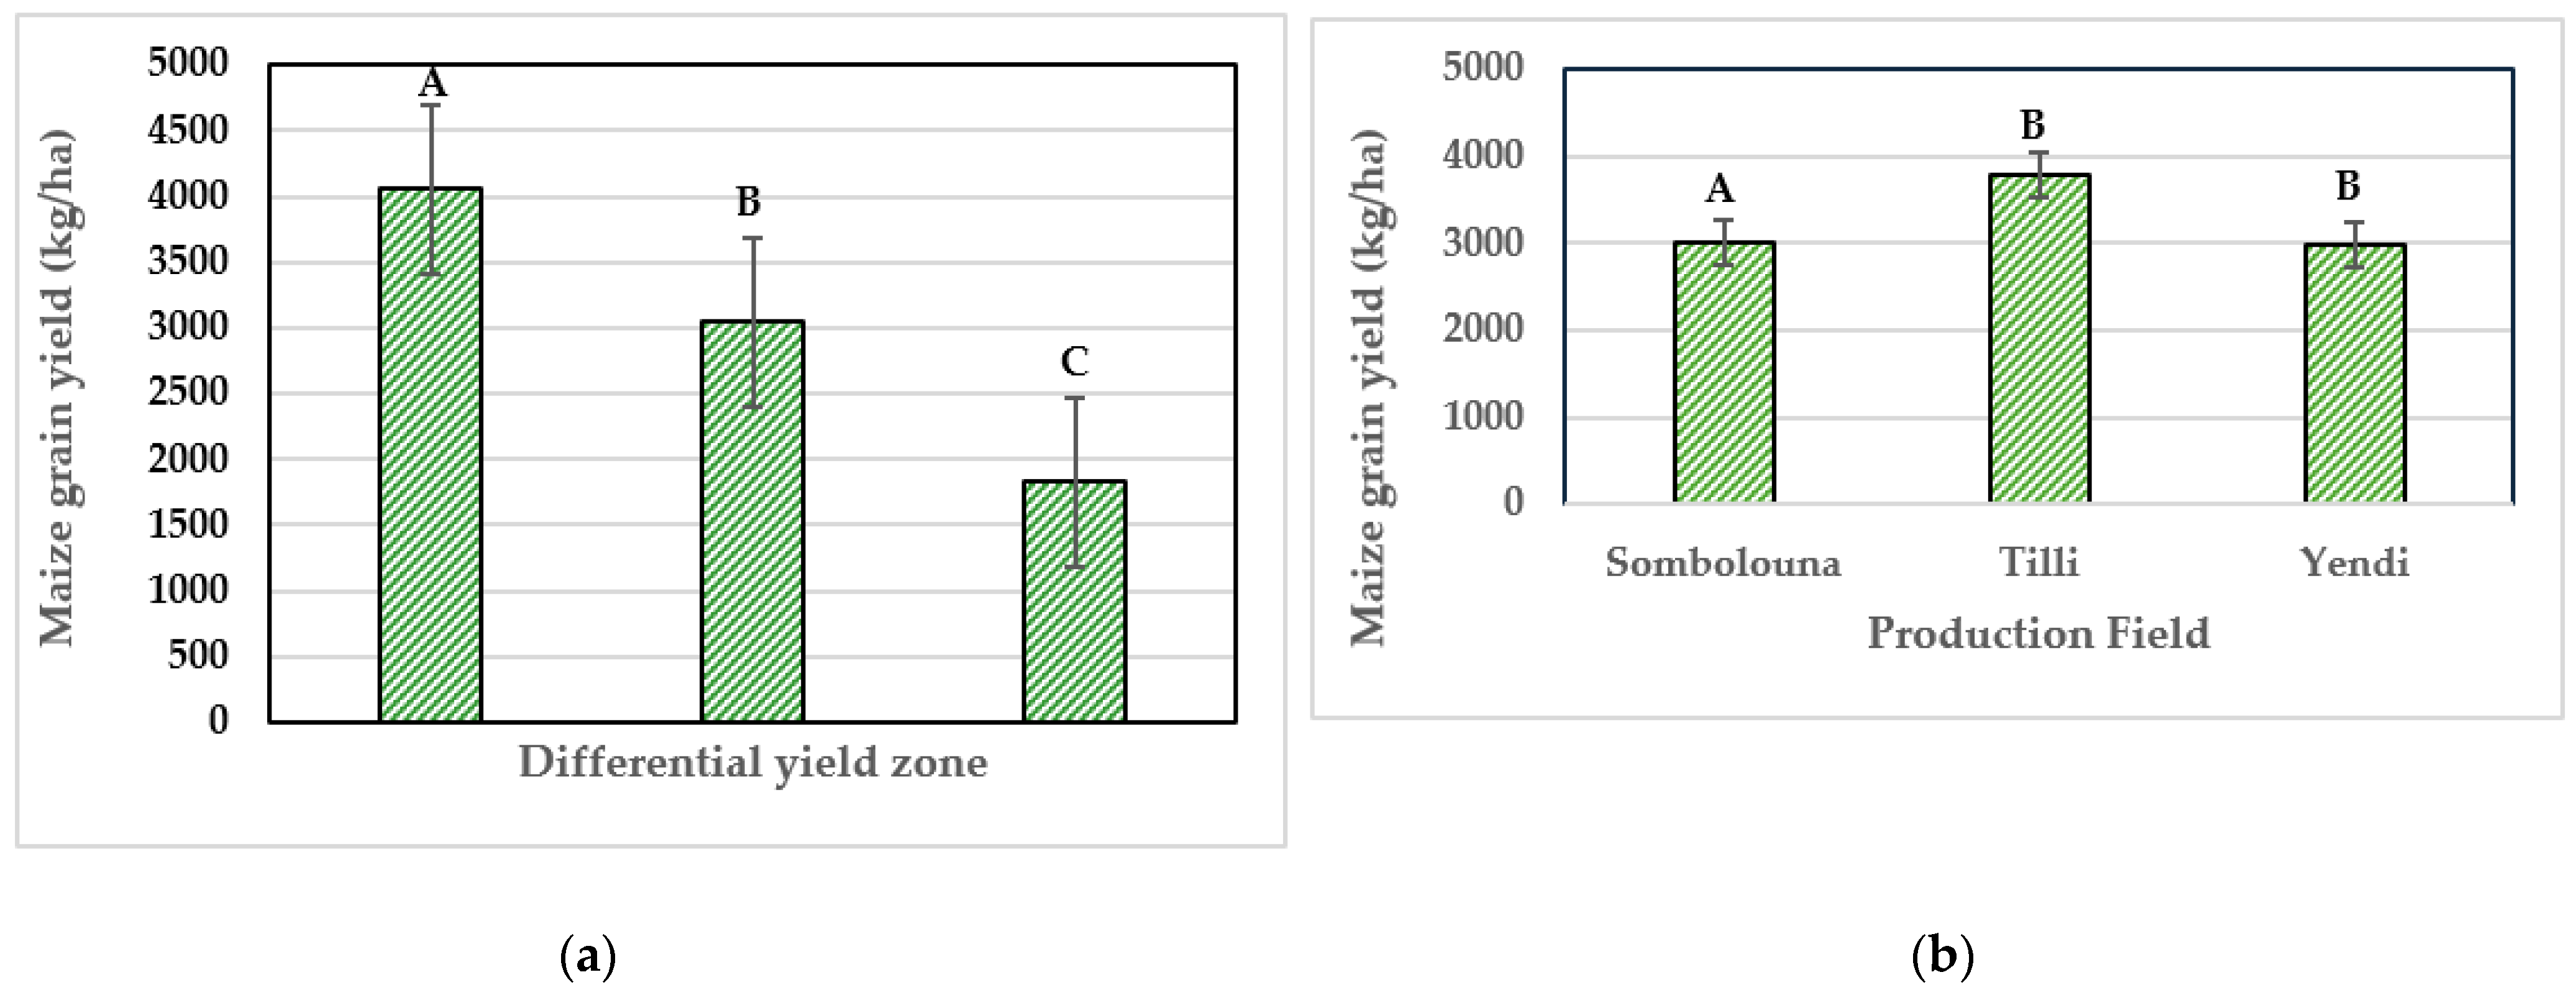
This research explored two simple yet illustrative land management scenarios to demonstrate the foundational principles of PA. It enabled a comprehensive evaluation of maize productivity across the three project sites, with the results presented in Figure 11 and Table 4. Maize grain yields varied significantly, ranging from 860 kg/ha in the low DYZ at Sombolouna to 4900 kg/ha in the high DYZ at Tilli. On average, yields followed the pattern of study identified high > medium > low zones, with 4530 kg ha−1 in high zones, 3790 kg/ha in medium zones, and 1830 kg/ha in low zones (Figure 11a). Although there were no significant differences between the high and medium zone yields, both were substantially higher than those in the low zones, as shown in Table 4.
In terms of overall productivity, measured as production per unit of land, Tilli exhibited an average of 3890 kg/ha, which was not significantly different from Sombolouna’ s average of 3810 kg ha−1. However, both sites displayed notably higher productivity than Yendi, which had a lower average yield of 2910 kg/ha. This finding suggests that, while Tilli and Sombolouna showed relatively similar performance, Yendi lagged in maize yield per hectare.
When comparing yields across the entire production fields, Tilli had the highest average yield at 3890 kg/ha followed by Sombolouna with 3810/ha and Yendi with 2990 kg/ ha. The total maize productivity for each field was estimated by summing the products of the zone sizes and their respective average yields. The results showed that the estimated productivity per hectare was similar between Sombolouna and Tilli, with no significant differences. These findings emphasize the need to target low-yield zones for management improvements to achieve more uniform and higher overall productivity, a justification for the adoption of precision agriculture in small-scale maize production systems.

3.7. Scenario Analysis

The results of scenario analyses are presented in Table 4, Table 5 and Table 6. In the initial scenario, it is assumed that all agronomic factors limiting production are enhanced to the standards of the medium zone using environmentally sustainable management interventions. As outlined in Table 5, this scenario resulted in production increases of 7.34%, 1.29%, and 23.02% at Sombolouna, Tilli, and Yendi, respectively.
In the second scenario, it is assumed that targeted action is taken and production conditions and management in all fields are brought to those of their high DMZs. According to our analysis, this will result in substantial yield productivity of 8.92% at Sombolouna, 25.96% at Tilli, and 56.01% at Yendi (Table 6).

4. Discussion

This study demonstrates the feasibility of using UAS technologies, backed by spatial analysis, to lay a foundation for PA in small-scale farming systems. Specifically, it presents a rudimentary step-by-step methodology to describe and understand maize productivity heterogeneity in the landscape. It has developed a system to identify, characterize, and quantify attributes of potential maize DYZs within small-scale production systems.
The low-altitude flight capability of unmanned aerial vehicles facilitated the acquisition of georeferenced ultra-high-resolution imagery of three fields at Sombolouna, Tilli, and Yendi, all in the northern part of Ghana. These aerial data were subsequently used to generate high-resolution RGB 3D orthomosaics. These orthomosaics represent an extraordinary source of thematic information by providing the true-to-life representation of surficial features, which is essential for Geographic Information Systems analysis. In these orthomosaics, heights, tilts, topographic relief, and lens distortions are rectified to ensure geometric parity, as asserted by [40,52], and objects are presented in map-like projection, permitting the identification and characterization of field features. They provided the best understanding of the identified DYZ regarding bare areas and vegetation cover, partitioned into maize and weed intensities.
The orthomosaics were used in two binary classification steps using the normalized values of green, red, and blue bands. The authors in ref. [41,42] observed that the EGI provided a near-binary intensity image that outlines a plant region of interest based on selected threshold values for the analyzed image. Ref. [53] used a similar approach to binarize weeds and crops to generate weed maps. In this approach, they used a dynamic and auto-adaptive classification system to discriminate and quantify weeds and maize coverage from high-resolution UAS data. It combined object-based features to characterize quasi-equidistant lines of maize as a row crop compared to the unstructured nature of weed distribution on the land. However, considering the unstructured planting architecture in small-scale tropical farming systems, this study creatively used the attributes of the high-resolution orthomosaics generated to adjust and confirm breaks to map maize and weeds visually and manually.
The NDRE was used as an index of plant health in this study for three reasons: first, [54] observed a strong relationship between NDRE and maize yield at the V12 developmental growth stage. Second, ref. [55] showed that NDRE was much less susceptible to saturation than NDVI later in the season. Third, high levels of chlorophyll accumulation during the middle to last stages of crops lead to poor penetration of red light, as asserted by [56,57].
The NDRE classification of maize rasters of maize fields followed by the Jenks natural breaks algorithm [49] produced fine, detailed, high-resolution crop health maps and potential yield performance. The classification algorithm is renowned for its robustness in managing spatial data distributional systems. It excels at organizing data into distinct classes by minimizing variance within classes and maximizing differences between them. This approach ensures that the classification accurately reflects the natural groupings within the data, thereby capturing true spatial variability [58,59]. Its ability to effectively delineate yield variation makes it an invaluable tool in agricultural planning and management, allowing for more precise interventions and improved decision making in precision agriculture practices. These maps were generalized to generate high, medium, and low agronomically homogenous zones, the sizes of which will be within small-scale maize producers’ management capabilities. The efficacy of NDRE in identifying and separating the three yield zones is justified by the significant linear positive correlation between zones and end-of-season maize grain yield (r = 0.873 p = 0.003). This is also corroborated by Figure 11, which shows the relationships between zones and maize grain yields.
The spatial analysis of the maize fields focused on characterizing zones of bare areas and the distribution of vegetative cover, including both maize and weeds. The study revealed that most of the production space fell within the high-yield zones, which occupied an average of 70.4% across the three fields. This classification system indicated that, on average, 21% of the field area in each site was classified as medium-yield zones, while low-yield zones accounted for 8.6%.
Bare spaces, defined as areas lacking adequate plant cover, were found to vary significantly among the fields, with percentages ranging from 12.0% to 34%. The Yendi field showed the highest occurrence of bare areas at 34%, suggesting that substantial portions of the land were underutilized or suffering from conditions that hindered proper crop establishment. This high percentage of unproductive space may be attributed to soil-related constraints, such as poor soil fertility, compaction, erosion, or inadequate water retention, which could limit maize growth. This could also reflect inefficiencies in land management practices, highlighting potential areas for improvement in optimizing the use of available land resources.
Research has shown that bare soil can have profound implications for environmental sustainability. As reported by [60], the ratio of soil loss values between bare soils and croplands can be as high as 20:1 in humid tropical regions, indicating that bare areas are particularly susceptible to erosion and degradation. Consequently, these unoccupied spaces reduce the overall productivity of the fields and pose a risk to the environmental integrity of the agricultural landscape. The potential for increased soil erosion and nutrient loss from bare areas can contribute to long-term soil quality degradation, negatively impacting maize production.
Moreover, the analysis showed that a significant proportion of the bare areas was concentrated in the low-yield zones of the fields. This is not surprising, as the factors leading to lower productivity, such as poor soil conditions or inadequate management, are often associated with higher incidences of bare spots. These findings underscore the need for targeted interventions in these low-yield zones, such as soil amendments, better land preparation practices, or enhanced plant establishment techniques, to reduce bare areas and improve yield potential. Addressing these issues could help mitigate land degradation risks and support more sustainable and productive maize farming practices.
The analysis revealed that the surficial vegetative cover was significantly lower at Yendi compared to Sombolouna and Tilli. These differences in vegetative cover can be attributed to the inherent soil fertility and texture variations across the three fields. As reported by [61], Sombolouna is characterized by clayey soil textures with slightly elevated pH and moderate aluminum levels, which are generally favorable for plant growth. Tilli’s soil, with loamy sand textures and moderate pH, also provides suitable conditions for vegetative development. In contrast, the soil at Yendi is gravelly with low pH and phosphorus levels, which likely hinder the establishment and growth of vegetative cover, contributing to its significantly lower surficial vegetation.
Further analysis showed a significant (p = 0.1) positive correlation between the percentage of weeds in the fields and key maize performance parameters, including population density (r = 0.832; p = 0.005) and maize grain yield (r = 0.604; p = 0.085). This finding is counterintuitive, as conventional wisdom suggests that weed competition reduces crop yields. However, it could be argued that favorable environmental conditions, such as adequate soil moisture, optimal sunlight, and nutrient availability, support the growth of both maize and weeds, particularly in high-yield zones. Conversely, in low-yield zones, where conditions are less favorable, maize and weed growth are likely suppressed, reflecting a more complex interaction between biotic and abiotic factors.
Variability in maize population densities significantly impacts grain yields, as noted by [62]. There is considerable variation in maize population densities across the West African subregion. For instance, in Ghana, ref. [63] reported plant densities ranging from 49,000 to 65,000 plants per hectare, while [64] estimated densities between 18,000 to 55,000 plants per hectare in Nigeria. In this study, plant population densities ranged from 14,774 plants per hectare in the low-yield zones to 23,733 plants per hectare in the high-yield zones. These densities are notably below the attainable and profitable densities reported in Ghana and Nigeria, suggesting that land resources in the studied fields are not utilized to their full potential. This finding underscores the need for optimizing planting densities to enhance maize yields.
Maize yields across the fields varied significantly, ranging 886 metric tons per hectare in the low-yield zone at Sombolouna to 4900 metric tons per hectare in the high-yield zone at Tilli. On average, the highest per unit land yield observed in this study exceeds Ghana’s current average maize grain yield, which stands at 1700 kg/ha [65]. This indicates that, under optimal conditions, the fields studied have the potential to produce yields well above the national average, highlighting opportunities for improving maize production through better land and resource management strategies.

Leveling the Playing Field: Relevance of Study to Small-Scale Precision Agriculture

Precision agriculture (PA) is fundamentally aimed at managing field variability to optimize agricultural productivity [66]. This approach involves assessing spatial variability within fields to identify and address the factors limiting crop yields, particularly in underperforming areas. By implementing targeted management strategies, PA seeks to achieve uniform and optimal crop performance across the entire field, essentially “leveling the playing field” to ensure each section reaches its full yield potential. As defined by [67], scenario analysis is a strategic planning tool used to develop adaptable long-term plans by exploring a range of potential future events and their implications. This method involves evaluating positive and negative scenarios to identify possible outcomes and make informed decisions.
While this study confirmed yield inconsistencies across three distinct differential yield zones (DYZs) within the fields, it did not delve into the underlying causes of these variations. Nevertheless, the study’s findings can be applied to two illustrative scenarios demonstrating how reducing variability, a fundamental principle of PA, can enhance overall productivity. In the first scenario, it is assumed that management practices and input constraints in the low-yield zones (low DYZs) are improved to the level of the medium-yield zones through environmentally sustainable and cost-effective strategies. According to Table 5, implementing this approach would increase production by 7.34% at Sombolouna, 1.29% at Tilli, and 23.02% at Yendi. This scenario emphasizes the potential benefits of targeted interventions in low-yield areas to elevate their performance closer to medium-yield zones.
In the second scenario, targeted actions are taken to elevate the production conditions in all fields to match those of the high-yield zones. Our analysis suggests that this approach would lead to significant yield increases of 8.92% at Sombolouna, 25.96% at Tilli, and a substantial 56.01% at Yendi (Table 6). These results clearly illustrate the principle of leveling the playing field in precision agriculture, demonstrating that aligning management practices across varying field zones to the highest standard can significantly enhance overall productivity. By reducing variability and optimizing conditions across all zones, these scenarios highlight the transformative potential of precision agriculture in achieving more consistent and higher yields, thereby aligning with its core objective of managing field variability for maximum productivity.

5. Conclusions

This study presents a practical approach for assessing and quantifying variability in three maize-producing fields in northern Ghana, utilizing high-resolution data from low-altitude remote sensing conducted with a UAS platform. The EGI was employed to distinguish and create rasters of bare areas and dead vegetation from living plants. By NDRE analysis, combined with the Jenks natural break classification system and a subsequent generalization process, we delineated three spatially contiguous, agronomically homogeneous zones classified as low, medium, and high DYZ across the fields. The classification process was validated through end-of-season maize yield analysis, which confirmed the accuracy of the zonation. Spatial analysis was then conducted to characterize the delineated zones based on critical factors such as the percentage of bare spaces, vegetative cover, maize and weed infestation, population densities, and overall land productivity. Additionally, a scenario analysis was performed to evaluate the potential impact of this technology-driven zonation process and its significance for PA. The scenario analysis indicated that addressing yield-limiting management factors in the low DYZs to elevate them to the levels of medium DYZs could enhance maize productivity by 7.34% at Sombolouna, 1.29% at Tilli, and 23.02% at Yendi. Furthermore, improving the conditions of both low and medium zones to match the agronomically productive levels of the high DYZs could lead to even more significant yield increases of 8.92% at Sombolouna, 25.86% at Tilli and a remarkable 56.01% at Yendi.
The findings from this study on maize-producing fields in northern Ghana demonstrate a practical and replicable methodology for assessing and quantifying spatial variability in agricultural systems, which can be generalized to other regions worldwide. By utilizing high-resolution data from UAS and advanced analytical techniques such as the EGI and NDRE analysis, similar assessments can be conducted in diverse agricultural landscapes, enabling the identification of agronomically homogeneous zones based on critical factors like vegetative cover and land productivity. The successful validation of the zonation through end-of-season maize yield analysis highlights the reliability of this approach, suggesting that it could be adapted to optimize crop management practices globally. Furthermore, the scenario analysis illustrating potential yield increases by addressing management factors in lower yield zones emphasizes the applicability of this technology-driven framework in enhancing productivity across various contexts. As regions face unique challenges and opportunities in agriculture, implementing such precision agriculture strategies can improve resource allocation and sustainability, ultimately contributing to global food security and agricultural development.

Author Contributions

Conceptualization: A.M., T.L., V.K.A. and D.B.; methodology, T.L., V.K.A., D.B., J.M. and A.M.; validation A.M., T.L., V.K.A. and D.B.; formal analysis, J.M., A.M., D.B. and V.K.A.; investigation, D.B., T.L., V.K.A. and A.M., resources, A.M., V.K.A. and T.L.; writing A.M., V.K.A. and D.B.; supervision, A.M. and T.L.; project administration, A.M.; funding acquisition, A.M., T.L. and V.K.A. All authors have read and agreed to the published version of the manuscript.

Funding

The study was partially funded by the Agronomy Department of Iowa State University, Ames, Iowa through graduate training grants, with support from the United States Agency for International Development (USAID).

Data Availability Statement

The original data from this study are presented in this article. For further information, please contact the corresponding author.

Acknowledgments

We would like to thank Jeff Osei Dakota and Prosper Kpiebaya for their invaluable assistance with this work’s image processing and production. Their hard work, expertise, and meticulous attention to detail significantly contributed to the quality and clarity of this document. Thank you for your dedication and support.

Conflicts of Interest

Author Joshua McDanel was employed by Iowa Soybean Association; Daniel Brummel was employed by Corteva Agriscience; and Thomas Lawler was employed by the company Indigo AG, Inc. The remaining authors declare that the research was conducted in the absence of any commercial or financial relationships that could be construed as a potential conflict of interest.

References

  1. Godfray, H.C.J.; Bedlington, J.R.; Crute, I.R.; Haddad, L.; Lawrence, D.; Muir, J.F.; Pretty, J.; Robinson, S.; Thomas, S.M.; Toulmin, C. Food Security: The Challenge of Feeding 9 billion People. Science 2010, 327, 812–818. [Google Scholar] [CrossRef] [PubMed]
  2. Thomasson, J.A.; Sui, R.; Cox, M.S.; Al-Rajehy, A. Precision Agriculture for Sustainability and Environmental Protection. Sustainability 2019, 11, 1218. [Google Scholar]
  3. Fuglie, K.O.; Rada, N.E. Resources, Policies, and Agricultural Productivity in Sub-Saharan Africa; Department of Agriculture, Economic Research Service: Washington, DC, USA, 2013. [Google Scholar]
  4. Lowenberg-DeBoer, J.; Erickson, B. Setting the record straight on precision agriculture adoption. Agron. J. 2019, 111, 1552–1569. [Google Scholar] [CrossRef]
  5. Tittonell, P.; Klerkx, L.; Baudron, F.; Félix, G.F.; Ruggia, A.; Van Apeldoorn, D.; Dogliotti, S.; Mapfumo, P.; Rossing, W.A.H. Ecological intensification: Local innovation to address global challenges. Sustain. Agric. Rev. 2016, 19, 1–34. [Google Scholar] [CrossRef]
  6. Pierce, F.J.; Nowak, P. Aspects of precision agriculture. Adv. Agron. 1999, 67, 1–85. [Google Scholar] [CrossRef]
  7. Schimmelpfennig, D. Precision agriculture technologies and factors affecting their adoption. USDA Econ. Res. Rep. 2016, 217. [Google Scholar]
  8. Okello, D.; Macharia, I.; Kariuki, S. Barriers to the adoption of precision agriculture in East Africa: A critical review. Int. J. Agric. Sci. 2021, 12. [Google Scholar]
  9. Parihar, C.M.; Jat, S.L.; Singh, A.K.; Sharma, A. Role of mobile-based advisory systems in precision agriculture: A case study from India. Int. J. Precis. Agric. 2020, 14. [Google Scholar]
  10. Ndungu, S.; Mwangi, M.; Maina, J. Low-cost soil sensors for smallholder farmers in sub-Saharan Africa: Opportunities and challenges. Precis. Agric. 2022, 12. [Google Scholar]
  11. Rashid, A.; Akram, M.; Akhtar, S. Impact of remote sensing in precision agriculture: A case study from Pakistan. J. Agric. Sci. Technol. 2019, 20. [Google Scholar]
  12. Van Etten, J.; de Sousa, K.; Aguilar, A.; Steinke, J. GeoFarmer: Linking satellite-based insights to smallholders through a participatory approach. Proc. Natl. Acad. Sci. USA 2019, 116, 4194–4199. [Google Scholar] [CrossRef] [PubMed]
  13. Zeng, R. Precision Agriculture: The Way Forward to Enhance Agricultural Productivity and Sustainability. In Proceedings of the 2010 International Conference on Agricultural Engineering, Venice, Italy, 24–26 November 2010. [Google Scholar]
  14. Rilwani, M.L.; Ikhuoria, I.A. Precision farming with geoinformatics: A new paradigm for agricultural production in a developing country. Trans. GIS 2006, 10, 177–197. [Google Scholar] [CrossRef]
  15. Bongiovanni, R.; Lowenberg-Deboer, J. Precision Agriculture and Sustainability. Precis. Agric. 2004, 5, 359–387. [Google Scholar] [CrossRef]
  16. Mulla, D.J. Twenty-five Years of Remote Sensing in Precision Agriculture: Key Advances and Remaining Knowledge Gaps. Biosyst. Eng. 2013, 114, 358–371. [Google Scholar] [CrossRef]
  17. Shatar, T.M.; McBratney, A.B. Site-Specific Management of Soil Variability: A Review of Variability Sources and Implications for Precision Agriculture. Comput. Electron. Agric. 2001, 38, 71–91. [Google Scholar]
  18. Nawar, S.; Corstanje, R.; Halcro, G.; Mulla, D.; Mouazen, A.M. Chapter Four—Delineation of Soil Management Zones for Variable-Rate Fertilization: A Review. Adv. Agron. 2017, 143, 175–245. [Google Scholar] [CrossRef]
  19. Miao, Y.; Mulla, D.J.; Robert, P.C. An integrated approach to site-specific management zone delineation. Front. Agric. Sci. Eng. 2018, 5, 432–441. [Google Scholar] [CrossRef]
  20. Franzen, D.W.; Hopkins, D.H.; Sweeney, M.D.; Ulmer, M.K.; Halvorson, A.D. Evaluation of soil survey scale for zone development of site-specific nitrogen management. Agron. J. 2002, 94, 381–389. [Google Scholar] [CrossRef]
  21. Blackmore, S. The Interpretation of Trends from Multiple Yield Maps. Comput. Electron. Agric. 2000, 26, 37–51. [Google Scholar] [CrossRef]
  22. Kitchen, N.R.; Sudduth, K.A.; Drummond, S.T.; Myer, R.O. A Precision Agriculture Approach to Characterize and Manage Soil Variability in the Corn Belt. Precis. Agric. 2005, 6, 331–348. [Google Scholar]
  23. Schepers, J.S. Site-specific considerations for managing phosphorus. J. Environ. Val. 2000, 29, 125–130. [Google Scholar] [CrossRef]
  24. Doerge, T. Defining management zones for precision farming. Crop Insights 1999, 8, 1–5. [Google Scholar]
  25. Cambouris, A.N.; Nolin, M.C.; Zebarth, B.J.; Laverdiere, M.R. Soil management zones delineated by electrical conductivity to characterize spatial and temporal variations in potato yield and in soil properties. Am. J. Potato Res. 2006, 83, 381–395. [Google Scholar] [CrossRef]
  26. Mulla, D.J.; Schepers, J.S. Key processes and properties for site-specific soil and crop management. In The State of Site-Specific Management for Agriculture; Sadler, E.J., Ed.; ASA; CSSA; SSSA: Madison, WI, USA, 1997; pp. 1–18. [Google Scholar] [CrossRef]
  27. Georgi, C.; Spengler, D. Automatic delineation algorithm for site-specific management zones based on satellite remote sensing data. Precis. Agric 2018, 19, 684–707. [Google Scholar] [CrossRef]
  28. Mahdianpari, M.; Salehi, B.; Mohammadimanesh, F.; Motagh, M. A hybrid classification scheme for land cover mapping with high-resolution remotely sensed images over urban areas. ISPRS J. Photogramm. Remote Sens. 2017, 123, 25–36. [Google Scholar] [CrossRef]
  29. Goffart, D.; Dvorakova, K.; Crucil, G.; Curnel, Y.; Limbourg, Q.; Van Oost, K.; Castaldi, F.; Planchon, V.; Goffart, J.-P.; van Wesemael, B. UAV Remote Sensing for Detecting within-Field Spatial Variation of Winter Wheat Growth and Links to Soil Properties and Historical Management Practices. A Case Study on Belgian Loamy Soil. Remote Sens. 2022, 14, 2806. [Google Scholar] [CrossRef]
  30. Schirrmann, M.; Giebel, A.; Gleiniger, F.; Pflanz, M.; Lentschke, J.; Dammer, K.H. Monitoring agronomic parameters of winter wheat crops with low-cost UAV imagery. Remote Sens. 2016, 8, 706. [Google Scholar] [CrossRef]
  31. Zhang, C.; Kovacs, J.M. The application of small unmanned aerial systems for precision agriculture: A review. Precis. Agric. 2012, 13, 693–712. [Google Scholar] [CrossRef]
  32. Erkbol, H.; Fritschi, F.B.; Shrestha, R. Crop Monitoring Using Satellite/UAV Data Fusion and Machine Learning. Remote Sens. 2020, 12, 1357. [Google Scholar] [CrossRef]
  33. Matese, A.; Toscano, P.; Di Gennaro, S.F.; Genesio, L.; Vaccari, F.P.; Primicerio, J.; Menesatti, P. Intercomparison of UAV, Aircraft, and Satellite Remote Sensing Platforms for Precision Viticulture. Remote Sens. 2015, 7, 2971–2990. [Google Scholar] [CrossRef]
  34. Blackmer, T.M.; Schepers, J.S.; Varvel, G.E.; Walter-Shea, E.A. Nitrogen deficiency detection using reflected shortwave radiation from irrigated corn canopies. Agron. J. 1996, 88, 1–5. [Google Scholar] [CrossRef]
  35. Stone, M.L.; Solie, J.B.; Raun, W.R.; Whitney, R.W.; Taylor, S.L.; Ringer, J.D. Use of spectral radiance for correcting in-season fertilizer nitrogen deficiencies in winter wheat. Trans. Am. Soc. Agric. Eng. 1996, 39, 1623–1631. [Google Scholar] [CrossRef]
  36. Asrar, G.Q.; Fuchs, M.; Kanemasu, E.T.; Hatfield, J.L. Estimating absorbed photosynthetic radiation and leaf area index from spectral reflectance in wheat 1. Agron. J. 1984, 76, 300–306. [Google Scholar] [CrossRef]
  37. Delgado, J.; Verrelst, J.; Alonso, L.; Moreno, J. Evaluation of Sentinel-2 Red-Edge Bands for Empirical Estimation of Green LAI and Chlorophyll Content. Sensors 2011, 11, 7063–7081. [Google Scholar] [CrossRef]
  38. Bendig, J.; Bolten, A.; Bennertz, S.; Broscheit, J.; Eichfuss, S.; Bareth, G. Estimating Biomass of Barley Using Crop Surface Models (CSMs) Derived from UAV-Based RGB Imaging. Remote Sens. 2015, 7, 11449–11467. [Google Scholar] [CrossRef]
  39. Li, F.; Mistele, B.; Hu, Y.; Schmidhalter, U. Reflectance Estimation of Canopy Nitrogen Content in Winter Wheat Using Optimized Hyperspectral Narrow Indices. Precis. Agric. 2014, 15, 95–113. [Google Scholar] [CrossRef]
  40. Gitelson, A.A.; Merzlyak, M.N. Remote estimation of chlorophyll content in higher plant leaves. Int. J. Remote Sens. 1997, 18, 2691–2697. [Google Scholar] [CrossRef]
  41. Cilia, C.; Fava, F.; Benedetto, S.; Morelli, A. Vegetation Indices Performance in the Estimation of Biomass and Nitrogen Content in Wheat. Ital. J. Agron. 2014, 9, 119–126. [Google Scholar] [CrossRef]
  42. Hunt, E.R.; Cavigelli, M.; Daughtry, C.S.T.; McMurtrey, J.E.; Walthall, C.L. Evaluation of Digital Photography from Model Aircraft for Remote Sensing of Crop Biomass and Nitrogen Status. Precis. Agric. 2011, 12, 675–690. [Google Scholar] [CrossRef]
  43. Zhao, Y.; Ma, Y.; Wu, X.; Li, X.; Huang, Y. Weed Detection Using the Red Edge Band in the Hyperspectral Remote Sensing. Sensors 2011, 18, 2861. [Google Scholar] [CrossRef]
  44. Liu, J.; Huang, W.; Sun, M.; Zhang, G. Using UAV-Based NDRE for Mapping Weeds in Maize Fields. Remote Sens. 2019, 11, 1143. [Google Scholar] [CrossRef]
  45. Kelley, J.M.; Kettering, Q.M.; Rodriguez, D. Assessing the Efficacy of Hyperspectral Indices for Mapping Weeds and Crop Health in Precision Agriculture. Precis. Agric. 2020, 21, 1005–1021. [Google Scholar]
  46. Tiessen, H.; Hauffe, H.K.; Mermut, A.R. Deposition of Harmattan dust and its influence on base saturation of soils in northern Ghana. Geoderma 1991, 49, 285–299. [Google Scholar] [CrossRef]
  47. SenseFly. eBee: SenseFly, S.A. 2016. Available online: https://www.sensefly.com/drone/ebee-mapping-drone/ (accessed on 3 March 2023).
  48. United States Naval Academy. Point Cloud Data. Available online: https://www.usna.edu/Users/oceano/pguth/md_help/html/pt_clouds.htm (accessed on 25 September 2023).
  49. Jenks, G.F. The data model concept in statistical mapping. Int. Yearb. Cartogr. 1967, 7, 186–190. [Google Scholar]
  50. Wang, J.; Zhang, H.; Chen, X.; Xu, J. A seed-extended algorithm for detecting protein complexes based on density and modularity with topological structure and GO annotations. BMC Genom. 2019, 20, 637. [Google Scholar] [CrossRef]
  51. SAS Institute Inc. SAS® 9.4 Software; SAS Institute Inc.: Cary, NC, USA, 2023. [Google Scholar]
  52. Meyer, F.; Beucher, S. Morphological Segmentation. J. Vis. Commun. Image Represent. 1990, 1, 21–46. [Google Scholar] [CrossRef]
  53. Woebbecke, D.M.; Meyer, G.E.; Von Bargen, K.; Mortensen, D.A. Color indices for weed identification under various soil, residue, and lighting conditions. Trans. Am. Soc. Agric. Eng. 1995, 38, 259–269. [Google Scholar] [CrossRef]
  54. Dellinger, A.E.; Schmidt, J.P.; Beegle, D.B. Developing nitrogen fertilizer recommendations for corn using an active sensor. Agron. J. 2008, 100, 1546–1552. [Google Scholar] [CrossRef]
  55. Harris, M.A.; Johnston, A.M.; Bertram, M.G. Exploring the effectiveness of UAV-based NDRE for assessing crop health and stress. Precis. Agric. 2021, 22, 967–984. [Google Scholar]
  56. González, R.A.; Suárez, R.R.; Martínez, M.F. Effects of light quality on the growth and chlorophyll content of lettuce. Plants 2021, 10, 610. [Google Scholar] [CrossRef]
  57. Miao, Z.; Cheng, Y.; Zhang, D.; Liu, J. Effects of light spectrum on the growth and quality of cucumber seedlings. Sci. Hortic. 2019, 244, 146–153. [Google Scholar] [CrossRef]
  58. Liu, W.; Zhang, J.; Jin, Z. Effects of chlorophyll content on light interception and photosynthesis of cucumber under different light intensities. J. Plant Physiol. 2018, 227, 154–162. [Google Scholar]
  59. Sharma, S.; Franzen, D.W. Corn height improves the relationship between active optical sensor readings and yield estimates. Precis. Agric. 2014, 15, 588–603. [Google Scholar] [CrossRef]
  60. Labrière, N.; Locatelli, B.; Laumonier, Y.; Freycon, V.; Bernoux, M. Soil erosion in the humid tropics: A systematic quantitative review. Agric. Ecosyst. Environ. 2015, 203, 127–139. [Google Scholar] [CrossRef]
  61. Brummel Daniel, P. Delineation of NDVI-Based Soil Management Zones: Applications of UAS Technology. Master’s Thesis, Iowa State University, Ames, IA, USA, 2019. [Google Scholar]
  62. Tokatlidis, I.S.; Remountakis, E. The impacts of interplant variation on aboveground biomass, grain yield, and harvest index in maize. Int. J. Plant Prod. 2020, 14, 57–65. [Google Scholar] [CrossRef]
  63. Asafu-Agyei, J.N. Effect of plant density on the yield of maize (Zea mays L.) in Ghana. Ghana J. Agric. Sci. 1987, 20, 85–92. [Google Scholar]
  64. Ebong, U.U. Effects of Plant Population Density and Nitrogen Fertilizer on Selection Criteria for Maize (Zea mays). Ph.D. Dissertation, Department of Agronomy, River State University of Science and Technology, Port Harcourt, Nigeria, 1988. [Google Scholar]
  65. Statistics, Research and Information Directorate (SRID): Agriculture in Ghana—Facts and Figures, Ministry of Food and Agriculture. MoFA. 2010. Available online: http://gis4agricgh.net/POLICIES/AGRICULTURE-IN-GHANA-FF-2010.pdf (accessed on 3 March 2023).
  66. McBratney, A.B.; Pringle, M.J. Estimating Average and Proportional Variograms of Soil Properties and Their Potential Use in Precision Agriculture. Precis. Agric. 1999, 1, 125–1152. [Google Scholar] [CrossRef]
  67. Van der Heijden, K. Scenarios: The Art of Strategic Conversation; John Wiley & Sons: Hoboken, NJ, USA, 2005. [Google Scholar]
Figure 1. Location of maize production sites (red pins) that served as project sites: Sombolouna and Tilli in the Upper East Region of Ghana and Yendi in the Northern Region.
Drones 08 00633 g001
Figure 2. Illustration of how DYZs were generalized. Blue ovals are input layers not produced in the generalization process, yellow rectangles are the tools used in ArcGIS Pro, and green ovals are layers produced by the tools used. Arrows display the workflow used to create the final generalized zones.
Drones 08 00633 g002
Figure 3. High-resolution RGB orthomosaics of maize production fields at (a) Sombolouna, (b) Tilli, and (c) Yendi, captured using unmanned aerial systems technology at the R2 stage of the maize crop: (Coordinate System: WGS 1984 WGS 1984 UTM Zone N; Projection: Transverse Mercator: Datum: WGS1984).
Drones 08 00633 g003
Figure 4. Detailed (high resolution) NDRE differential yield zone maps: (a) Sombolouna, (b) Tilli, and (c) Yendi, showing low-, medium-, and high-yielding areas at the R2 stage of the maize crop.
Drones 08 00633 g004
Figure 5. Generalized maps of fields at (a) Sombolouna, (b) Tilli, and (c) Yendi, showing low, medium, and high differential yield zones at the R2 stage of the maize crop.
Drones 08 00633 g005
Figure 6. Percent land coverage of high, medium, and zones at Sombolouna, Tilli, and Yendi. According to Tukey’s studentized range test, bars of the same texture and color with the same letter are not significantly different at the 0.05 level.
Drones 08 00633 g006
Figure 7. Percentage of bare areas in (a) production fields and (b) differential yield zones within fields. Using Turkey’s studentized range test, bars with the same letters are not significantly different at the 0.05 level.
Drones 08 00633 g007
Figure 8. Maize and weed coverages at Sombolouna, Tilli, and Yendi. Using Turkey’s studentized range test, bars with the same letters are not significantly different at the 0.05 level.
Drones 08 00633 g008
Figure 9. Vegetation distribution and its partition into maize and weeds as a function of zones. Using Turkey’s studentized range test, bars with the same letters are not significantly different at the 0.05 level.
Drones 08 00633 g009
Figure 10. Plant density (plants/ha) production in fields (a) and (b) in differential yield zones within fields. Using Turkey’s studentized range test, bars with the same letters are not significantly different at the 0.05 level.
Drones 08 00633 g010
Figure 11. Maize grain production in (a) differential yield zones and (b) in production fields. Using Turkey’s studentized range test, bars with the same letters are not significantly different at the 0.05 level.
Drones 08 00633 g011
Table 1. Geographical center coordinates of maize production fields used in this study.
Coordinates †
Field NameLatitudeLongitude
Sombolouna 11.0054−0.3927
Tilli10.9050−0.5633
Yendi9.44190.1720
† Coordinates are recorded in decimal degrees.
Table 2. Overview of equipment and settings for unmanned aerial flights, aerial platform, software, and parameters.
UAS PlatformeBee Ag (Sensefly)
Flight planning softwareeMotion (Sensefly)
Flight altitude77 m above elevation data (AED)
Resolution7.0 cm/px
Lateral Overlap60%
Longitudinal overlap80%
SensorSequoia multispectral
Spectral bands capturedGreen, Red, Red Edge, Near infrared
Spacing of images13 m
Table 3. Summary of vegetation indices, aerial sensors, spectral bands, and formulae used to derive the EGI an NDRE.
Vegetation IndexSensor TypeSpectral BandsEquation
(1)
Equation
(2)
Equation
(3)
FormulaReference
Excess Green IndexSequoia
Sensor Optimized for Drone Applications (SODA)
Normalized green, red, and blue. g = G R + G + B r = R R + G + B b = B R + G + B E G I = 2 g r b [41,42]
Normalized Difference Red-edge IndexSequoia
Sensor Optimized for Drone Applications (SODA)
Near Infrared
Red edge
N D R E =     N I R R E N I R + R E [39]
Table 4. Yield statistics of identified zones at Sombolouna, Tilli, and Yendi.
Differential Yield ZoneSize (ha)Average Yield
(kg/ha)
Production Based on Zone Size and Potential (mt)Output per Hectare of Land
(kg/ha)
Sombolouna
Low0.61860520
Medium2.3440209410
High3.9241501627
Total field6.87301026203810 A*
Tilli
Low0.6928301950
Medium8.26365030,150
High2.66490013,030
Total field11.61379045,1303890 A*
Yendi
Low0.391800760
Medium7.50262019,650
High1.6045407260
Total field9.49299027,6102910 B*
* Using Turkey’s studentized range test, yield outputs per hectare with the same letters are not significantly different at the 0.05 level.
Table 5. Yield statistics for designated zones at Sombolouna, Tilli, and Yendi, assuming that all low-zone agronomic conditions are elevated to the medium.
Differential Yield ZoneSize (ha)Average Yield
(kg/ha)
Production Based on Zone Size and Potential (kg)Output per Hectare of Land
(kg/ha)
Potential Yield Differential
from Initial Conditions (%)
Sombolouna
Low---
Medium2.95402011,860
High3.92415016,270
Total field size6.87409028,06040907.34
Tilli
Low---
Medium8.95365032,670
High2.66490013,040
Total field size11.61428045,700340012.9
Yendi
Low---
Medium7.89262020,670
High1.6045402260
Total field9.49358033,970358023.02
Table 6. Yield statistics of identified zones at Sombolouna, Tilli, and Yendi in scenario analysis, where in all low and medium zones, agronomic conditions are brought to high zone level.
Differential Yield ZoneSize (ha)Average Yield
(kg/ha)
Production Based on Zone Size and Potential (kg)Output per Hectare of Land
(kg)
Potential Yield Differential
from Initial Conditions (%)
Sombolouna
Low---
Medium---
High6.87415028,510
Total field size6.87415028,51041508.92
Tilli
Low---
Medium---
High11.61490056,890
Total field size11.61490056,890490025.96
Yendi
Low---
Medium---
High9.49454043,080
Total field9.49454043,080454056.01
Disclaimer/Publisher’s Note: The statements, opinions and data contained in all publications are solely those of the individual author(s) and contributor(s) and not of MDPI and/or the editor(s). MDPI and/or the editor(s) disclaim responsibility for any injury to people or property resulting from any ideas, methods, instructions or products referred to in the content.