Abstract
Forest fires have significant implications for the Earth’s ecological balance, causing widespread devastation and posing formidable challenges for containment once they propagate. The development of computer vision methods holds promise in facilitating the timely identification of forest fire risks, thereby preventing potential economic losses. In our study conducted in various regions in British Columbia, we utilized image data captured by unmanned aerial vehicles (UAVs) and computer vision methods to detect various types of trees, including alive trees, debris (logs on the ground), beetle- and fire-impacted trees, and dead trees that pose a risk of a forest fire. We then designed and implemented a novel sliding window technique to process large forest areas as georeferenced orthogonal maps. The model demonstrates proficiency in identifying various tree types, excelling in detecting healthy trees with precision and recall scores of 0.904 and 0.848, respectively. Its effectiveness in recognizing trees killed by beetles is somewhat limited, likely due to the smaller number of examples available in the dataset. After the tree types are detected, we generate color maps, indicating different fire risks to provide a new tool for fire managers to assess and implement prevention strategies. This study stands out for its integration of UAV technology and computer vision in forest fire risk assessment, marking a significant step forward in ecological protection and sustainable forest management.
1. Introduction
Forests are vital for Earth’s ecology and provide habitat for wildlife. They keep our planet cool by absorbing carbon dioxide, helping to make it rain and preventing floods, among other vital roles. Nearly half of the Earth’s known species live in forests. Humans depend upon forests for survival. Not only do they provide us with the oxygen we breathe, but they also supply us with the essential resource of wood used to construct our homes and shelters.
Forests hold significant importance in Canada, providing various economic, social and environmental benefits. The forest sector is a key contributor to the country’s economy, supporting local communities and the gross domestic product (GDP). According to Natural Resources Canada [1], the forest sector generates income for workers in 2400 communities, contributes CAD 25.2 billion to the nominal GDP, supports over 300 forest-reliant communities and employs more than 184,000 Canadians. Furthermore, forests serve as critical biodiversity habitats and offer goods and services that drive sustainable growth and combat climate change. Notably, in British Columbia (BC), the forest sector plays a significant role, with approximately 43,000 individuals employed in the industry in 2020, accounting for 29% of the province’s total commodity export value, amounting to CAD 11.5 billion [2].
However, forest fires pose a severe threat to these valuable ecosystems. Forest fires result in the destruction of natural resources, loss of wildlife and their habitats, disruption of ecosystems, and environmental pollution [3,4]. Moreover, they spread rapidly and present significant challenges for containment. In 2022 alone, the BC Wildfire Service reported 1758 wildfires, which burned approximately 133,437 hectares of land [5].
One effective strategy for mitigating forest fires is through early detection and prevention. Existing methods for assessing forest fires can be categorized into ground, aerial and spaceborne detection systems. The ground-based approach involves deploying Peripheral Observation System (POS) units strategically across sites, which are then interconnected to a Command and Control Center (CCC) via radio or wire connections. Each POS unit comprises a well-stabilized structure housing a horizontal 360° scanning platform equipped with an infrared detector or high-resolution thermal camera, and TV camera. It also includes a command and control unit, a meteorological data acquisition unit, a transmission unit and a power supply. While the ground system provides reliable data, establishing and operating can be costly and time-consuming. Aerial detection systems employ small planes or helicopters to swiftly collect and transmit observation data. However, these aerial systems tend to be expensive.
Additionally, spaceborne detection systems rely on satellites positioned in close orbits to detect fires [3]. Nevertheless, they are susceptible to weather conditions. Furthermore, all of these approaches primarily detect fires that have already started. To address these limitations, our objective is to develop an integrated system capable of proactively assessing forests and their associated fire risks before they occur.
Unmanned aerial vehicles (UAVs) have significantly improved. They are cheaper to manufacture, and easier to fly autonomously or non-autonomously [6]. Computer vision can be integrated into UAVs, making detecting objects in any environment more accessible and cheaper. Object detection algorithms can detect different types of trees for early evaluation of forest fire risks based on the forest fuel types. The following are the main contributions of this paper.
- Approach: We thoroughly research and analyze various object detection algorithms. We aim to utilize these advanced algorithms to detect and classify four specific classes within forested areas: alive trees, beetle- and fire-impacted trees, dead trees, and debris. These classes play a significant role in assessing the potential risks and determining the likelihood of forest fires. We then calculate various fire risks based on the Canadian flammability index for forest fuels ([7]). Finally, we apply the Convex Hull method on georeferenced orthogonal images to create a visualization of forest fire risks. By employing all these techniques, we can better understand the factors leading to forest fires in specific areas and implement targeted strategies to minimize the risk of these devastating events.
- Experimentation: We collect aerial image footage from various regions in British Columbia, Canada for training and testing purposes using various enterprise- and consumer-grade DJI drones.
- Evaluation: We evaluate our approach’s accuracy by measuring whether fire risks are correctly detected or not. We consider mean average precision to determine the overall accuracy of tree species detection. Moreover, we evaluate the accuracy of forest fire risks mapping by comparing the size of computer-vision-detected areas with the actual forest fuel types.The paper is structured as follows. Section 2 examines current methods in fire detection and forest fuel type detection, pinpointing existing research gaps. Section 3 articulates the objective to devise an encompassing framework for fire risk detection. In Section 4, a method for categorizing tree species based on fire risk is presented. Section 5 elaborates on employing the YOLO algorithm for object detection. The sliding window technique for processing extensive UAV imagery is explained in Section 6. Section 7 delves into the visualization algorithms utilized, including bounding box merging, DBSCAN, Convex Hull and color mapping strategies. Section 8 details the methodology encompassing data collection, image preparation, annotation and the training of the model. The paper culminates with Section 9 and Section 10, which present the results and conclusions of the study, respectively.
2. Related Works
2.1. Forest Fire Detection
Researchers have studied different approaches to building forest fire detection models. Among these, a forest fire detection method employing spiking neural networks stands out, as detailed in [8]. This approach harnesses data derived from controlled experiments, utilizing it as training samples to forge a detection model. This model takes into account a comprehensive array of factors including temperature, humidity and concentrations of carbon monoxide, as well as wind speed and direction. The spiking neural network offers a detection accuracy of approximately 91%. On another front, the authors of [9] have proposed a conceptual model aimed at reducing forest fire risks. This model is underpinned by the use of self-adaptive and autonomous unmanned aerial vehicles (UAVs). The effectiveness of this dispatching methodology for steering UAVs, along with the model itself, was validated using a small yet realistic scenario. Looking ahead, the integration of this model with state-of-the-art information technologies could pave the way for the creation of a sophisticated digital twin system.
Forest-fire-related models can also be built and trained based on a smaller dataset with the help of transfer learning. A forest fire assessment approach utilizing the ResNet-18 transfer learning is showcased in [10]. This process commenced with the application of advanced image pre-processing techniques to augment the dataset, followed by the fine-tuning of the pre-trained ResNet-18 model using a targeted training set. The modified ResNet-18 model emerged as a useful tool, demonstrating its ability to accurately identify fire or smoke in images, achieving an accuracy rate of 94.33% on the test set. Adding to the repertoire of techniques is a deep-learning methodology, intertwining YOLOv4 tiny with LiDAR to forge a mixed-learning model, as presented by [11]. When deployed on an onboard UAV, this model not only achieved classification times of 1.24 s but also maintained a high accuracy of 91% and an F1 score of 0.91.
The You Only Look Once (YOLO) algorithm has seen extensive implementation across a range of computer vision projects, demonstrating its efficacy and precision in various applications, including forest fire assessment [12,13,14]. In particular, the YOLO-V3 detection model has been augmented through integration with the Efficient-Net method, enhancing its capabilities in fire detection [15]. This modified model, referred to as Fire-YOLO, leverages Efficient-Net for feature extraction from input images, consequently boosting the model’s feature learning capacity and overall network performance. Comparative experimental evaluations reveal that Fire-YOLO outperforms both the YOLO-V3 model and the Faster R-CNN, showcasing its ability to detect fire targets in real-time scenarios.
YOLO algorithms also form the foundation of another technique for pinpointing forest or jungle fires [16]. This particular deep learning model operates on a Raspberry Pi, with nerve rods attached to a UAV facilitating fire detection. Furthermore, an enhanced version of YOLOv3, termed SRN-YOLO, is introduced in [17], aiming for superior accuracy and a more streamlined network architecture tailored for forest fire assessment. The introduction of a sparse residual network (SRN) addresses overfitting issues by altering skip connections to sparse connections. Within this framework, sparse residual modules supplant the residual units in YOLOv3 and improvements are made to the Darknet-53 backbone network, culminating in the SRN-YOLO network. When subjected to comparative experiments against other YOLO-based networks such as YOLO-LITE and Tinier-YOLO, SRN-YOLO demonstrates its effectiveness and lightweight nature, achieving heightened accuracy in forest fire assessment tasks.
The YOLOv4 algorithm has gained traction as an efficient choice for constructing detection models, as evidenced by the development of a lightweight YOLO forest fire assessment model [18]. The model adopts YOLOv4 as its foundational framework, but introduces MobileNetV3 as a lightweight replacement for the original backbone network. The training process involves images featuring flames and smoke, while images resembling fire are utilized as negative samples to enhance model robustness. Comparative analysis reveals a 62.78% reduction in the number of parameters and a threefold increase in inference speed relative to the original YOLOv4, with the proposed model achieving a detection accuracy measured at 0.666 mAP.
Explorations into deep learning have continued to refine the precision and efficiency of forest fire detection models. A spatial convolutional neural network based on YOLOv3 for high-speed, real-time fire detection was introduced in [19]. This system, implemented on a Banana Pi M3 board, employs cameras for real-time fire detection. In a parallel development, ref. [20] proposed a deep learning fire detection algorithm, incorporating a large-scale YOLOv3 network to enhance accuracy. This algorithm is integrated into the UAV Forest Fire Detection (UAV-FFD) platform, enabling real-time image transmission from the UAV to the ground station. Testing results indicate a 91% recognition rate and a frame rate of up to 30 FPS. Another noteworthy model, FFireNet [21], utilizes the pre-trained convolutional base of MobileNetV2 to classify fire and no-fire images, achieving an accuracy of 98.42%.
The aforementioned studies concentrate on the detection of existing forest fires. To provide a comprehensive evaluation, the subsequent subsection will delve into the current state of the art in relation to fuel type detection, ensuring a thorough comparison of the innovative solutions presented.
2.2. Forest Fuel Type Detection
Many studies have investigated individual tree detection (ITD) in forest settings using UAV images and deep learning methods. Kunyong Yu [22] compared classical computer vision methods and Mask R-CNN for individual tree detection in a young plantation forest using UAV images. The study found that the Mask R-CNN algorithm with a multi-band combination provided the highest accuracy for individual tree detection, followed by the local maxima (LM) and marker-controlled watershed segmentation (MCWS) algorithms when the canopy height model (CHM) was used as the test image. The study also highlighted the trade-offs between accuracy and algorithm complexity, processing requirements and data availability for different individual tree detection algorithms. Researchers have gained significant improvements using the multi-scale approach to do the detection; Jiang, Xiangtao, et al. [23] proposed detection in visible light images by using deep learning techniques and an improved faster R-CNN framework. The proposed method utilized the Swin-Transformer as the backbone network for feature extraction, allowing for effective global information extraction. Besides the model selections, studies have also explored the use of UAV-based ortho imagery to assess canopy health in a specific-tree-type forest. Harris, Ryley C., et al. [24] describes the process of generating a mosaic for point cloud reconstruction and ortho imagery using photogrammetric Structure from Motion software (Pix4Dmapper) with UAV-collected imagery. Another study [25] was conducted in an urban forest setting. It proposed an improved, Faster Region-based Convolutional Neural Network (Faster R-CNN) with the Swin-Transformer method for individual tree detection. This method achieved higher performance than other Faster R-CNN models. Xuewen Wang [26] focused on detecting dead trees in a remote forest and proposed a novel lightweight architecture for small object detection based on the YOLO framework, LDS-YOLO. The LDS-YOLO architecture performs well compared to state-of-the-art models, with an average precision (AP) of 89.11% and a parameter size of 7.6 MB. Instead of detecting dead trees, Dmitry Kislov’s research [27] investigated detecting forest damage caused by windthrows and bark beetles. A U-Net-like CNN algorithm was proposed to detect forest damage.
Assessment of forest fire risk is essential for forest fire management and decision-making. A study has developed a novel framework to assess forest fire risks and policy decisions on forest fire management in China [28]. The framework integrated deep learning algorithms, geographic information and multi-source data, which results in high accuracy prediction of fire risks (accuracy 87.4%, positive predictive value 87.1%, sensitivity 88.9%, area under curve (AUC) 94.1%).
2.3. Research Gap
This research project addresses significant gaps in the existing literature, and tools for fire risk detection and mapping. To the best of our knowledge, this is the first production-ready tool that allows forestry managers to explore the fire risk of the forests in their area, simulate various strategies to mitigate the fire risk and validate their efficacy before implementing them in real-life scenarios. Our end-to-end system is designed explicitly for fire risk assessment rather than detecting existing, challenging and costly to manage fires. While some studies have focused on aspects of fire risk assessment, there needs to be a comprehensive tool that integrates various technologies and techniques to provide a holistic solution. Our research project combines computer-vision-based detection from UAV (unmanned aerial vehicle) images with innovative mapping strategies to generate an intuitive and user-friendly color mapping of large forest areas with varying fire risks. We can process large georeferenced orthogonal images thanks to the newly designed and improved sliding window technique.
Overall, the proposed research project provides a practical and comprehensive tool to assess, simulate and mitigate fire risks effectively, addressing the research gaps and offering valuable insights for sustainable forest management.
3. Problem Description
The primary goal of this research project was to create a comprehensive framework that enables forestry experts, government agencies and firefighter crews to detect areas with high flammability potential and take action to reduce the risk of forest fires. This framework will serve as a vital tool for mitigating the devastating effects of forest fires on the environment and communities. In particular, our project focuses on certain regions of British Columbia, Canada, where the risk of forest fires is exceptionally high due to the region’s dry climate and history of forest fires. To solve the overall problem, we divide our project into four subproblems:
- Create a forest fire risk ranking based on forest fire fuel sources’ flammability rankings.
- Implement an object detection algorithm to identify specific tree types and associate them with various risks of forest fires.
- Design an approach to process large, georeferenced orthogonal images and merge areas of similar fire risk areas for more straightforward evaluation.
- Develop a user-friendly visualization solution based on color mapping to allow easy access and interpretation of the data provided by the framework.
The entire methodology steps are shown in the flowchart below (see Figure 1). We then discuss the details of chosen solutions to each subproblem in the following sections.
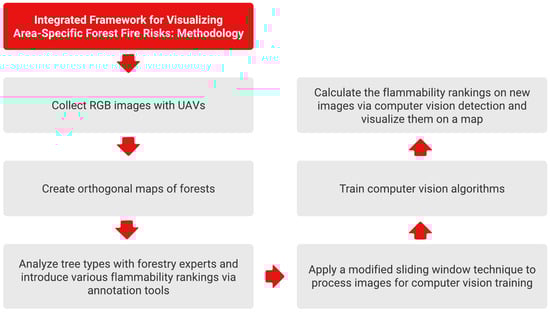
Figure 1.
Methodology flowchart.
4. Fire Risk/Flammability Ranking
To further refine the accuracy of our predictive model, we cataloged each tree species within the designated study area. This comprehensive classification was essential for assigning accurate fire risk levels, which were determined by the distinct flammability of each species. Our initial compilation, drawn from Natural Resources Canada’s Fuel Type Information [7], identified a diverse array of 15 tree species. This included pine, fir, spruce, birch, cedar and aspen, each with unique characteristics that contribute to fire propagation.
The flammability index we developed for our tree inventory ranged from 40 to 80. On this scale, a score of 0 would indicate no fire risk. In contrast, a score of 100 represents an absolute certainty of forest fire given an ignition source near the tree, whether from natural causes or anthropogenic activities. To facilitate a practical application for forestry management, we delineated four distinct fire risk categories: minimal, low, moderate and high. The flammability rankings directly informed these categories, ensuring that our classification system was scientifically robust and operationally actionable.
Our UAV image samples contained only trees with moderate fire risk rankings. Based on discussion with forestry experts, we then analyzed additional factors for fire risks:
- If there is debris around the trees, the risk of a forest fire is slightly higher.
- If the tree is dead (previous fire, dried or any other reason), the risk becomes significantly higher for the area.
- If the tree is affected by Japanese beetle, the risk becomes extreme, as the tree still has flammable leaves but water is no longer taken in, making it highly combustible.
Based on this information, we established four types of trees, each representing a different level of fire risk, as shown in Table 1. The image examples are shown in Figure 2.

Table 1.
Tree type and risk level.
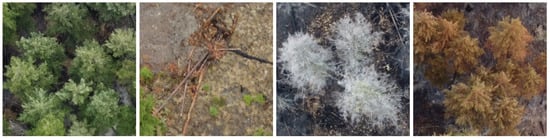
Figure 2.
From left to right: alive tree, debris, dead tree and beetle–fire tree.
5. Sliding Window Technique
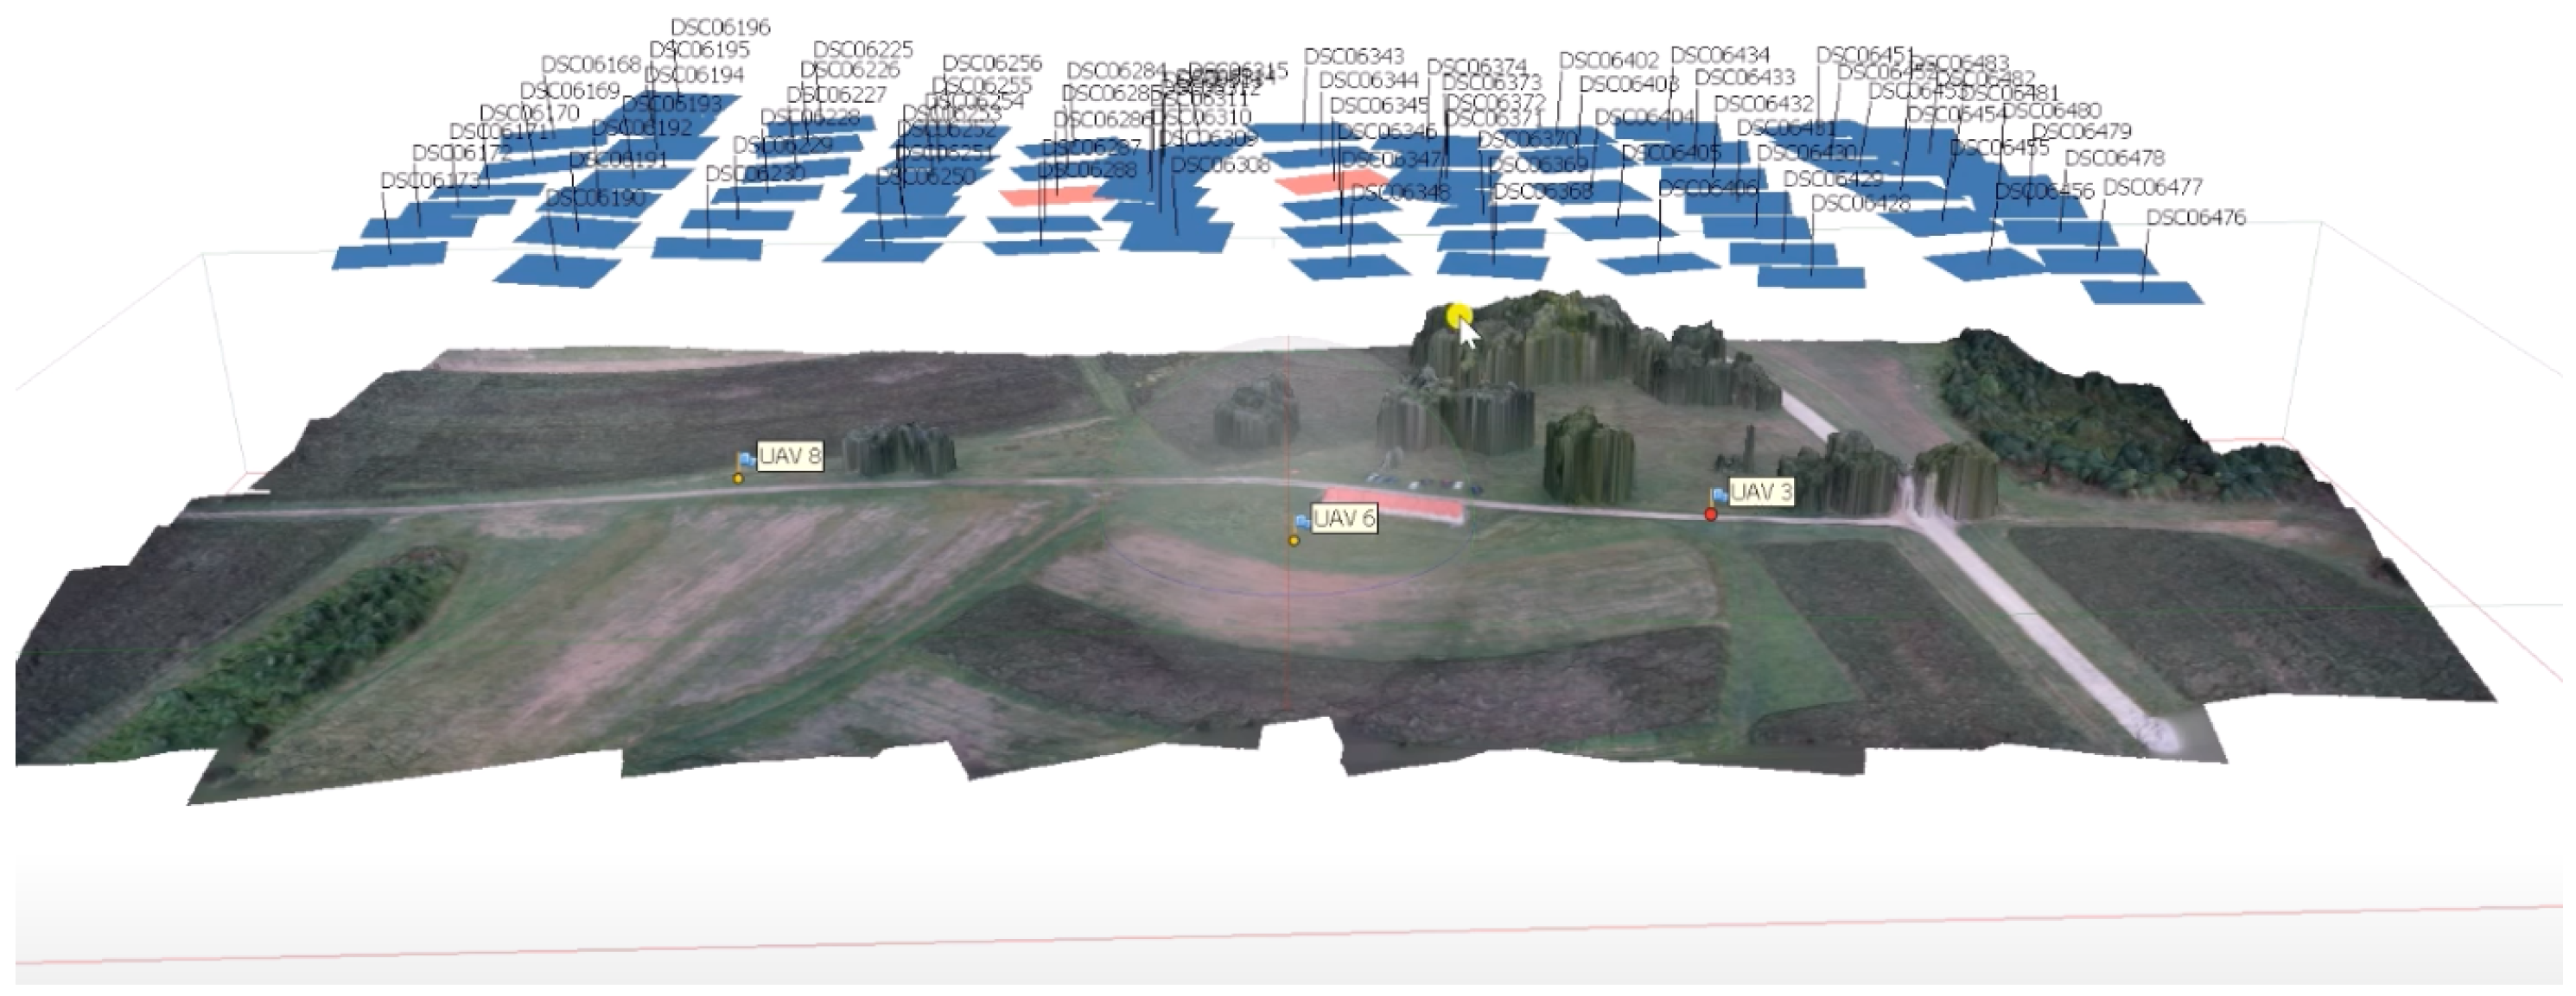
The next part of our research is processing large, geotagged, orthogonal images. The first step is to collect images of a forest using a UAV. Before the UAV takes off, a flight plan needs to be established. This plan considers the area to be covered, flight altitude, speed and the path the UAV will follow to ensure comprehensive image capture. Once the UAV is airborne, it autonomously follows the pre-determined flight plan, navigating through the forest area to capture RGB images. It employs DJI-based path planning and GPS to maintain stability and precise flight paths. The UAV’s onboard sensors and software help ensure obstacle avoidance and safe navigation in complex forest environments. The collected images of the entire scanned area form a shape of mosaic, as seen in Figure 3.
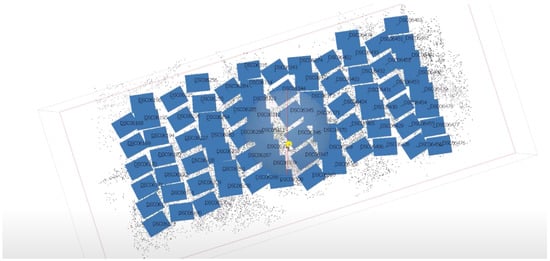
Figure 3.
An unmanned aerial vehicle (UAV) collects images of the forest area.
As a next step, the images are stitched together using coordinates, as seen in Figure 4. We first assign coordinates to each captured image based on their position in real-world space. The X and Y coordinates represent the horizontal and vertical positions, respectively, while the Z coordinate denotes the altitude of each image. We then align images and follow an automatic stitching process using external software (this not being a focus of our study). After stitching the images together, we apply additional post-processing techniques to ensure smooth transitions between the individual images. This may involve blending the overlapping regions, correcting exposure and color variations, and removing any artifacts or distortions caused by the stitching process.
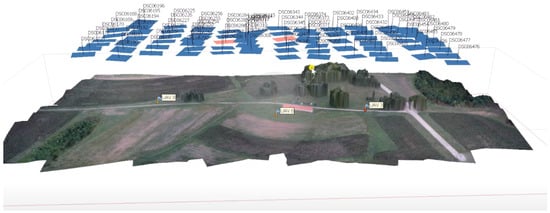
Figure 4.
Stitching of the images.
Finally, we employ a sliding window technique with geotagging, which allows us to scan large images with computer vision techniques, perform object detection and associate the areas with actual geocoordinates. The process is visualized in Figure 5.

Figure 5.
Sliding window technique.
We begin iterating over the large orthogonal image using the sliding window technique at the image’s top-left corner and move the window horizontally and vertically based on the specified stride. Each time the window moves to a new position, it captures a subregion of the image within its boundaries. For each sliced image, we run our object detection methods. We then collect and aggregate the results obtained from the processing of each subregion, and assign specific labels and georeferences.
6. Object Detection Algorithm
Among the most important computer vision applications are object detection algorithms. These techniques allow computers to locate objects of interest in images or videos. At the moment, the best object detection algorithms involve image processing operations and deep learning architectures.
Object detection algorithms can be categorized into two main groups: two-stage detectors and single-stage detectors. Two-stage detectors [29] generate a set of region proposals that are likely to contain objects (first stage). These regions are then classified to get the final object detection results (second stage). Single-stage detectors predict object bounding boxes and class labels without using a region proposal step. When compared to their two-stage counterparts, single-stage detectors are usually faster but less accurate.
One of the criteria to build a system for forest fire mitigation was the quick execution/detection time. Because of this, we decided to choose a single-stage detection algorithm. We opted for the YOLO family of algorithms [30] because our preliminary experiments showed that, for our application, these algorithms offer a high detection speed with great accuracy. We are going to discuss the YOLO algorithm in subsections below.
6.1. YOLO
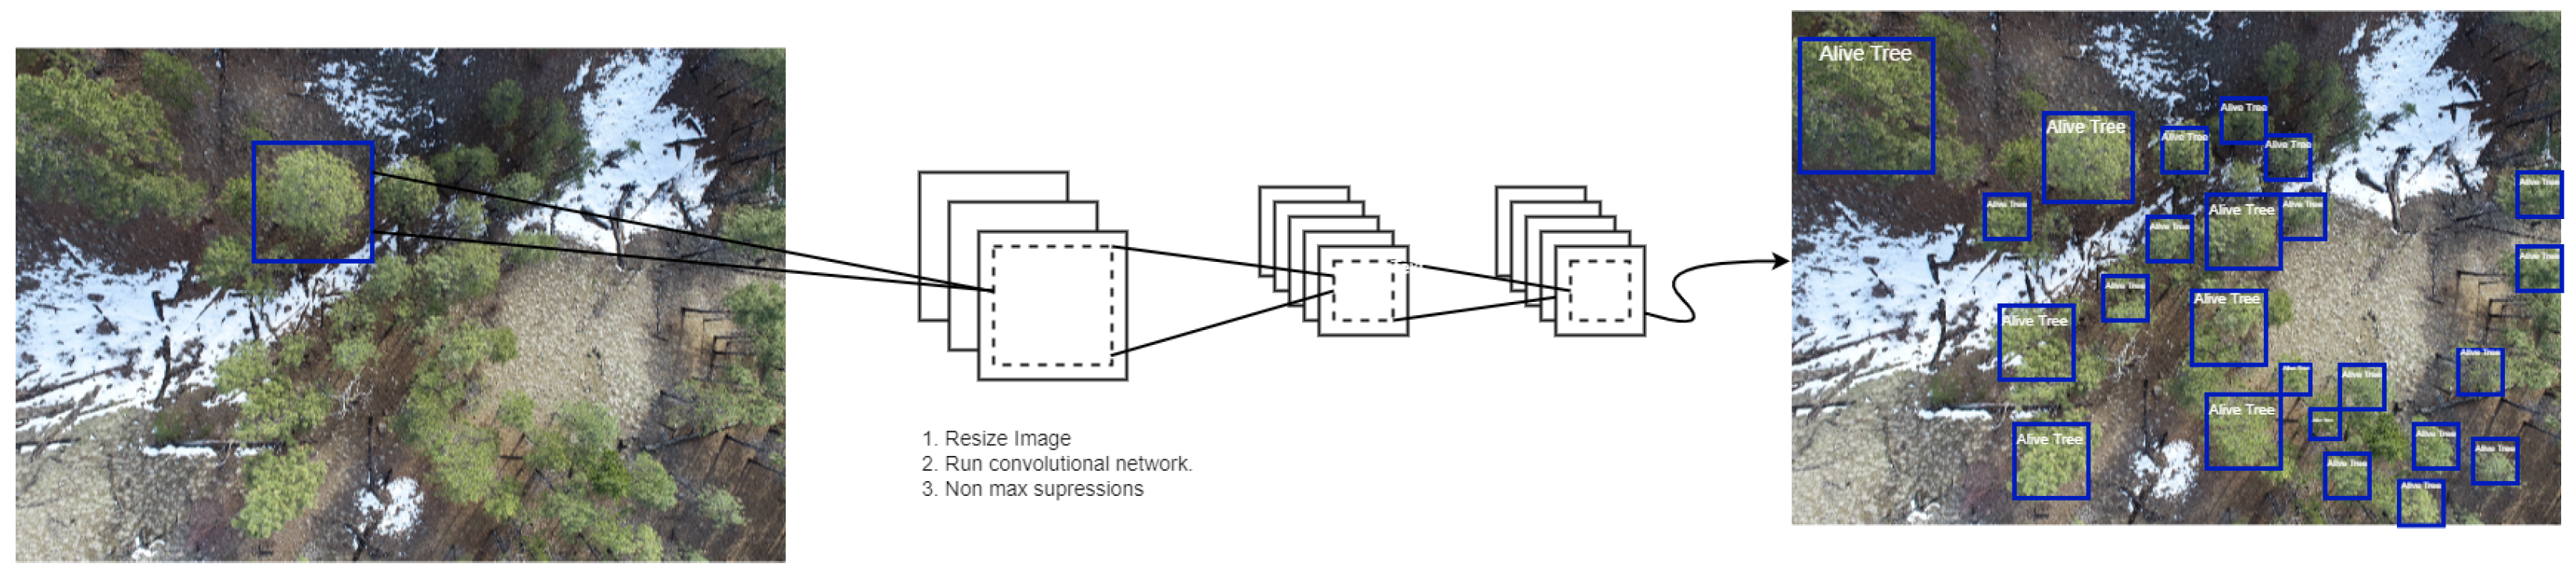
YOLO (You Only Look Once) represents a paradigm shift in computer vision, approaching object detection as a singular regression task, diverging from traditional classification methodologies [30]. It employs a single convolutional network to concurrently forecast numerous bounding boxes and the associated class probabilities for these boxes, as depicted in Figure 6. Throughout both training and testing phases, YOLO subjects the full image to analysis, inherently capturing and integrating contextual details regarding class attributes and visual characteristics.
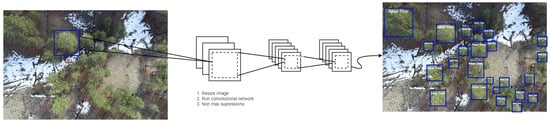
Figure 6.
A quick glance at YOLO object detection used to locate trees.
6.1.1. Detection
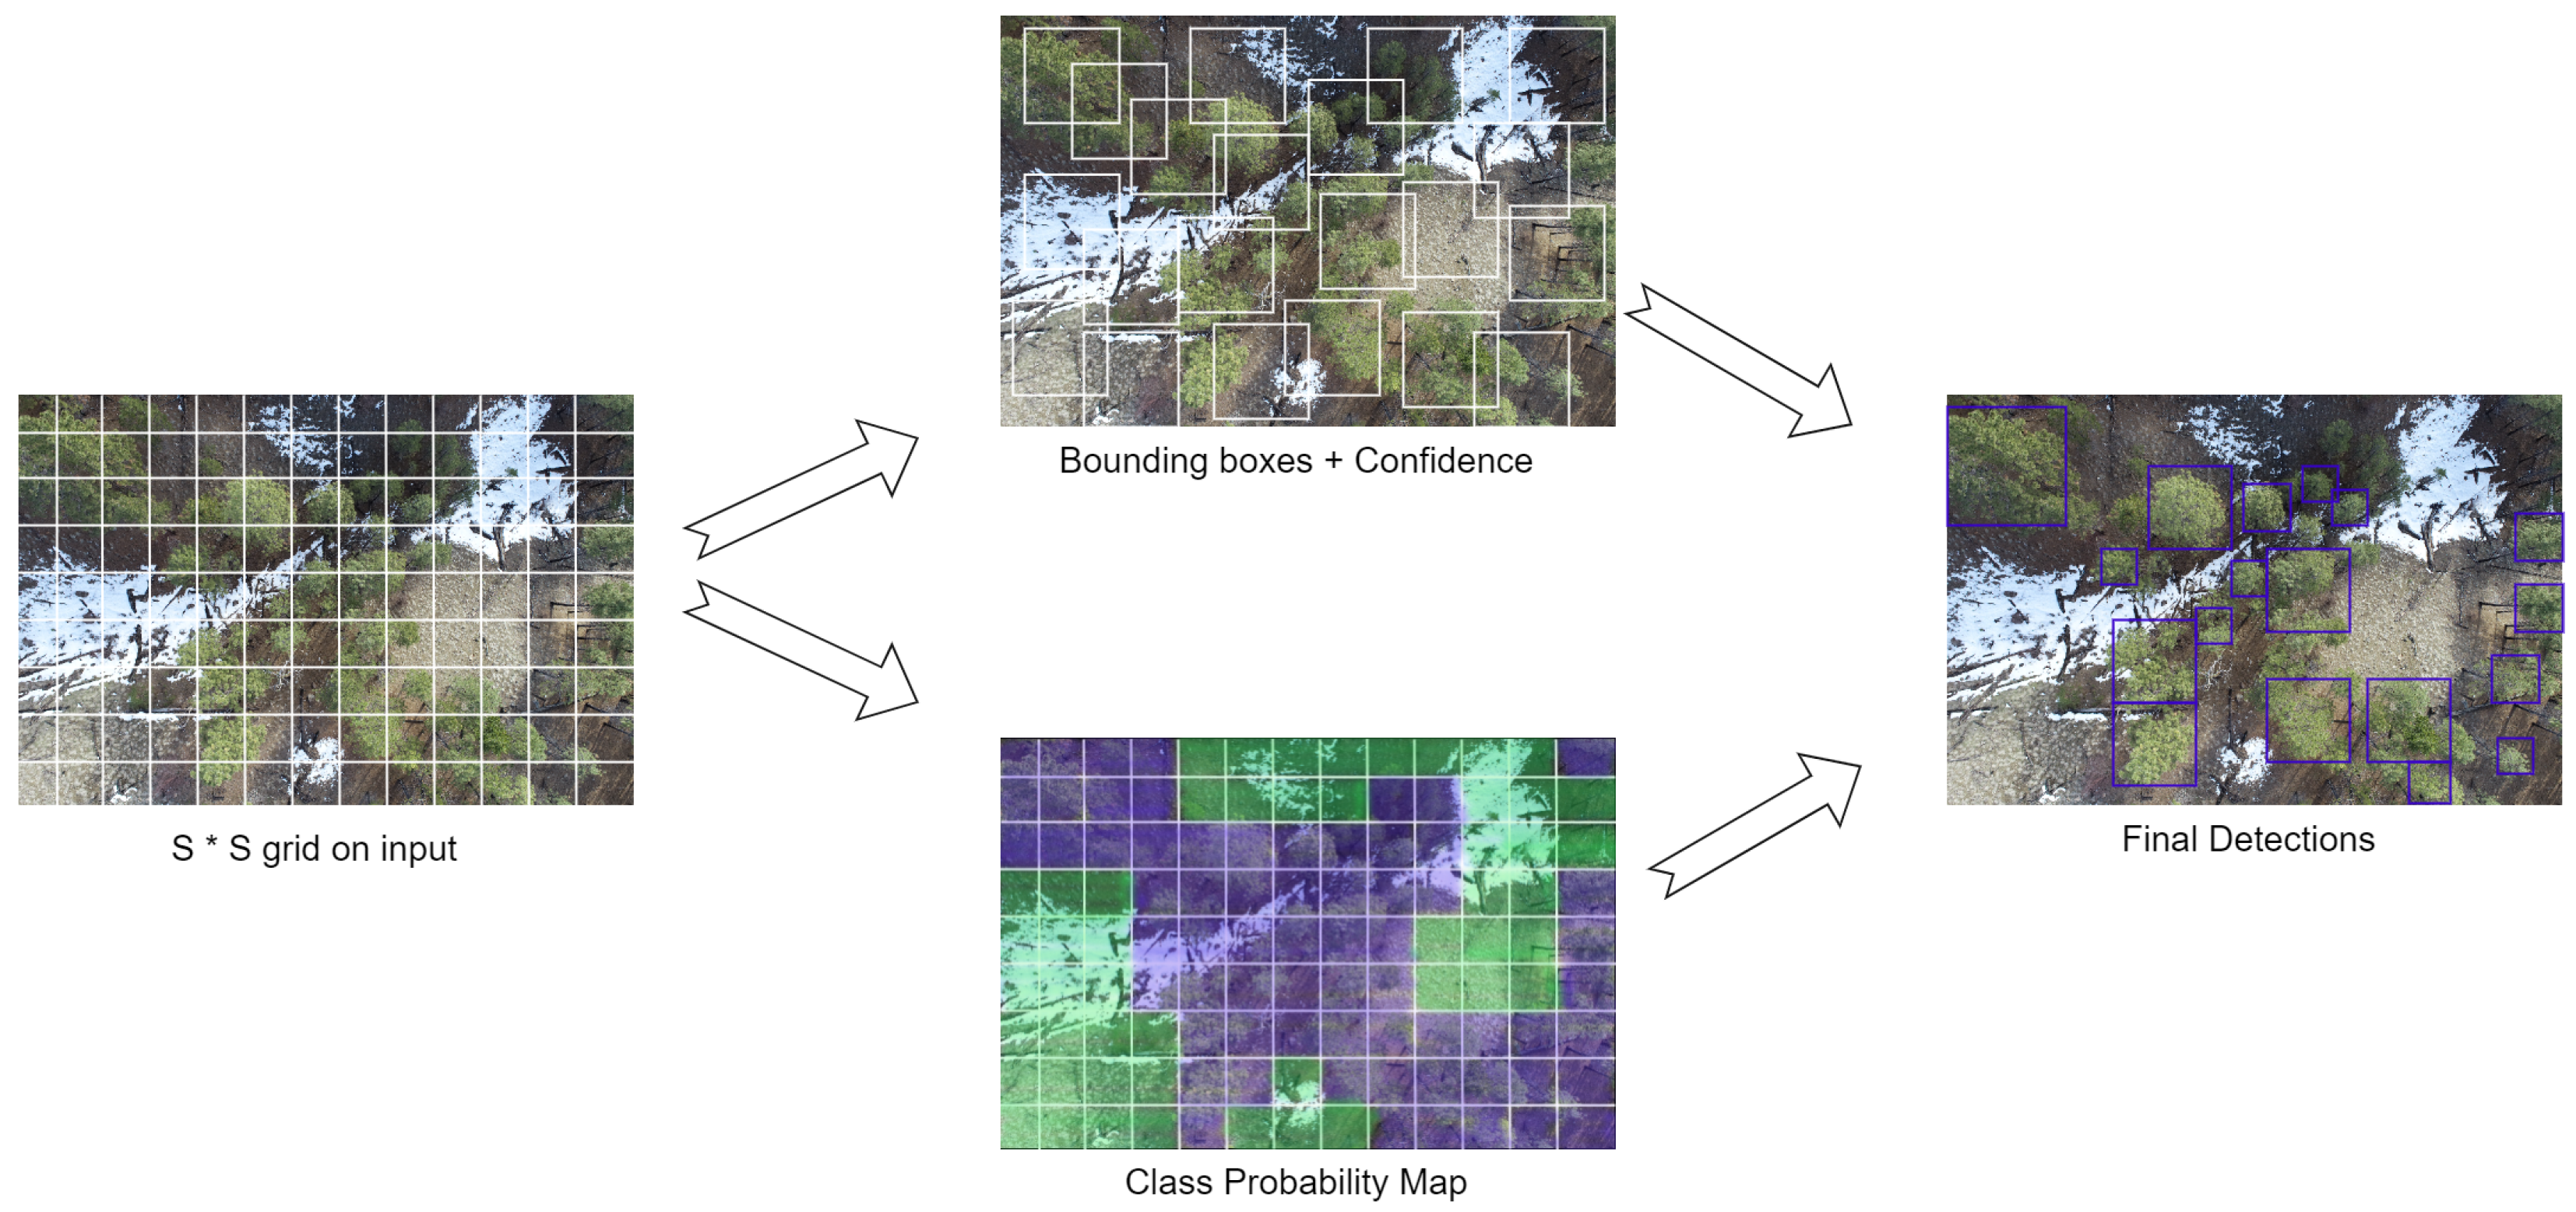
The detection process is systematically illustrated in Figure 7. An input image undergoes division into an grid, assigning the detection responsibility to a specific grid cell if an object’s center resides within its boundaries. Each grid cell concurrently generates predictions for bounding boxes and computes confidence scores for these boxes. The confidence is formulated as , equating to zero in the absence of an object within the cell, and otherwise reflecting the Intersection Over Union (IOU) between the predicted and ground truth boxes.
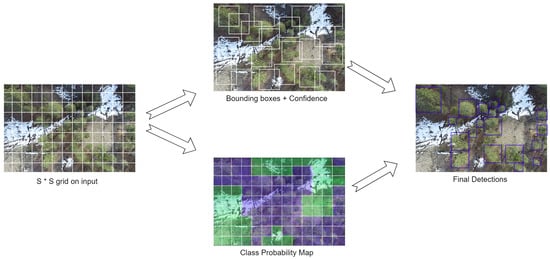
Figure 7.
Object detection using YOLO.
The structure of each bounding box encompasses five predictions: and confidence. Here, denotes the center of the box, normalized to the dimensions of the grid cell, while signifies the box’s width and height, predicted in relation to the entire image’s dimensions.
In addition, each grid cell outputs C conditional class probabilities specific to scenarios where the cell encompasses an object. Irrespective of the number of boxes, a singular set of class probabilities is generated per grid cell. During testing, these conditional class probabilities are integrated with individual box confidences through multiplication, as formalized in the following equation:
6.1.2. Architecture
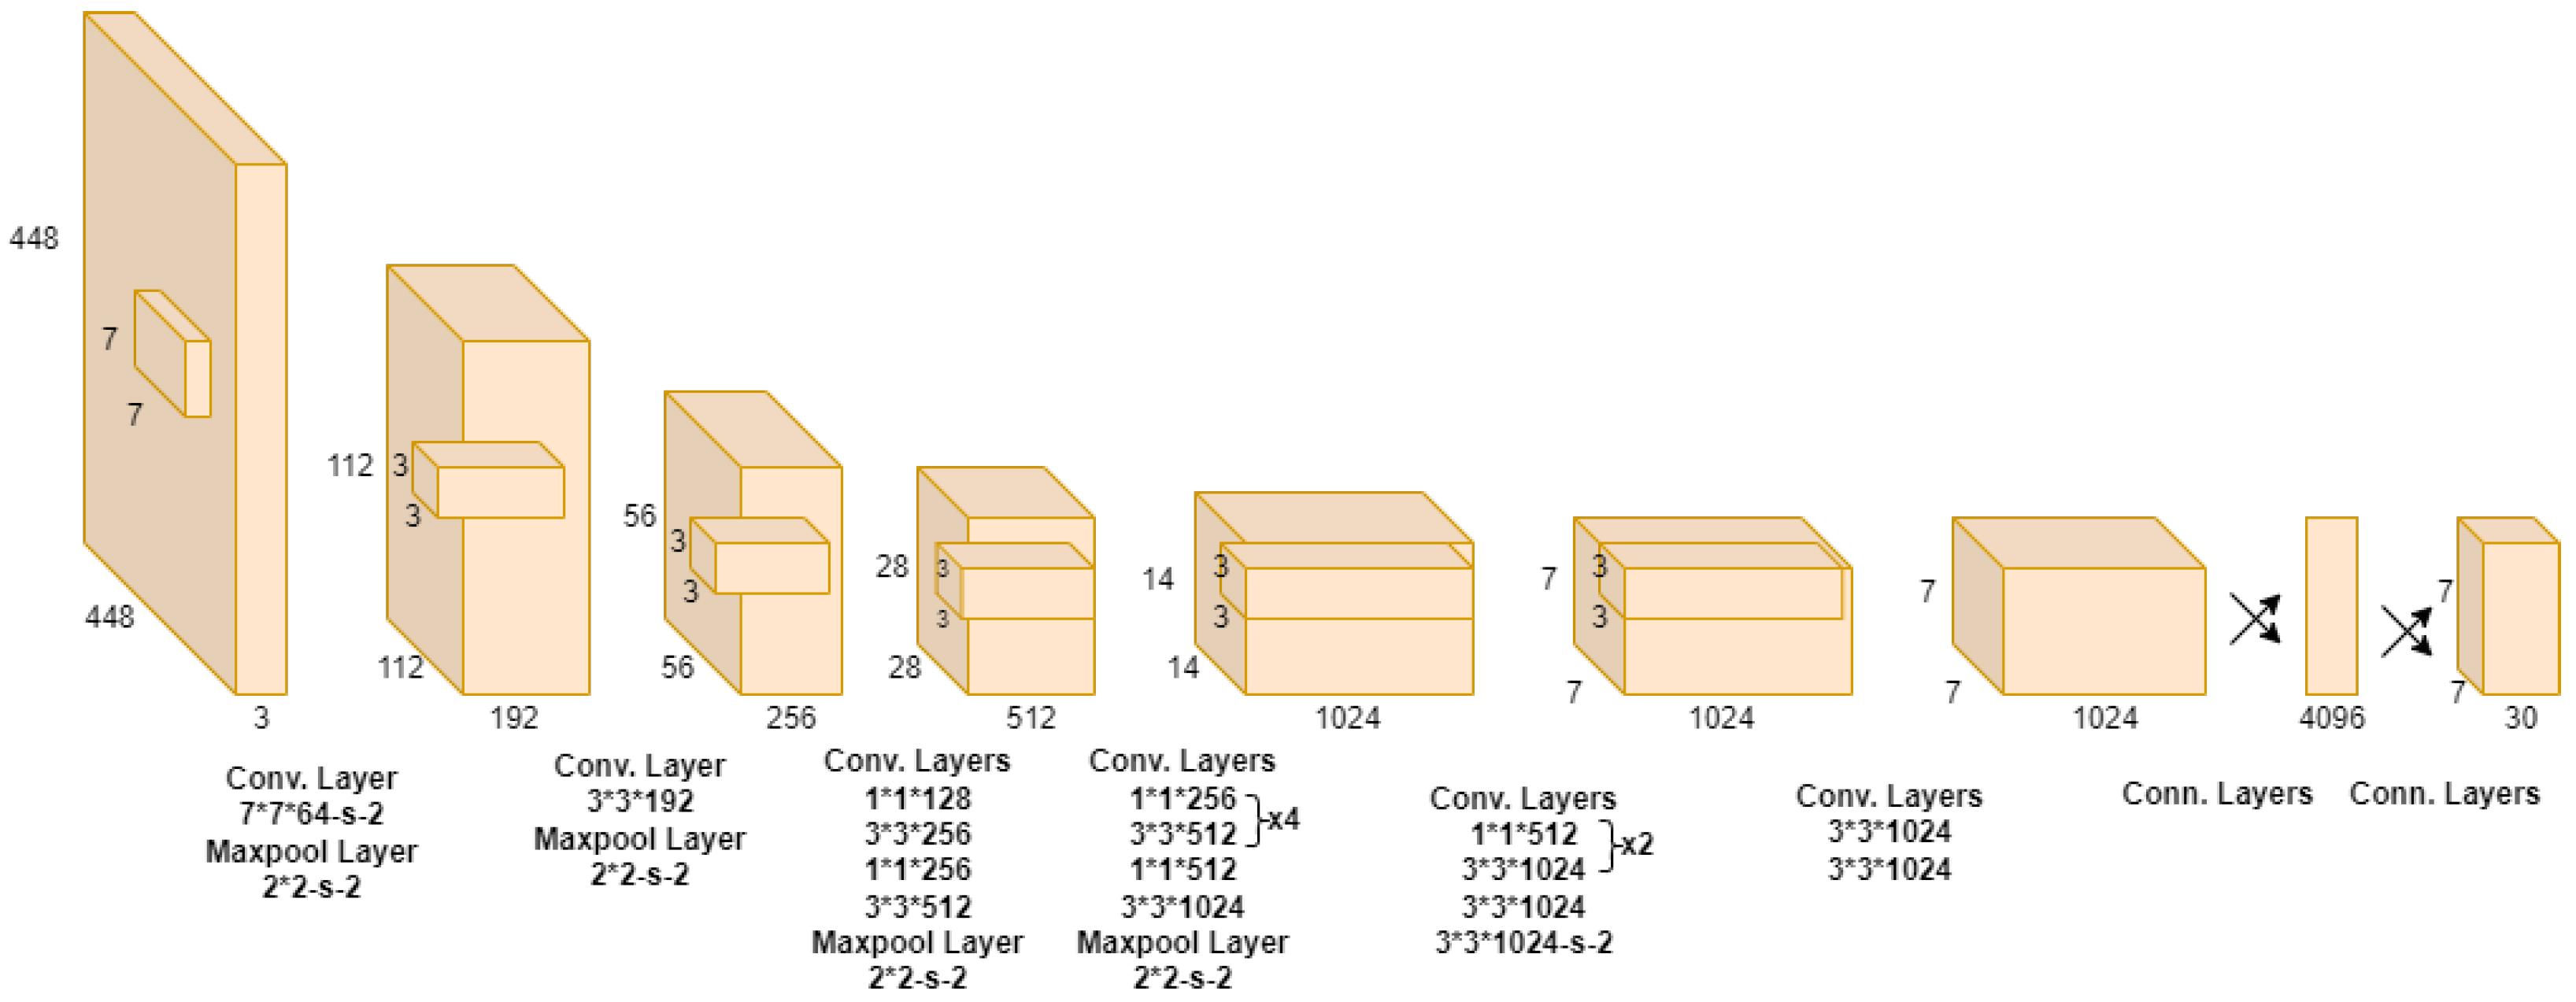
The YOLO model operates as a convolutional neural network, employing initial convolutional layers for image feature extraction and fully connected layers for output probability and coordinate prediction. The network’s architecture encompasses 24 convolution layers and two fully connected convolution layers. It integrates alternating convolution layers to diminish the feature space of preceding layers. This network configuration is visually represented in Figure 8.
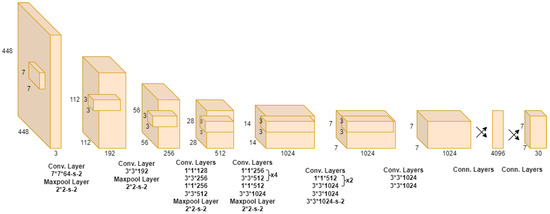
Figure 8.
Architecture of YOLO [30].
6.1.3. Activation and Loss Function
The model’s final layer undertakes the dual task of class probability and bounding box coordinate prediction, subsequently normalizing the coordinates between 0 and 1. For the final layer, a linear activation function is employed, while all preceding layers utilize a leaky rectified linear activation defined as follows:
The optimization of the network involves minimizing the sum-square error through the loss function, as articulated in Equation (3).
In this equation, represents the grid utilized by YOLO for detection, B indicates a bounding box, identifies whether an object is present in cell i and signifies whether the bounding box is responsible for predicting the object in cell i, while and are regularization parameters to maintain balance in the loss function. The terms , , , , and denote the bounding box’s center location, width, height, confidence score and classification loss, respectively.
6.2. YOLOv8
Ultralytics, who had developed a previous version of YOLO, released YOLOv8 [31] in January 2023. While there is no official paper on YOLOv8 at the time of writing, we can gain insights into its architectural decisions compared to previous YOLO versions. Similar to the current trend, YOLOv8 adopts an anchor-free approach, reducing the number of box predictions and improving the speed of Non-Maximum Suppression (NMS). During training, YOLOv8 utilizes mosaic augmentation. However, it has been discovered that using this augmentation throughout the entire training process can have negative effects, so it is disabled for the last ten epochs.
In terms of scalability, YOLOv8 introduces five scaled versions: YOLOv8n (nano), YOLOv8s (small), YOLOv8m (medium), YOLOv8l (large) and YOLOv8x (extra large). These different versions cater to various requirements and allow users to choose the one that best suits their specific needs.
7. Visualization Algorithm
7.1. Merging Bounding Box Algorithm
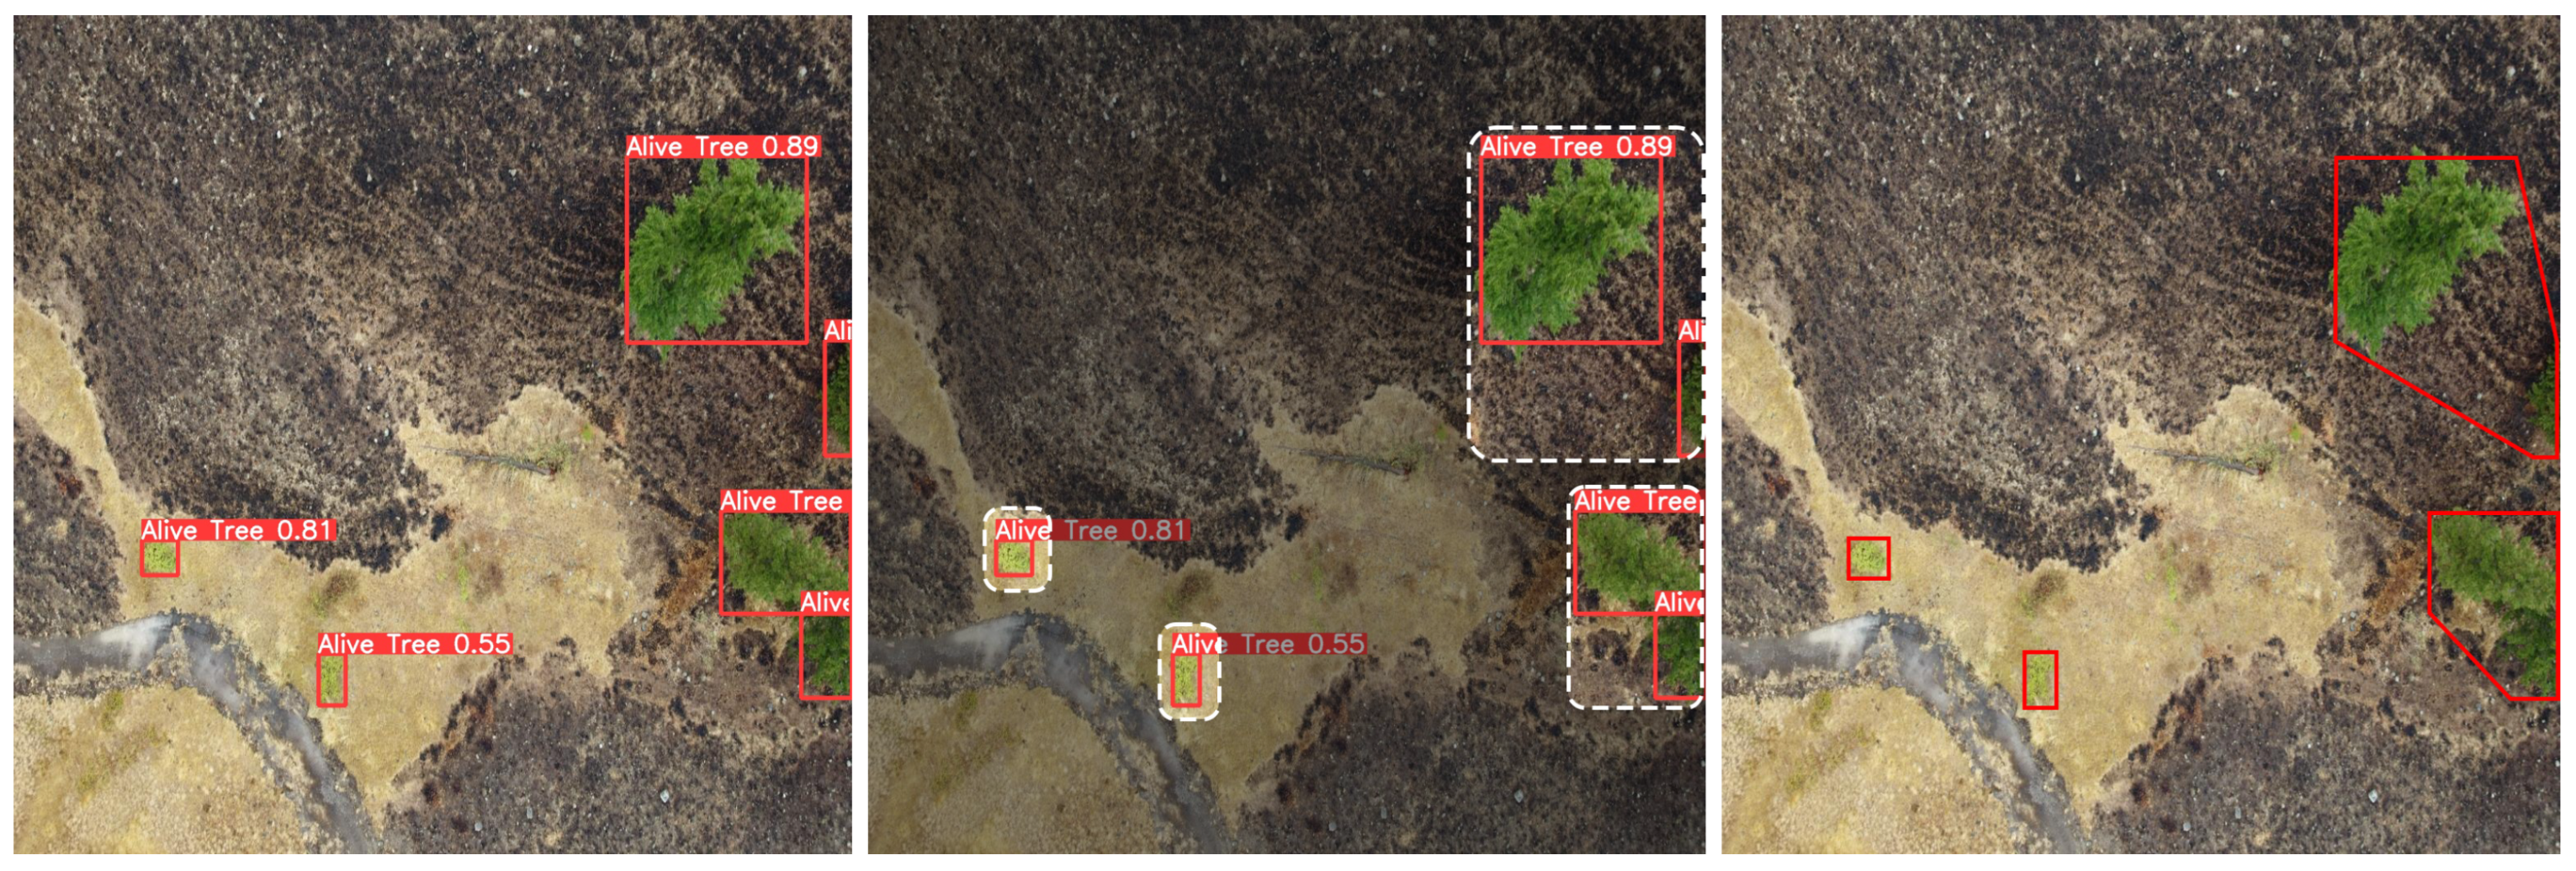
Too many points of interest in an image can overwhelm the visual effect after detection, making it harder to identify detected targets. To rectify this problem, we have created Algorithm 1 to merge adjacent bounding boxes of similar classes and display them as a single bounding polygon. This process reduces visual clutter and provides a clearer representation, as demonstrated in Figure 9. Each component of the algorithm is discussed in the subsections below.
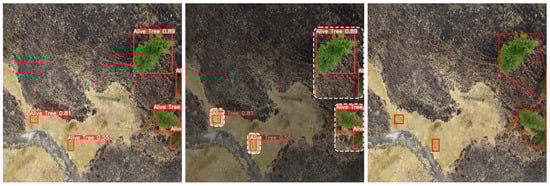
Figure 9.
Left to right: original prediction, group bounding boxes with DBSCAN algorithm, merge bounding boxes with Convex Hull algorithm.
| Algorithm 1: Algorithm to Group and Merge Bounding Boxes |
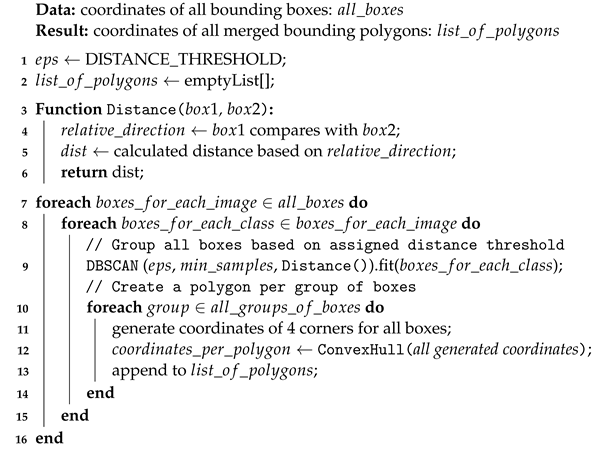 |
7.2. DBSCAN Algorithm
The process of grouping bounding boxes based on their proximity to each other is crucial for effective bounding box merging. To achieve this, we adapt the DBSCAN algorithm (as shown in Algorithm 2), introduced by Schubert et al. [32]. This approach allows us to group bounding boxes in the same class within an image. In this context, distance is measured as the number of pixels between one bounding box and another.
| Algorithm 2: Abstract DBSCAN Algorithm |
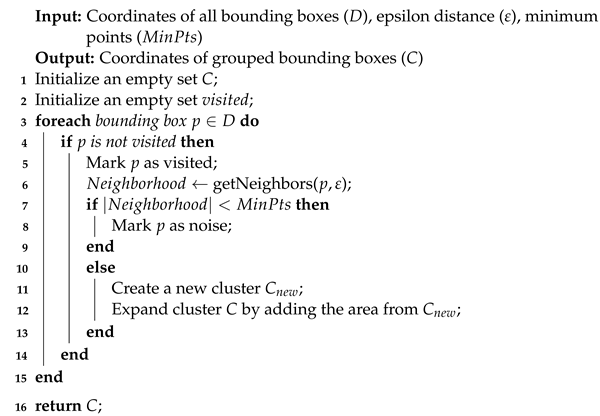 |
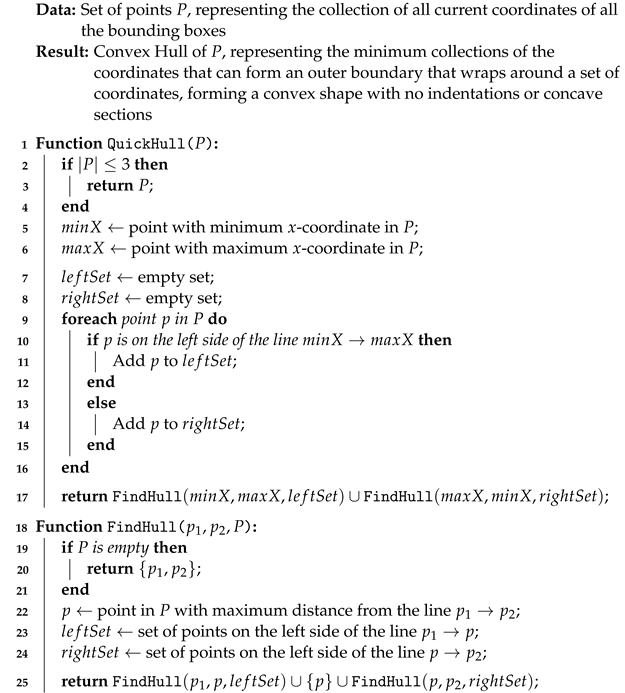
7.3. Convex Hull Algorithm
After merging bounding boxes using the DBSCAN algorithm, we employ the Convex Hull algorithm to connect boxes within the same group. The Convex Hull algorithm identifies a set of points on a plane and determines the smallest set of points that form a convex polygon encompassing all the points. Several Convex Hull algorithms have been proposed, each with different time and space requirements. In our case, we have selected the QuickHull algorithm [33] due to its fast execution speed and efficient memory usage. We present the implementation details in Algorithm 3.
| Algorithm 3: Convex Hull (Quickhull) Algorithm |
 |
7.4. Coloring Algorithm
As a final step, we apply color masks to detected areas. It allows us to provide a user-friendly visualization of forest fire risks associated with specific forest areas. An example result showcasing the color-coded objects can be seen in Figure 10 and is based on color coding from Table 2.
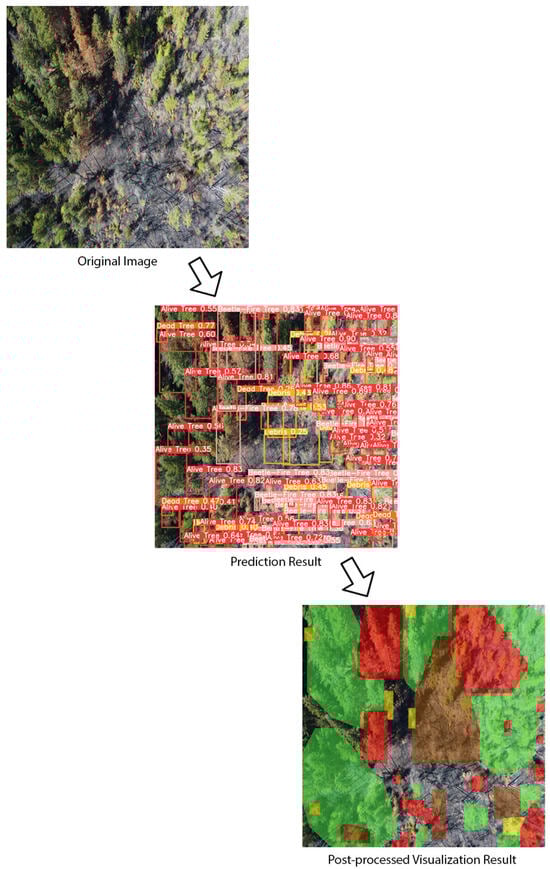
Figure 10.
Original image, prediction result and post-processed visualization result.
Table 2.
Fire risk color scheme.
8. Methodology
The data for our model was collected by UAVs in various regions in British Columbia. RGB images of size 4 k were captured at the height of 75–100 m above the ground level. To prepare the data for training, we pre-processed the images and annotated key points of interest using RoboFlow. The model was then trained using the Northeastern Discovery Cluster.
8.1. Annotation
To ensure consistency in the annotation process across our team, we utilized a series of annotation guides when labeling our dataset with the four defined classes. These guides were designed to provide clear instructions for team members to follow. Here are some examples of the guidelines we used, visualized in Figure 11:
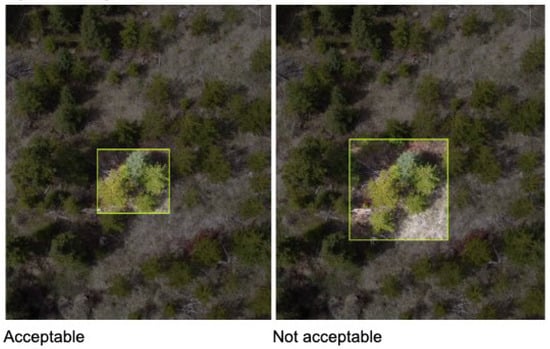
Figure 11.
Example of annotation guide: tight bounding box.
- Annotate trees together if they are very close to each other and in the same type; annotate trees separately if they are not close to each other or not in the same type.
- Draw a tight bounding box with no offset space from the tree.
- Annotate complete trees instead of part of the tree.
- Avoid bounding boxes overlapping each other.
8.2. Pre-Processing
A model yields greater accuracy when it is given training data in a suitable format. To achieve this objective, we conducted pre-processing on the dataset, which ultimately led to improved levels of accuracy. The following steps were performed as a part of the pre-processing stage:
- Resize:
- We resized all the images to 1024 × 1024 pixels. This size ensures the model is able to capture a large number of small trees without losing details.
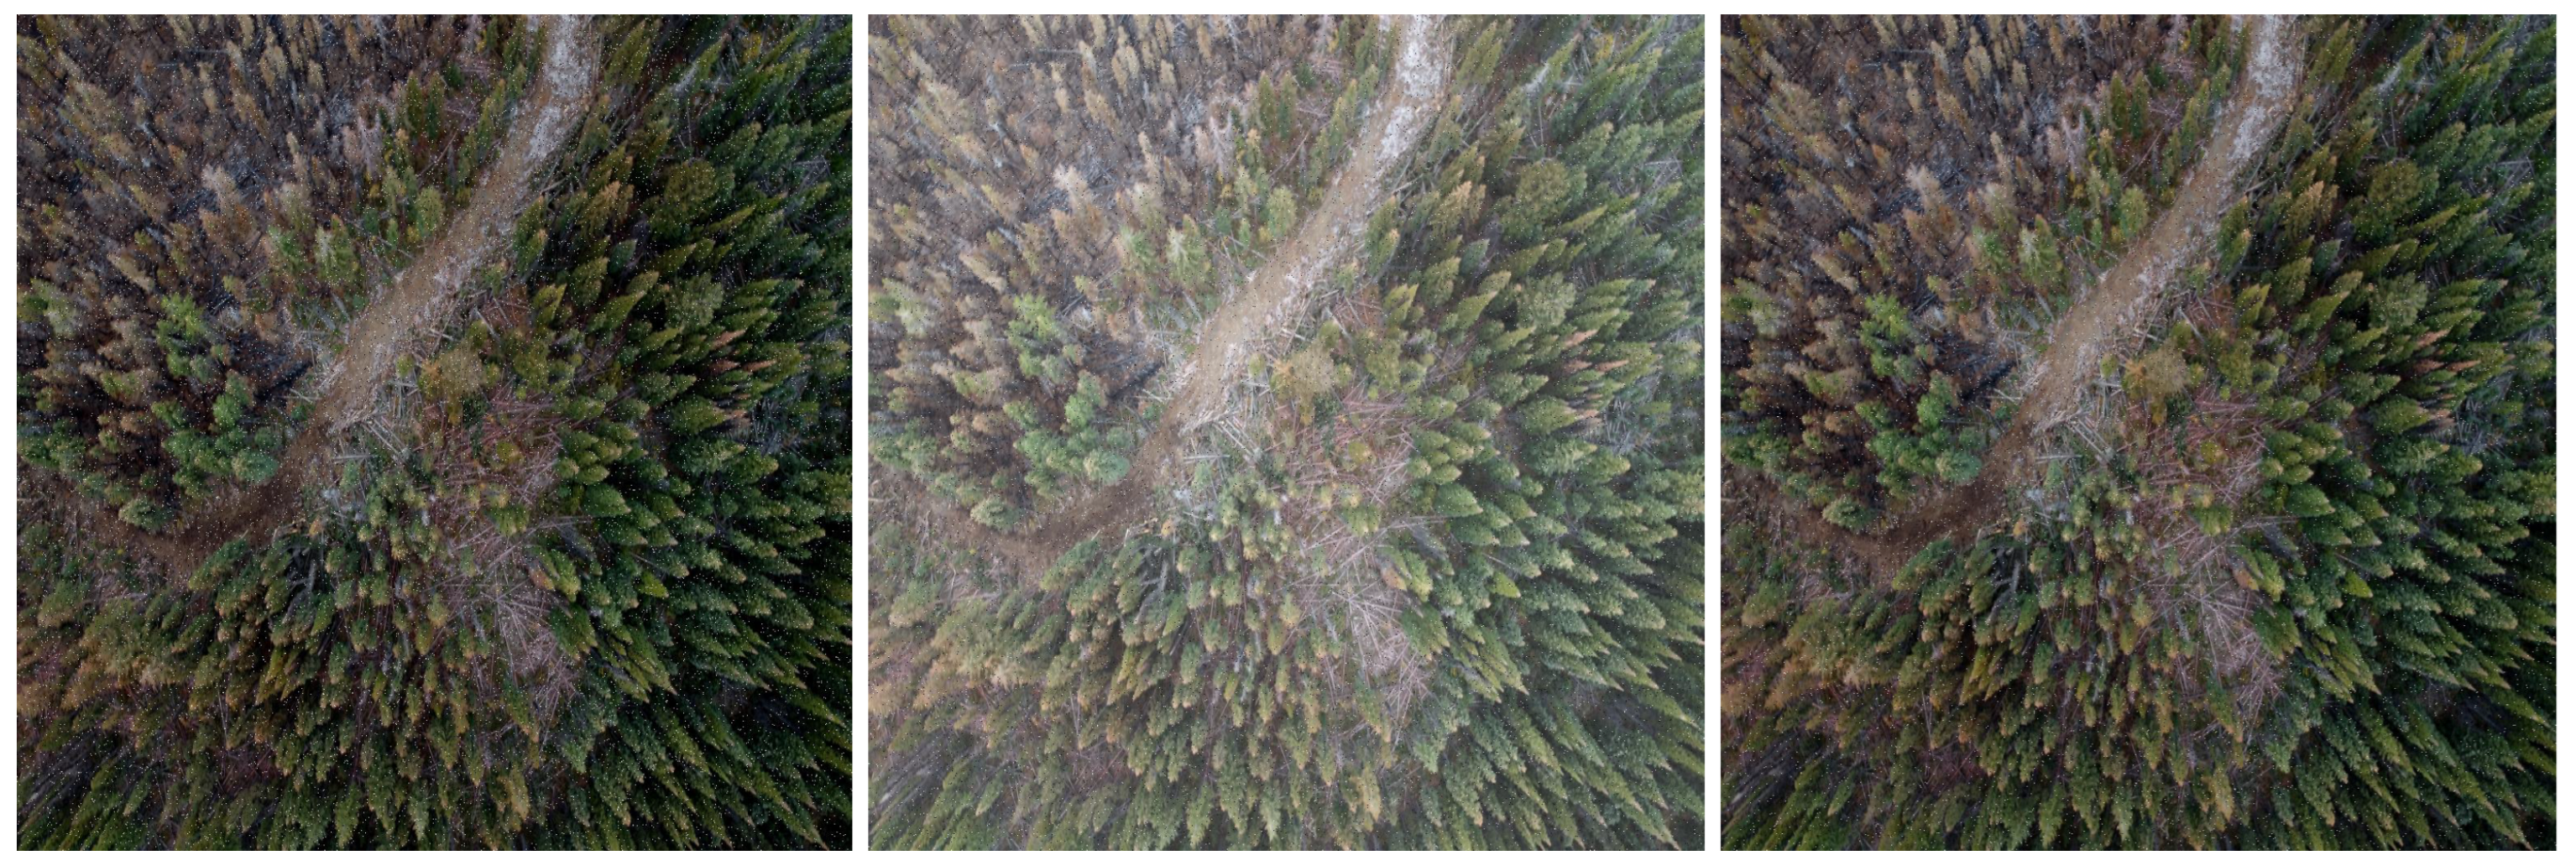
- Augmentation:
- We augmented the training samples with random saturation (between −25% and +25%), brightness (between −15% and +15%) and noise (up to 5% of pixels), as seen in Figure 12.
Figure 12.
Example of augmented images.
Figure 12.
Example of augmented images.
The finalized dataset contained 8000 samples. As for the distribution, we allocated 70% of the images for training, 20% for validation and 10% for testing.
8.3. Training Process
To train the data using YOLOv8, we specify an image size of 1024 and a batch size of 8, and train for 2000 epochs. In all cases, the training process involved feeding the training data to the YOLO model, computing the loss function and updating the model’s parameters through backpropagation.
9. Results
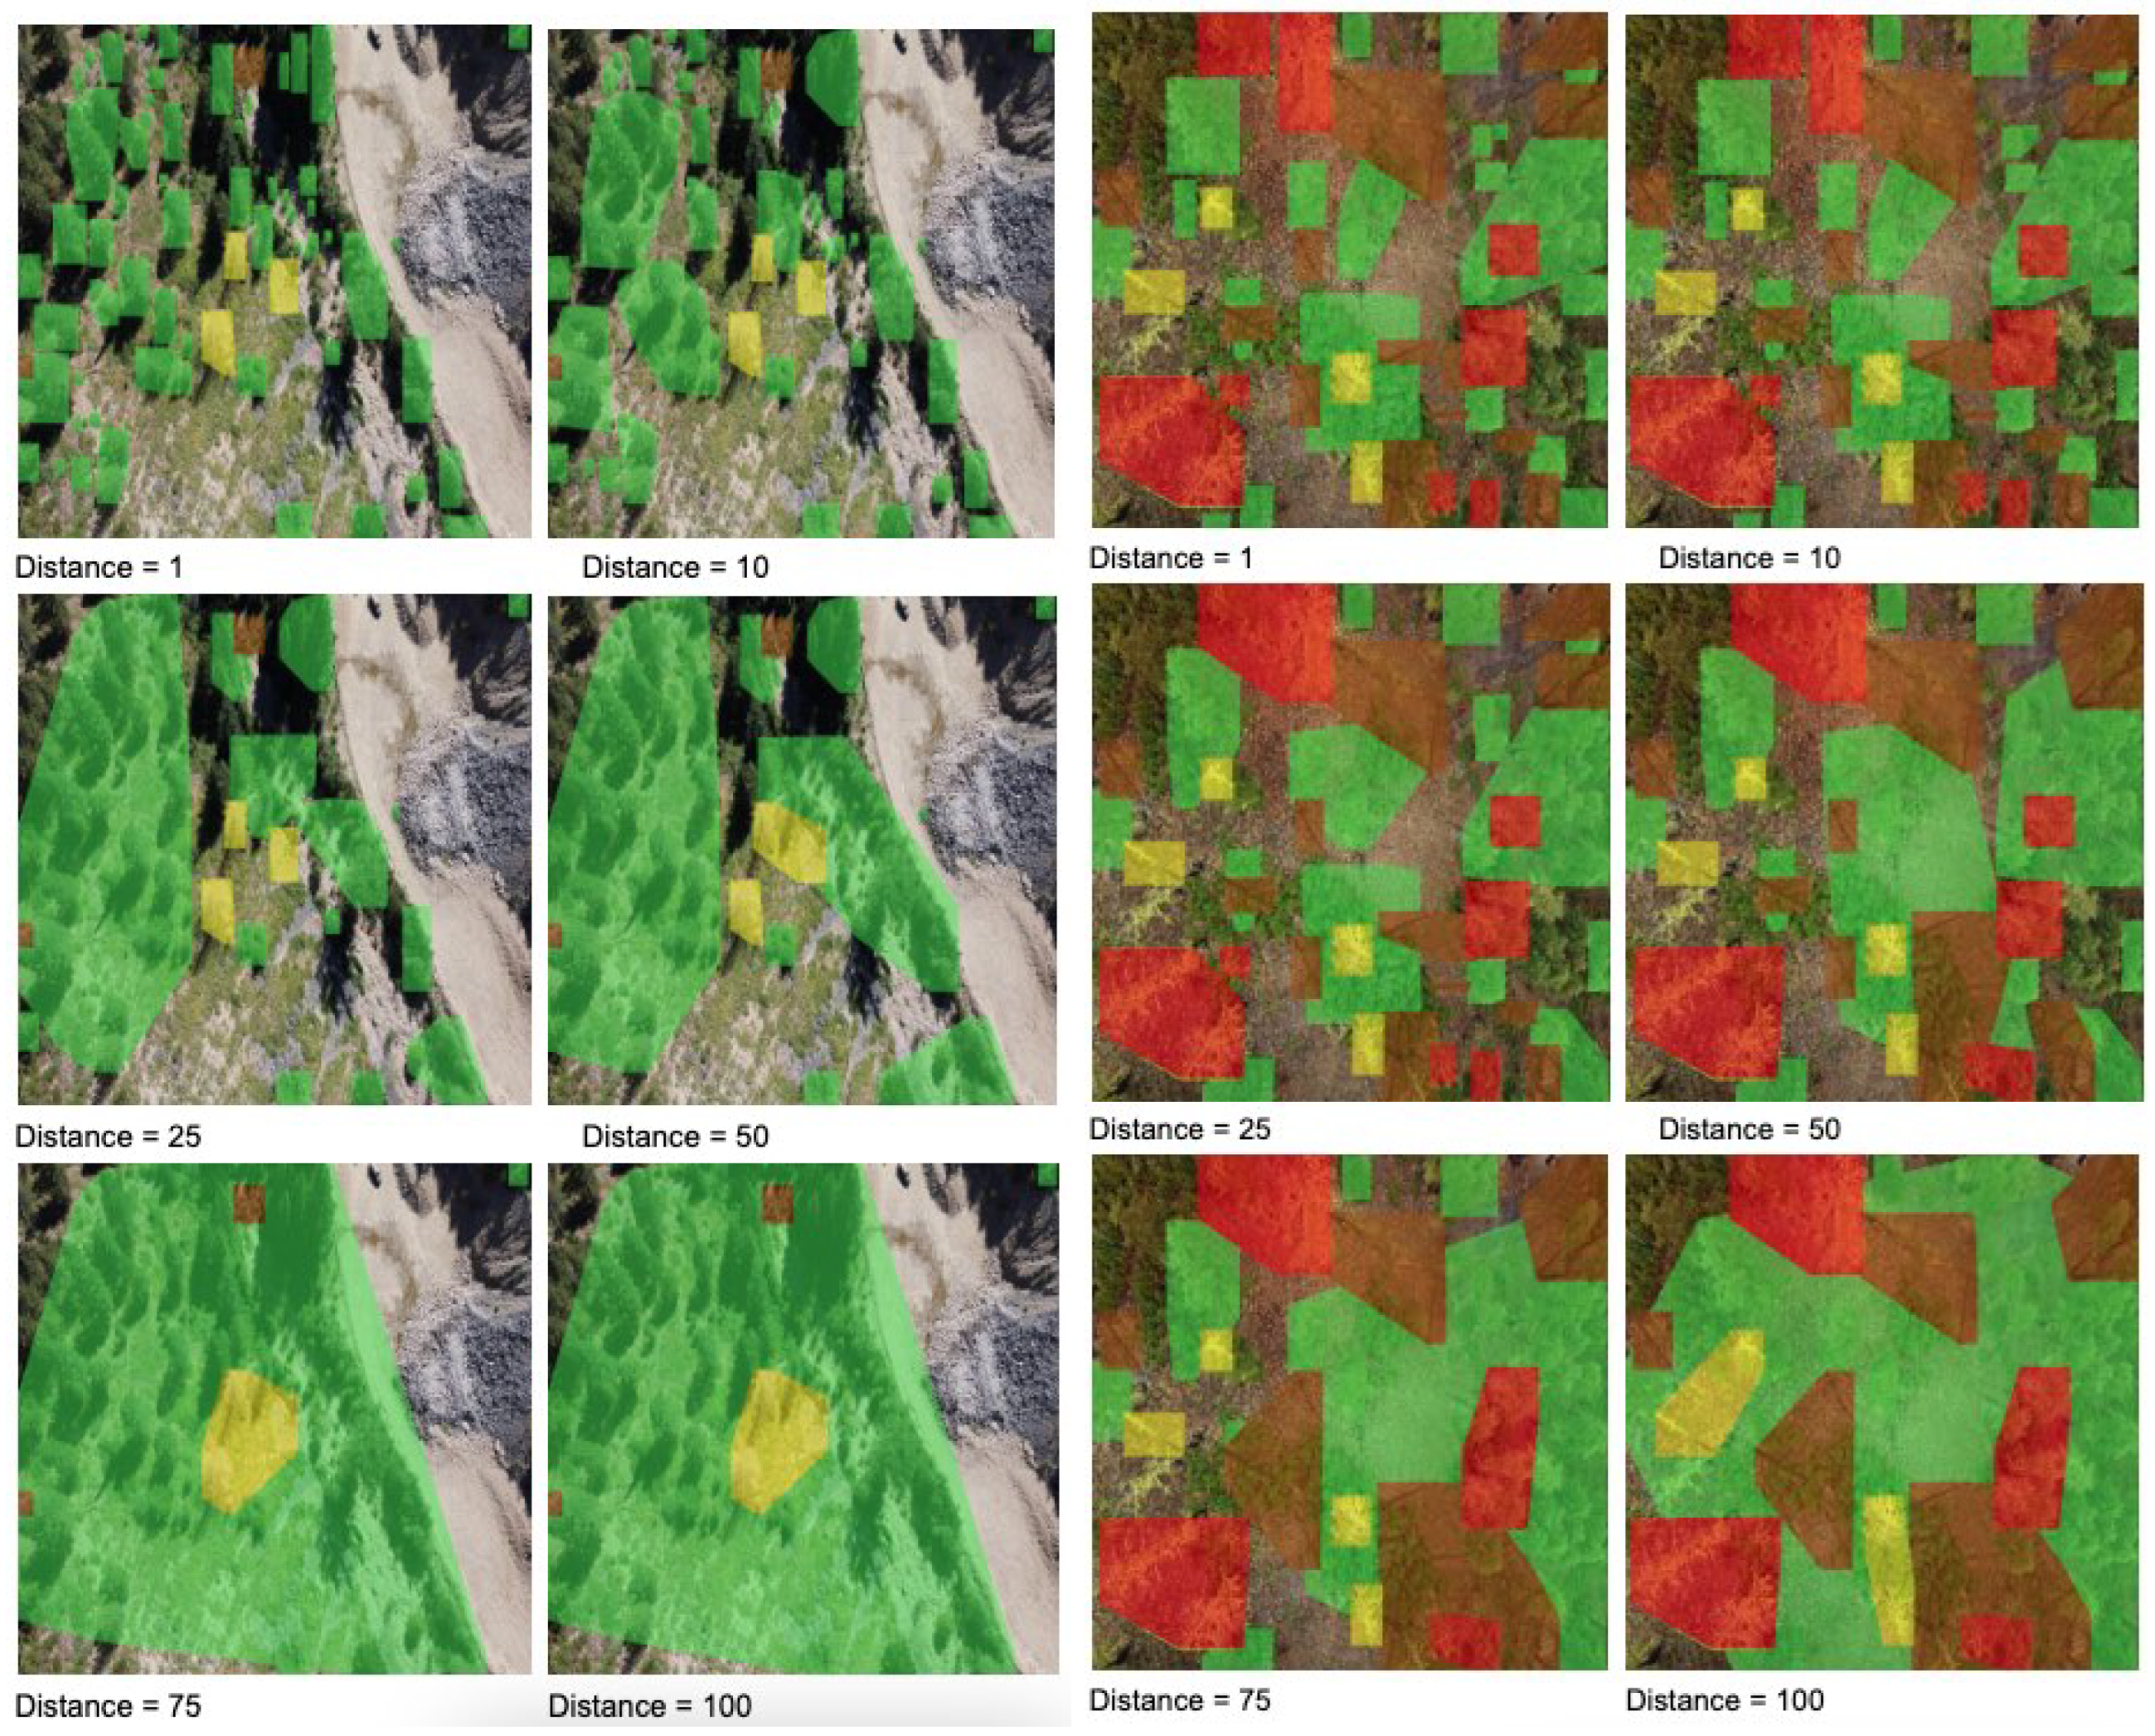
The mAP (mean average precision) is a widely used metric for evaluating object detection performance, particularly the mAP@0.5, which sets the Intersection over Union (IOU) threshold to 0.5 for determining true positive predictions. However, when it comes to detecting areas of trees, using 0.5 as the IOU threshold may not be ideal due to variations in the tree sizes and debris size. To address this issue and ensure a more reliable evaluation of our model, we have averaged the AP over all object classes and 15 IoU thresholds from 0.2 to 0.95 with a step size of 0.05. The results are summarized in Table 3. Final visualizations with a different distance parameter used in merging are shown in Figure 13.
Table 3.
Object detection results.
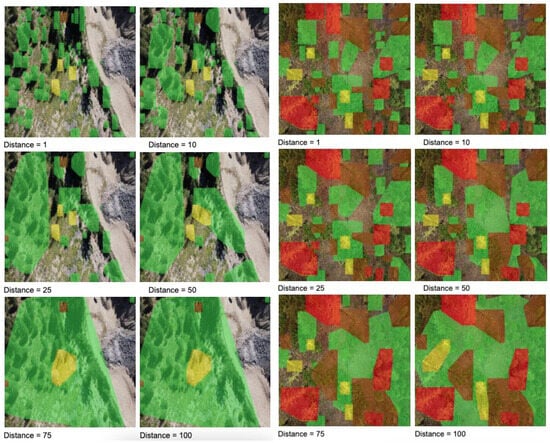
Figure 13.
Comparison of different merging thresholds. The colors indicate different risks of wildfire: green means low, brown moderate, yellow high, and red extreme.
Future Work and Limitations
- Computer vision algorithm selection: While YOLO models offer rapid detection speed and real-time capabilities, R-CNN models may demonstrate superior detection rates and precision, especially for small objects such as forest trees. Therefore, it would be valuable to explore different deep learning methods and compare their performance to determine the most suitable approach for our specific application.
- Currently, the merging distance threshold is manually determined. To improve the efficiency and automation of our approach, we should develop a method that automatically calculates the merging threshold based on the UAV’s height. This would eliminate the need for manual selection and ensure consistent and accurate merging of detected objects in the aerial imagery.
- Finally, we conducted a study and validated our proof of concept in the British Columbia region. The natural next step would be to expand the dataset collection to other provinces/parts of the world to include other tree types and flammability rankings, as well as additional factors in the calculation.
10. Conclusions
In conclusion, this paper presents a successful approach for the detection of various forest fire fuels, providing valuable support for early risk detection and prevention of forest fires.
To enhance the efficiency of our approach, we employed the Convex Hull algorithm to group similar types of trees that were in close proximity to each other. This step facilitates a more comprehensive understanding of the overall fire risk in the forest by considering the collective characteristics of neighboring trees.
Furthermore, we proposed a novel visualization method that effectively represents fire risk information through the use of intuitive color-coded areas. This visualization technique enhances the interpretability of the fire risk map, allowing stakeholders and forest management authorities to assess the severity and distribution of fire-prone regions quickly.
Overall, this research contributes to the field of forest fire prevention by providing a robust framework for the detection and visualization of fire fuels. The combination of advanced object detection algorithms, group analysis, and informative visualization empowers decision-makers with the necessary tools to implement proactive measures for forest fire management and mitigation.
Author Contributions
Conceptualization, M.A.; Data curation, M.A. and L.C.; Formal analysis, Y.L., R.S., J.L. (Junyan Ling), J.Y., L.C., X.H., Z.Y. and L.K.; Funding acquisition, M.A.; Investigation, M.A., Y.L., R.S., J.L. (Junyan Ling), J.Y., J.L. (Jianming Lu), L.C., X.H., Z.Y., L.K. and P.Z.; Methodology, M.A., R.S. and L.C.; Project administration, M.A.; Resources, M.A. and L.C.; Software, Y.L., R.S., J.L. (Junyan Ling), J.Y., J.L. (Jianming Lu), J.Z., X.H., Z.Y., L.K. and P.Z.; Supervision, M.A. and L.C.; Validation, Y.L., R.S., J.L. (Jianming Lu), J.Z. and P.Z.; Visualization, Y.L.; Writing—original draft, Y.L., R.S., X.H. and Z.Y.; Writing—review and editing, M.A. and L.C. All authors have read and agreed to the published version of the manuscript.
Funding
This research was funded by Transport Canada and Natural Resources of Canada.
Institutional Review Board Statement
Not applicable.
Informed Consent Statement
Not applicable.
Data Availability Statement
The data presented in this study is available on request from the corresponding author. The data is not publicly available due to privacy concerns and IP restrictions (patent pending).
Acknowledgments
This work was supported by Spexi Geospatial Inc., Transport Canada, Natural Resources of Canada and the Northeastern University—Vancouver Campus. We thank all the collaborators who allowed this project to happen.
Conflicts of Interest
The authors declare no conflicts of interest.
References
- Natural Resources Canada. How Do Forests Benefit Canadians? Available online: https://www.nrcan.gc.ca/our-natural-resources/forests/state-canadas-forests-report/how-do-forests-benefit-canadians/16509 (accessed on 1 May 2023).
- BC Government. 2020 BC Forest Sector—Statistics Summary. Available online: https://www2.gov.bc.ca/assets/gov/farming-natural-resources-and-industry/forestry/forest-industry-economics/economic-state/2020_bc_forest_sector_-_statistics_summary.pdf (accessed on 17 April 2023).
- Kolarić, D.; Skala, K.; Dubravić, A. Integrated system for forest fire early detection and management. Period. Biol. 2008, 110, 205–211. [Google Scholar]
- Wu, J.; Chantiry, X.E.; Gimpel, T.; Aibin, M. AI-Based Classification to Facilitate Preservation of British Columbia Endangered Birds Species. In Proceedings of the 2022 IEEE Canadian Conference on Electrical and Computer Engineering (CCECE), Halifax, NS, Canada, 18–20 September 2022; pp. 85–88. [Google Scholar] [CrossRef]
- BC Wildfire Service. Wildfire Season Summary—Province of British Columbia. Available online: https://www2.gov.bc.ca/gov/content/safety/wildfire-status/about-bcws/wildfire-history/wildfire-season-summary (accessed on 17 April 2023).
- Aibin, M.; Aldiab, M.; Bhavsar, R.; Lodhra, J.; Reyes, M.; Rezaeian, F.; Saczuk, E.; Taer, M.; Taer, M. Survey of RPAS Autonomous Control Systems Using Artificial Intelligence. IEEE Access 2021, 9, 167580–167591. [Google Scholar] [CrossRef]
- Natural Resources Canada. FBP Fuel Type Descriptions. Available online: https://cwfis.cfs.nrcan.gc.ca/background/fueltypes/c1 (accessed on 1 May 2023).
- Luo, Y.; Lu, Q.; Liu, J.; Fu, Q.; Harkin, J.; McDaid, L.; Martínez-Corral, J.; Biot-Marí, G. Forest fire detection using spiking neural networks. In Proceedings of the 15th ACM International Conference on Computing Frontiers, New York, NY, USA, 8–10 May 2018; pp. 371–375. [Google Scholar]
- Kilic, S.; Ozkan, O. A self-adaptive UAV routing for forest fire risk mitigation: A conceptual model. In Proceedings of the 2019 Summer Simulation Conference, San Diego, CA, USA, 22–24 July 2019; pp. 1–12. [Google Scholar]
- Lv, H.; Chen, X. Research and Implementation of Forest Fire Smoke Detection Based on ResNet Transfer Learning. In Proceedings of the 2021 5th International Conference on Electronic Information Technology and Computer Engineering, New York, NY, USA, 22–24 October 2021; pp. 630–635. [Google Scholar]
- Kasyap, V.L.; Sumathi, D.; Alluri, K.; Reddy Ch, P.; Thilakarathne, N.; Shafi, R.M. Early Detection of Forest Fire Using Mixed Learning Techniques and UAV. Comput. Intell. Neurosci. 2022, 2022, 12. [Google Scholar] [CrossRef] [PubMed]
- Lee, A.; Jiang, B.; Zeng, I.; Aibin, M. Ocean Medical Waste Detection for CPU-Based Underwater Remotely Operated Vehicles (ROVs). In Proceedings of the 2022 IEEE 13th Annual Ubiquitous Computing, Electronics & Mobile Communication Conference (UEMCON), New York, NY, USA, 26–29 October 2022; pp. 0385–0389. [Google Scholar] [CrossRef]
- Kuanysheva, A.; Graystone, A.; Lam, J.; Jia, J.; Aibin, M. Identification of Bioluminescent Deep Ocean Macro Organisms Using Computer Vision. In Proceedings of the 2022 IEEE 13th Annual Ubiquitous Computing, Electronics & Mobile Communication Conference (UEMCON), New York, NY, USA, 26–29 October 2022; pp. 0390–0394. [Google Scholar] [CrossRef]
- Sharma, R.; Patel, K.; Shah, S.; Aibin, M. Aerial Footage Analysis Using Computer Vision for Efficient Detection of Points of Interest Near Railway Tracks. Aerospace 2022, 9, 370. [Google Scholar] [CrossRef]
- Zhao, L.; Zhi, L.; Zhao, C.; Zheng, W. Fire-YOLO: A Small Target Object Detection Method for Fire Inspection. Sustainability 2022, 14, 4930. [Google Scholar] [CrossRef]
- Goyal, S.; Shagill, M.; Kaur, A.; Vohra, H.; Singh, A. A YOLO based Technique for Early Forest Fire Detection. Int. J. Innov. Technol. Explor. Eng. (IJITEE) Vol. 2020, 9, 1357–1362. [Google Scholar] [CrossRef]
- Li, Y.; Shen, Z.; Li, J.; Xu, Z. A Deep Learning Method based on SRN-YOLO for Forest Fire Detection. In Proceedings of the 2022 5th International Symposium on Autonomous Systems (ISAS), Hangzhou, China, 8–10 April 2022; pp. 1–6. [Google Scholar]
- Wang, S.; Chen, T.; Lv, X.; Zhao, J.; Zou, X.; Zhao, X.; Xiao, M.; Wei, H. Forest Fire Detection Based on Lightweight Yolo. In Proceedings of the 2021 33rd Chinese Control and Decision Conference (CCDC), Kunming, China, 22–24 May 2021; pp. 1560–1565. [Google Scholar]
- Abdusalomov, A.; Baratov, N.; Kutlimuratov, A.; Whangbo, T.K. An improvement of the fire detection and classification method using YOLOv3 for surveillance systems. Sensors 2021, 21, 6519. [Google Scholar] [CrossRef]
- Jiao, Z.; Zhang, Y.; Mu, L.; Xin, J.; Jiao, S.; Liu, H.; Liu, D. A yolov3-based learning strategy for real-time uav-based forest fire detection. In Proceedings of the 2020 Chinese Control And Decision Conference (CCDC), Hefei, China, 22–24 August 2020; pp. 4963–4967. [Google Scholar]
- Khan, S.; Khan, A. FFireNet: Deep Learning Based Forest Fire Classification and Detection in Smart Cities. Symmetry 2022, 14, 2155. [Google Scholar] [CrossRef]
- Yu, K.; Hao, Z.; Post, C.J.; Mikhailova, E.A.; Lin, L.; Zhao, G.; Tian, S.; Liu, J. Comparison of Classical Methods and Mask R-CNN for Automatic Tree Detection and Mapping Using UAV Imagery. Remote Sens. 2022, 14, 295. [Google Scholar] [CrossRef]
- Jiang, X.; Wu, Z.; Han, S.; Yan, H.; Zhou, B.; Li, J. A multi-scale approach to detecting standing dead trees in UAV RGB images based on improved faster R-CNN. PLoS ONE 2023, 18, e0281084. [Google Scholar] [CrossRef] [PubMed]
- Harris, R.C.; Kennedy, L.M.; Pingel, T.J.; Thomas, V.A. Assessment of Canopy Health with Drone-Based Orthoimagery in a Southern Appalachian Red Spruce Forest. Remote Sens. 2022, 14, 1341. [Google Scholar] [CrossRef]
- Zhang, L.; Lin, H.; Wang, F. Individual Tree Detection Based on High-Resolution RGB Images for Urban Forestry Applications. IEEE Access 2022, 10, 46589–46598. [Google Scholar] [CrossRef]
- Wang, X.; Zhao, Q.; Jiang, P.; Zheng, Y.; Yuan, L.; Yuan, P. LDS-YOLO: A lightweight small object detection method for dead trees from shelter forest. Comput. Electron. Agric. 2022, 198, 107035. [Google Scholar] [CrossRef]
- Kislov, D.E.; Korznikov, K.A.; Altman, J.; Vozmishcheva, A.S.; Krestov, P.V. Extending deep learning approaches for forest disturbance segmentation on very high-resolution satellite images. Remote Sens. Ecol. Conserv. 2021, 7, 355–368. [Google Scholar] [CrossRef]
- Shao, Y.; Wang, Z.; Feng, Z.; Sun, L.; Yang, X.; Zheng, J.; Ma, T. Assessment of China’s forest fire occurrence with deep learning, geographic information and multisource data. J. For. Res. 2022, 34, 963–976. [Google Scholar] [CrossRef]
- Girshick, R.; Donahue, J.; Darrell, T.; Malik, J. Rich feature hierarchies for accurate object detection and semantic segmentation. In Proceedings of the IEEE Conference on Computer Vision and Pattern Recognition, Columbus, OH, USA, 23–28 June 2014; pp. 580–587. [Google Scholar]
- Redmon, J.; Divvala, S.; Girshick, R.; Farhadi, A. You Only Look Once: Unified, Real-Time Object Detection. In Proceedings of the IEEE Computer Society Conference on Computer Vision and Pattern Recognition, Las Vegas, NV, USA; 2016. [Google Scholar]
- Terven, J.; Cordova-Esparza, D. A Comprehensive Review of YOLO: From YOLOv1 to YOLOv8 and Beyond. arXiv 2023, arXiv:2304.00501. [Google Scholar]
- Schubert, E.; Sander, J.; Ester, M.; Kriegel, H.P.; Xu, X. DBSCAN revisited, revisited: Why and how you should (still) use DBSCAN. ACM Trans. Database Syst. (TODS) 2017, 42, 1–21. [Google Scholar] [CrossRef]
- Barber, C.B.; Dobkin, D.P.; Huhdanpaa, H. The quickhull algorithm for convex hulls. ACM Trans. Math. Softw. (TOMS) 1996, 22, 469–483. [Google Scholar] [CrossRef]


Disclaimer/Publisher’s Note: The statements, opinions and data contained in all publications are solely those of the individual author(s) and contributor(s) and not of MDPI and/or the editor(s). MDPI and/or the editor(s) disclaim responsibility for any injury to people or property resulting from any ideas, methods, instructions or products referred to in the content. |
© 2024 by the authors. Licensee MDPI, Basel, Switzerland. This article is an open access article distributed under the terms and conditions of the Creative Commons Attribution (CC BY) license (https://creativecommons.org/licenses/by/4.0/).