Article

LAEA: A 2D LiDAR-Assisted UAV Exploration Algorithm for Unknown Environments

College of Automation, Northwestern Polytechnical University, Xi’an 710129, China
*
Author to whom correspondence should be addressed.
These authors contributed equally to this work.
Drones 2024, 8(4), 128; https://doi.org/10.3390/drones8040128
Submission received: 16 March 2024 / Accepted: 25 March 2024 / Published: 29 March 2024

Abstract

:
In UAV autonomous exploration, large frontier clusters are commonly associated with high information gain and are visited first. In contrast, small and isolated frontier clusters with fewer frontiers are associated with smaller information gain and are thus explored with low priority. However, these small and isolated frontier clusters are often in close proximity to UAVs and surrounded by explored areas, which could result in back-and-forth flights that lower exploration efficiency. This paper proposes LAEA, a LiDAR-assisted and depth camera-dominated UAV exploration algorithm that aims to improve UAV autonomous exploration efficiency. A hybrid map is obtained that characterizes rich environmental profile information in real time, enabling us to detect small and isolated frontier clusters that can lead to repeated visits to explored areas. An environmental information gain optimization strategy is incorporated such that frontier clusters with larger unexplored areas behind them, as well as small and isolated frontier clusters close to the UAV, are assigned higher weights to prioritize their visit order. An optimized flight trajectory is generated to cover unexplored frontier clusters in the immediate vicinity of the UAV while flying to the next target. A comprehensive comparison between the proposed algorithm and state-of-the-art algorithms was conducted via a simulation study, which showed that our algorithm exhibits superior exploration efficiency in various environments. Experiments were also carried out to verify the feasibility of the proposed approach in real-world scenarios.

1. Introduction

With the popularity and development of unmanned aerial vehicle (UAV) technology, multirotor UAVs have been widely used in electric power inspection [1], agricultural plant protection [2], reconnaissance and rescue [3], etc. While some UAVs may fly in open areas, some are deployed in unstructured environments, requiring them to be able to efficiently navigate unknown environments and provide environmental information using only onboard sensors, which facilitates efficiency in missions such as environmental monitoring, emergency rescue, etc.
To efficiently construct maps of unstructured environments, target evaluation criteria have been designed to optimize autonomous UAVs’ exploration progress. The greedy strategy, representing one of the most commonly adopted strategies, chooses either the nearest candidate target [4] or the candidate target with the highest information gain [5] as the next target position. However, such strategies may neglect other candidate targets near the current UAV position, which often results in inefficient back-and-forth motions. To alleviate this problem, the best candidate target is chosen by either satisfying the dynamic constraints [6] or solving a traveling salesman problem (TSP) [7]. To further improve the global nature of the exploration algorithms, a small subset of the algorithms introduce a priori information about the environment while selecting the next target, e.g., detecting small frontier regions based on known maps to preferentially cover them [8], and predicting environmental maps in real time using deep learning to more accurately calculate information gain [9]. Meanwhile, the algorithms based on exploratory maps are naturally incapable of properly evaluating small frontier clusters as they lack a global view of environmental contour information, which is essential to characterize the importance of small frontier clusters. On the other hand, algorithms based on predicted maps are heavily dependent on pre-trained models, limiting their applicability. It is clear that the following are the main factors restricting the exploration efficiency of existing algorithms.
(1)
The improper characterization of small frontier clusters leads the UAV to neglect such areas, which results in back-and-forth movements;
(2)
Frontiers adjacent to the flight trajectories to targets are often overlooked, which could also lead to back-and-forth movements.
To resolve the above issues, we propose LAEA, a LiDAR-assisted UAV exploration algorithm for the efficient exploration of unknown environments. With LiDAR’s sensing range and FOV much larger than those of depth cameras, the proposed algorithm integrates both LiDAR and RGB-D data to construct a hybrid 2D map and obtain more information on unexplored environments. Small and isolated frontier clusters leading to back-and-forth movements can be efficiently detected based on the proposed hybrid 2D map. By assigning higher access weights to these special frontier clusters, repeated visits to explored regions can be significantly reduced by first exploring frontier clusters that are in close proximity. Meanwhile, an environmental information gain (EIG) optimization strategy is introduced to mimic the human behavior of looking around, which facilitates quick access to a large amount of environmental information in unfamiliar surroundings. Thus, an efficient and safe flight trajectory can be generated that not only has the potential to cover a large number of unknown frontier clusters while flying to the next target, but also reduces the probability of collision with obstacles.
We benchmarked the proposed algorithm against two state-of-the-art algorithms [7,8] in different simulation environments, and superior performance is exhibited by the proposed algorithm. An experiment was conducted on a robotic UAV platform, and the results confirm the feasibility of using our novel approach in real-world scenarios. The main contributions of this work are as follows:
  • A hybrid 2D map is constructed that offers a more effective method to detect and prioritize visits to small and isolated frontier clusters, which could reduce back-and-forth movements.
  • An EIG optimization strategy is proposed that significantly improves the coverage of unknown frontier clusters during the UAV’s flight to the next target, as well as flight safety.
  • The proposed algorithm is compared with two state-of-the-art algorithms through simulation, and then, validated on a robotic platform in different real-world scenarios.
The remainder of this manuscript is structured as follows: Section 2 introduces some robot exploration algorithms; Section 3 provides details of the proposed UAV exploration algorithm; the simulation-based comparison of the proposed LAEA with existing state-of-the-art algorithms, as well as the real-world verification experiments, are presented in Section 4; and finally, the contributions of this study are summarized in Section 5.

2. Related Works

Researchers have proposed numerous exploration algorithms for different optimization objectives, and autonomous exploration algorithms for robots can be classified into three categories depending on the method of candidate target generation: random sampling-based, frontier-based and reinforcement learning-based. This paper mainly focuses on the first two categories, which are widely used.

2.1. Sampling-Based Methods

Sampling-based methods randomly sample the known space using rapidly exploring random tree (RRT) to obtain candidate targets with probabilistic completeness. The classical method NBVP (next-best-view planning) [5] uses RRT to explore the 3D space and selects the branch with the highest information gain as the next UAV target. NBVP is prone to falling into local regions due to the lack of global consideration; to solve this problem, Umari et al. [10] proposed an exploration strategy based on multiple RRTs, which quickly and comprehensively detects the frontier region using a local and a global RRT tree. MBP (motion primitives-based path planning) [6], on the other hand, maintains the UAV’s rapid exploration process by sampling the motion fundamentals. Considering the high computational cost of blind random sampling in global maps, Zhu et al. [11] sampled near both the robot’s current position and the frontier region according to a certain ratio to quickly construct an RRT tree with more exploration gains. Meanwhile, Xu et al. [12,13] obtained dynamic information on the environment in real time based on a probabilistic roadmap to overcome dynamic obstacles during UAV exploration.

2.2. Frontier-Based Methods

Frontier-based approaches focus on finding all frontier regions between known and unknown spaces and selecting one of them as the next target. It was first proposed by Yamauchi [14] that the algorithm guides the robot to the nearest reachable frontier region from the current position. On this basis, Kulich et al. [15], referring to the TSP, determined the optimal order of accessing each frontier region from the current location, which was more global in selecting the target and effectively improved the exploration efficiency of the algorithm. Further, Kamalova et al. [16] demonstrated the effectiveness and applicability of bionic optimization algorithms in mobile robots using the gray wolf, whale and particle swarm optimization algorithms to determine the next target from the extracted boundary points.
Unlike work that only focuses on determining the next target, in [7], the authors designed FUEL (Fast UAV Exploration), an incremental frontier information structure that can quickly detect and extract frontier regions on a map, and generated B-spline trajectories to satisfy the kinematic and dynamic constraints of UAVs using FUEL’s hierarchical planner. Based on this, FAEP (Fast Autonomous Exploration Planner) [8] considers the map boundary and small frontier region constraints in the process of selecting the next target, and the UAV’s exploration efficiency is further improved. Meanwhile, ECHO (Efficient Heuristic Viewpoint) [17] uses a 2D Gaussian distribution sampler to quickly sample viewpoints and considers constraints such as boundaries, the distance of viewpoints from obstacles, etc. Also based on FUEL, SEER (Safe Efficient Exploration) [9] uses OPNet to predict 3D maps of frontier regions in order to compute an information gain value closer to that in the real environment and simultaneously detect frontier regions that may enable preferential access.
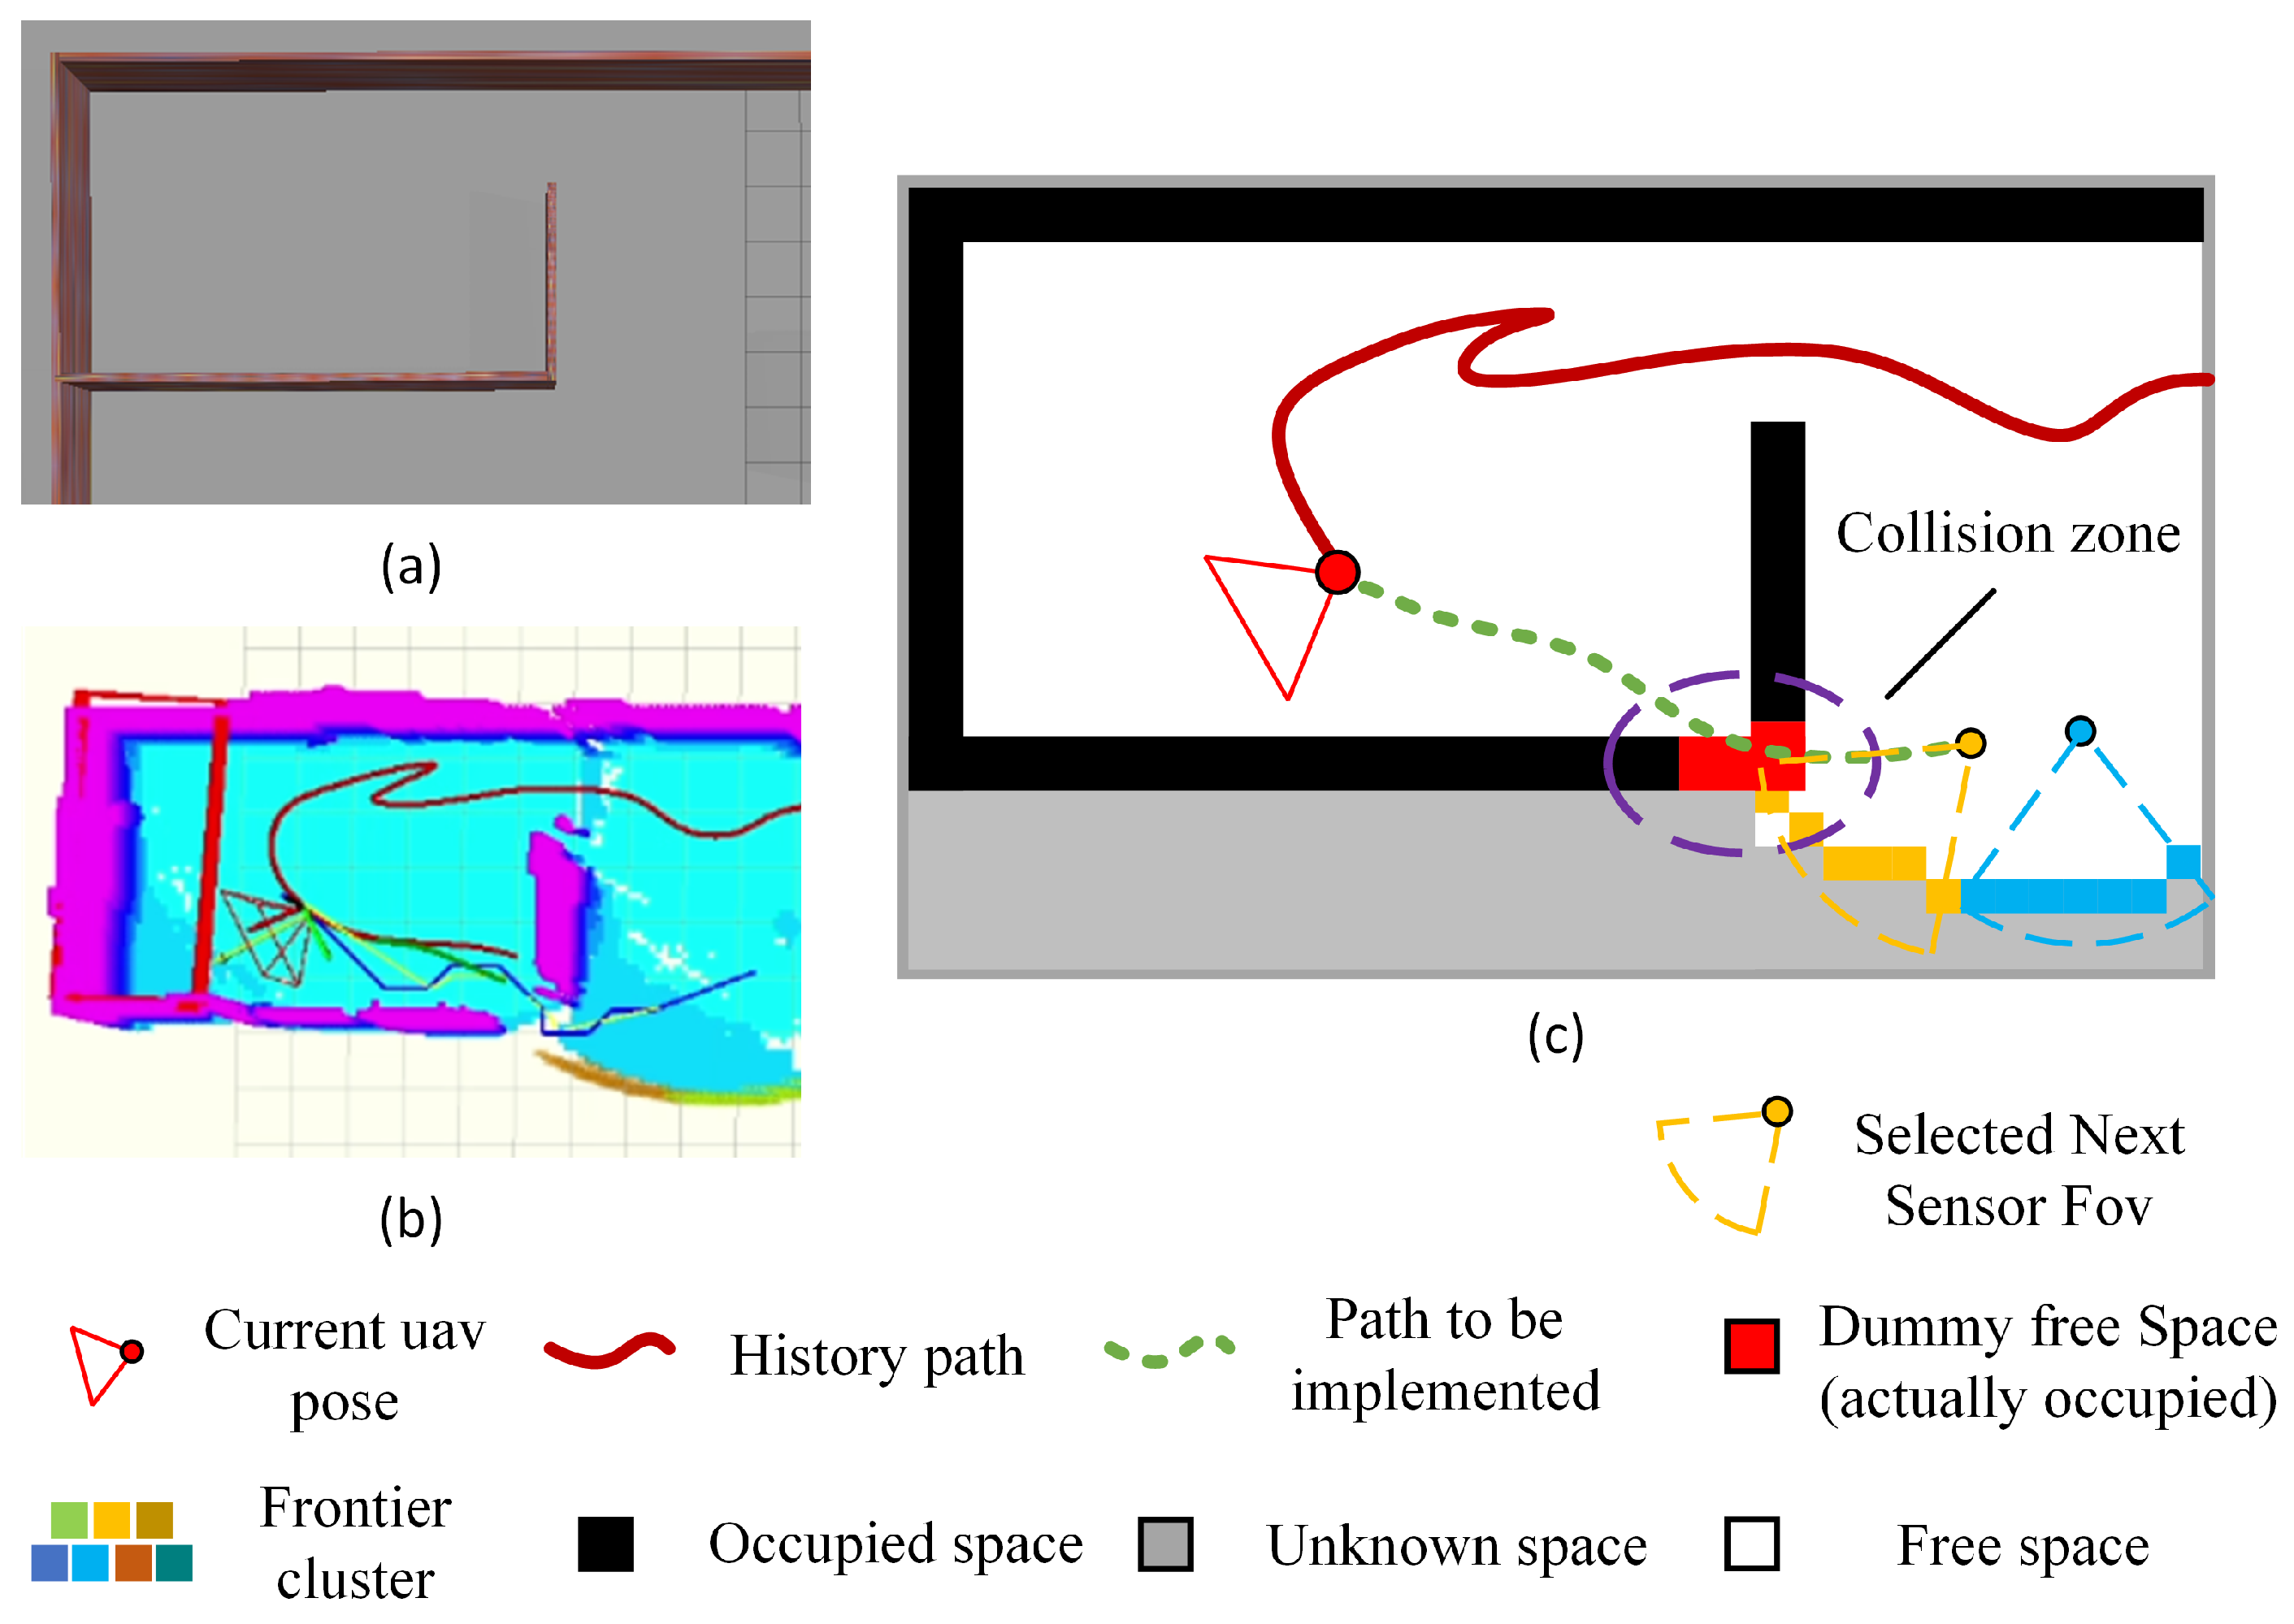
However, for large or complex environments, the small area constraints proposed by FAEP, which are based on the limited FOV camera, can easily fail, and SEER, which relies on pre-trained network models, also struggles to accurately compute information gain. Moreover, the boundary constraints considered by FAEP and ECHO tend to guide UAVs to the map boundaries, thus making it easy to miss frontier areas, which may lead to back-and-forth motion. As shown in Figure 1, pure depth camera-based exploration methods have difficulties in obtaining accurate information about environmental contours during the exploration process, which makes it easy to miss unexplored closed regions (isolated frontier clusters) and regions with low potential for information gain (small frontier clusters). Timely detection and coverage of these special frontier areas could significantly improve the overall exploration efficiency of UAVs.

3. Proposed Method

3.1. System Overview

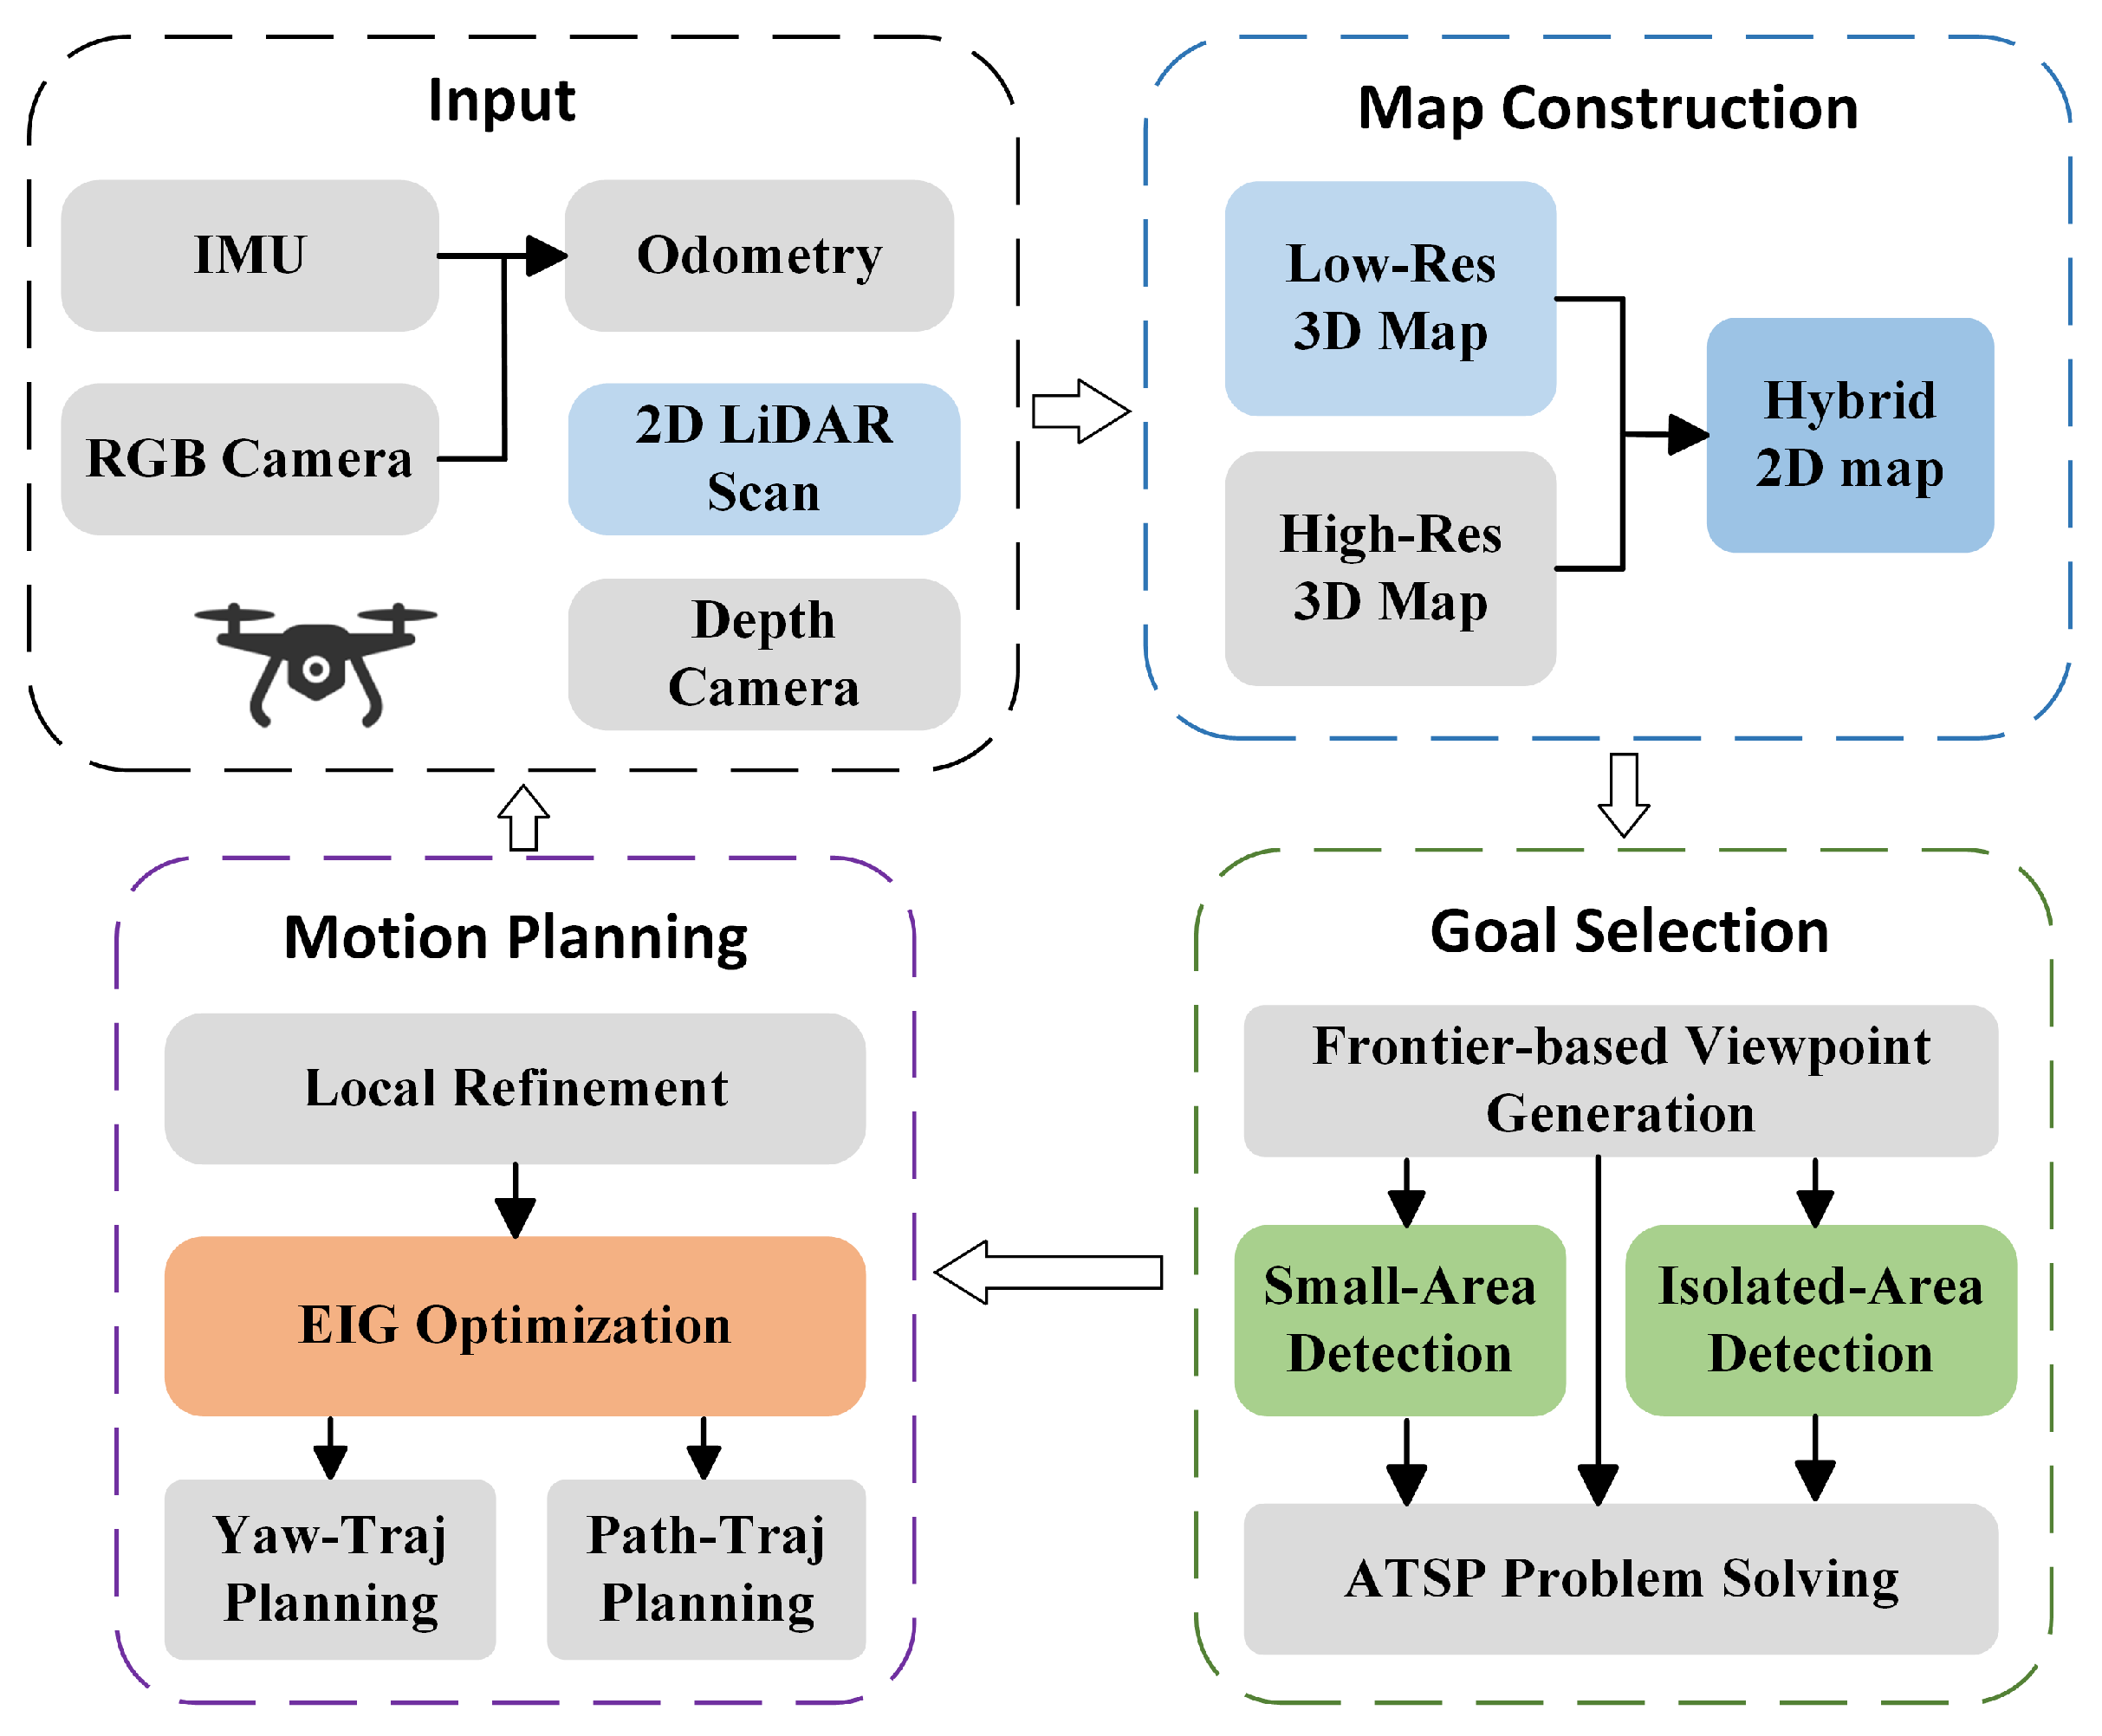
The system framework of LAEA is illustrated in Figure 2. The proposed system comprises three main modules, i.e., map construction, target selection and motion planning. Given multi-sensor data, the map construction module (Section 3.2) obtains both high- and low-resolution 3D occupancy maps. It also generates a 2D hybrid occupancy map that is used to detect special frontier clusters. The target selection module (Section 3.3) first obtains viewpoints for each frontier based on the high-resolution 3D occupancy map, and then, uses the 2D hybrid map to calculate the LiDAR information gain and detect small and isolated frontier clusters. Finally, the visiting order for all of the frontier cluster sets is obtained by constructing a solution to the asymmetric traveling salesman problem (ATSP). Then, the motion planning module (Section 3.4) performs special azimuthal trajectory optimization using the EIG optimization strategy, which finally generates a safe trajectory that helps the UAV to obtain more information.

3.2. Map Construction Module

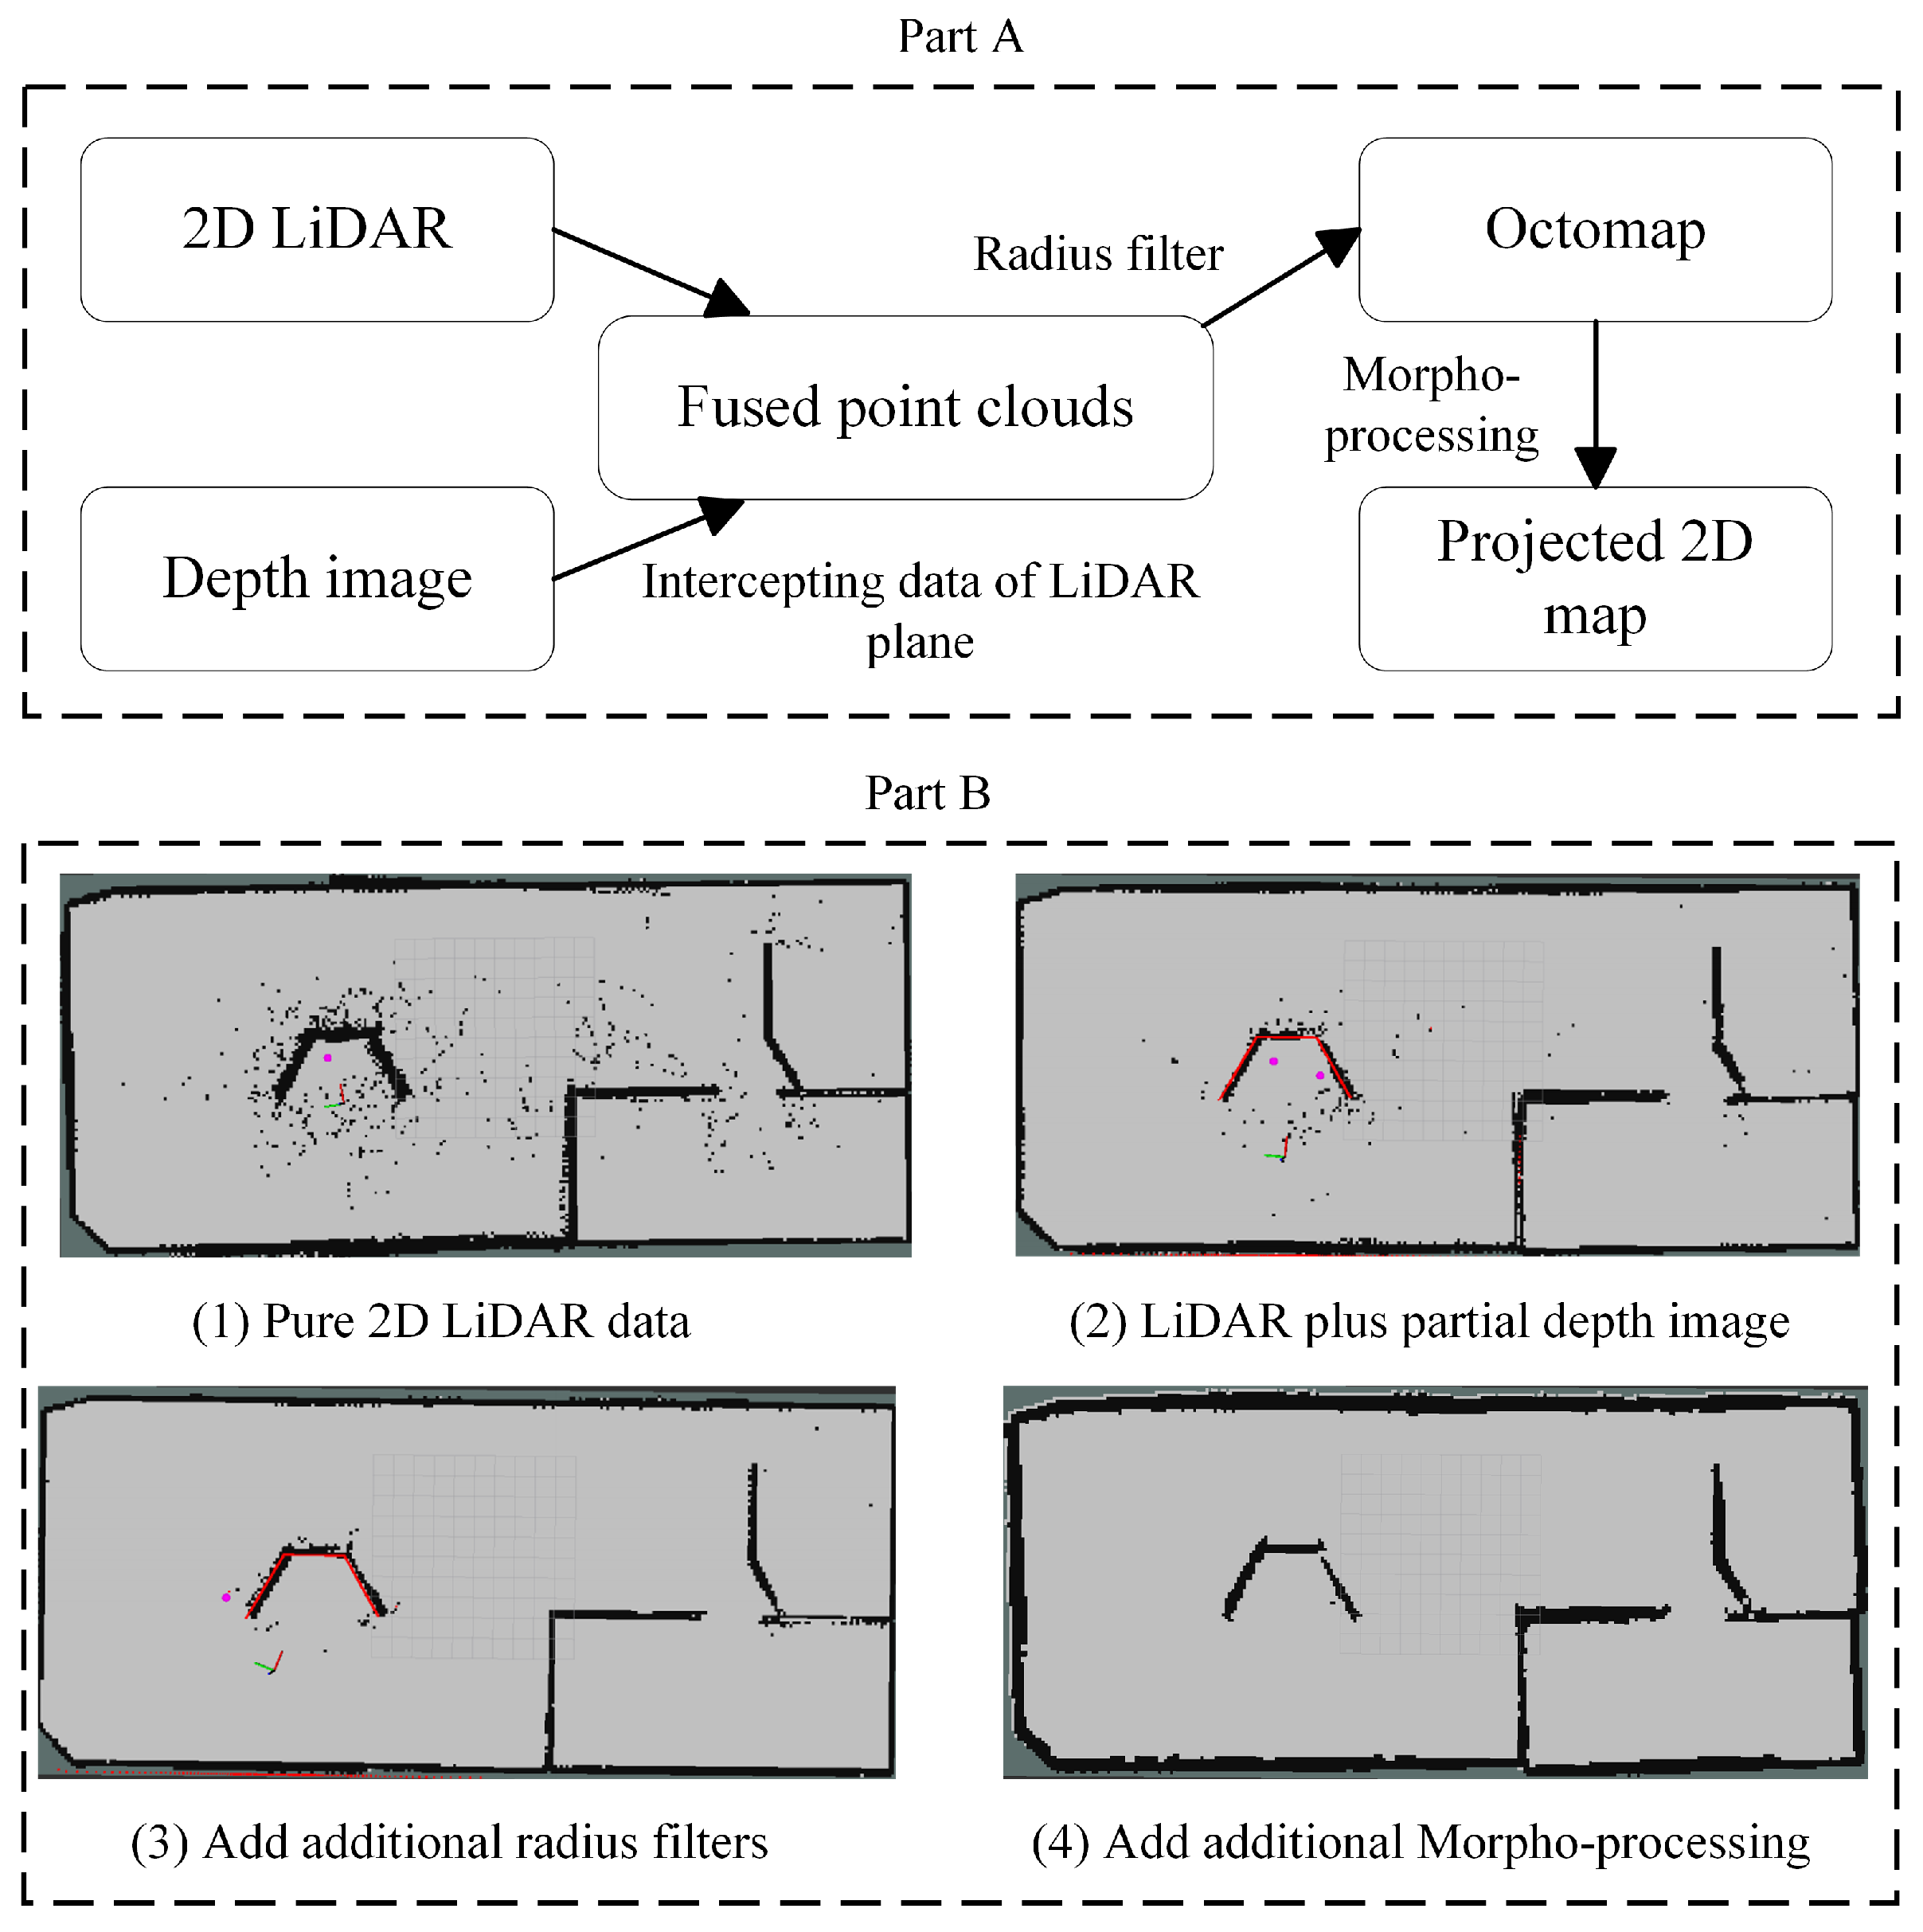
The map building module uses a depth image to obtain a high-resolution 3D occupancy grid map V h i g h for the detection of frontier clusters and navigation. Using LiDAR and part of the depth image, a low-resolution 3D occupancy grid map V l o w is obtained for coarse characterization of the environment. The experimental results show that a straightforward 3D construction using sparse 2D LiDAR data produces many clustered points on the map. This has an impact on the detection of special frontier clusters. For this reason, a radius filter and data for part of the depth image are incorporated to filter out the clustered points, which balances the cluster filtering and the real-time performance of the 3D occupancy map V l o w .
The projection along the Z-axis direction of V l o w yields a UAV-centered 2D occupancy map M l o w . Details of the construction process of M l o w are illustrated in Figure 3.
The cell states in M l o w are indicated by {−1, 0, 100}, which represent unknown, free and occupied states, respectively. The data in M l o w are copied to the hybrid map M h y b r i d , except that the state of each cell in M h y b r i d is updated in conjunction with V h i g h , as described in Equation (1):
S i , M h y b i r d = 100 i f S i , V h i g h = = 100 S i , M l o w i f S i , V h i g h = = 1 80 e l s e
where S i , M l o w and S i , M h y b i r d represent the i-th cell state in M l o w and M h y b r i d , respectively, and S i , V h i g h represents the cell state in V h i g h with the current UAV’s altitude range. Notably, cells with a status value of 80 in S i , M h y b i r d denote an explored free space in S i , V h i g h with no more exploration value, and are thus categorized as occupied cells for the subsequent processing. As shown in Figure 4, the hybrid map can intuitively display information about the environmental contours of the remaining unexplored areas, where unknown and known free cells in the map have potential to be explored.

3.3. Target Selection Module

This module involves frontier-based viewpoint generation, small and isolated frontier cluster detection and solving the ATSP.

3.3.1. Frontier-Based Viewpoint Generation

As stated in the classical algorithm [14], a frontier is defined as a known free voxel adjacent to an unknown voxel. Unlike the traditional method of detecting the frontier directly from the whole map, the FUEL algorithm [7] described in this study is used to establish frontier clusters in an incremental manner. A series of viewpoints is evenly sampled around the average position of each frontier cluster. Then, the yaw angle of the UAV is uniformly sampled around each viewpoint. Next, the viewpoints of all frontier clusters are sorted in descending order of the coverage of yaw angles. For each frontier cluster detected, extra frontier cluster information can be obtained (as shown in Table 1), which helps in choosing a more reasonable target.

3.3.2. Small-Area Cluster Detection

Small frontier clusters are often ignored during exploration due to their low information gain, which results in back-and-forth flights and the repeated visitation of explored areas, as shown in Figure 1. Detecting small frontier clusters in advance and prioritizing their visitation can effectively solve this problem. In a hybrid 2D map, the best viewpoint of each frontier cluster with the highest LiDAR information gain G l i d a r can be obtained, and the accurate detection of small frontier clusters can thus be performed. The size of the potentially explorable area behind the frontier cells can be computed using a ray-casting algorithm based on [18], as described in Algorithm 1.
Algorithm 1 Calculation of LiDAR information gain.
Input: V h i g h , M h y b r i d , C i , p i , R m a x
Output: C l i d a r , N r a y , R d i r
  1:
C l i d a r s t a r t = D o w n S a m p l e ( C i , M h y b r i d . r e s ( ) )
  2:
N r a y = C l i d a r s t a r t . s i z e ( )
  3:
for each c i in C l i d a r s t a r t  do
  4:
     d i r = ( c i p i ) . n o r m a l i z e ( )
  5:
     d i r _ = d i r _ + d i r
  6:
     C l i d a r e n d . p u s h b a c k ( c i + d i r · R m a x )
  7:
end for
  8:
for each i in r a n g e ( C l i d a r s t a r t . s i z e ( ) )  do
  9:
     R a y C a s t I n i t ( C l i d a r s t a r t ( i ) , C l i d a r e n d ( i ) , M h y b r i d )
10:
    while  R a y C a s t N e x t ( s t a t e )  do
11:
        if  s t a t e = = O c c u p i e d  then
12:
           break
13:
        end if
14:
         C l i d a r + +
15:
    end while
16:
end for
17:
R d i r = d i r _ . n o r m a l i z e ( )
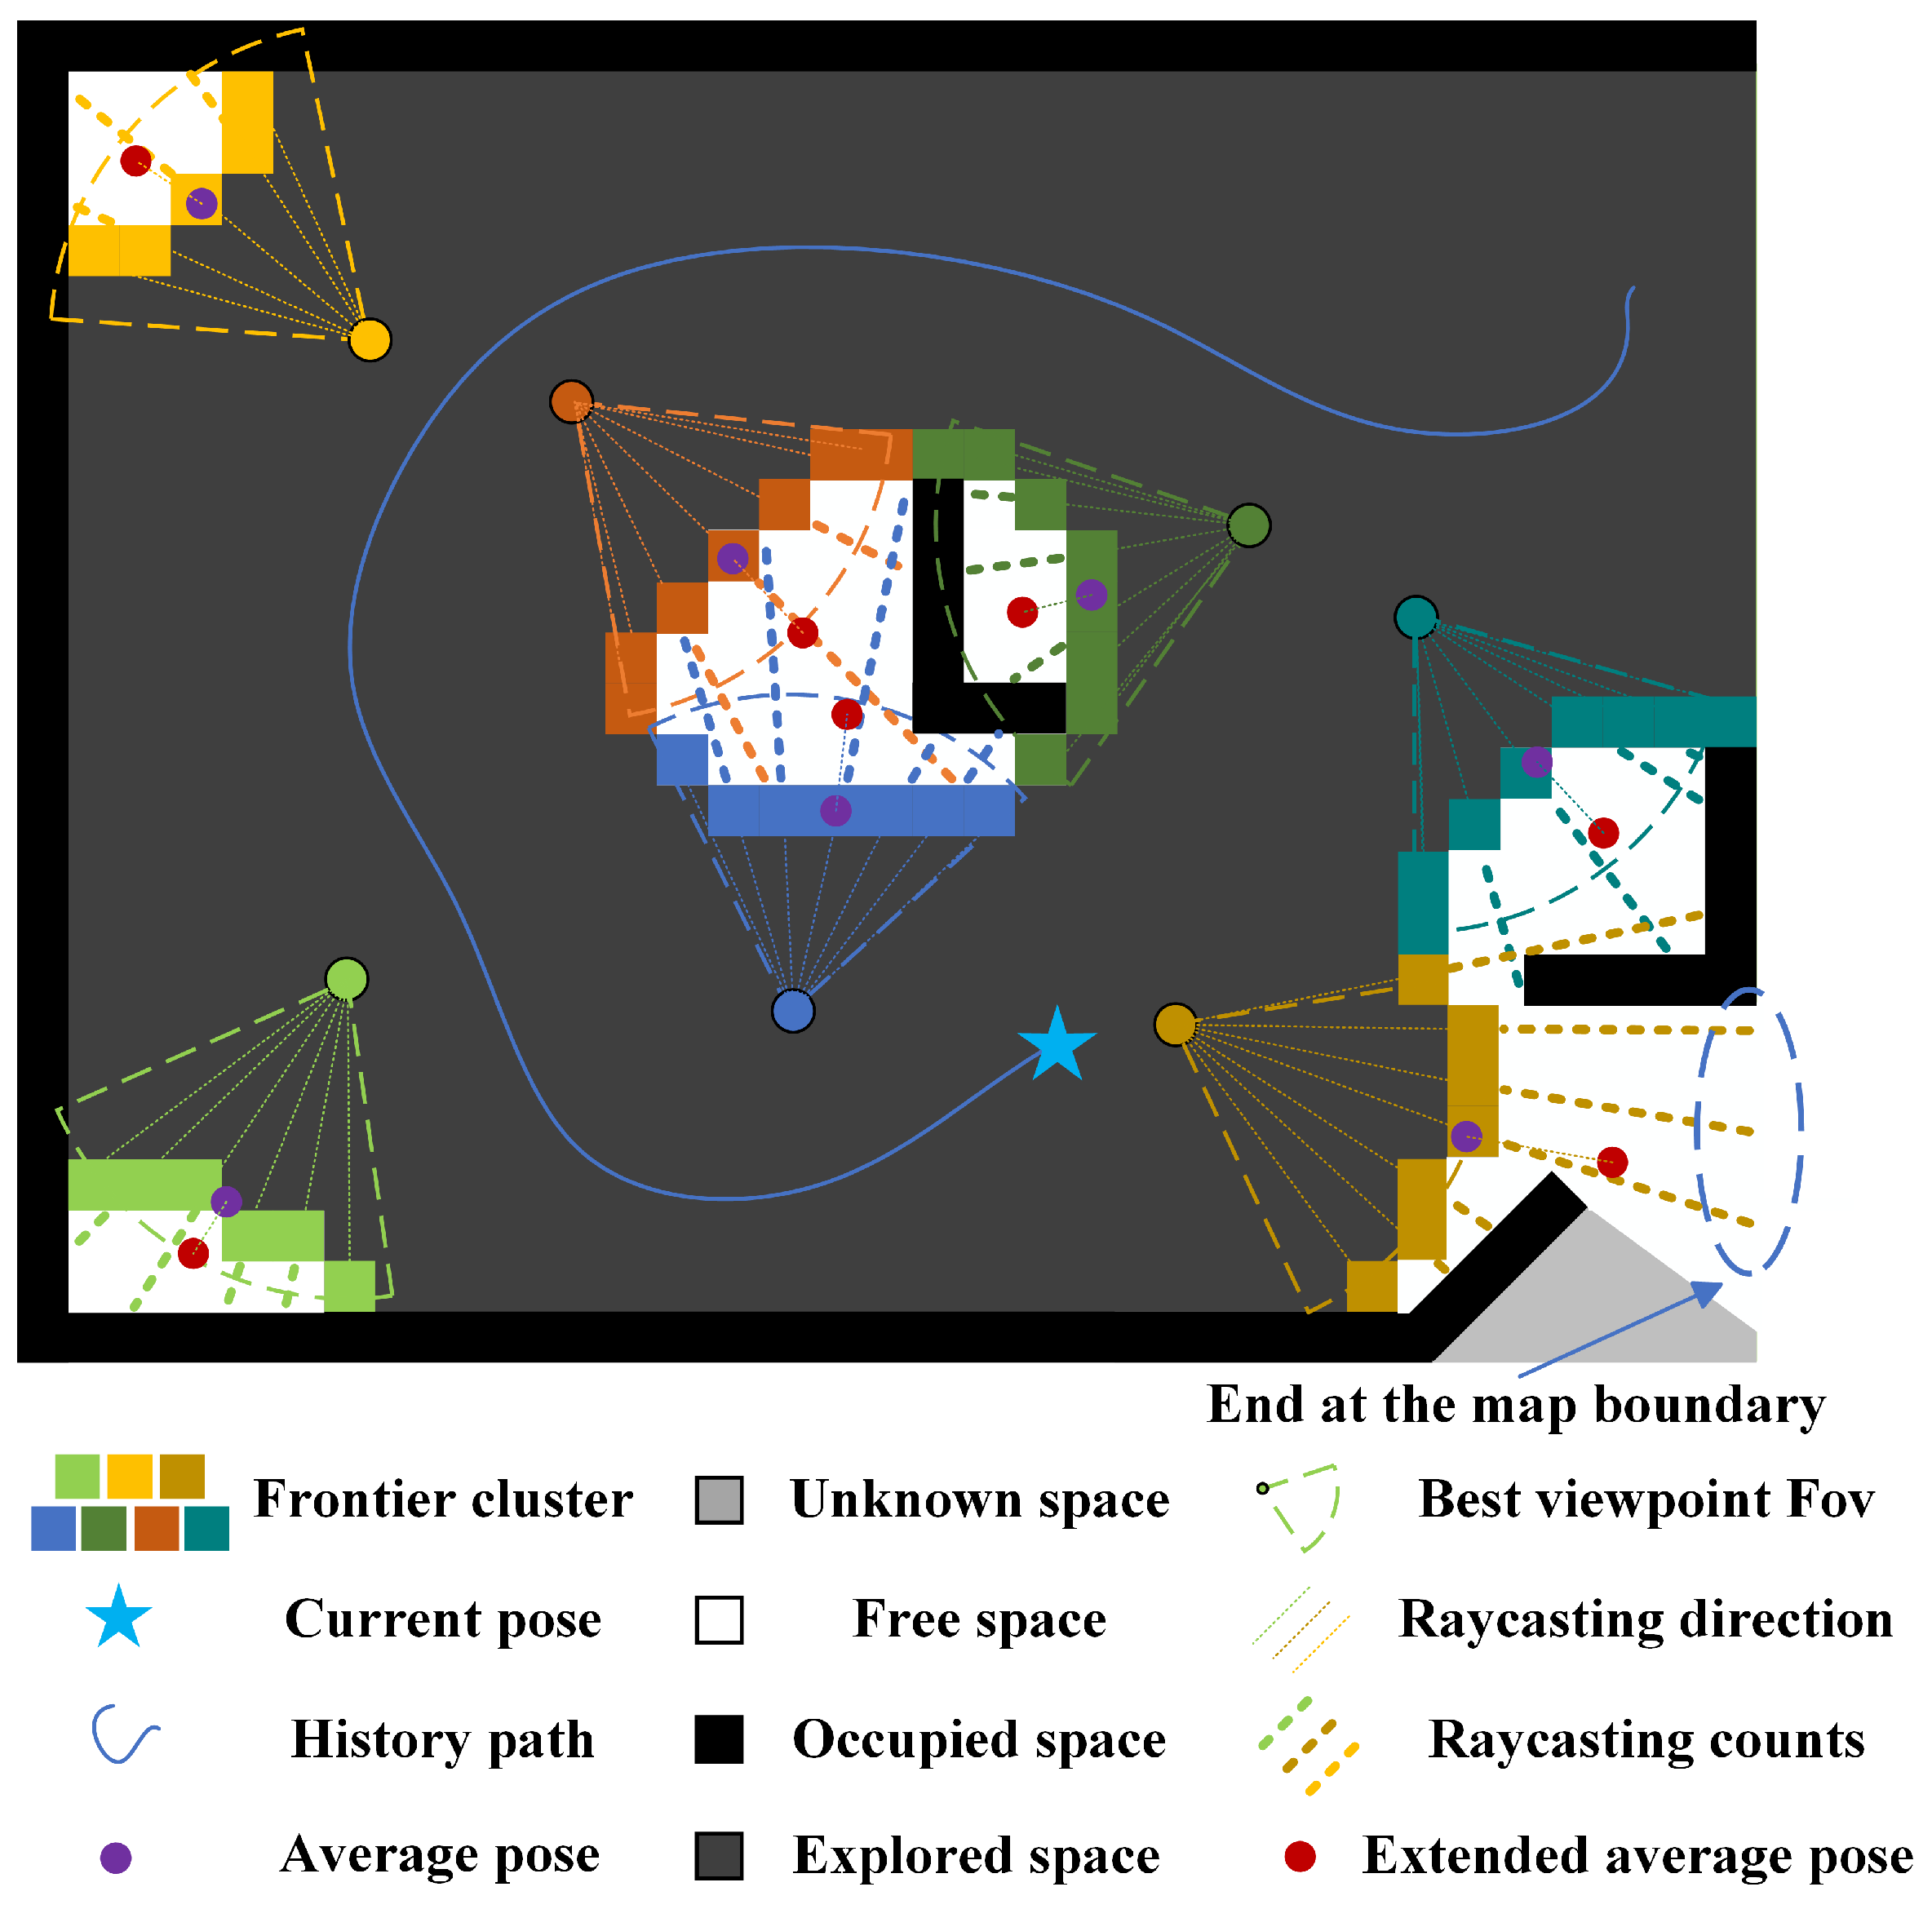
At first, a series of 2D start points for ray-casting can be generated by applying DownSample() to sparse frontier cluster cells C i at the current UAV height (Line 1–2). Specifically, frontier cells that are less than one map resolution away from the current height are first selected and projected onto the 2D plane; a set of 2D points that are more than one map resolution away from each other are subsequently calculated. Then, the end point of ray-casting is derived by combining the maximum effective sensing range R m a x of the LiDAR with the direction of the viewpoint in relation to each sparsified cell c i (Line 2–7). Next, the number of potentially explorable cells C l i d a r on the hybrid map is counted along the direction of ray-casting until an occupied cell is detected (Line 7–15), as shown in Figure 5. Finally, the average size G l i d a r of the explorable space behind the frontier cluster can be calculated using Equation (2). The extended average position p e x t e n d of each frontier cluster is also computed using Equation (3).
G l i d a r = M h y b r i d . r e s ( ) · C l i d a r N r a y
p e x t e n d = p a v g + k 1 · G l i d a r · R d i r
In the above equations, the resolution of the hybrid maps M h y b r i d . r e s ( ) acts as a medium for translating potential information gains to a real scale, N r a y is the size of sparsified cells, p a v g is the average position of the corresponding frontier cluster, k 1 is an adjustable extension factor and R d i r is the mean direction for ray-casting calculations. Given the small region threshold t h r s m a l l , frontier clusters with less LiDAR information gain than t h r s m a l l are labeled as small regions, i.e., A s m a l l = t r u e .
To reduce or even avoid the repeated exploration caused by small frontier clusters, an effective small area cost c s ( k ) for frontier clusters f t r k is constructed by increasing the visitation priority of small frontier clusters:
c s = k s f t r k . G l i d a r f t r k . A s m a l l 0 0 e l s e
where k s is a constant value larger than t h r s m a l l , and a smaller G l i d a r corresponds to higher access rights. To avoid excessive focus on small frontier clusters leading to back-and-forth movements, only those within the range of R s m a l l from the current position are considered.

3.3.3. Isolated-Area Cluster Detection

Like small frontier clusters, isolated frontier clusters also lead to back-and-forth movements. Using a hybrid 2D map, isolated frontier clusters can be detected quickly. Firstly, the cell states of the hybrid 2D map are classified into two categories {0, 1} to obtain a binarized image, where the occupied or explored cells are recorded as 1 and known free or unknown cells are recorded as 0. Secondly, a connected component in the innermost layer with a state of 0 and area sizes that meet the setting range are detected. The smallest rectangle that encompasses the connected regions can then be illustrated and its four vertices recorded. Next, the isolated frontier clusters are detected by determining whether the corresponding p e x t e n d is within the four recorded vertices. To determine the special frontier priority, the isolated area cost c i s o ( k ) for frontier cluster f t r k is computed using Equation (5).
c i s o = k i s o f t r k . A i s o l a t e d 0 0 e l s e
where k i s o is an empirical weight used to emphasize preferential access to isolated regions.
As shown in Figure 6, there often exist multiple isolated frontier clusters within a connected region. Therefore, determining the cost difference of these isolated frontier clusters helps to plan a smoother coverage path. For this reason, unlike small frontier clusters, all isolated frontier clusters have the same weight coefficient. Once isolated areas are detected, higher access rights drive the drones to prioritize their coverage in order to avoid inefficient exploration due to return flights.

3.3.4. Solving the ATSP

As mentioned above, the appropriate selection of the next target is crucial for optimizing overall exploration efficiency. Given N frontier clusters as candidate targets, this study constructs a cost matrix M ( N + 1 ) ( N + 1 ) to solve the ATSP and obtain the order of access. Since the order of returning to the current position is irrelevant, the cost of returning from the candidate targets to the current position is set to 0. In addition, we mainly consider the cost of traveling between frontier clusters for the path time constraint, which is calculated as below:
M t s p ( i , j ) = M t s p ( j , i ) = t l b ( V i , V j ) , i , j { 1 , 2 , , n }
t l b ( V i , V j ) = m a x { l e n g t h ( p i , p j ) v m a x , m i n ( | θ i θ j | , 2 π | θ i θ j | ) θ ˙ m a x }
where V i denotes the best viewpoint of the frontier cluster f t r i , p i is the corresponding position at the viewpoint, θ i is the corresponding yaw angle, and v m a x and θ ˙ m a x are the maximum linear and angular velocity constraints of the UAV, respectively.
The cost of traveling from the current position p 0 to each candidate target is calculated as follows considering path time, motion continuity, boundary, and small and isolated area constraints:
M t s p ( 0 , k ) = t l b ( V 0 , V k ) + w c · c c ( V k ) + w b · c b ( k ) w s · c s ( k ) w i s o · c i s o ( k )
c c ( V k ) = c o s 1 ( p k p 0 ) · v 0 | | p k p 0 | | | | v 0 | |
where w c is the motion continuity penalty factor, w b is the boundary cost penalty factor, and w s and w i s o are the reward weight coefficients for small and isolated frontier clusters, respectively. c c ( V k ) penalizes frontier clusters that have a large change in the direction of the current motion. The boundary cost c b ( k ) is the minimum distance from the average position p k of the candidate viewpoint to the map boundary, and is used to provide a travel direction guidance constraint for the UAV. Given the aforementioned cost matrix, we use the TSP solver LKH [19] to obtain an access sequence that enables the UAV to visit each frontier cluster in turn, starting from the current position.

3.4. Motion Planning Module

Regarding the global access order obtained by the TSP solver, a segment is taken, and local refinement is applied using FUEL [7] to obtain the next target. After the next target is determined, FUEL carries out direct trajectory planning from the current location to the next target. FAEP [8], on the other hand, selects an intermediate yaw and carries out two-stage yaw planning if the yawing motion meets the position trajectory time constraints, which is significantly more efficient compared to FUEL.
However, the constructed maps are not always accurate due to sensor noise and localization drift, thus setting the yaw at the next target, as the target planning yaw could threaten UAV safety. As depicted in Figure 7, because of the large difference between the motion direction and the FOV camera orientation, the UAV is unable to effectively perceive the environmental information (e.g., the presence or absence of obstacles on the path) in the direction of movement, which makes it highly susceptible to collision and leads to failure of the exploration mission. Moreover, even if the pre-constructed maps are intact, the planning strategy is not effective in sensing and avoiding sudden obstacles.
To ensure safety and efficiency during exploration, an EIG optimization strategy is performed to increase the amount of environmental information the UAV can obtain during its flight to the next target. A temporary target yaw θ t e m p is selected only if the angle between the planned movement direction and the direction of the target yaw θ n e x t is less than a preset threshold, where collision risk increases due to the lack of information on the surroundings. To ensure that the UAV can observe environmental information in the direction of movement, the threshold angle can be set to half of the horizontal FOV angle of the onboard depth camera. Unless the UAV is within a predefined safe range of distances to the next target, once the condition is triggered, the orientation of the temporary target yaw is selected as the planned direction of motion and is set to θ n e x t = θ t e m p . In addition, a suitable intermediate yaw angle, preferentially selected from the adjacent small and isolated frontier clusters, is selected to generate information-rich trajectories with prior consideration of time constraints. The selected intermediate yaw aims to make the UAV mimic the human behavior of looking around to obtain more information about the environment.
The path information gain optimization strategy for subsequent yaw planning is illustrated in Algorithm 2. The total motion time T d e s i r e and corresponding time allocation ratio R d e s i r e for two consecutive instances of yaw trajectory planning are initialized to zero (Line 1). The local refined viewpoint V l o c a l within the radius R n e a r of the current pose p n o w is then filtered into V n e a r (Line 2), and the path time constraint T l b is also calculated (Line 3), where pathLength() uses the A* algorithm to search for the shortest collision-free path from the current path to the next path, k l b is an adjustable weighting factor, and v 0 is the current speed of the drone. Then, the middle yaw that satisfies the time constraints T l b and facilitates larger yawing movements is selected to increase coverage of the surrounding unknown environment (Lines 4–10). Finally, the appropriate time constraints are used to plan the yaw trajectory accordingly (Lines 11–18).
Algorithm 2 Path information gain optimization strategy.
Input: V l o c a l , θ c u r , θ n e x t , p n o w , p n e x t , v 0 , R n e a r , k l b
Output:   yaw Trajectory Y
   T d e s i r e = 0 , R d e s i r e = 0 , θ m i d d l e = 0
   V n e a r = S e l e c t N e a r V P ( p n o w , V l o c a l , R n e a r )
   T l b = k l b · P a t h L e n g t h ( p n o w , p n e x t ) v 0 . n o r m ( )
  for each V P in V n e a r  do
       T 1 , T 2 = E s t M i n Y a w T ( θ c u r , θ v p , θ n e x t )
       T m i n = k l b · ( T 1 + T 2 ) , r a t i o = T 1 / T m i n
      if  T m i n T l b & & T m i n > T d e s i r e & & r a t i o 0 & & r a t i o k l b  then
           T d e s i r e = T m i n , R d e s i r e = r a t i o , θ m i d d l e = θ v p
      end if
  end for
  if  T d e s i r e 0 then
       Y 1 = Y a w P l a n n i n g ( θ c u r , θ m i d d l e , T d e s i r e · R d e s i r e )
       Y 2 = Y a w P l a n n i n g ( θ m i d d l e , θ n e x t , T d e s i r e · ( 1 R d e s i r e ) )
      return Y ( Y 1 , Y 2 )
  else
       T r a w = E s t M i n Y a w T ( θ c u r , θ n e x t )
      return Y a w P l a n n i n g ( θ c u r , θ n e x t , T r a w )
  end if
After utilizing the above EIG optimization strategy, the path from the current position to the next target is planned. If the intermediate yaw angle is successfully selected, T d e s i r e calculated by Algorithm 2 is used as the time constraint for position trajectory planning; otherwise, T r a w is used. If the trajectory from the current position to the next target is too long, an intermediate target point can be selected for the subsequent trajectory optimization. Eventually, the method in [20] is used to generate B-spline trajectories for the UAV that satisfy smooth, safe and dynamics constraints.

4. Experiments

4.1. Simulations

To investigate the effectiveness of the proposed algorithm, three simulation environments were established using the Gazebo simulator. The UAV model used in the simulation had a 500 mm diameter between two diagonal motor shafts, and was equipped with 2D LiDAR and a depth camera. Details of its configuration are presented in Table 2. The geometric controller [21] was implemented to track the generated trajectory. Fiesta [22] was used to construct V h i g h for exploration completeness, and Octomap [23] was used to construct V l o w for low memory occupation. The following parameters were used for special frontier detection and solving the ATSP: t h r s m a l l = 2.2 m, k 1 = 0.5 , k i s o = 15 , k l b = 1.35 , w c = 0.05 , w b = 1.0 , w s = 1.0 , w i s o = 1.2 . Adjustments to these parameters can be made with reference to the practical implications described earlier.
The state-of-the-art frontier-based algorithms FUEL [7] and FAEP [8], which currently offer the best autonomous UAV exploration performance, were chosen for comparison. Meanwhile, additional ablation experiments were performed in scenario 1 (Indoor1), where O U R S E I G and O U R S L i D A R only used EIG strategies and LiDAR data, respectively. To avoid random superiority in a single run, simulations were repeated 10 times in each simulation environment for all three algorithms, with the same settings. The resolutions for V h i g h and V l o w were set to 0.12 m and 0.15 m, respectively. The initial size of the local map M h y b i r d was 12 × 12 m2, and it was adaptively cropped according to the map boundaries to save resources.
(1) Office Rooms: Two typical office rooms were used to investigate the effectiveness of the exploration algorithm. The volume of the Indoor1 scene was 40 × 20 × 3 m3, and that of the Indoor2 scene was 35 × 28 × 3 m3. The simulation results are shown in Table 3 and Figure 8. During exploration, FUEL often missed more frontier clusters, which resulted in obvious repeated exploration motions later, leading to low exploration efficiency. In comparison, based on the depth camera data, FAEP could detect some of the small frontier clusters and reduce their omission. Meanwhile, the boundary constraints of FAEP guided the UAV to explore the map boundary, which also reduced the rate of repeat visits to the explored area to some extent. However, such constraints also caused the omission of isolated frontier clusters that are far from the map boundary, leading to unnecessary repeated exploration, as shown by the trajectory in Figure 8b. In addition, constrained by the limited FOV of the depth camera, many small frontier clusters were not detected properly by FAEP.
Because of the need to cover special frontier clusters with a high risk of repeated exploration, the coverage curves of the proposed LAEA occasionally stagnated briefly, and then, resumed rapid growth, as shown in Figure 8d,e. Comparatively, both FUEL and FAEP also inevitably experienced significant stagnation in the later stages of exploration. Owing to the LiDAR-assisted special frontier cluster detection and EIG optimization strategy, the proposed algorithm can balance exploration gain with the repeated-exploration risk, and its overall exploration efficiency is higher in all three scenes. Compared to FUEL and FAEP, the proposed LAEA reduces the exploration time by 24–28% and 11–22%, respectively, and the path length by 15–21% and 10–20%.
(2) Pillar Forest: Simulations in a forest measuring 48 × 25 × 3 m3 with surrounding walls and uniformly distributed obstacles were also conducted to investigate the stability and efficiency of the proposed algorithm. The results are shown in Table 3 and Figure 8, and demonstrate that the proposed algorithm reduced exploration time by 19% and 13% compared to FUEL and FAEP, respectively. In complex forest environments, because of the lack of boundary guidance, the efficiency of FUEL remains poor, while both FAEP and the proposed LAEA initially guide the UAV around the map boundary, and therefore, are more effective. As depicted in Figure 8c,f, due to the EIG optimization strategy, the proposed LAEA was able to observe more unexplored regions while exploring the boundary, which corresponds to a coverage curve with a faster growth rate. Moreover, as shown in Figure 8c, the boundary constraints of FAEP still tend to miss the small and isolated frontier clusters, leading to undesirable back-and-forth movements. In contrast, the proposed multi-sensor-based hybrid map of LAEA can quickly detect these special frontiers and cover them, which makes exploration more efficient.
(3) Further Evaluation: To more clearly demonstrate the contribution of the proposed algorithm, a simple and effective comparison test was designed. As shown in Figure 9d, FAEP missed a number of special frontier clusters and caused several unnecessary back-and-forth motions during its exploration, which is mainly related to Parts 1–3. The details of the special clusters missed by FAEP in Parts 1–3 are shown in Figure 9a–c, and these omissions were partly limited by the restricted FOV of the depth camera. In particular, since FAEP relies heavily on boundary constraints during exploration, this inevitably leads to low access rights to frontier clusters far from the map boundary. In contrast, as shown in Figure 9e–g, the proposed LAEA, with the help of LiDAR data information, can efficiently acquire environmental contour information to quickly detect unexplored closed regions (isolated frontier clusters) and regions with low potential for information gain (small frontier clusters). From the detected special frontier clusters, either the next target or the middle yaw angle of the EIG optimization strategy is then selected for fast coverage.
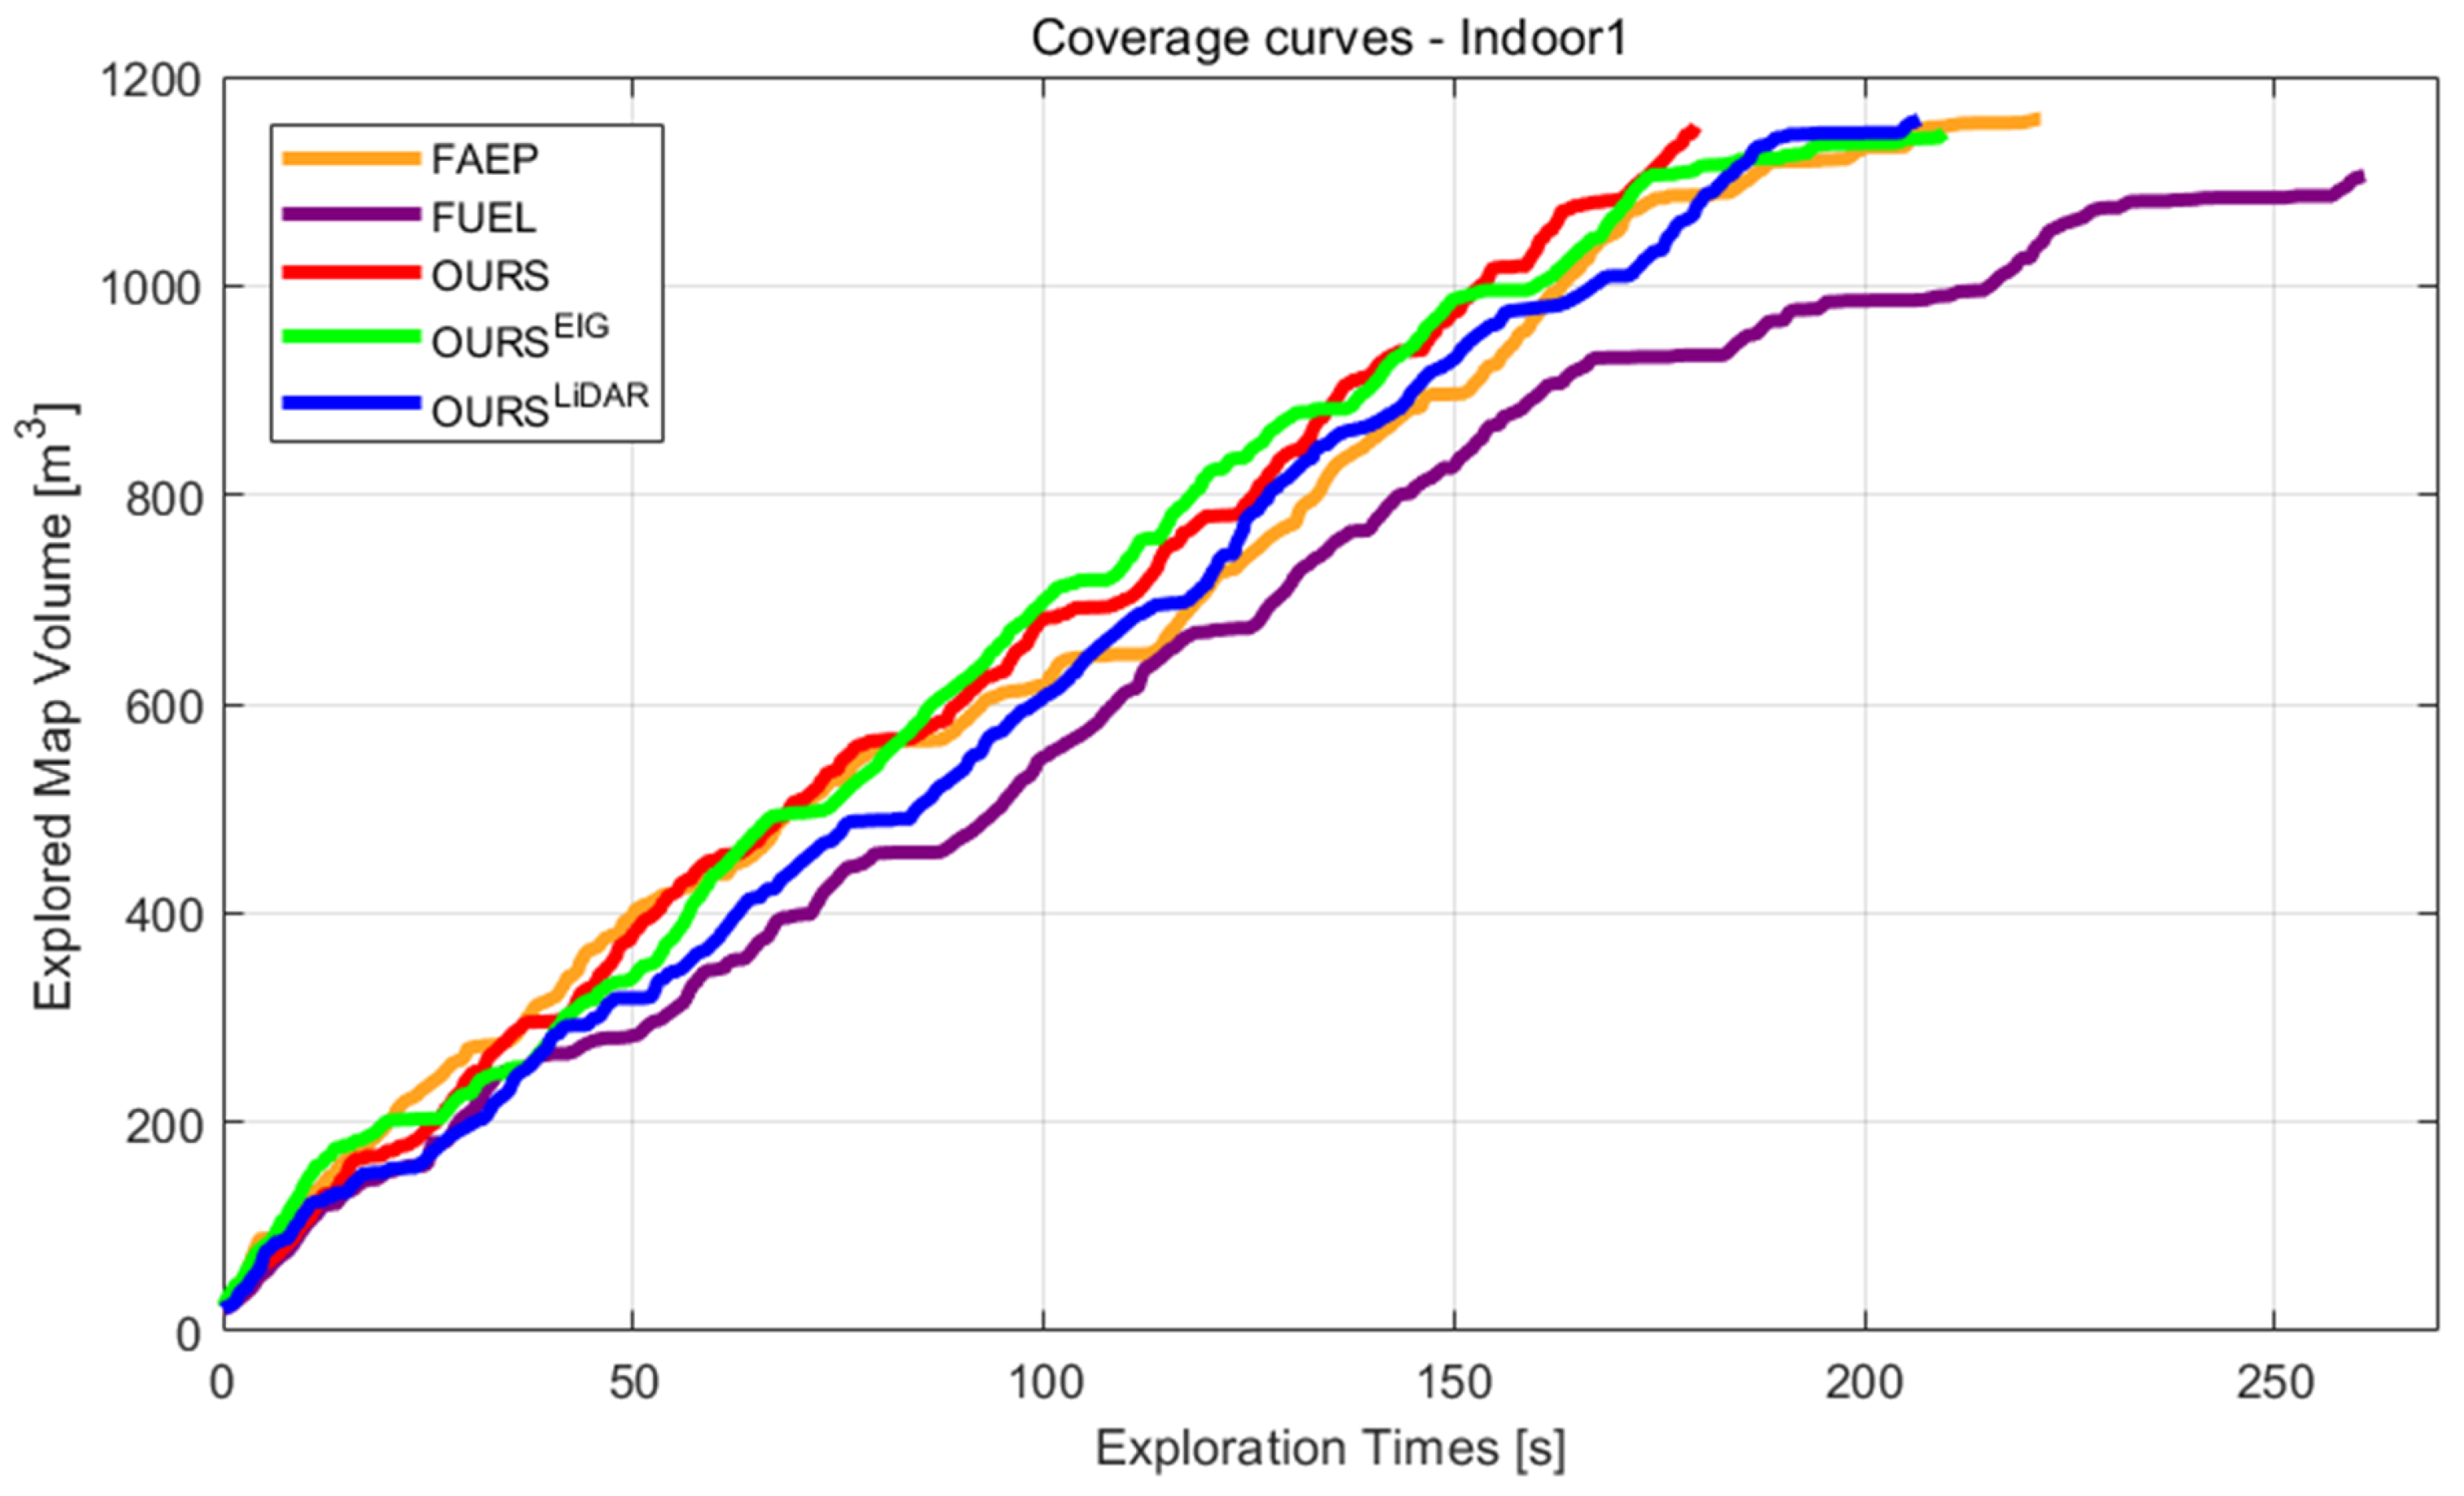
(4) Ablation Study: The results of the ablation experiments are shown in Table 3 and Figure 10. It is clear that both O U R S E I G and O U R S L i D A R are more effective than FAEP and FUEL. As in Figure 10, thanks to the flexible yaw motion, O U R S E I G can achieve additional coverage of nearby frontier clusters as it travels to the next target, and can maintain high coverage per unit time. However, due to the lack of environmental contour information at the frontier clusters, many back-and-forth motions are still seen in the later stages of the exploration flight to cover missed isolated and small frontier clusters; thus, the coverage per unit time decays dramatically. Meanwhile, thanks to the prioritized access to the detected isolated and small frontier clusters, O U R S L i D A R has a relatively slow but steadily increasing trend of coverage per unit time, outperforming FAEP and FUEL. In contrast, the proposed LAEA, incorporating the advantages of both O U R S E I G and O U R S L i D A R , achieves superior efficiency to FAEP and FUEL.

4.2. Real-World Experiments

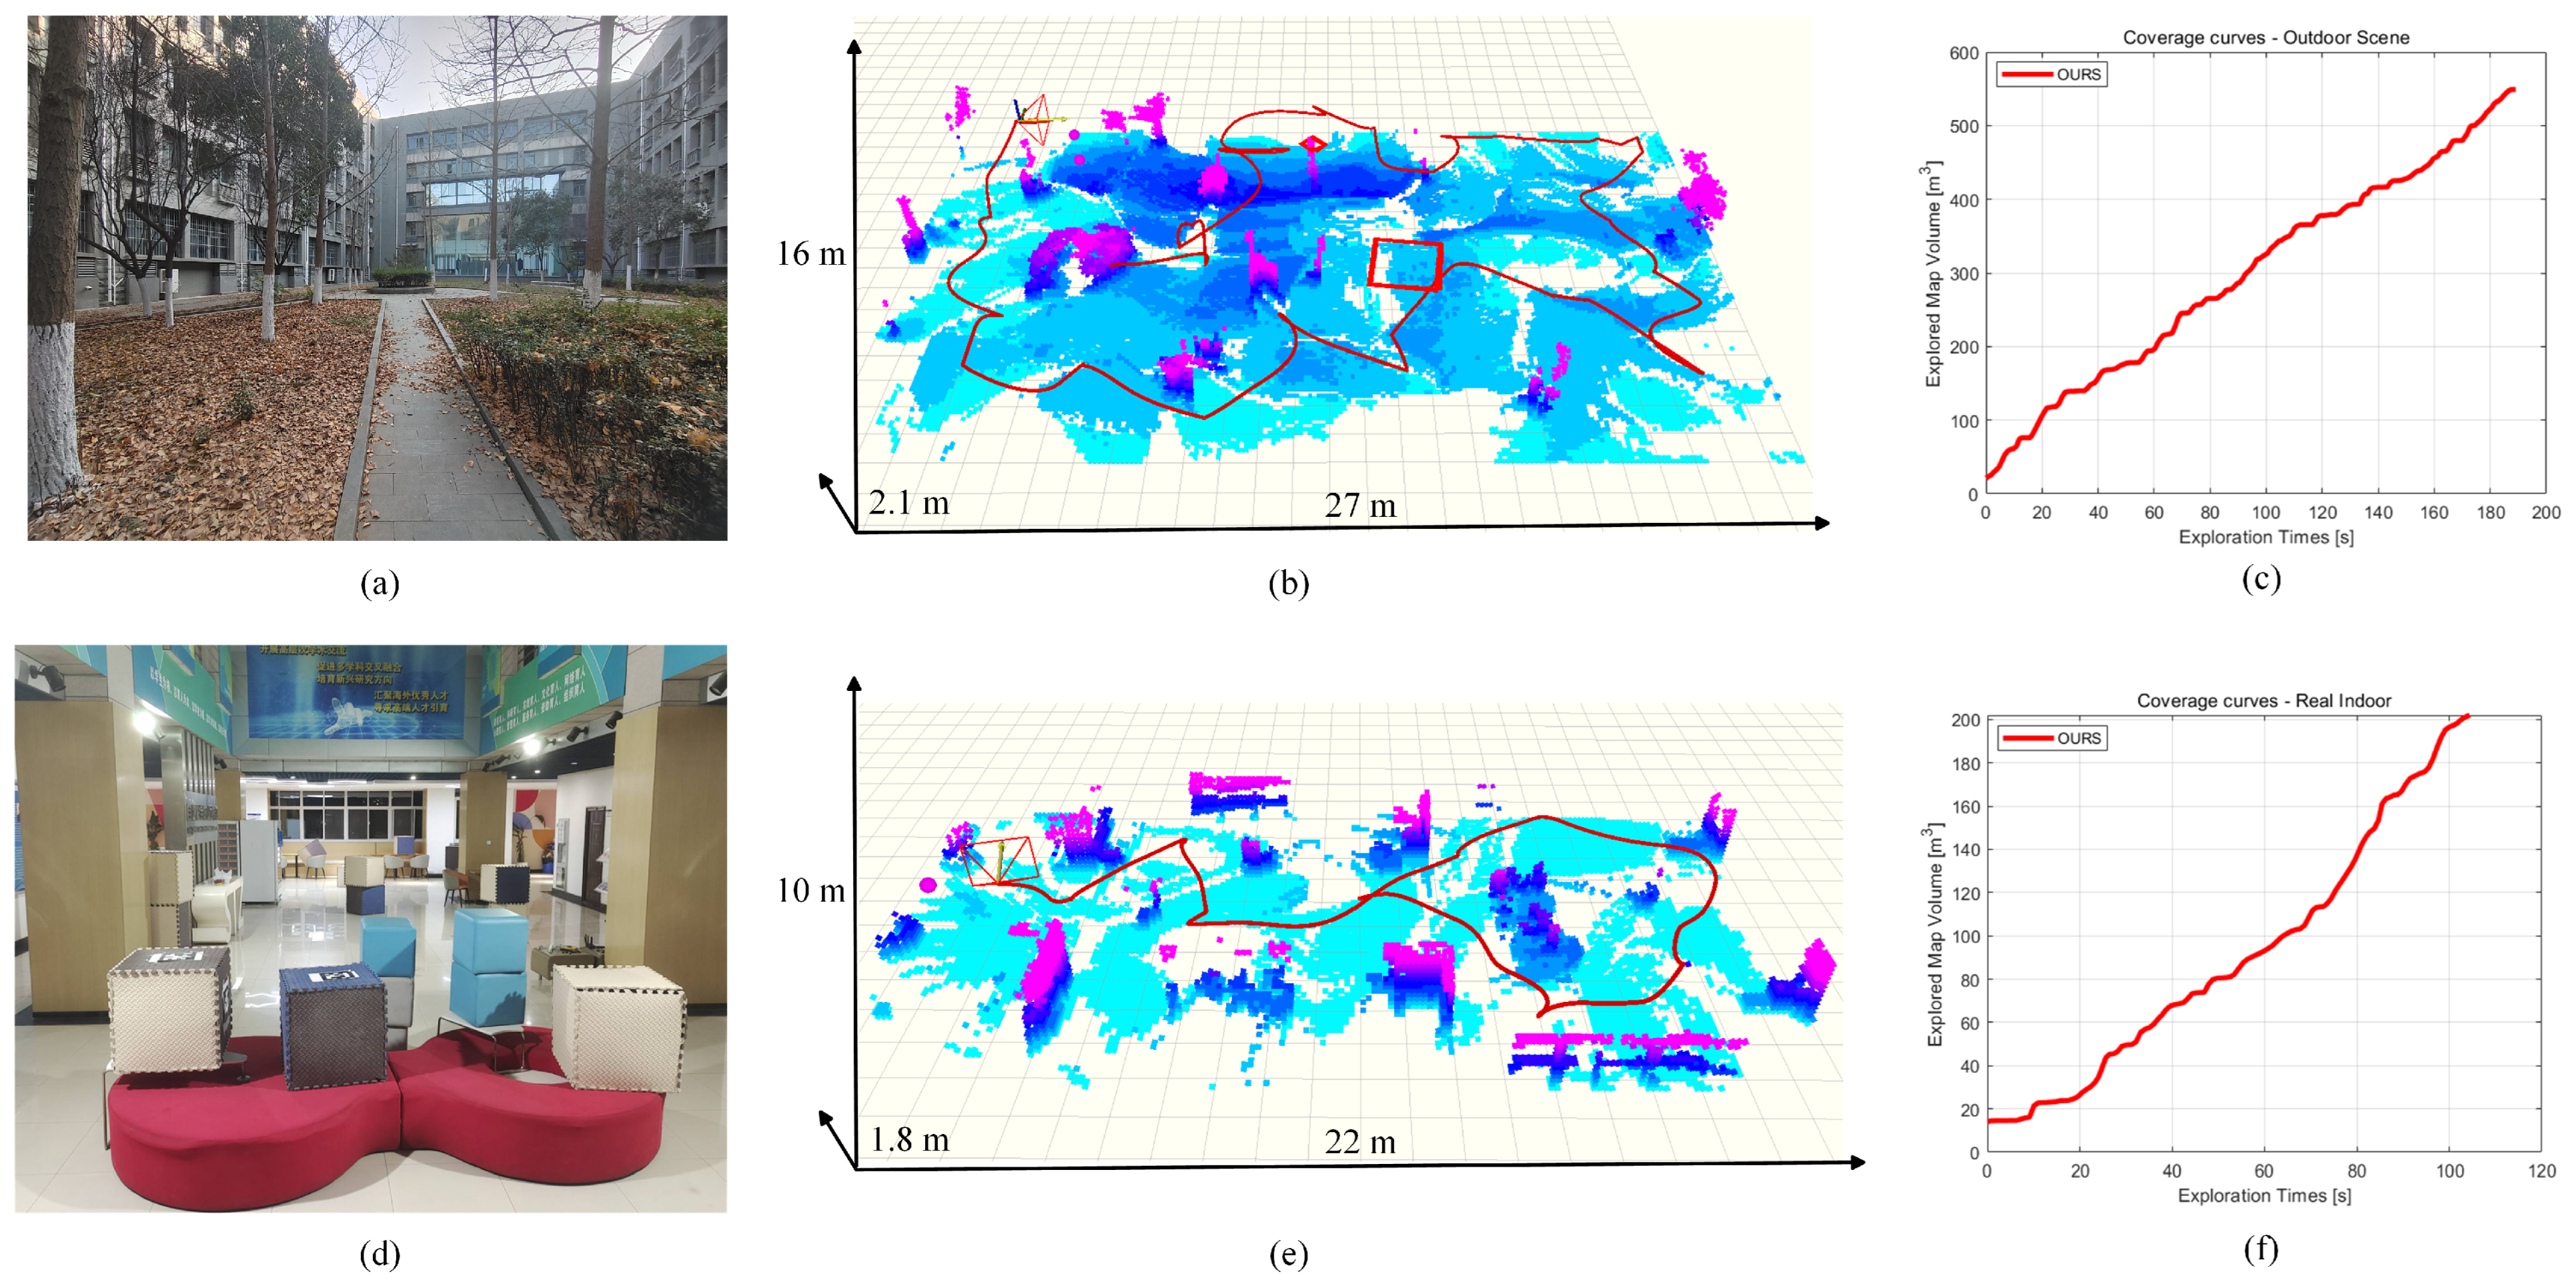
Real-world experiments were also carried out in two different scenarios to investigate the effectiveness of the proposed algorithm at reducing repeated exploration. As shown in Figure 11, we used a customized quadrotor platform measuring 380 mm in diameter between two diagonal motor shafts, which was equipped with an RGB-D camera (D435, Intel, Santa Clara, CA, USA), 2D LiDAR (LD19, LdRobot, Nanshan District, Shenzhen, China) and an Nvidia onboard computer (Xavier, Nvidia, Santa Clara, CA, USA). In addition, an Intel T265 camera was used for UAV position estimation. The dynamic motion limits were set to v m a x = 0.75 m/s, a m a x = 0.75 m/s and θ m a x = 0.75 rad/s in the outdoor scene, and v m a x = 0.5 m/s and a m a x = 0.5 m/s in the indoor scene.
Experiments were first conducted in a courtyard with an exploration map size of 27 × 16 × 2.1 m3, and the results are shown in Figure 12a–c. Due to the branches and weeds in the scene, the detection threshold t h r s m a l l for small areas was set to 1.0 m. The exploration time of the whole process was 190 s, and the total length of the flight path was 120 m. During the exploration process, the multi-sensor-based hybrid map quickly detected and covered the special frontier areas, which ensured steady growth of the coverage curve shown in Figure 12c. Subsequently, experiments were also carried out in an indoor environment with map dimensions of 22 × 10 × 1.8 m3, as illustrated in Figure 12d–f; the exploration time was 100 s, and the flight path length was 42 m. The experimental results show that the proposed algorithm was able to quickly cover the special frontier region of detection in different scenarios, demonstrating efficient exploration of the unknown environment.
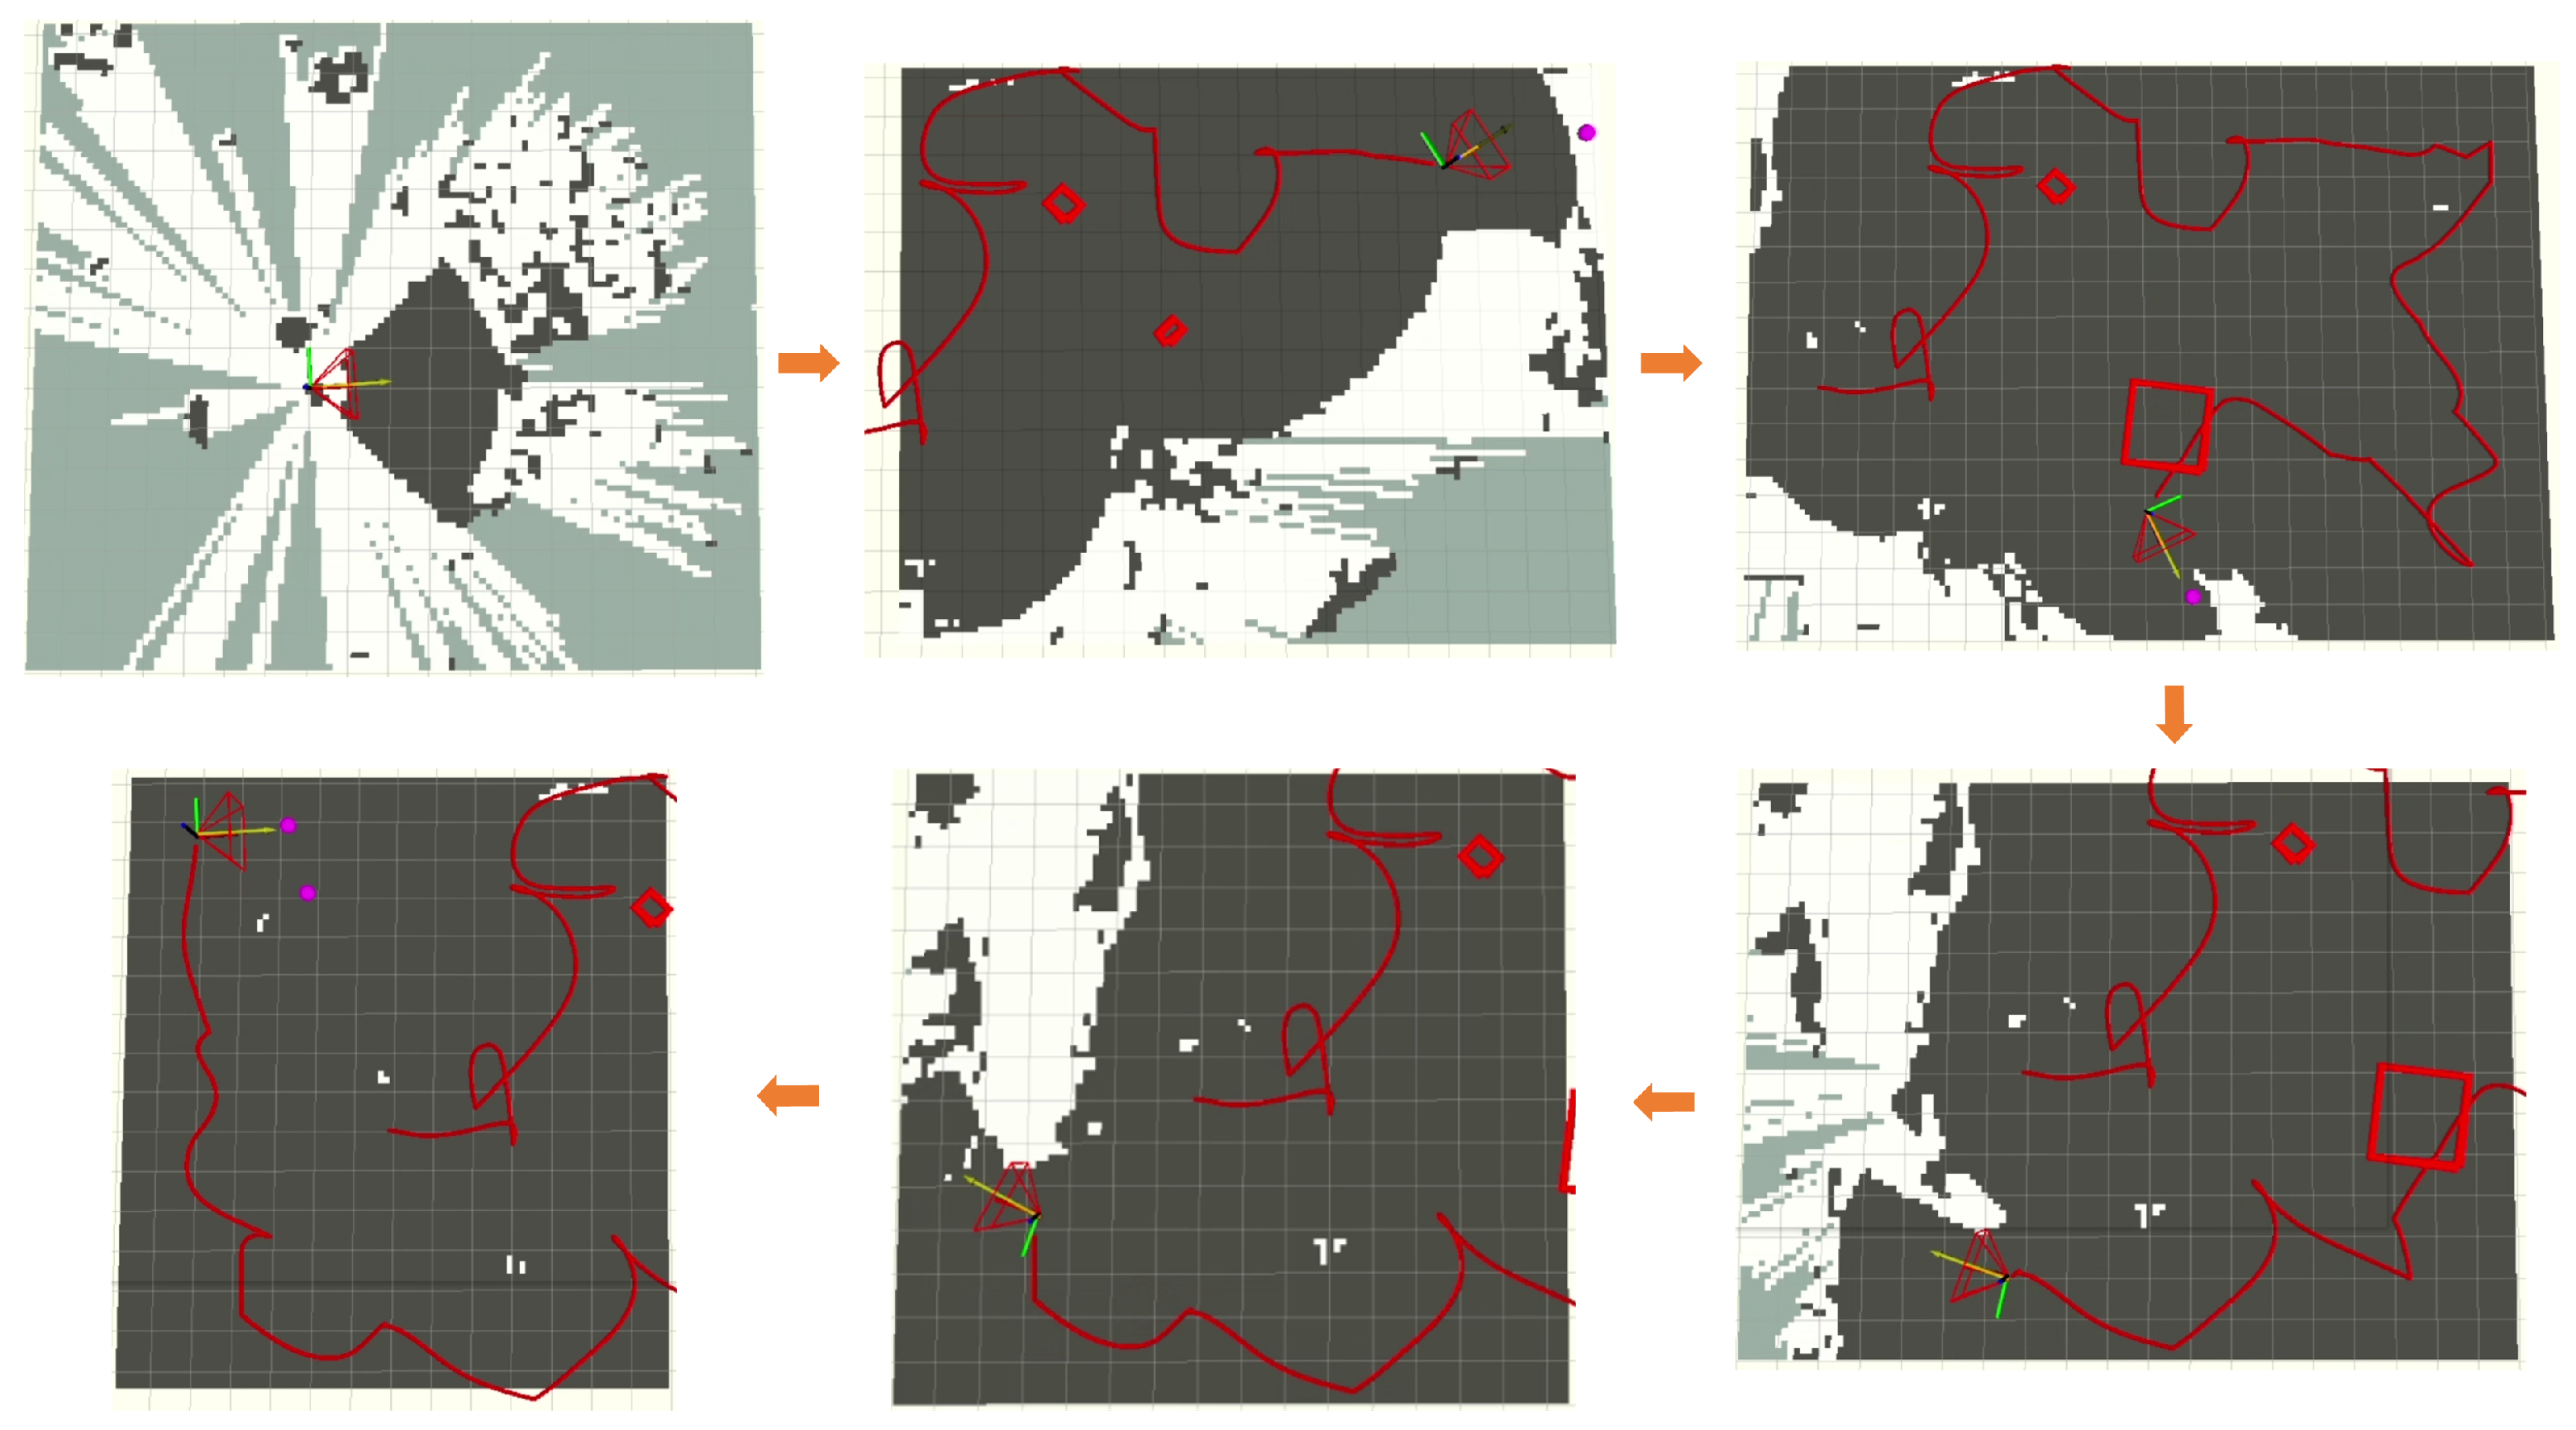
It is worth noting that our preset minimum height for the exploration area was 0.1 m, and due to the uneven topography of the courtyard and the presence of large low-lying areas and visual localization drift, many visually blank areas (no point cloud) appeared in Figure 12b,e. In contrast, the local hybrid map enables better visualization of whether areas are covered or not, as shown in Figure 13. The hybrid map is moved according to the current position of the UAV and is adaptively cropped according to the map boundaries. More details of the experiment can be seen in the demonstration video provided in Figure 8.

4.3. Discussion of the Use of LiDAR

The effect of using 2D LiDAR in the proposed LAEA on the endurance of the UAV is discussed here. The LdRobot LD19 2D LiDAR is a compact TOF (time of flight) sensor with a weight of 42 g and 0.9 watts of power [24]. The total weight including the LiDAR mounting parts and cables is approximately 80 g, whereas the UAV system without LiDAR weighs 2.0 kg and has about 420 watts of hovering power. Equipped with a 4 s 5300 mha Li-ion battery (Grepow, Longhua New District, Shenzhen, China), the endurance of the UAV without LiDAR was found to be about 11.4 min using the quadrotor evaluation system proposed in [25]; meanwhile, with the LiDAR mounted, the UAV can still fly for about 10.8 min, indicating a 5.3% endurance loss. It is clear that despite the insignificant weight and power consumption increases, our proposed LAEA offers a considerable improvement in exploration efficiency using 2D LiDAR.

5. Conclusions

This paper proposes a 2D LiDAR-assisted, RGB-D-dominated, autonomous exploration algorithm for UAVs. The algorithm utilizes 2D LiDAR to quickly acquire contour information from the environment and generates a hybrid map that characterizes the exploration value of the surrounding environment using multi-sensor data. Based on the hybrid map, small and isolated frontier clusters that can lead to repeated movements are quickly detected, and their access in prioritized. At the same time, the environmental information gain (EIG) strategy allows the UAV to balance the acquisition of additional environmental information gain with flight safety while traveling to the next target. In our simulations, the proposed LAEA, outperforms two state-of-the-art exploration algorithms in both exploration time and flight distance. Validation on a robotic platform verifies the practicability of LAEA in two different real-world scenarios.

Author Contributions

Conceptualization, X.H., Z.P., J.H., Y.L. and C.Z.; methodology, Z.P. and X.H.; software, Z.P.; validation, Z.P., L.L. and Y.W.; formal analysis, Z.P. and X.H.; investigation, Z.P.; resources, X.H.; data curation, Z.P., L.L. and Y.W.; writing—original draft preparation, Z.P., X.H., J.H., Y.L. and C.Z.; writing—review and editing, X.H., Z.P., J.H. and Y.L.; visualization, Z.P.; supervision, X.H.; project administration, X.H.; funding acquisition, X.H. All authors have read and agreed to the published version of the manuscript.

Funding

This work was supported by National Natural Science Foundation of China of Funder grant number 61703343, 62073264, 62203358 and 52372434.

Data Availability Statement

The code and other supplementary materials are available at: https://github.com/Poaos/LAEA (accessed on 5 March 2024).

Conflicts of Interest

The authors declare no conflicts of interest.

References

  1. Siddiqui, Z.A.; Park, U. A drone based transmission line components inspection system with deep learning technique. Energies 2020, 13, 3348. [Google Scholar] [CrossRef]
  2. Yumin, Y. Research and design of high-precision positioning system for agricultural plant protection UAV—Based on GPS and GPRS. J. Agric. Mech. Res. 2016, 38, 227–231. [Google Scholar]
  3. Cho, S.W.; Park, H.J.; Lee, H.; Shim, D.H.; Kim, S.-Y. Coverage path planning for multiple unmanned aerial vehicles in maritime search and rescue operations. Comput. Ind. Eng. 2021, 161, 107612. [Google Scholar] [CrossRef]
  4. Duberg, D.; Jensfelt, P. Ufoexplorer: Fast and scalable sampling-based exploration with a graph-based planning structure. IEEE Robot. Autom. Lett. 2022, 7, 2487–2494. [Google Scholar] [CrossRef]
  5. Bircher, A.; Kamel, M.; Alexis, K.; Oleynikova, H.; Siegwart, R. Receding horizon “next-best-view” planner for 3d exploration. In Proceedings of the 2016 IEEE International Conference on Robotics and Automation (ICRA), Stockholm, Sweden, 16–21 May 2016; pp. 1462–1468. [Google Scholar]
  6. Dharmadhikari, M.; Dang, T.; Solanka, L.; Loje, J.; Nguyen, H.; Khedekar, N.; Alexis, K. Motion primitives-based path planning for fast and agile exploration using aerial robots. In Proceedings of the 2020 IEEE International Conference on Robotics and Automation (ICRA), Paris, France, 31 May–31 August 2020; pp. 179–185. [Google Scholar]
  7. Zhou, B.; Zhang, Y.; Chen, X.; Shen, S. Fuel: Fast uav exploration using incremental frontier structure and hierarchical planning. IEEE Robot. Autom. Lett. 2021, 6, 779–786. [Google Scholar] [CrossRef]
  8. Zhao, Y.; Yan, L.; Xie, H.; Dai, J.; Wei, P. Autonomous Exploration Method for Fast Unknown Environment Mapping by Using UAV Equipped with Limited FOV Sensor. IEEE Trans. Ind. Electron. 2023, 71, 4933–4943. [Google Scholar] [CrossRef]
  9. Tao, Y.; Wu, Y.; Li, B.; Cladera, F.; Zhou, A.; Thakur, D.; Kumar, V. Seer: Safe efficient exploration for aerial robots using learning to predict information gain. In Proceedings of the 2023 IEEE International Conference on Robotics and Automation (ICRA), London, UK, 29 May–2 June 2023; pp. 1235–1241. [Google Scholar]
  10. Umari, H.; Mukhopadhyay, S. Autonomous robotic exploration based on multiple rapidly-exploring randomized trees. In Proceedings of the 2017 IEEE/RSJ International Conference on Intelligent Robots and Systems (IROS), Vancouver, BC, Canada, 24–28 September 2017; pp. 1396–1402. [Google Scholar]
  11. Zhu, H.; Cao, C.; Xia, Y.; Scherer, S.; Zhang, J.; Wang, W. DSVP: Dual-stage viewpoint planner for rapid exploration by dynamic expansion. In Proceedings of the 2021 IEEE/RSJ International Conference on Intelligent Robots and Systems (IROS), Kyoto, Japan, 23–27 October 2021; pp. 7623–7630. [Google Scholar]
  12. Xu, Z.; Deng, D.; Shimada, K. Autonomous UAV exploration of dynamic environments via incremental sampling and probabilistic roadmap. IEEE Robot. Autom. Lett. 2021, 6, 2729–2736. [Google Scholar] [CrossRef]
  13. Xu, Z.; Suzuki, C.; Zhan, X.; Shimada, K. Heuristic-based Incremental Probabilistic Roadmap for Efficient UAV Exploration in Dynamic Environments. arXiv 2023, arXiv:2309.09121. [Google Scholar]
  14. Yamauchi, B. A frontier-based approach for autonomous exploration. In Proceedings of the 1997 IEEE International Symposium on Computational Intelligence in Robotics and Automation CIRA’97: Towards New Computational Principles for Robotics and Automation, Monterey, CA, USA, 10–11 July 1997; pp. 146–151. [Google Scholar]
  15. Kulich, M.; Faigl, J.; Přeučil, L. On distance utility in the exploration task. In Proceedings of the 2011 IEEE International Conference on Robotics and Automation, Shanghai, China, 9–13 May 2011; pp. 4455–4460. [Google Scholar]
  16. Kamalova, A.; Kim, K.D.; Lee, S.G. Waypoint mobile robot exploration based on biologically inspired algorithms. IEEE Access 2020, 8, 190342–190355. [Google Scholar] [CrossRef]
  17. Yu, J.; Shen, H.; Xu, J.; Zhang, T. ECHO: An Efficient Heuristic Viewpoint Determination Method on Frontier-based Autonomous Exploration for Quadrotors. IEEE Robot. Autom. Lett. 2023, 8, 5047–5054. [Google Scholar] [CrossRef]
  18. Amanatides, J.; Woo, A. A fast voxel traversal algorithm for ray tracing. Eurographics 1978, 87, 3–10. [Google Scholar]
  19. Helsgaun, K. An effective implementation of the Lin–Kernighan traveling salesman heuristic. Eur. J. Oper. Res. 2000, 126, 106–130. [Google Scholar] [CrossRef]
  20. Zhao, Y.; Yan, L.; Chen, Y.; Dai, J.; Liu, Y. Robust and efficient trajectory replanning based on guiding path for quadrotor fast autonomous flight. Remote Sens. 2021, 13, 972. [Google Scholar] [CrossRef]
  21. Faessler, M.; Franchi, A.; Scaramuzza, D. Differential flatness of quadrotor dynamics subject to rotor drag for accurate tracking of high-speed trajectories. IEEE Robot. Autom. Lett. 2017, 3, 620–626. [Google Scholar] [CrossRef]
  22. Han, L.; Gao, F.; Zhou, B.; Shen, S. Fiesta: Fast incremental euclidean distance fields for online motion planning of aerial robots. In Proceedings of the 2019 IEEE/RSJ International Conference on Intelligent Robots and Systems (IROS), Macau, China, 3–8 November 2019; pp. 4423–4430. [Google Scholar]
  23. Hornung, A.; Wurm, K.M.; Bennewitz, M.; Stachniss, C.; Burgard, W. OctoMap: An efficient probabilistic 3D mapping framework based on octrees. Auton. Robot. 2013, 34, 189–206. [Google Scholar] [CrossRef]
  24. LDRobot. Available online: https://www.ldrobot.com/ProductDetails?sensor_name=STL-19P (accessed on 1 January 2020).
  25. Shi, D.; Dai, X.; Zhang, X.; Quan, Q. A practical performance evaluation method for electric multicopters. IEEE/ASME Trans. Mechatron. 2017, 22, 1337–1348. [Google Scholar] [CrossRef]
Figure 1. Special frontier clusters are frequently missed as they do not pay attention to environmental contour information, which can cause back-and-forth movements in the future. Subgraph (a) is the map to be explored. Subgraph (b) is the map built using the state-of-the-art method [8] during the exploration process in the simulation. Subgraph (c) is an abstracted map of (b) that enables a better understanding.
Drones 08 00128 g001
Figure 2. Proposed system architecture.
Drones 08 00128 g002
Figure 3. Details of the construction process of M l o w . Part A shows the process of generating M l o w , and part B demonstrates the quality of M l o w generated under different conditions. In part B, black represents occupied cells and gray represents known free cells.
Drones 08 00128 g003
Figure 4. Construction of the hybrid map. (top) 2D maps generated using V h i g h (left) and V l o w (right). (bottom) hybrid map generated using multi-sensor data.
Drones 08 00128 g004
Figure 5. Computing LiDAR information gain based on hybrid map.
Drones 08 00128 g005
Figure 6. Combining connected region and average position expansion to detect isolated frontier clusters.
Drones 08 00128 g006
Figure 7. Direct path planning to the target yaw is ineffective at avoiding obstacles in the movement direction. Subgraph (a) is the map to be explored. Subgraph (b) is the map built during the exploration process in the simulation. Subgraph (c) is an abstracted map of (b) that enables a better understanding.
Drones 08 00128 g007
Figure 8. Experimental results in different scenarios. (ac) correspond to the Indoor1, Indoor2 and forest scenarios, respectively (the red, purple and yellow trajectories in the figure correspond to OURS, FUEL and FAEP, respectively). (df) illustrate the coverage performance in the three different scenarios. (gi), respectively, show the specific distribution of flight time and flight distance of the three methods in the different scenarios (presented in Table 3). Videos of the experiments can be found at https://youtu.be/_a1Vl518Ra8 (accessed on 3 March 2024), and the code and other supplementary materials are available at https://github.com/Poaos/LAEA (accessed on 3 March 2024).
Drones 08 00128 g008
Figure 9. A simple maze is used to clearly illustrate the contribution of the proposed algorithm. The yellow and red trajectories in (d) are the actual exploration trajectories of FAEP and OURS, respectively. The red dashed circles represent critical areas that contribute to efficiency differences. The dashed-line bounding box indicates the isolated frontier cluster during exploration, and the solid line indicates the small frontier cluster. The special frontier clusters omitted by FAEP are marked in purple in (ac), and those detected by OURS are indicated in black in (eg).
Drones 08 00128 g009
Figure 10. Coverage curves of different algorithms over time.
Drones 08 00128 g010
Figure 11. The UAV experimental platform used in the experimental study.
Drones 08 00128 g011
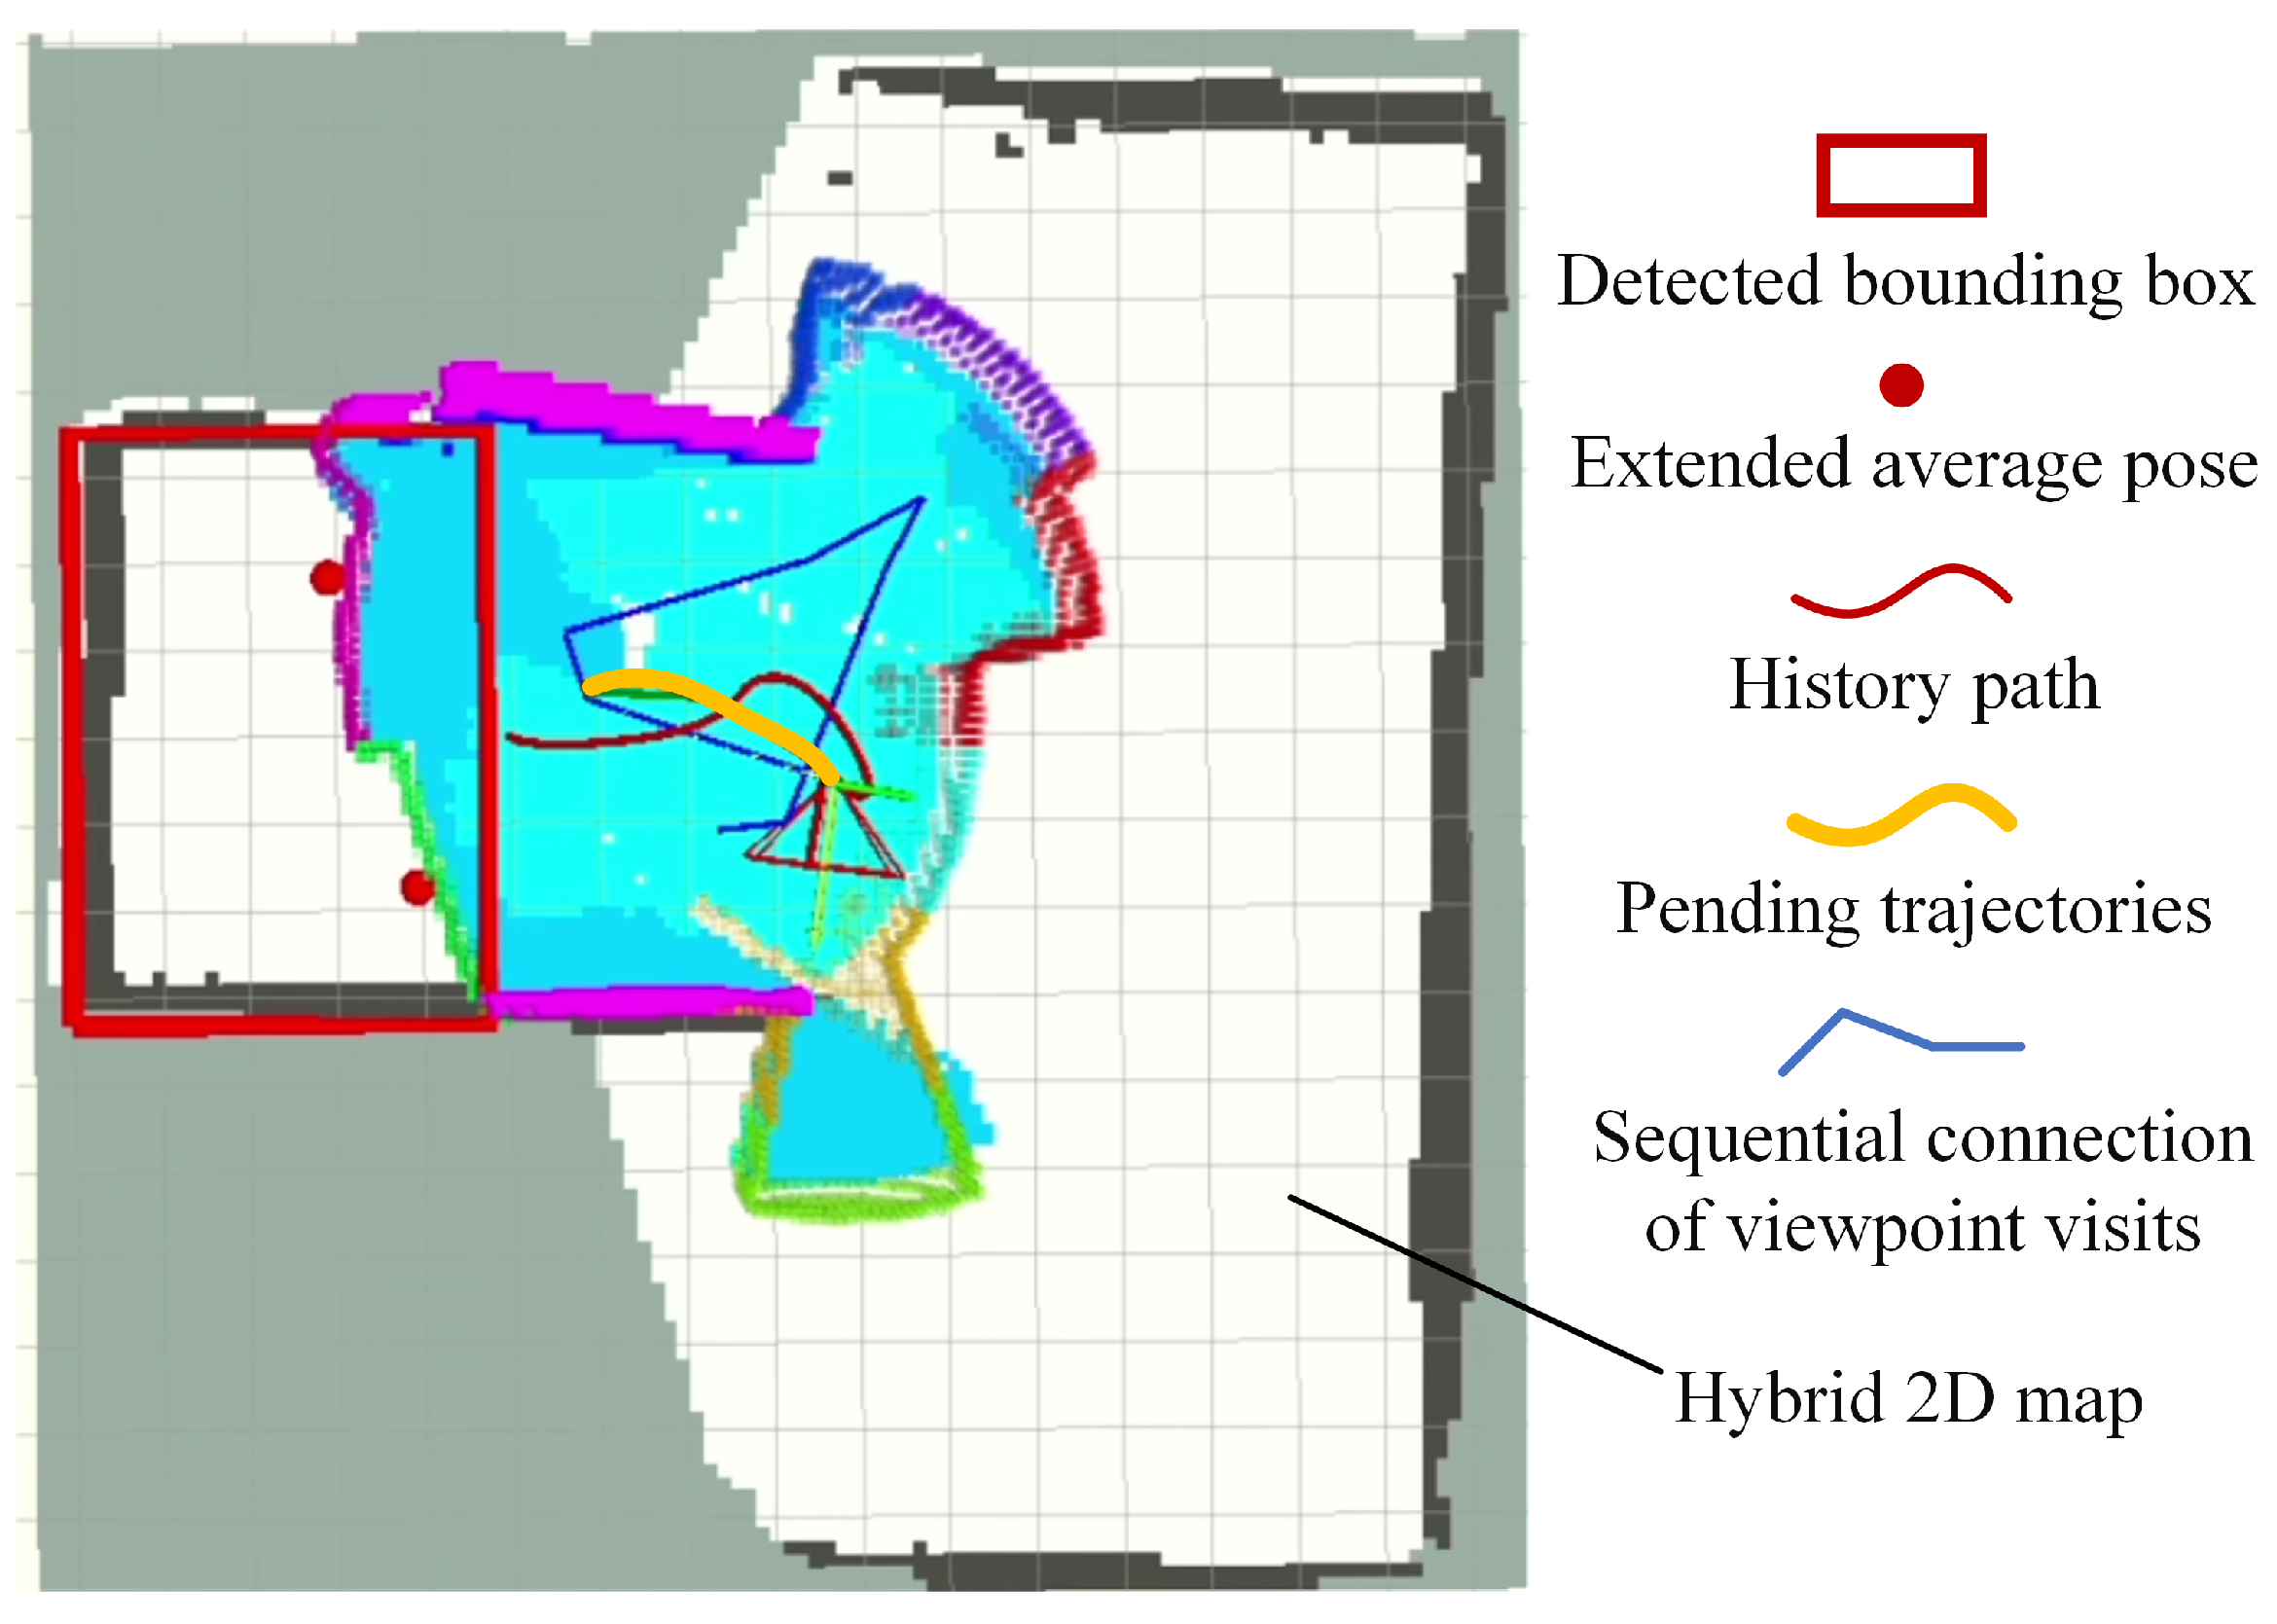
Figure 12. The results of real-world experiments in two different environments. (a,d), (b,e) and (c,f) represent schematic diagrams of the experimental scenarios, graphs of the exploration trajectories and coverage curves during exploration, respectively. And the definition of colours in (b,e) can be found in Figure 7.
Drones 08 00128 g012
Figure 13. The local hybrid maps obtained during exploration, corresponding to Figure 12b. And the definition of colours can be found in Figure 4 and Figure 6.
Drones 08 00128 g013
Table 1. The content of extra frontier cluster information obtained in real time.
DataExplanation
G l i d a r The extra information gain observed using LiDAR (m)
p e x t e n d Extension of average position of cluster by G l i d a r
A s m a l l Cluster with low G l i d a r
A i s o l a t e d Another cluster tends to cause back-and-forth motion
Table 2. The parameters used for the simulation.
Camera FOV[80,60] degCamera range4.5 m
LiDAR FOV360 degLiDAR range12 m
Max velocity1.0 m/sMax accelerate1.0 m/s2
Max yaw rate1.0 rad/sROS versionMelodic
Hardware configurationIntel Core [email protected] GHz, 16 GB memory
Table 3. Exploration statistics for the three different environments. Bold indicates the best experimental data for the same scenario.
SceneMethodExploration Times (s)Flight Distance (m)
AvgStdMinAvgStdMin
Indoor1FUEL [7]255.07.0245.8248.510.4235.3
FAEP [8]218.25.0209.3234.04.4227.3
OURS193.85.1179.9211.15.1200.9
O U R S E I G 206.74.5199.4232.25.6224.6
O U R S L i D A R 204.67.1189.9228.95.1218.2
Indoor2FUEL [7]280.17.1265.0279.67.5266.8
FAEP [8]257.911.0236.7274.014.6242.6
OURS200.75.6192.4219.45.0211.9
ForestFUEL [7]282.36.3268.1276.45.7264.2
FAEP [8]262.110.7244.9262.112.0243.9
OURS227.65.3221.2231.75.8224.3
Disclaimer/Publisher’s Note: The statements, opinions and data contained in all publications are solely those of the individual author(s) and contributor(s) and not of MDPI and/or the editor(s). MDPI and/or the editor(s) disclaim responsibility for any injury to people or property resulting from any ideas, methods, instructions or products referred to in the content.