Review

Review of Wind Flow Modelling in Urban Environments to Support the Development of Urban Air Mobility

by
D S Nithya
1,2,*,
Giuseppe Quaranta
1,
Vincenzo Muscarello
2 and
Man Liang
2
1
Department of Aerospace Science and Technology, Politecnico di Milano, 20156 Milan, Italy
2
Department of Aerospace Engineering, RMIT University, Melbourne, VIC 3082, Australia
*
Author to whom correspondence should be addressed.
Drones 2024, 8(4), 147; https://doi.org/10.3390/drones8040147
Submission received: 8 February 2024 / Revised: 28 March 2024 / Accepted: 4 April 2024 / Published: 9 April 2024
(This article belongs to the Section Innovative Urban Mobility)

Abstract

:
Urban air mobility (UAM) is a transformative mode of air transportation system technology that is targeted to carry passengers and goods in and around urban areas using electric vertical take-off and landing (eVTOL) aircraft. UAM operations are intended to be conducted in low altitudes where microscale turbulent wind flow conditions are prevalent. This introduces flight testing, certification, and operational complexities. To tackle these issues, the UAM industry, aviation authorities, and research communities across the world have provided prescriptive ways, such as the implementation of dynamic weather corridors for safe operation, classification of atmospheric disturbance levels for certification, etc., within the proposed concepts of operation (ConOps), certification standards, and guidelines. However, a notable hindrance to the efficacy of these solutions lies in the scarcity of operational UAM and observational wind data in urban environments. One way to address this deficiency in data is via microscale wind modelling, which has been long established in the context of studying atmospheric dynamics, weather forecasting, turbine blade load estimation, etc. Thus, this paper aims to provide a critical literature review of a variety of wind flow estimation and forecasting techniques that can be and have been utilized by the UAM community. Furthermore, a compare-and-contrast study of the commonly used wind flow models employed within the wind engineering and atmospheric science domain is furnished along with an overview of the urban wind flow conditions.

1. Introduction

According to the European Union Aviation Safety Agency (EASA), “urban air mobility (UAM) is a new air transportation system for passengers and cargo in and around densely populated and built-up environments, made possible by vertical take-off and landing electric aircraft (eVTOL) equipped with new technologies, such as enhanced battery technologies and electric propulsion. These aircraft will have a pilot on board or be remotely piloted” [1]. The same definition for UAM is read slightly differently by the Federal Aviation Administration (FAA) and National Aeronautics and Space Administration (NASA), as follows: “UAM enables highly automated, cooperative, passenger or cargo-carrying air transportation services in and around urban areas” [2]. It can be noted that, unlike the EASA, the FAA and NASA are not specific about the aircraft type and include terms like highly automated within their definition. Thus, to set the scope and avoid confusion, the term UAM in this article refers to the air transportation system that can carry passengers and goods in and around urban cities through low-altitude operations, where the presence of obstructions (buildings, towers, etc.) cause frictional effects and force wind flow to lose its momentum, ultimately generating turbulence and microscale weather conditions. The terms UAM aircraft, UAM vehicles, and eVTOLs in this paper refer to small uncrewed aerial vehicle systems (sUAS) and light passenger-carrying electrically powered aircraft, which can take off and land vertically with a maximum takeoff weight of less than 3175 kg as per [3]. The term air transportation system signifies UAM aircraft systems; vertiports [4], and UAM traffic management systems. Similarly, weather in general comprises conditions such as wind, rain, fog, snow, storm, hail, etc. However, this paper refers only to the wind as weather. This is because, in a way, wind flow is the cause of precipitation and other large-scale weather conditions like storms, etc.
Unlike traditional rotorcraft and aircraft, UAM vehicles come in multiple different sizes, have an unconventional design configuration, are lighter in weight, have increased automation for command and control, are propelled by distributed electric propulsion units, etc. [5]. These UAM characteristics coupled with the microscale winds in urban environments introduce significantly more operational safety risks such as trajectory deviation, loss of or difficulty in control, rapid deterioration of battery charge [6], increased operational delays [7], decreased passenger comfort, and other uncertain ground and flight risks that are currently unknown to the aviation sector. This rise in safety challenges due to the inevitable microwind conditions in the urban environment increases flight testing complexity and extends the duration of the aircraft certification process. Ultimately, this may lead to possible financial loss for investors and UAM manufacturers, which might potentially halt or altogether prevent the emergence of UAM. Weather would be the most constant naturally occurring phenomenon that would confront UAM. This fact is also emphasized in [8], where the weather is identified as both a near- and far-term technological and nontechnological challenge among several aspects that were analyzed as a hindrance to the realization of UAM. Thus, to improve the safety and simplify the integration of UAM operations and vehicles in the urban airspace, aviation authorities, UAM manufacturers, and research communities across the world have put forth several Concepts of Operations (ConOps), certification standards, risk assessment methods, flight testing guidelines, etc., that attempt to address ways to prescriptively tackle the microwind-pertinent challenges.
The existing UAM ConOps [2,9,10,11,12,13] suggest the integration of real-time microwind data provided by a centralized or an external weather data service supplier to develop dynamic 4D geofences or corridors and weather-aware decision support systems such as weather alerts and warnings, etc., within the UAM traffic or operations management system. Similarly, within the UAM vehicle airworthiness certification domain, the EASA has introduced the Modified Handling Qualities Rating Method (MHQRM) in the Means of Compliance for Special Condition Vertical Take-off and Landing (MOC SC-VTOL) aircraft standards document [14]. MHQRM is used to assess certain special condition vertical take-off and landing (SC-VTOL) aircraft [3] airworthiness standard requirements that need the determination of handling qualities. Within this document, atmospheric disturbance (AD) is classified into light, moderate, and severe. However, the definitions of the moderate and severe disturbance levels are not explicit, and nor is their corresponding probability of occurrence (see Table 1). Moreover, the certification authority has left it to the applicant or UAM manufacturer to provide and demonstrate a credible approach to characterize the different disturbance levels for their UAM aircraft, as the effects of microscale winds would vary with the aircraft configuration, flight phase, and flight envelope. For instance, the takeoff, transition, landing, and final approach phases would be more crucial due to their closer proximity to the building structures and reduced airspeed operation. Similarly, a sUAS system would be more susceptible to wind conditions in the urban environment than a UAM aircraft that is meant to carry passengers. Certification of an autonomous UAM aircraft may have to assess the time taken by the controllers to respond to wind disturbance and so forth.
While these strategic plans are viable for enhancing the robustness of UAM aircraft and operational safety, they lack comprehensiveness due to the absence of microscale wind data and operational UAM flight test data [14]. One way to overcome this microwind data deficiency for UAM applications is through wind flow modelling. The literature on the microscale wind flow conditions in the urban environment and wind modelling are long established; however, these studies are aimed at the dynamics of the atmosphere or aerodynamic loads on turbine and propeller blades, pedestrian comfort, etc., and so are not always appropriate in the context of UAM. Therefore, as a first step in the venture to close the gap caused by the insufficiency in urban wind data for UAM development, a comprehensive literature review was performed to identify the wind modelling and forecasting techniques that have been exercised in the UAM community from 2011 (this cutoff is based on the reemergence of on-demand UAM services in 2010 [15]) to 2023 with the help of Scopus Search API [16] and web scraping. Web scraping is a process used to extract data from a website. For the present work, two Python libraries (requests and bs4 or Beautiful Soup 4) were used to extract the underlying HTML data from Google Scholar web page search results for the listed keywords. The HTML data were then parsed and reformatted into a .csv file for further analysis. A total of 42 out of 186 publications were found that specifically discussed urban wind modelling techniques and their effects on the realization of UAM for the following keywords: drones + wind, drones + turbulence, Urban Air Mobility + Urban weather, Urban Air Mobility + wind, Urban Air Mobility + Turbulence, Wind modelling UAM, and Wind modelling aviation.
Figure 1 provides an overview of the number of published papers found for each year. It can be noted that the publication pattern has seen an increase since 2019, indicating the rapid growth of the UAM sector and, subsequently, the increasing concerns about urban weather effects on the progress of UAM.
This paper is divided into five main sections. Section 2 is aimed at providing an understanding of the wind flow characteristics in urban environments. Section 3 includes a brief review of the commonly used wind models within the wind engineering and atmospheric science domain. Then, in Section 4, a compare-and-contrast study is performed in light of the UAM requisite for fast and accurate weather forecasts to determine UAM operational guidelines and certification standards. Section 5 aims to lay out the critical review of the 42 identified papers. Furthermore, in the concluding Section 6, a summary of the identified gaps is furnished along with some suggestions.

2. Wind Flow in Urban Environments

The fundamental conception of UAM technology is the execution of flight operations in and around urban landscapes. This means UAM aircraft will operate closer to the ground (compared to conventional rotorcraft and fixed-wing aircraft) and likely take off/land on vertiports, which are meant to be emplaced at ground levels, on elevated structures, or on building rooftops [4,17]. Hence, it is of utmost importance to be cognizant of the weather and wind flow around buildings in an urban environment for the safe realization of UAM. This section is dedicated to laying out the basic concepts of wind flow, boundary layers, and turbulence.

2.1. Wind Flow

In general, wind flow is caused by the movement of air particles in the atmosphere due to differences in pressure distribution coupled with the diurnal temperature variations, seasonal effects, and Coriolis force exerted by the rotation of Earth. Thus, the characteristics and direction of wind flow can be estimated by simply observing the pressure and temperature distribution of air particles in an area. However, this may be valid only for forecasting wind flow in higher altitudes and not be so accurate for lower altitudes. Factors like surface roughness and topography of an area, which dictate the amount of frictional force and shear stress exerted on the moving air particles, also significantly influence the wind flow conditions within the low-altitude atmosphere.

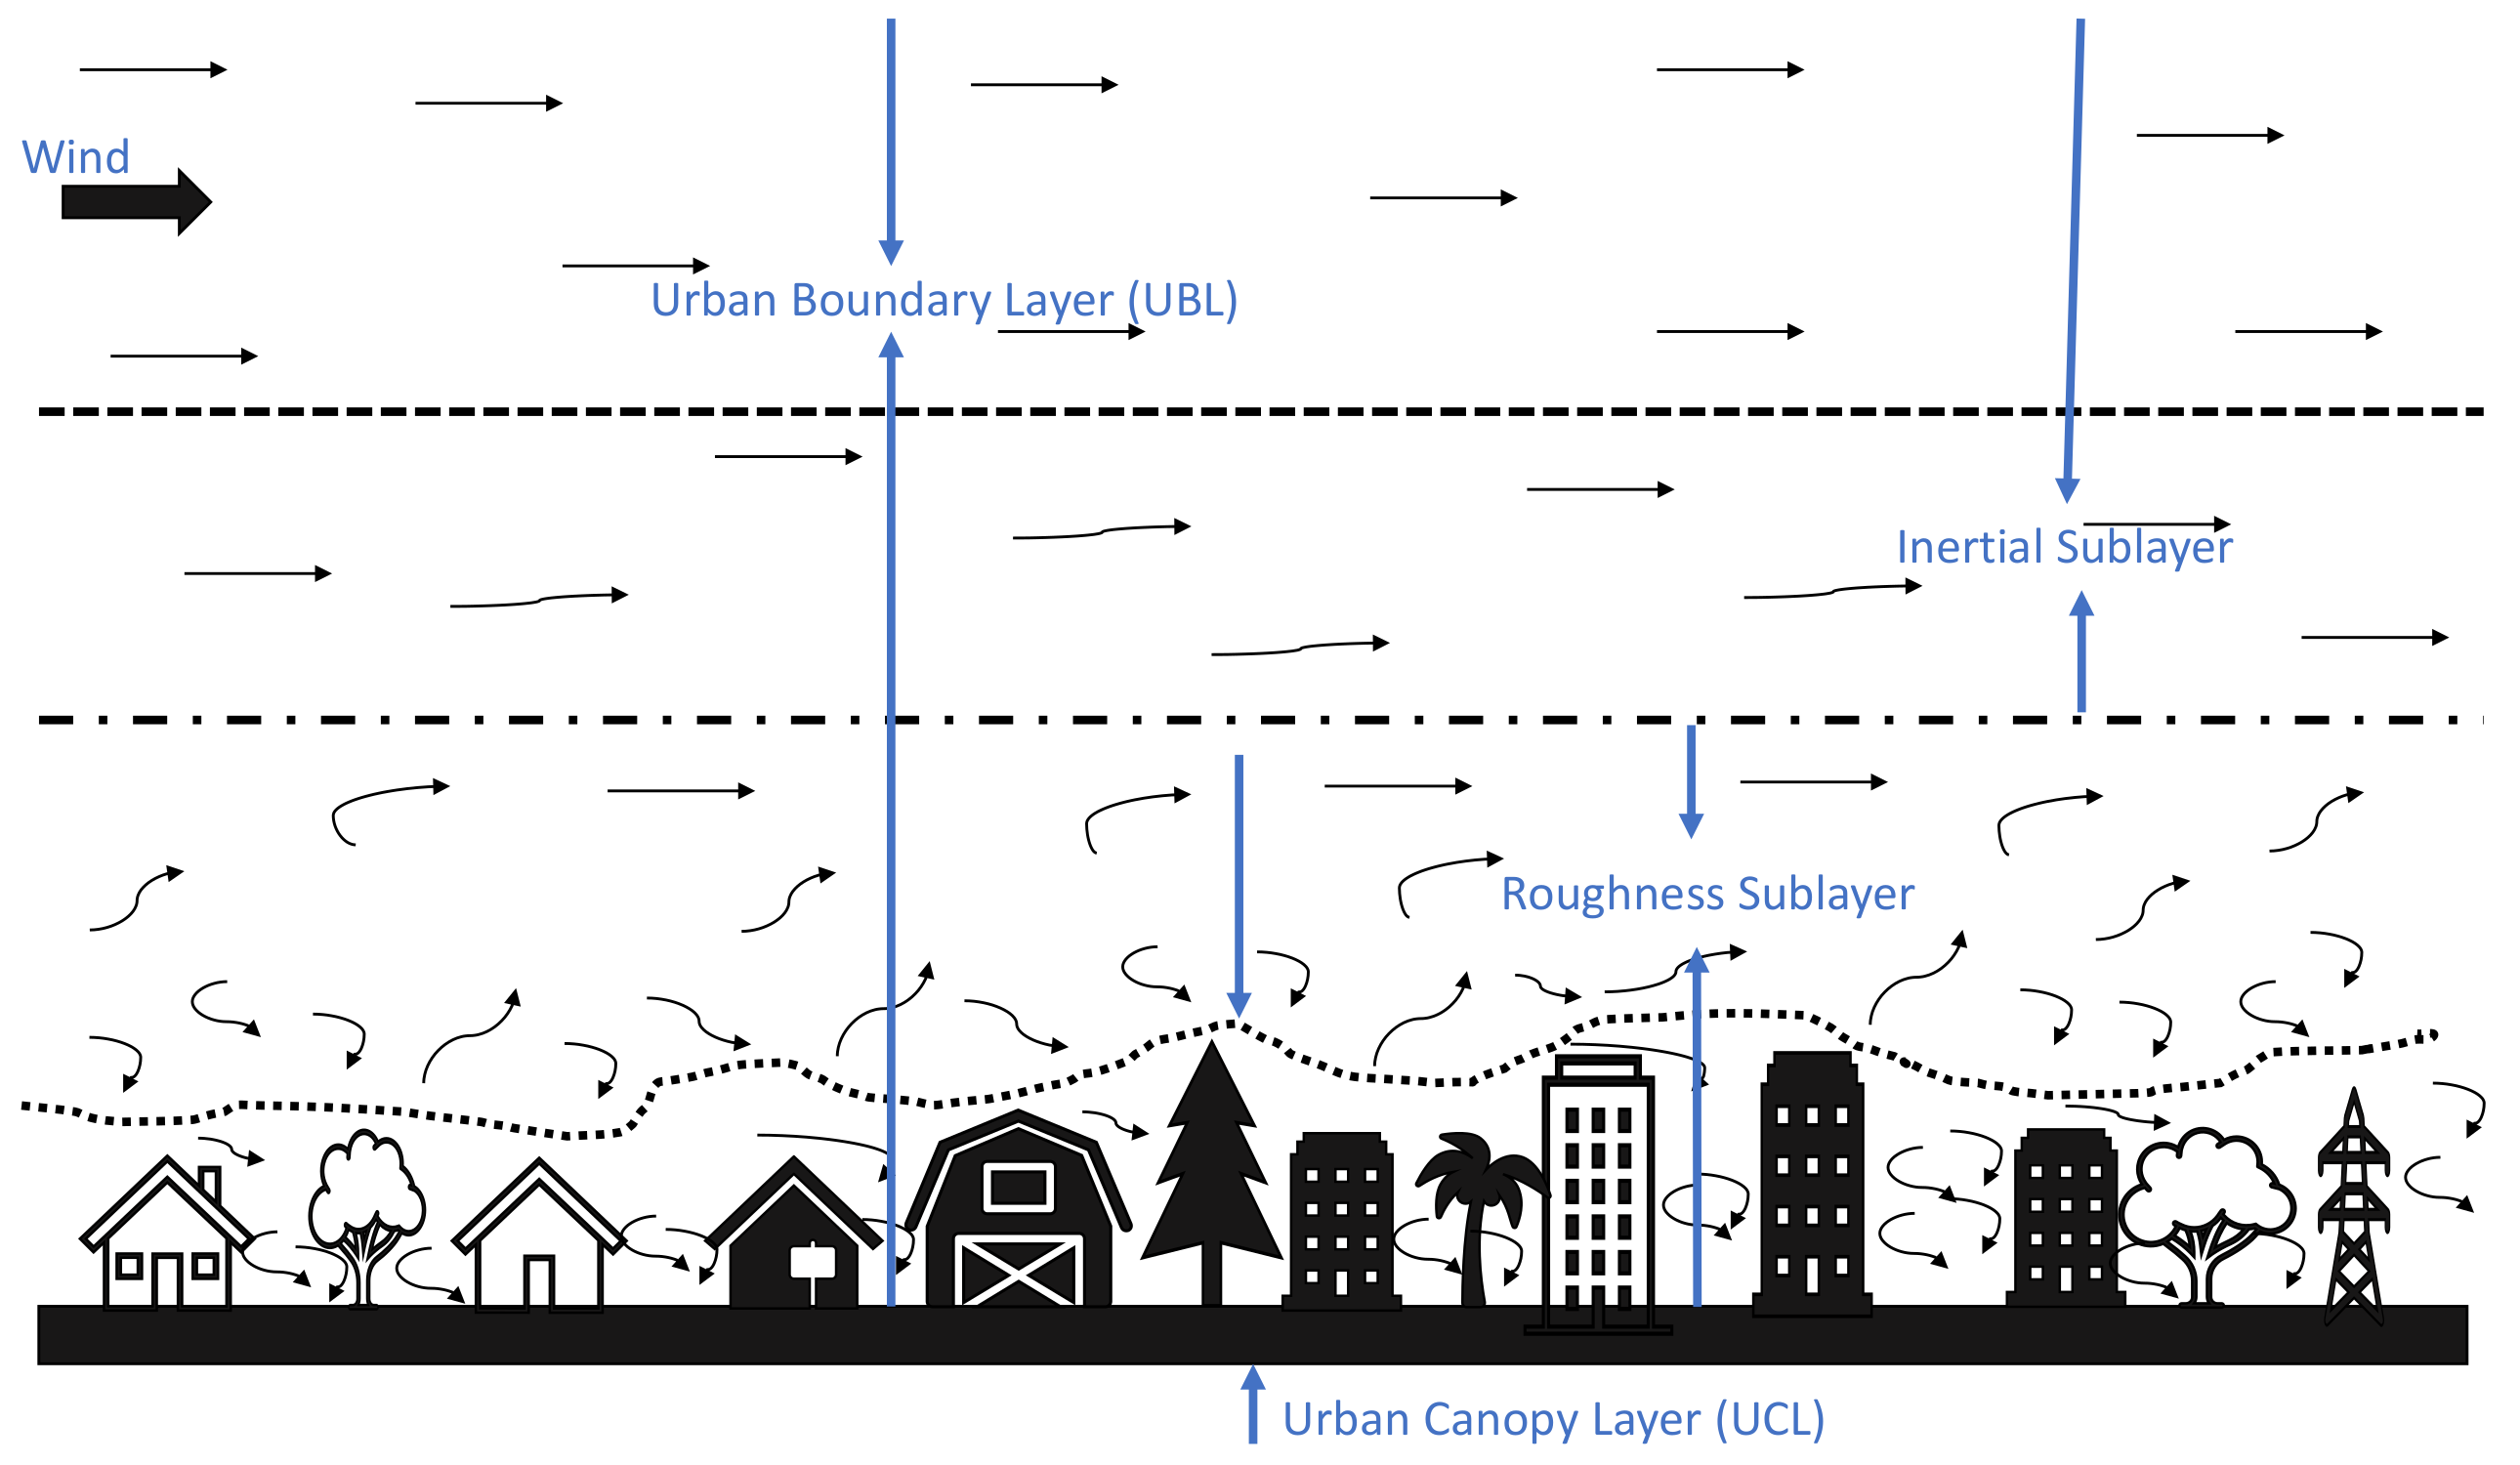
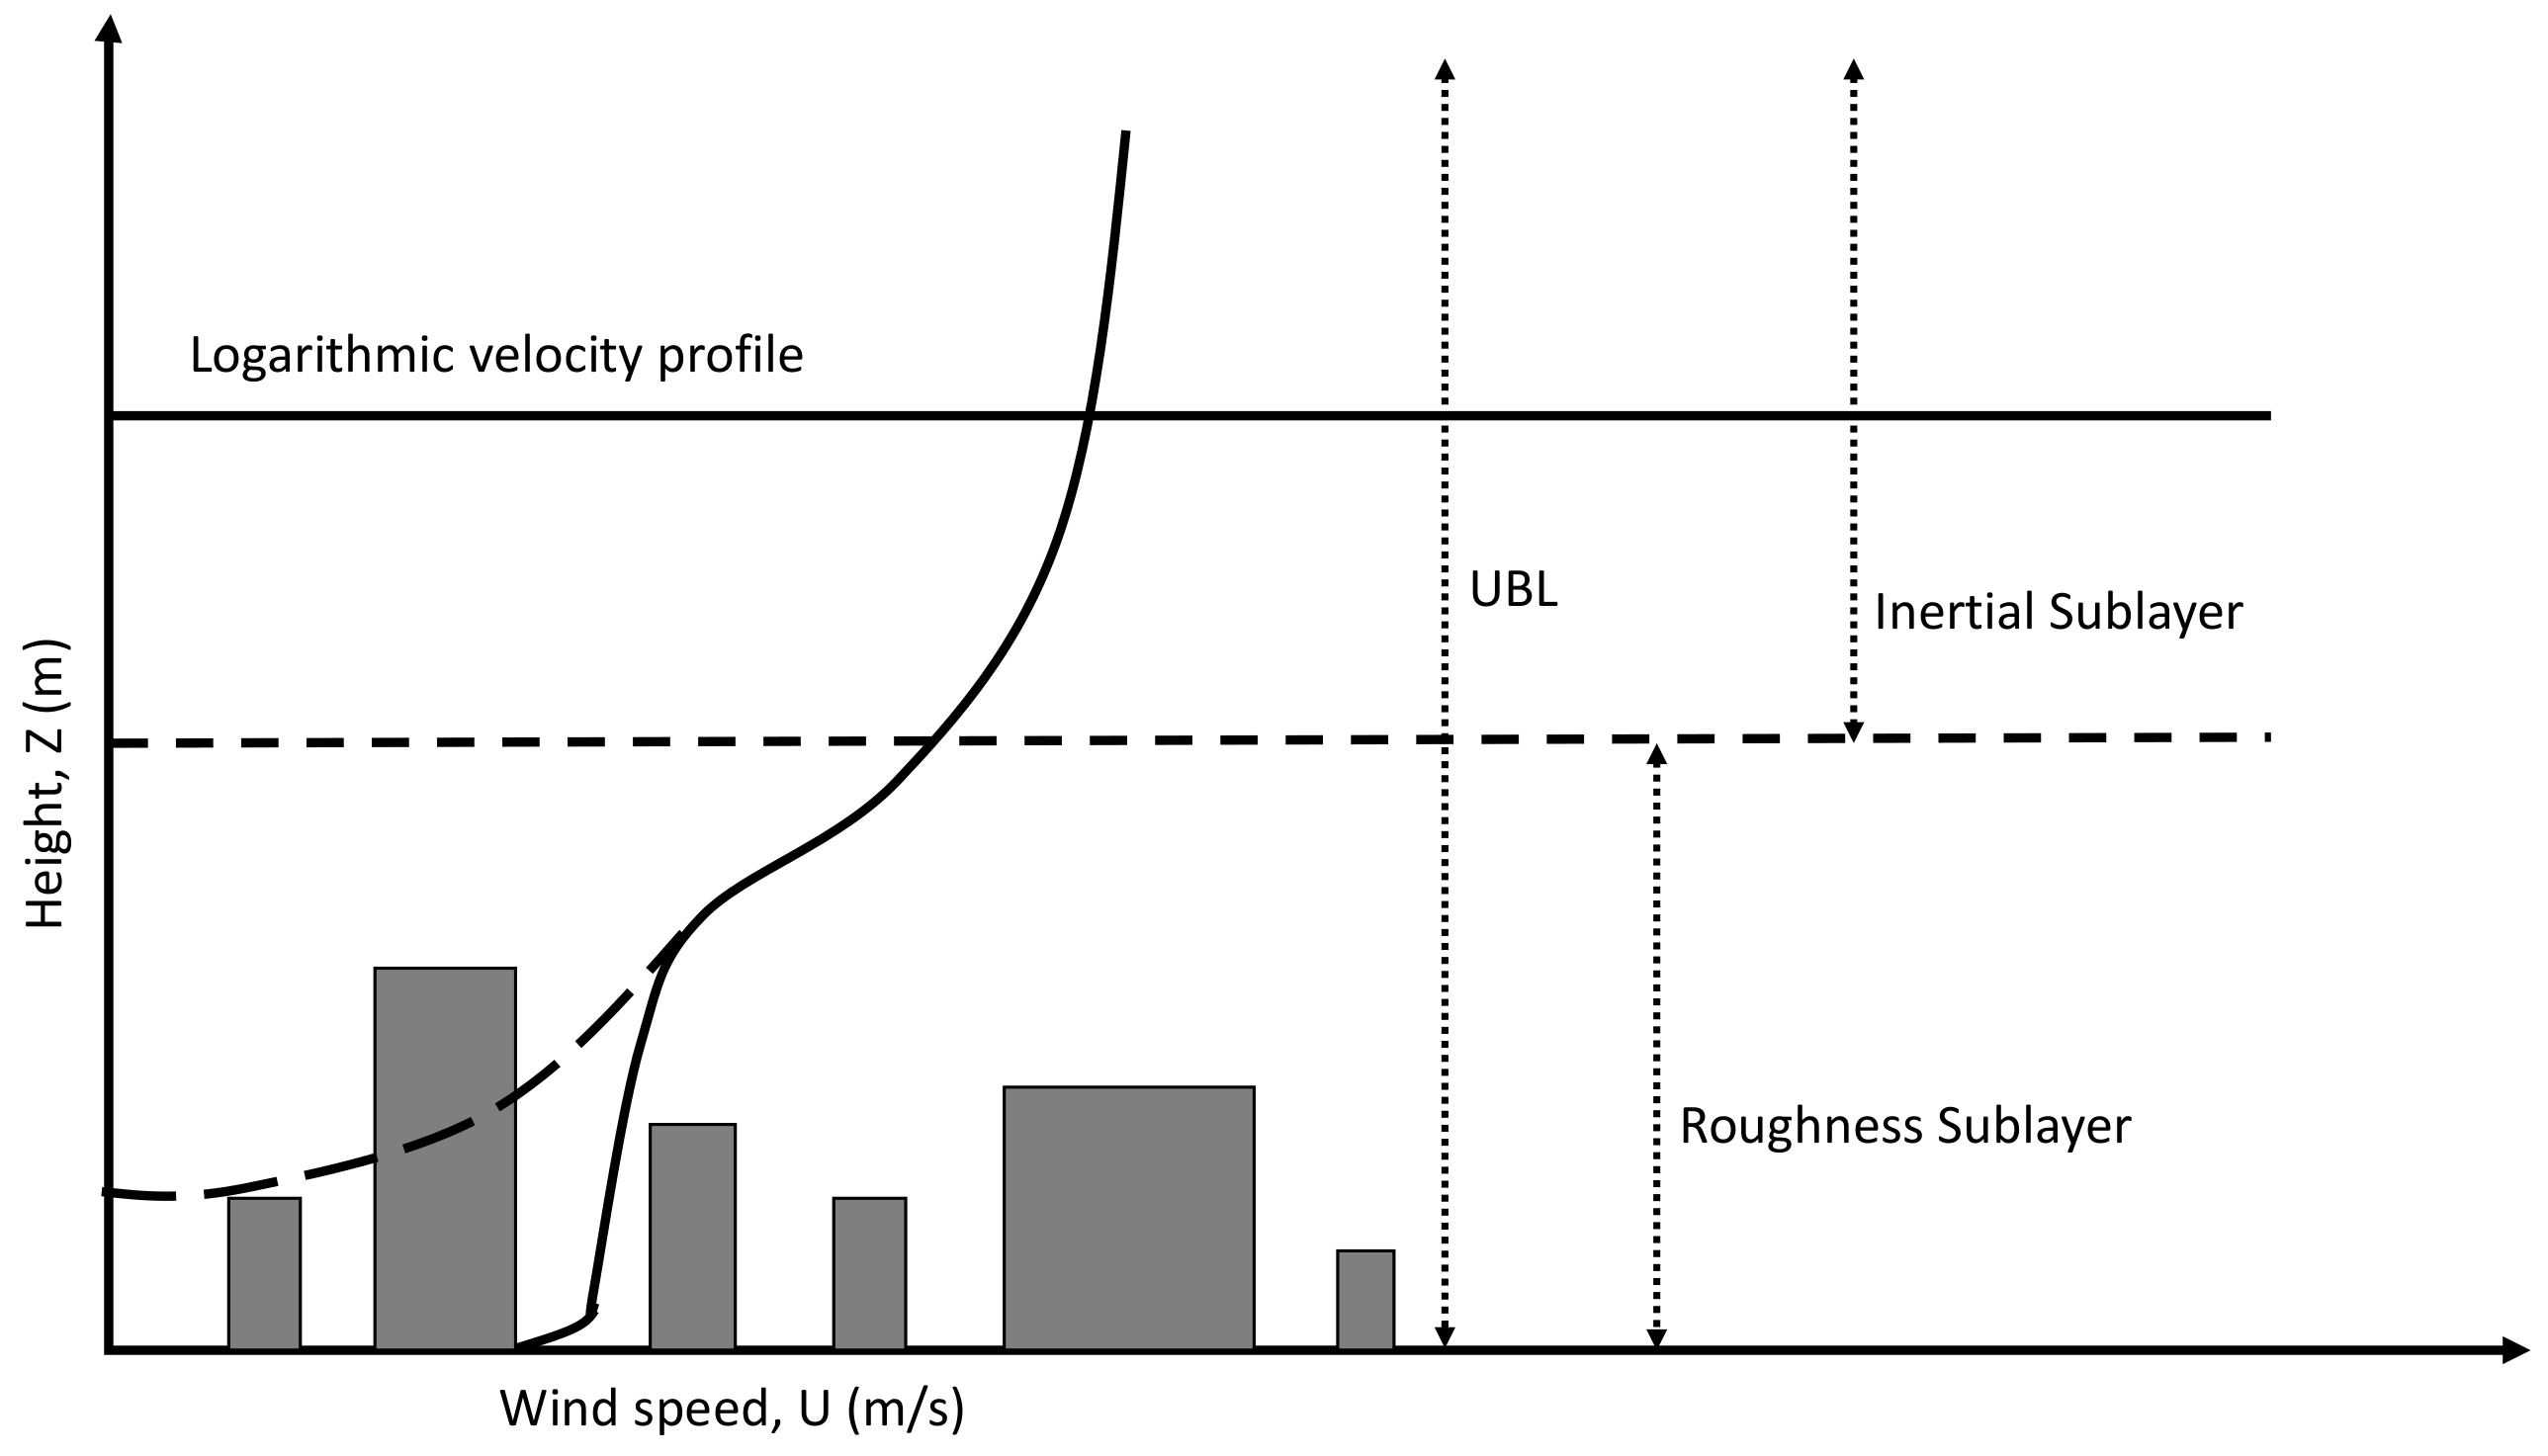
2.2. Boundary Layers and Atmospheric Turbulence in Urban Environments

A typical urban environment boasts buildings, towers, poles, trees, etc., of all shapes and sizes along with constant dynamic factors such as vehicle and human movements. These built structures and dynamic features are considered obstacles to the wind flow in the urban environment, which increases the surface roughness and the complexity of the terrain. Hence, when the wind flows over the surface of an urban landscape, a boundary layer is formed, namely, the urban boundary layer (UBL), also known as the atmospheric boundary layer (ABL) or planetary boundary layer (PBL) for contexts not specific to the urban environment. The UBL is the lowest part of Earth’s atmosphere and typically extends from the surface of Earth to a distance where the wind is no longer influenced by surface roughness. The region within the UBL is further divided into three major sublayers [18], as depicted in Figure 2, to better understand and distinguish the wind flow nature and corresponding velocity profiles.
In the urban canopy layer (UCL), wind flow conditions are affected by the immediate surroundings, and the expanse of the UCL is up to the roof of the tallest building in an urban setting, whereas the roughness sublayer stretches a few meters beyond the UCL, and the wind flow conditions within this layer could be best described as “still adapting to the obstacles”. The region beyond the roughness sublayer to the top of the UBL is where the wind flow conditions have fully adapted to the surface beneath, and it is called the inertial sublayer. There are no quantitative definitions for the boundaries of these sublayers; however, as depicted in Figure 3, wind flow velocity is always minimal on or near the surface of the ground due to surface roughness compared to the flow velocity at the top of the UBL, where wind speed is often equivalent to the geostrophic wind speed [19]. Furthermore, flow within the UBL region is often turbulent [20] due to flow distortions, surface temperature variations, etc. Therefore, to precisely predict or estimate the wind flow characteristics, it is essential to understand atmospheric turbulence.
Atmospheric turbulence is inhomogeneous, anisotropic, three-dimensional, nonuniform, and shaped by vortexes of diverse length and temporal scales, i.e., Taylor microscale, integral and Kolmogorov length, velocity, and time scale [22]. Eddies or vortexes of integral length and time scale are responsible for the transport of momentum and energy and are restricted by the flow boundaries, while the smaller eddies, identified by the Kolmogorov length and temporal scale, are dominated by the dissipation rate and viscosity. In aviation, especially within UAM, both large- and small-scale turbulence affect the dynamic behavior, structural integrity, and safety of aircraft [23].
As per aviation meteorologists, there are four main causes of turbulence [24]:
  • Topography, uneven surface, and human-made obstacles (mechanical turbulence),
  • Uneven ground surface temperatures that are typically caused in the summer (thermal or convective turbulence),
  • Friction between the warm and cold front (frontal turbulence),
  • Wind shear.
While there are no definitions for turbulence, it can be described by observing the wind flow properties such as the 3D wind velocity, its corresponding fluctuation components, and fluctuation variance [25]. Similarly, a flow could be identified as turbulent if the dimensionless Reynolds number is greater than 2000 and relative Rayleigh’s number is greater than or equal to 65.4 [25].

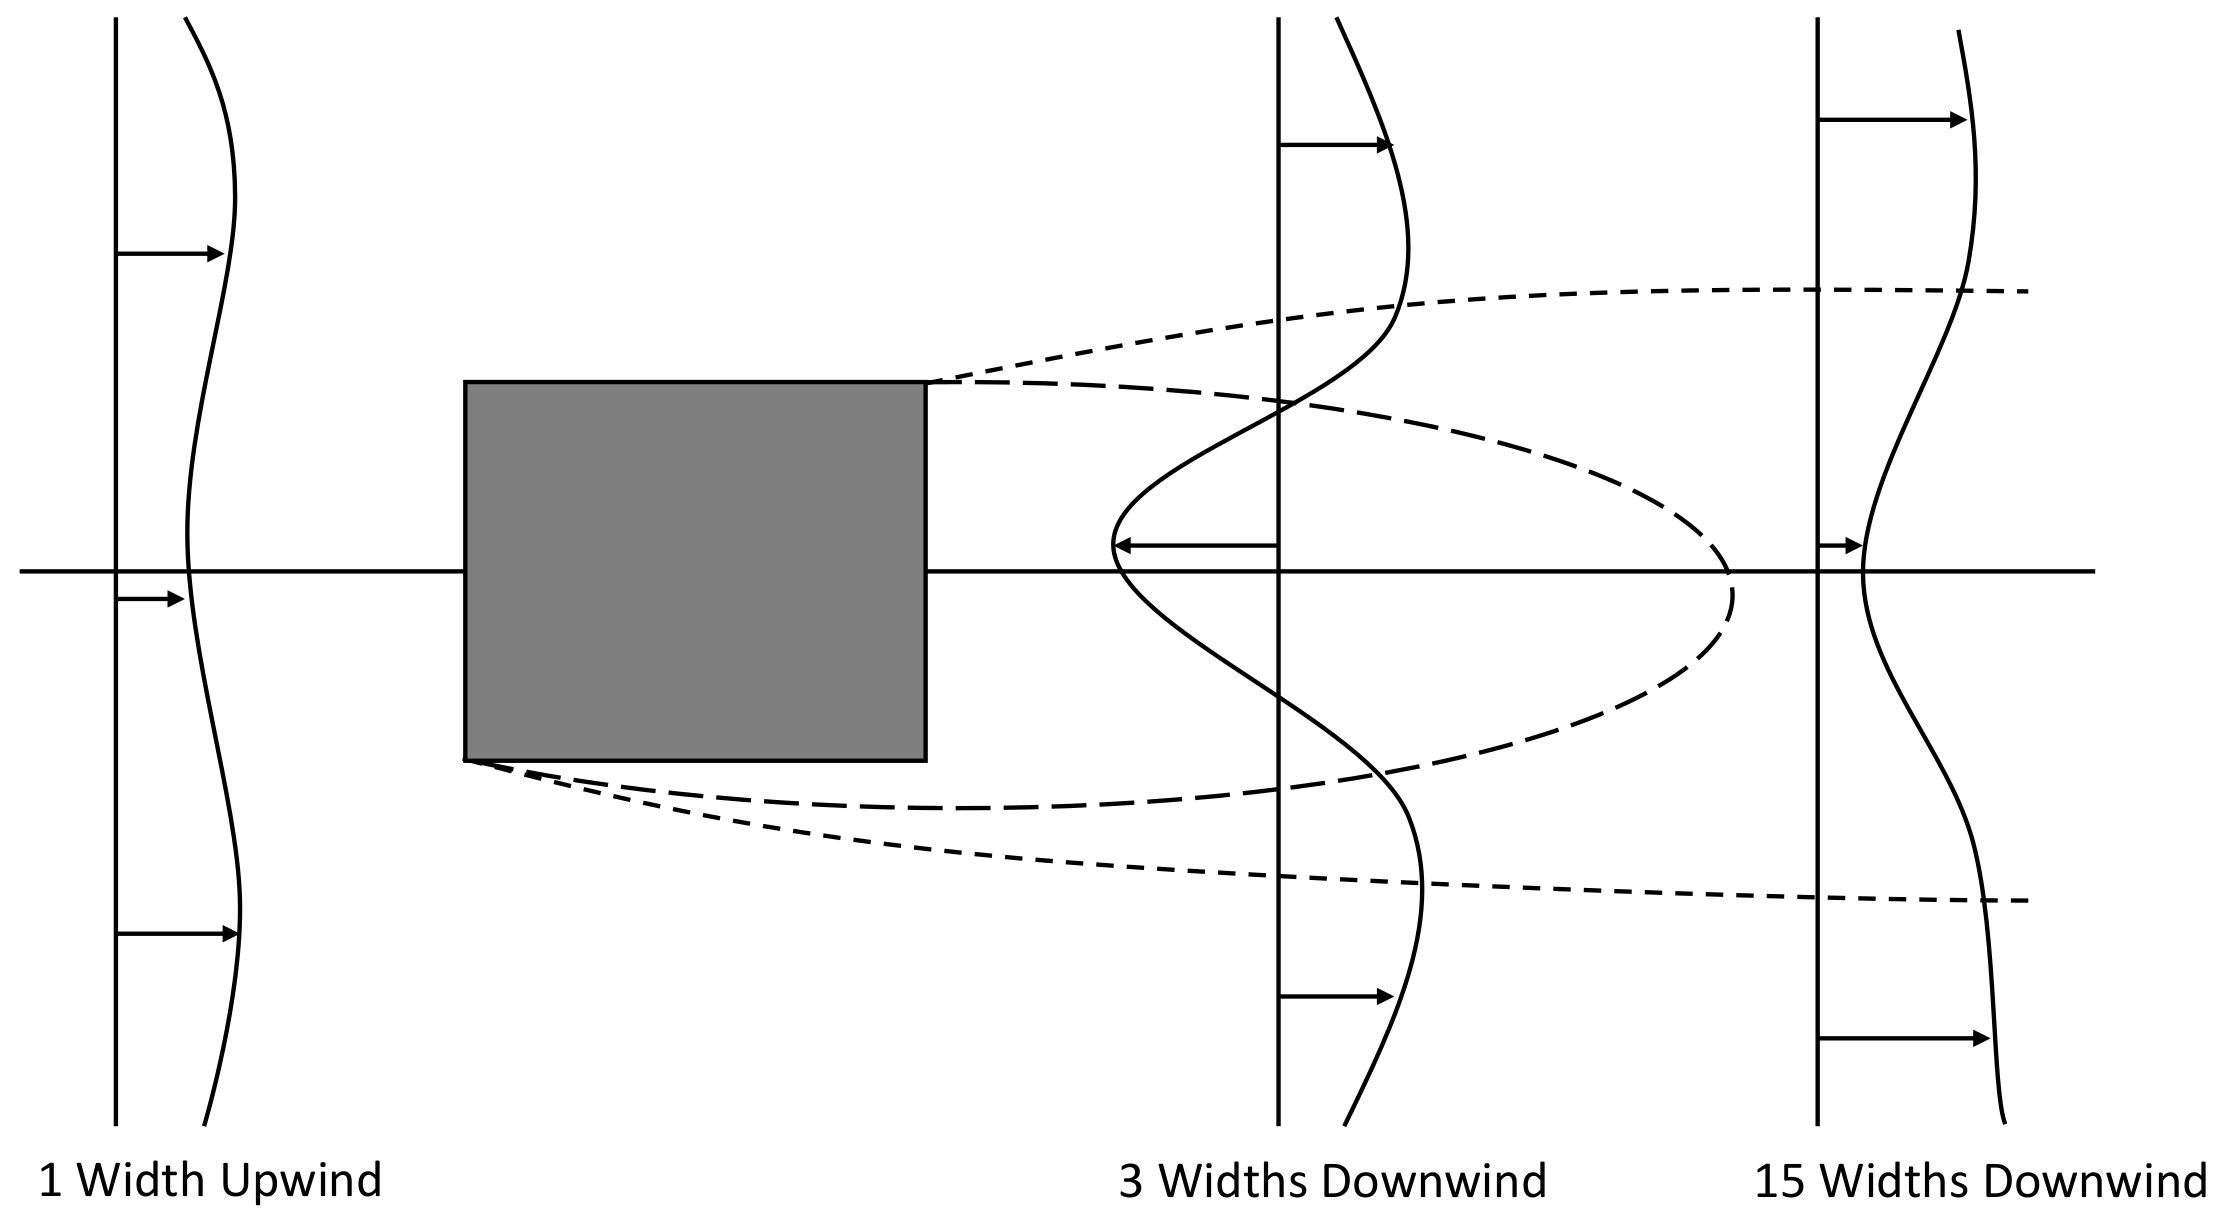
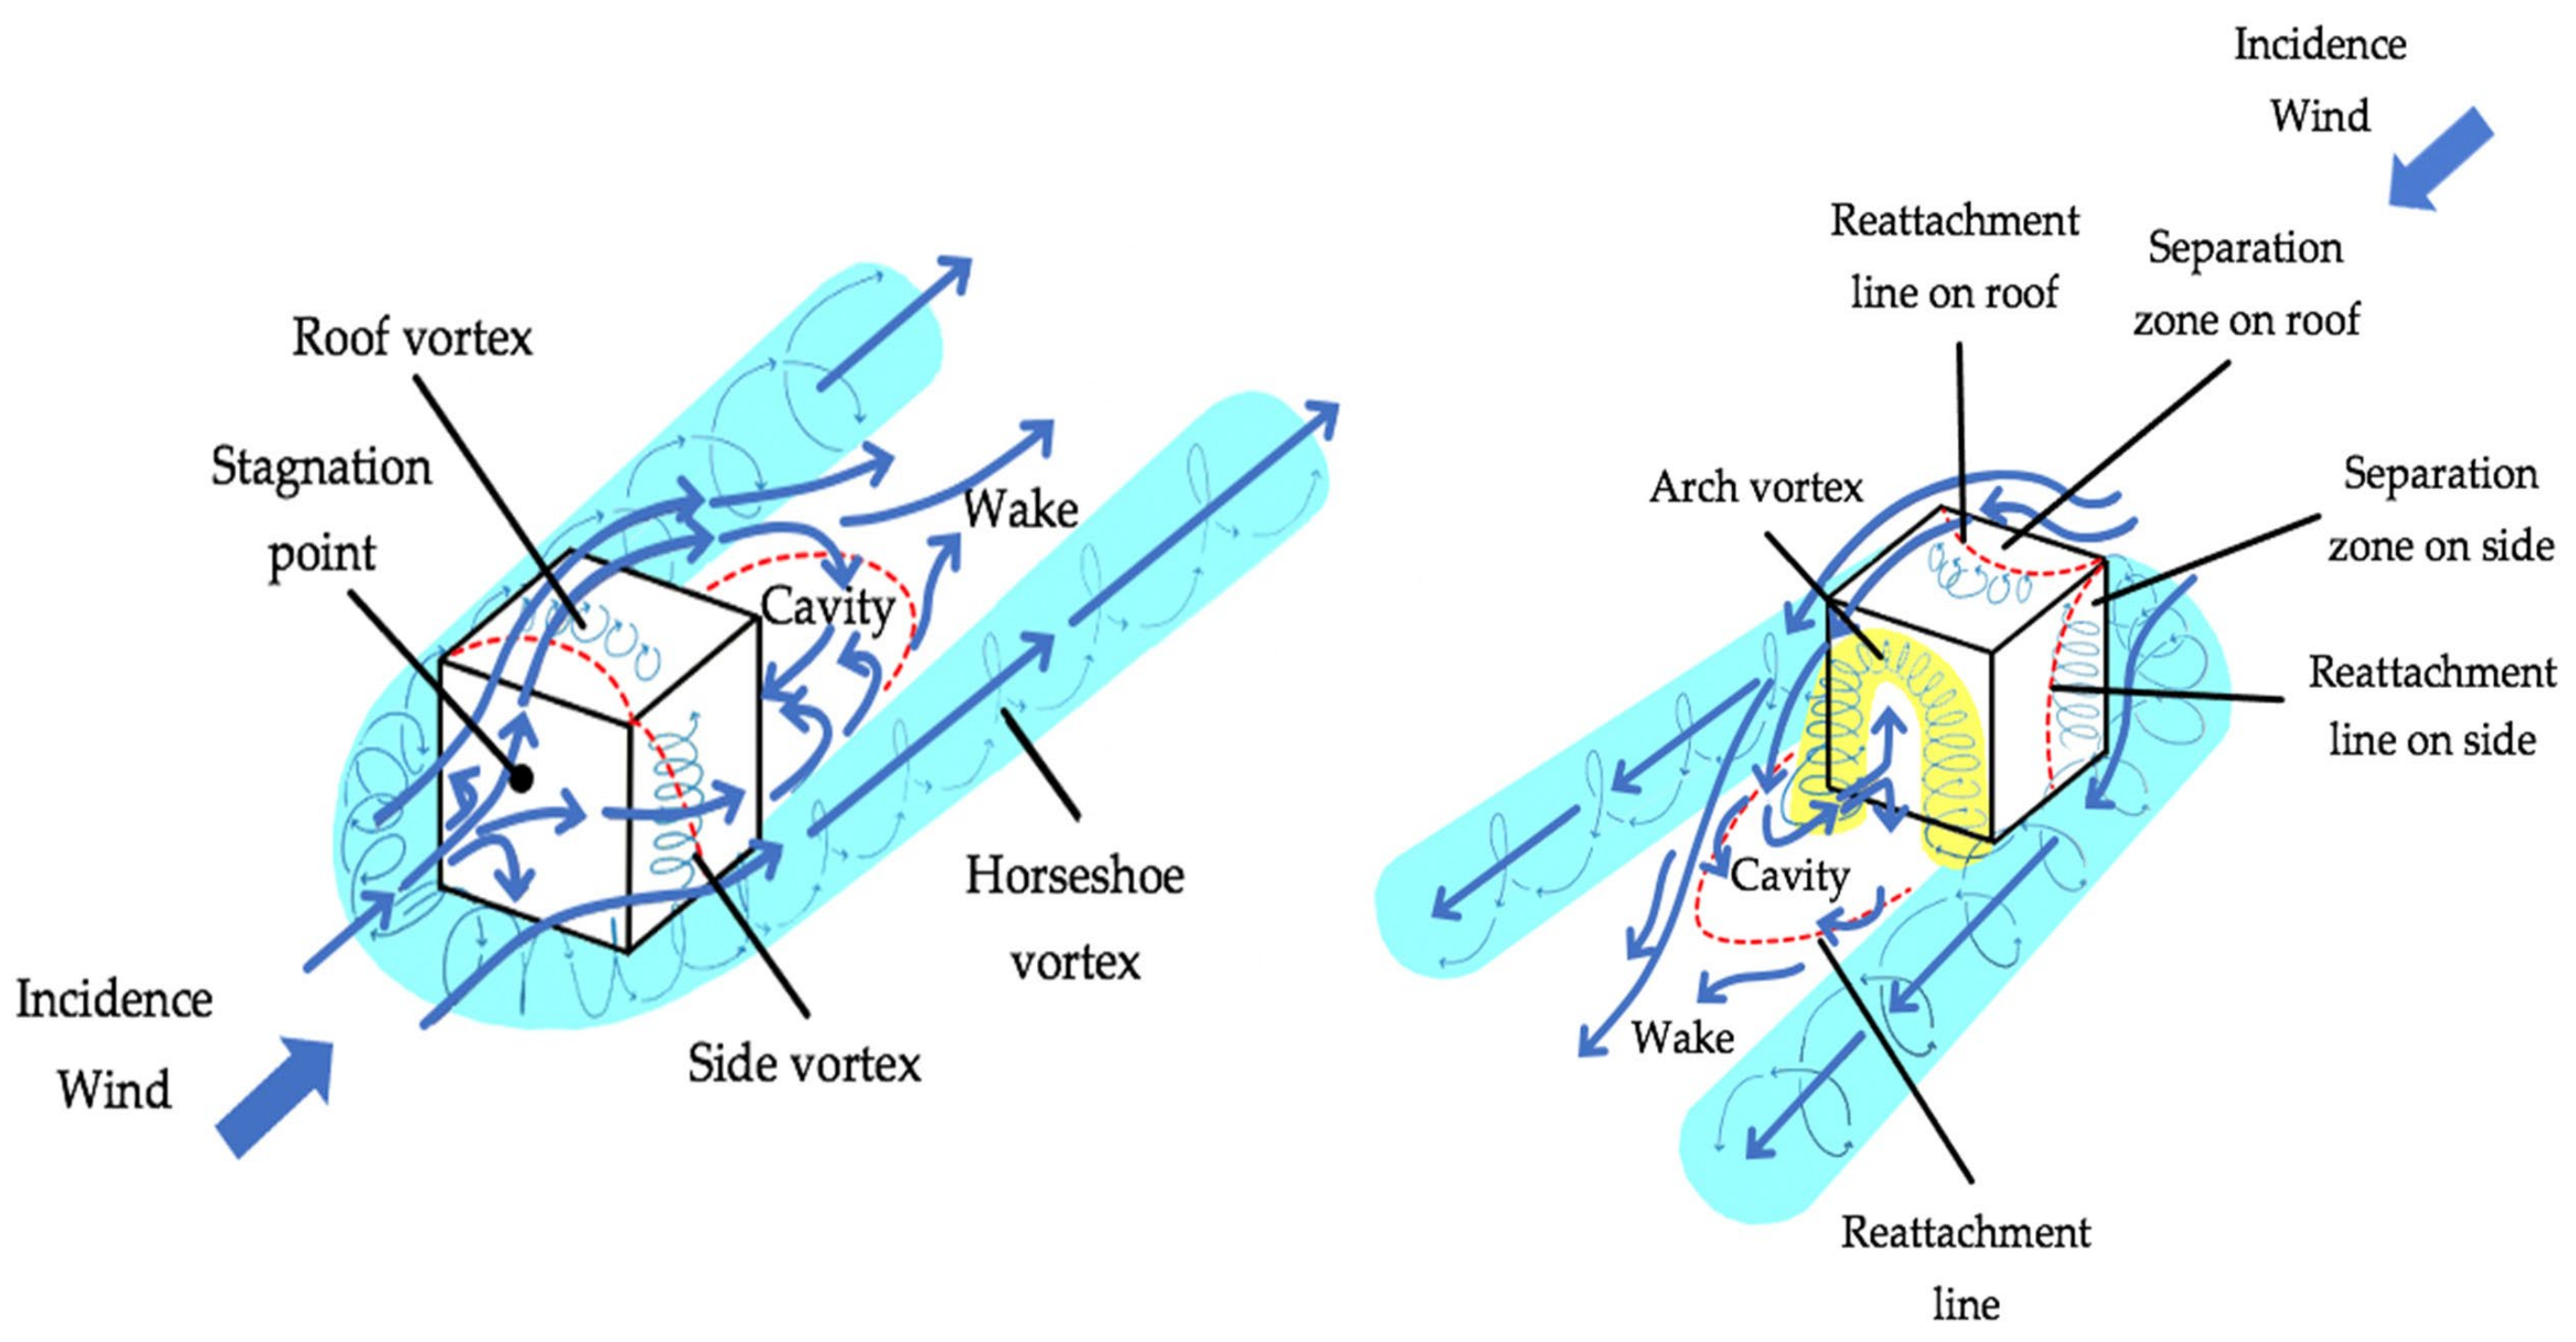
2.3. Wind Flow around a Single Building

Buildings come in all shapes and sizes, so, for simplification, this section will provide a summary of wind flow only around a cubical building.
As previously mentioned, wind flow in an urban environment is complex and turbulent due to the presence of many obstacles (e.g., buildings). When the steady flowing air particles impinge on a built surface in a normal direction, the flow is redirected, as shown in Figure 4, forming various flow patterns and regions around the building. This is due to the high-pressure stagnation point on the windward surface of the building elevation. The position of the stagnation point, which is estimated to be at two-thirds of the building’s frontal elevation, is dependent on factors like the building frontal aspect ratio, the ratio of building and UBL height, and the surface roughness upwind of the building [26,27]. Starting from the stagnation point, the flow deflects to the lower-pressure regions such as the top, sides, and downward surface of the windward region of the building.
At the windward front of the building, a reverse flow occurs when the flow deflects downwards from the stagnation point to the ground, forming a detached zone with a vortex near the surface. A separation bubble is generated on the roof or top of the building that may reattach depending on the upstream surface roughness and top aspect ratio [29]. The flow downwind or on the leeward and lateral sides of the building is the wake region. Here, there are pronounced vortexes that are characterized by low-velocity distribution with high turbulent intensities. In the wake region, the flow recirculates for 10 to 13 widths downstream, making it highly unsteady [30]. Figure 5 provides a 2D view of the mean velocity variation at different places downstream of the leeward face or the wake region of a building.
In contrast to the steady inflow, when a building is placed in turbulent inflow conditions with equal average velocity, two effects eventuate: (1) eddies or vortexes are deflected, reducing the turbulent velocity component in the flow direction and intensifying in the perpendicular direction, and (2) the eddies are stretched, amplifying the turbulent velocity component in the flow direction and reducing in the perpendicular direction. Out of these two effects, the dominating one is usually dictated by the relative scale of the building to the inflow turbulence. As an example, for larger buildings, the second effect is more pronounced [30].

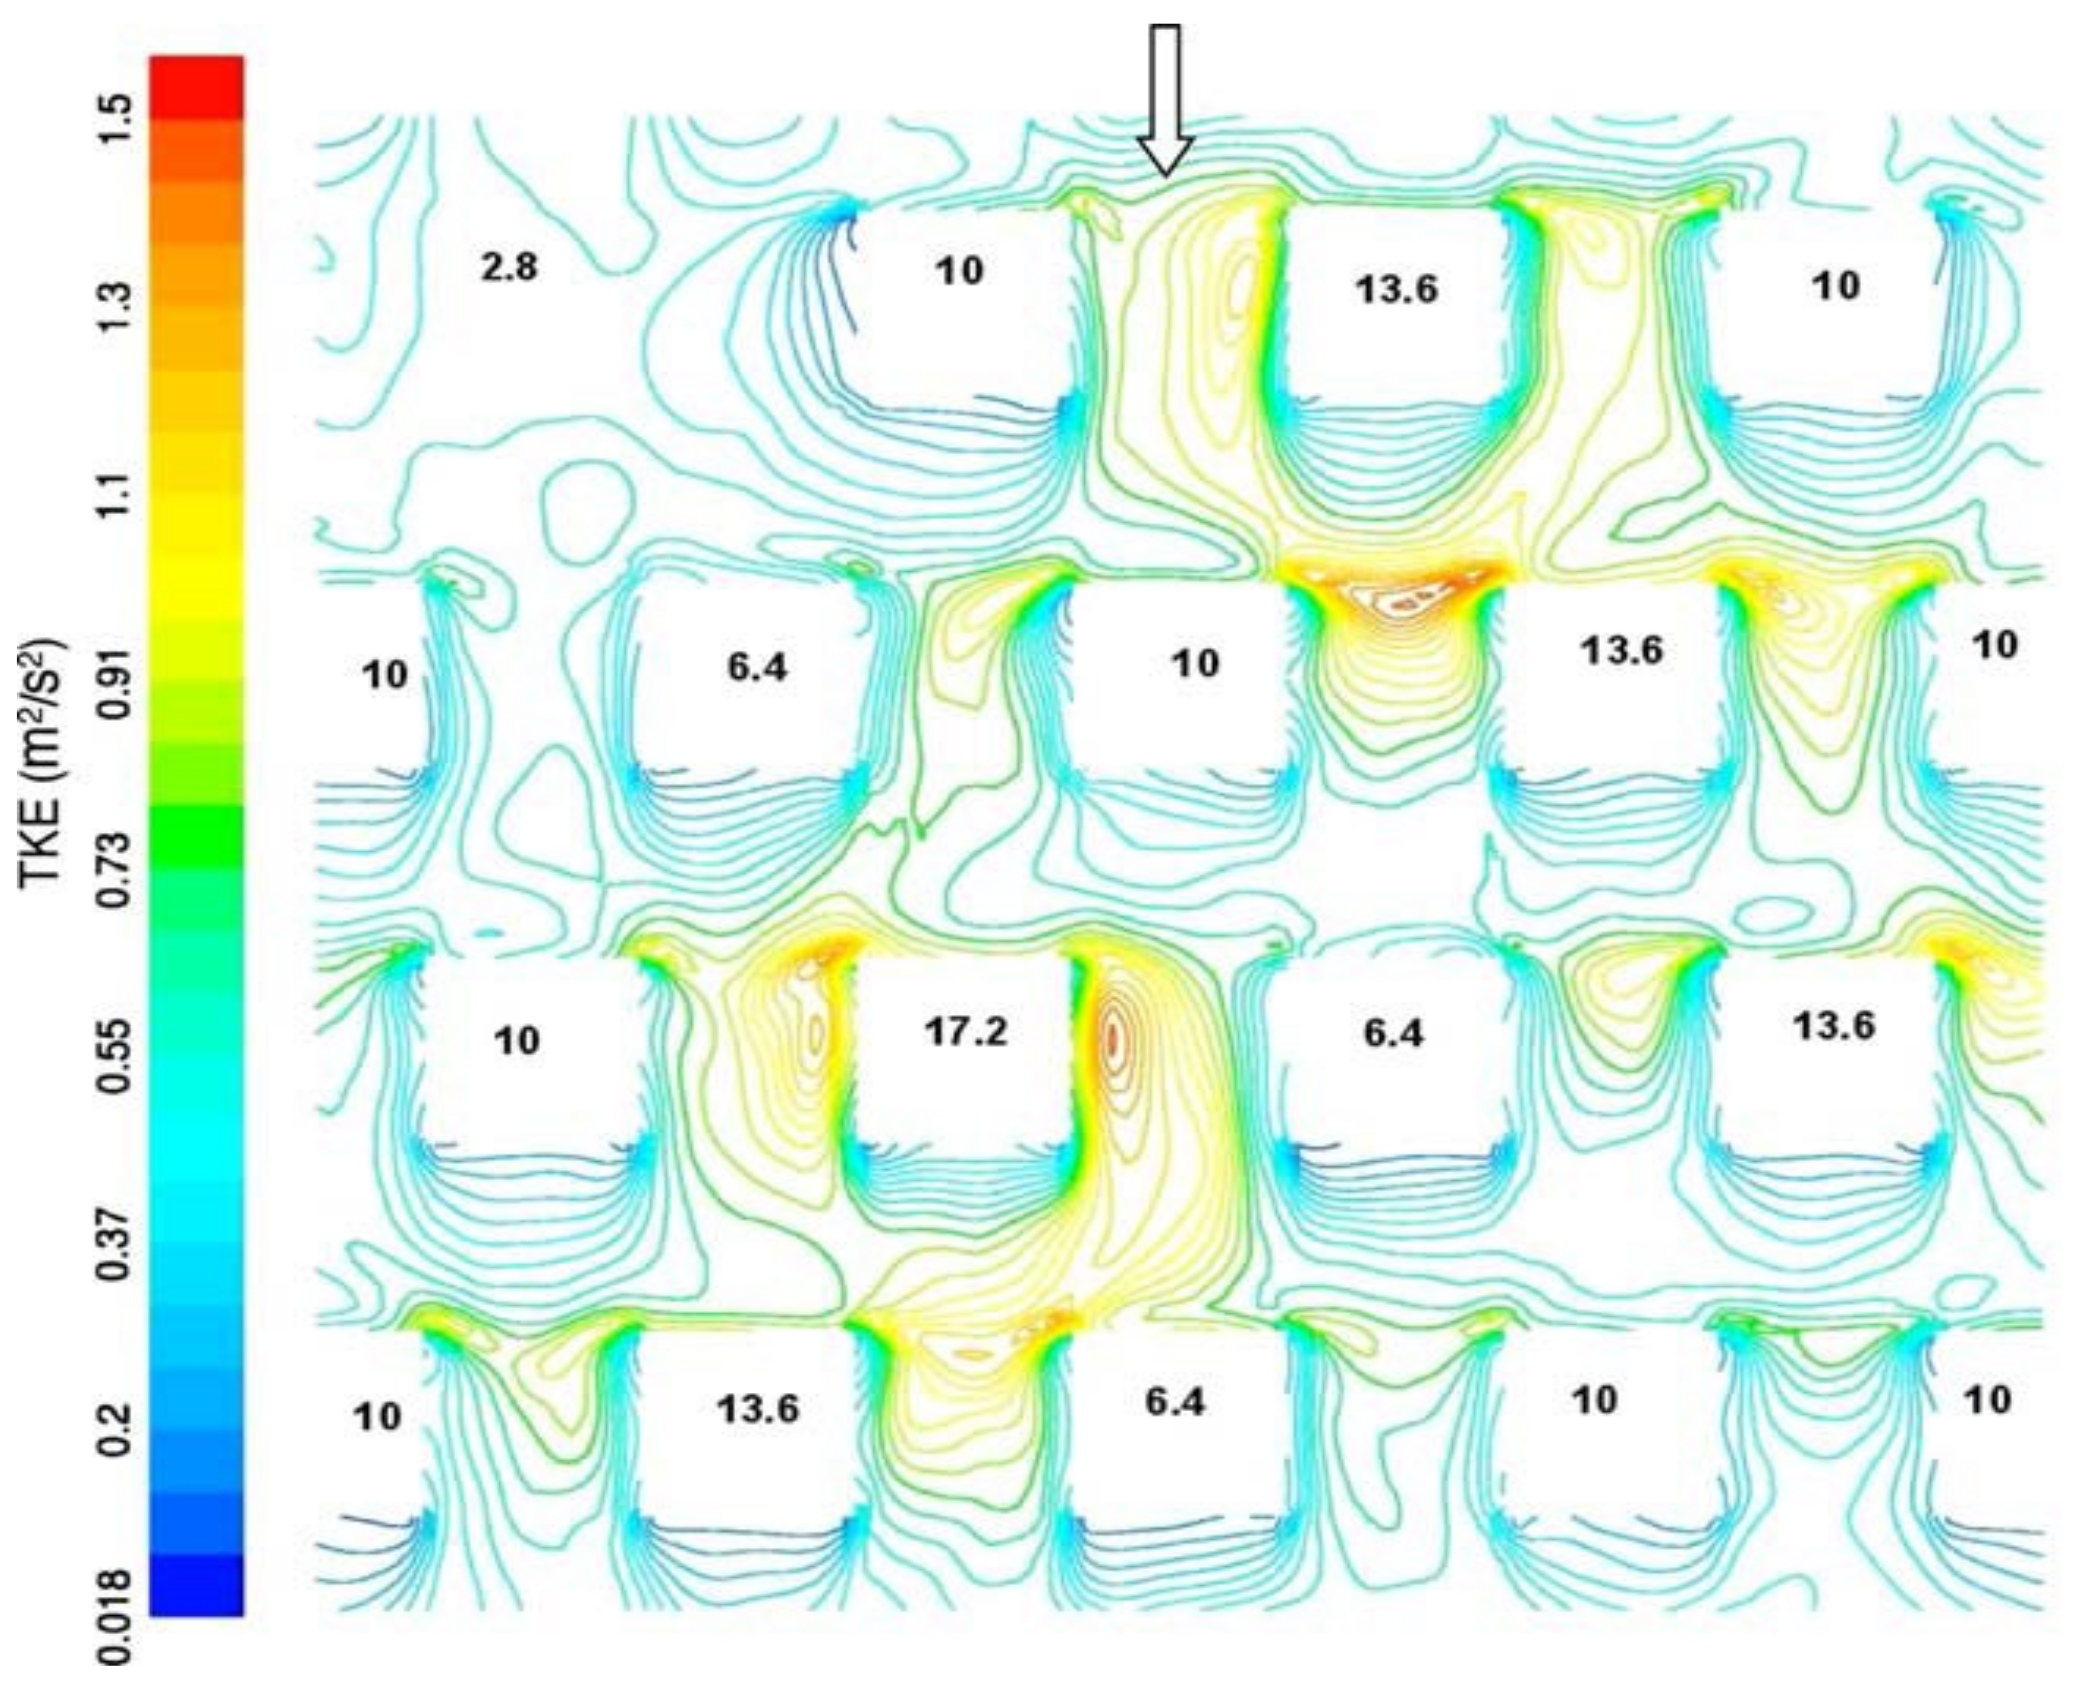
2.4. Wind Flow around a Group of Buildings

Flow fields around multiple buildings are much more difficult to model and comprehend compared to isolated buildings. Similarly, wind flow in and over a UCL with random roughness (i.e., with several building shapes and sizes) is more complex than the wind flow over a canopy region with buildings of similar height. In ref. [31], where uniformly placed and randomly sized arrays of cubical blocks representing buildings are used to study the flow characteristics, the authors claim that it is complicated to determine the flow details within the UCL as they greatly depend on the building arrangement and height. The paper also claims that the tallest building produces more drag, setting the largest turbulent kinetic energy (TKE) as shown in Figure 6.
Overall, the streamlines around multiple buildings are more convoluted as they depend on multiple factors such as inflow wind incidence angle [32], size of the buildings, building surface roughness, etc. Thus, most papers investigating the flow around a group of buildings within the canopy region caution that the data produced by one specific study might not be extrapolated in another. However, a common pattern within the UCL is the strong downward flow between the gaps or streets.

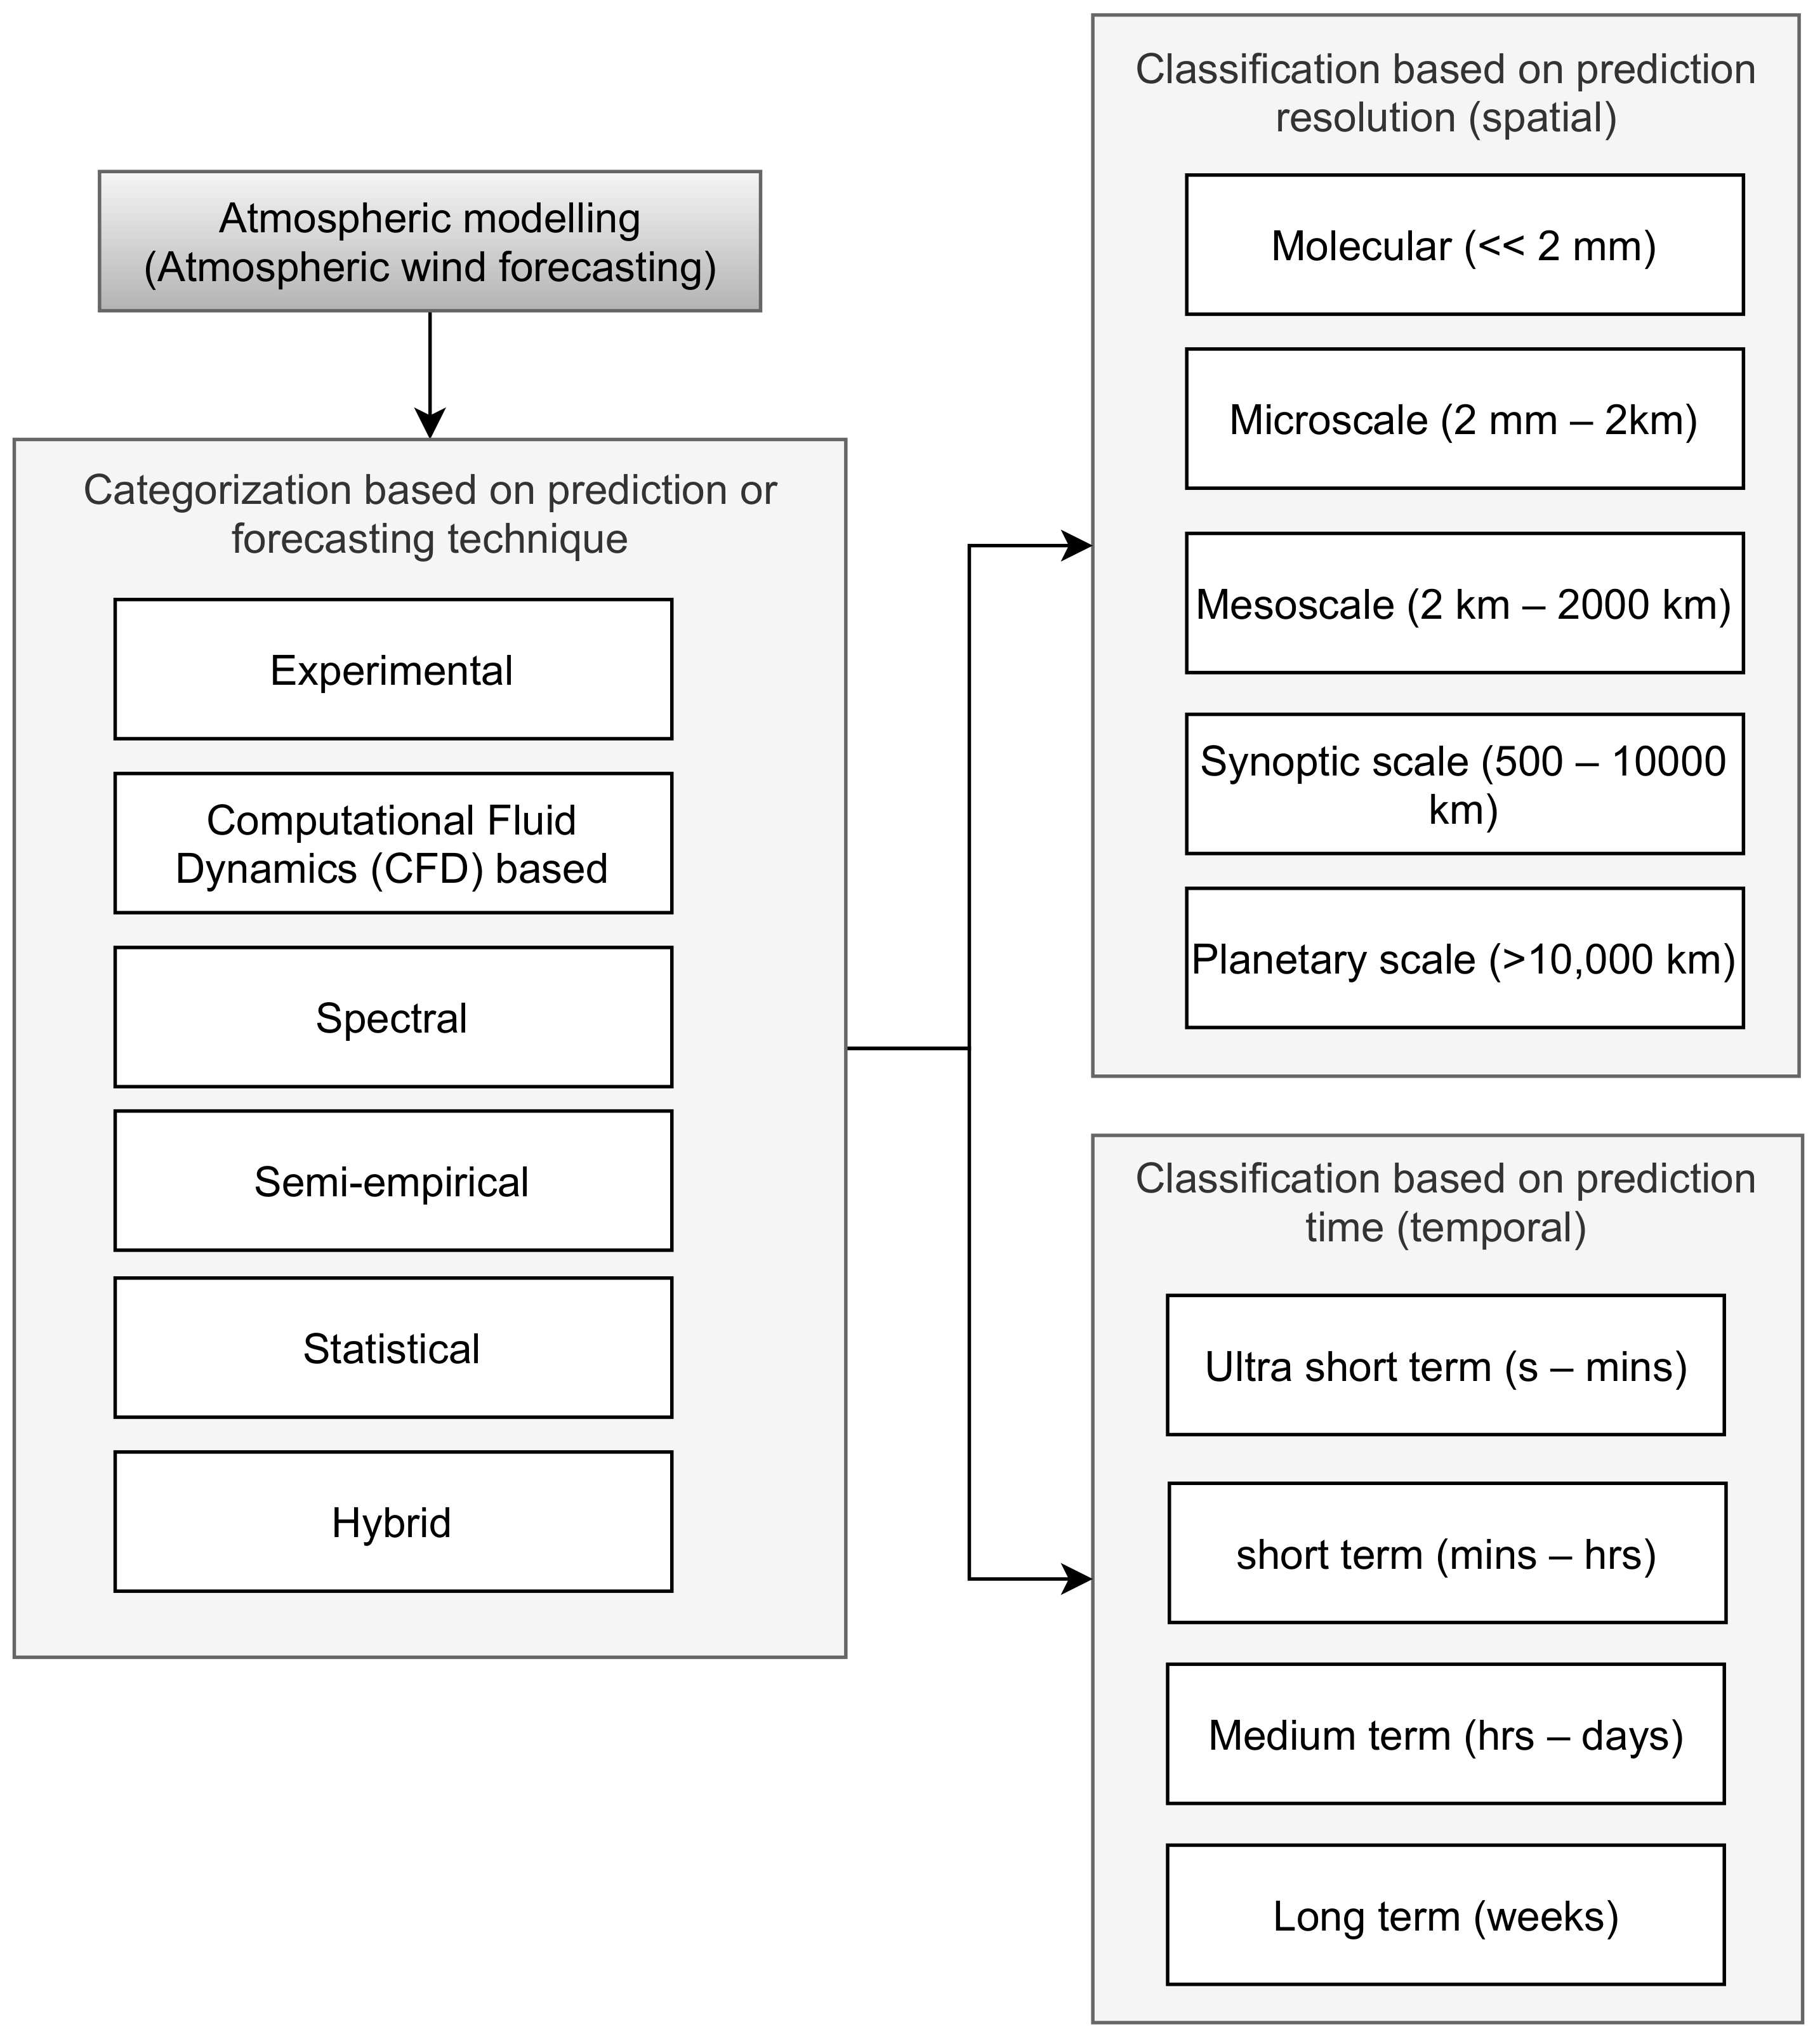
3. Overview of Wind Flow Modelling in Urban Environment

Atmospheric wind flow modelling is a vast discipline with several simulation and forecasting methods that are either prognostic or diagnostic in nature. These methods could be categorized based on the type of technique employed for the prediction and mapped to different spatial resolution [33] and temporal classes [34], as shown in Figure 7.
This section will provide an overview of the commonly used wind flow modelling techniques that are employed by (i) atmospheric scientists to understand the dynamics of the low-altitude atmosphere, (ii) wind engineers to determine the emplacement of wind turbines in cities, (iii) civil engineers to understand wind comfort in pedestrian lanes, and (iv) environmental scientists to study pollution dispersion.

3.1. Experimental Method

Wind tunnel tests are one of the most widely utilized experimental techniques to simulate and study wind flow characteristics and pollution dispersion within the UCL. One of the main advantages of wind tunnel studies is the ability to control the parameters that affect the flow such as the building height, aspect ratios, roof design, surface roughness, etc., for replicating the near-realistic wind conditions of the UCL in a test environment [35]. Wind tunnel test data are often used for validating numerically simulated wind data due to their ability to produce pragmatic results. However, wind tunnels have their drawbacks such as scaling effects, measurement errors, wall effects, and Reynolds effects (lack of large-scale turbulence within a controlled environment) [36]. Experimental approaches of this type are also widely used to characterize other complex flow conditions that affect rotorcraft flights, such as those related to the analysis of ship helicopter operational limits (SHOL) [37,38].

3.2. Computational Fluid Dynamics (CFD)-Based Methods

CFD is the wind simulation technique most commonly used by atmospheric scientists, civil engineers, and environmental scientists to study the flow patterns within the UCL. There are many CFD models; however, the most repetitively used are based on large eddy simulations (LES) and Reynolds-Averaged Navier–Stokes (RANS) equations.
  • LES (Large Eddy Simulation)
    LES is one of the most popular methods in CFD for studying the fluid transport process in the ABL (i.e., turbulent flows) [39], pollution dispersion, wind flow in urban areas or near obstacles, and wake interactions [31,40]. Low-pass filters are employed within LES models to solve the Navier–Stokes equations. Unlike direct numerical simulation (DNS), where the flow energy is studied by modelling for all scales of fluid motion, LES filters and models only a small scale of motions to investigate the energy spectrum of turbulent eddies [41]. This comparatively reduces the computational power and time required by producing results that are close to DNS data and more accurate than RANS. However, LES still falls into the medium- or long-term temporal class. Thus, there have been several efforts made to speed up the computation speed of LES, for example, there is the research group that is working on the parallelized LES model (PALM) software 6.0 framework. PALM is being developed for simulating wind flow in the urban canopy with grid sizes of less than 1 m [42].
  • RANS (Reynolds-averaged Navier–Stokes)
    RANS is a numerical method that averages Navier–Stokes equations to model turbulent flows. This method is primarily based on Reynolds decomposition, where the flow quantities are broken into their time-averaged mean flow and fluctuating components, generating unknown Reynolds stresses. Hence, to solve these unknowns, which vary in both space and time, turbulence closure models such as k- ε , k- ω , SST k- ω , etc., [32,43,44] are typically employed.
    RANS is often considered an industry standard CFD model to study turbulence. It has been used commonly to model wind flow within an urban environment and for pollution dispersion studies. Moreover, RANS, through an accuracy trade-off, seems to be considered a valid alternative to eddy-resolving CFD methods like DNS and LES, which are computationally expensive and less time-efficient [45]. However, like every other CFD model, RANS comes with its drawbacks, and one of the limitations of employing RANS to ABL flows is the misrepresentation of stream-wise gradients in the vertical mean wind speed profiles and turbulence quantities due to improper selection of boundary layers [45]. Likewise, Denise et al. [46] state that the accuracy of RANS is comparable to the LES data only above the urban canopy layer (UCL).

3.3. Spectral Methods

Spectral methods are diagnostic, that is, these methods are derived from the experimental observations of the isotropic turbulent energy spectrum. Spectral turbulence models are low-order modelling techniques, which are computationally less expensive and faster compared to the many CFD models. von Kármán and Dryden are two spectral models for the generation of continuous gusts that have been widely used by the aviation community and are even standardized by the FAA/EASA for flight tests, assessments of flying qualities of piloted aircraft [47], and aircraft certification. However, these are not the only spectral models that can be used for gust and turbulence modelling. There are other models like Kaimal, Mann, and discrete gust models such as sharp-edged gust, 1-cosine, etc., which are utilized to model low-altitude gusts.
Both the von Kármán and Dryden models use a two-equation approach. The first equation is used to describe the turbulent kinetic energy while the second denotes the dissipation. Both models specify the power spectral density (PSD) for the velocity components and take white noise as input. A difference between the two models is the characterization of PSD, rational for Dryden and irrational for von Kármán. Contrary to von Kármán and Dryden, Kaimal and Mann gust models are widely used and standardized to evaluate design loads on wind turbines. The wind disturbance in the Kaimal model is described as 1-D spectral for turbulent velocity fluctuations, whereas Mann’s model is a spectral tensor model based on von Kármán’s model [48]. The main difference between Mann’s and Kaimal’s models is the presence of correlation between the wind velocity components, where the former is with correlation and the latter is without. However, almost all of the papers found for this literature review employed Kaimal and Mann only for the determination of wind turbine loads.
Unlike continuous gusts, discrete gusts are isolated flow structures that may take several forms. This unsteady aerodynamics, such as discrete gusts of step, ramp, and sinusoidal or 1-cosine shape, are often modelled in a single dimension through classical state-of-the-art processes [49].

3.4. Semi-Empirical Methods

There have been many attempts to define a simple and fast computing empirical model for urban microclimate simulation by the atmospheric science community since the 1960s for the study of pollution dispersion and wind speed estimation. A steady vertical profile of the wind conditions can be modelled by logarithmic (or power law) models or graphical methods for an urban area [50]. These methods are straightforward, and the wind speed can be estimated with simple calculations. However, they cannot predict the wind field between the buildings or estimate the turbulence produced by the obstacles (buildings). Two additional, and equally famous, dispersion modelling techniques used are the Lagrangian and Eulerian dispersion models. These models date back to the 1980s and 1990s and have since been adopted for the development of various fast urban wind modelling software programs such as QES winds, QUICUrb, and URock [51,52,53]. Both Eulerian and Lagrangian approaches are based on the conservation of mass. The former is often rejected due to the appearance of artificial diffusion, whereas the latter is computationally expensive as trajectories of several thousand fluid particles are to be calculated for small consecutive time steps based on the grid size.
Weather Research and Forecasting (WRF) is another popular diagnostic software system that was built by NOAA and NCAR for meteorological research and weather prediction [54]. The software uses mesoscale weather observation data to predict the weather at different altitudes and resolutions. It is a fully compressible and nonhydrostatic dynamic framework that allows nested domain simulations. However, WRF is meant primarily for mesoscale weather predictions, and it is also computationally expensive compared to the other semi-empirical models listed in this section.

3.5. Statistical Methods

Statistical methods usually require historical or synthetic weather data for prediction. Such methods are often adopted from the artificial intelligence (AI) and machine learning (ML) domains. The primary reason for their usage is the ease of modelling and faster computation time. Many ML algorithms such as autoregressive (AR), autoregressive moving average (ARMA), autoregressive integrated moving average (ARIMA), Bayesian approach, etc., have been investigated within the wind engineering field for forecasting wind speed estimation [55]. In [56], the authors employ a convolutional neural network (CNN) and long short-term memory (LSTM) to predict and increase the accuracy of wind based on a measured 10 min average wind speed data. The paper claims that the models have a strong learning ability for new data with increased accuracy. However, it is important to note that although these statistical methods reduce the computation time by several orders of magnitude when compared to CFD models, they rely heavily on training data, making them a long-term solution for an initial phase of wind forecasting due to urban wind data insufficiency.

3.6. Hybrid Methods

Coupled wind field simulation techniques are innovated primarily to overcome the existing challenges in low-altitude atmospheric modelling such as high computation cost, high computational time for higher accuracy, etc. Mi et al. [57] integrated RANS with WRF–Building Effect Parameterizations (BEP) to simulate urban wind flow with high accuracy and spatial resolution to determine the apt locations (places with low turbulence intensities) for microwind turbine installation. However, this multiscale simulation methodology seems to come with a high computational demand. CFD and on-site observational data have also been combined to perform dynamic wind resource assessments [58]. It was observed that many papers analyzed for this literature review utilized a hybrid model of CFD + WRF. There have also been coupled CFD models based on RANS + LES for more accuracy in the prediction of lower-altitude wind field [59]. Such hybridization has been explored to bridge the gap in precisely modelling flow separation and attachment zones in the urban environment. Furthermore, reduced order models (ROMs) such as proper orthogonal decomposition (POD) and principal component analysis (PCA) have been seen to be employed in correlation with CFD for optimizing the order and complexity of turbulence modelling for the urban environment [60]. For example, PCA has been used to define the leading large-scale urban weather components and K-means clustering to define an optimum classification as a means of CFD + statistical method coupling for fast estimation of flow over a wind farm [61,62].

4. Compare-and-Contrast Analysis

A compare-and-contrast study of the widely used wind flow models (listed in the previous section) is performed in the context of UAM applications. The analysis hinges on the following qualities of the wind model: time, resolution, and prediction accuracy (see Table 2). The prime reason for selecting these specific qualities is the UAM requisites—i.e., the need for faster weather forecasts, as a typical UAM flight would only last for a few minutes initially due to the present battery limitations, and the dire need for fast computing models which can accurately generate urban wind data for different conditions (cities, flow parameters, etc.) to determine performance-based UAM aircraft certification standards and operational guidelines.

5. Wind Flow Modelling for UAM Development

A simple analysis was performed to cluster the 42 papers based on the categories listed in Table 3 to identify the most researched wind modelling technique exercised for UAM applications by far. Figure 8 is a pie chart representing the distribution of the 42 papers under the different clusters.

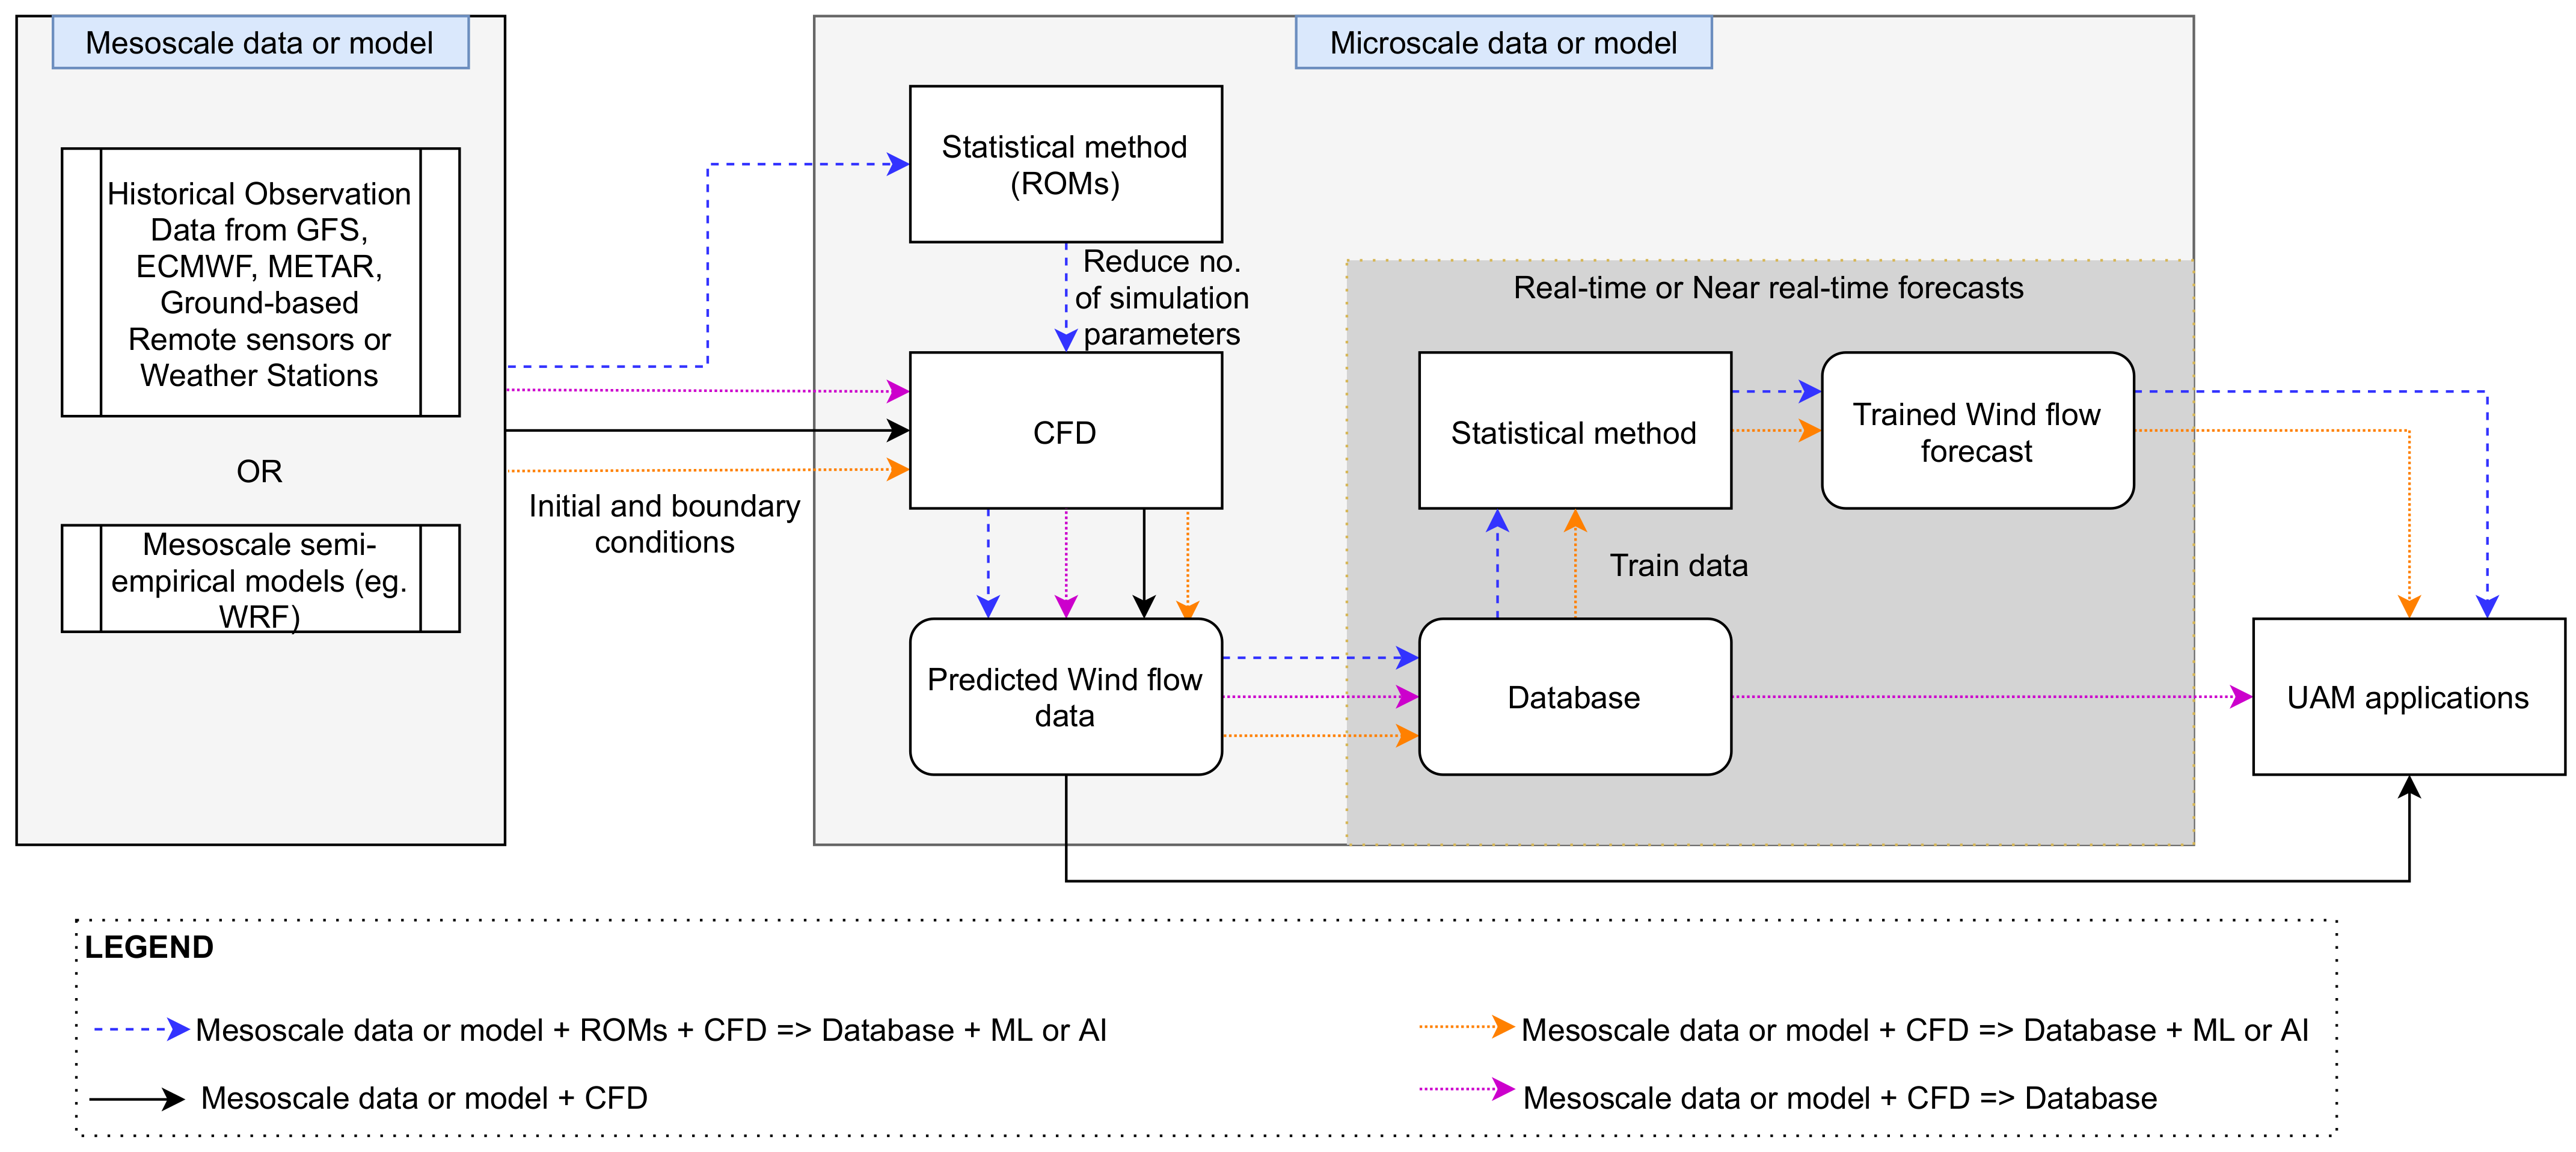
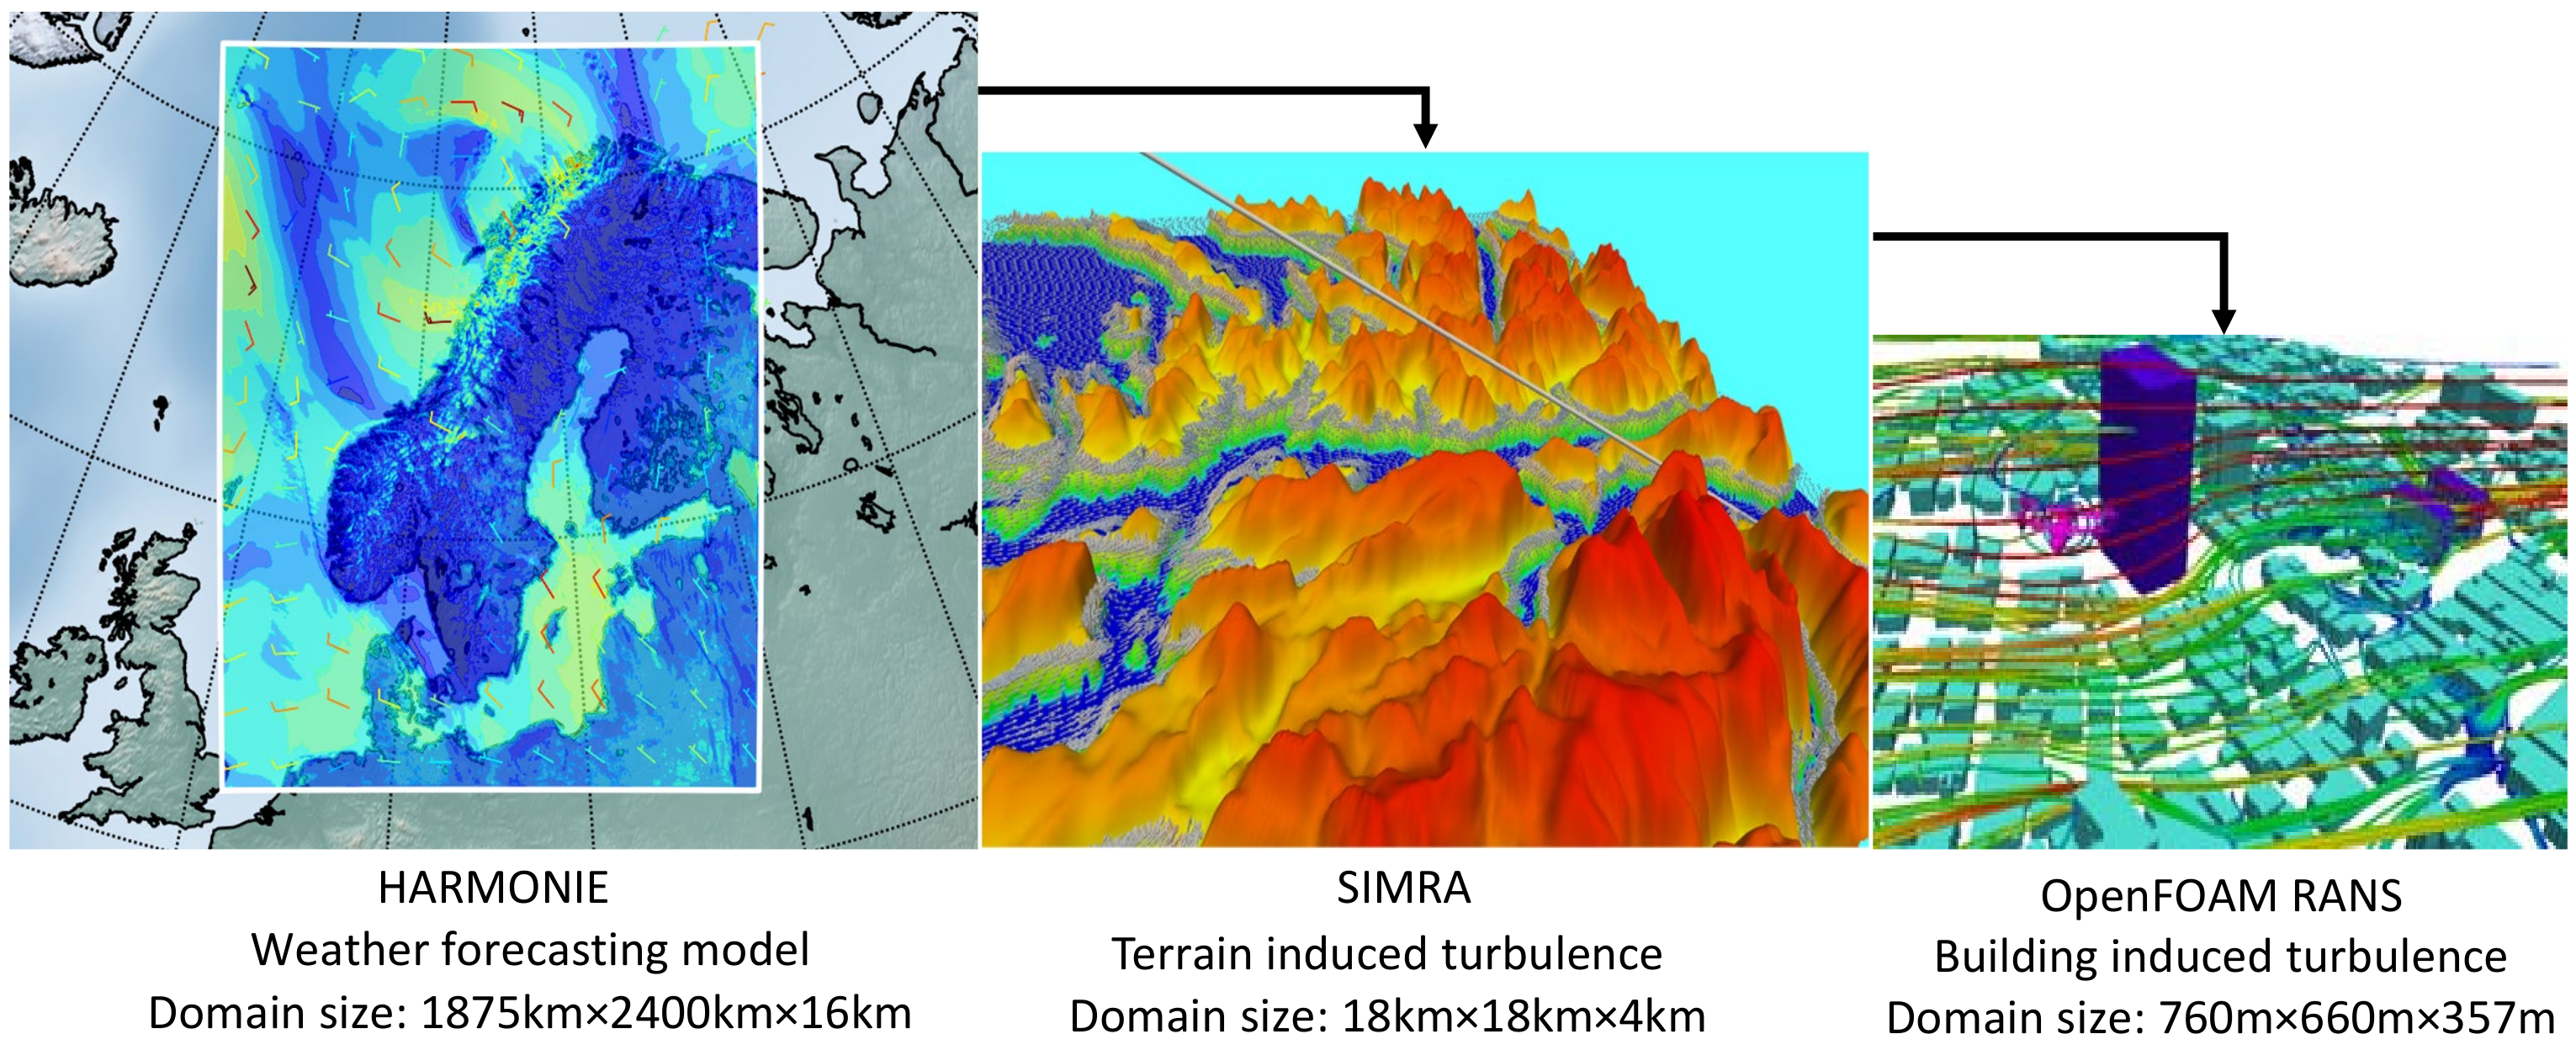
5.1. Cluster 1: Hybrid

The majority of the papers in this category exploit CFD in combination with historical weather or experimental measurement data or statistical or semi-empirical methods in one of the processes depicted in Figure 9.
Mandar et al. [63] utilize a multiscale methodology to generate a wind flow atlas for the urban environment by employing three different models: HARMONIE, SIMRA, and a super-microscale CFD method (see Figure 10). HARMONIE is a numerical weather predictor (NWP) that utilizes ECMWF (European Centre for Medium-Range Weather Forecasts) data. It is operated at 2.5 km × 2.5 km horizontal resolution, and the resultant data are used to set the boundary conditions for SIMRA (Semi IMplicity Reynolds Averaged model), which is a prognostic CFD-based solver that relies on RANS and k- ε turbulence closure equations with orthogonal structured meshes. SIMRA is operated at a grid resolution of 112 m × 112 m for an efficient and coarse microscale wind simulation. The outputs from SIMRA are used as input to an OpenFOAM-based super-microscale model that utilizes nonorthogonal meshes of 0.15 m grid size to solve the realizable k- ε turbulence closure equations for a finer prediction of wind flow around buildings and structures. This complex model may have factored in multiple meteorological parameters from different scales to create a wind atlas. However, the prediction accuracy has not been validated, not to mention the fact that this nested solver may also be less efficient with respect to the computation time. Similarly, in [64], an unsteady RANS and k- ε -based CFD model is nested within two mesoscale wind models for the development of a real-time turbulence alert system for an area surrounding a Norwegian airport. Authors in [65] use hourly data from WRF to dictate the initial and boundary conditions of a CFD model that is based on LES-filtered equations for replicating wind conditions over a downtown area in Oklahoma, United States. Four WRF schemes, which are diversified based on the simulation domain size (3 km, 1 km, and 400 m) and UBL model, and two coupled WRF+LES schemes each with different coupling methods are compared to the Micronet (weather) station observation data. It has been identified that coupled WRF+LES schemes perform better than the standalone WRF schemes. The paper also states that the employed method does not resolve turbulent motions of urban wind because of terrain topography uncertainties, as only a little difference is observed in the estimated values of a 1 km and 400 m WRF domain. This behavior is reasoned to be because of the coarse and insufficient LES assumptions of vertical transport and wind gusts. Two additional papers that explore the use of CFD nested within WRF are [66,67]. In [68], the author uses a data assimilation approach where LES-based synthetic observation data are accumulated and assimilated to improve a RANS model for the generation of wind data. The paper claims that this approach reduces the model discrepancies from 15 to 3% and states that the mean error decreases from 54% at the analysis time to 10% for a simulated 400th of a second. However, it has to be noted that the process of using synthetic observation data would ultimately compel the results to carry the uncertainties of the synthetic model. Nevertheless, the data assimilation approach is a wise idea for populating or creating a wind atlas or a database.
In refs. [69,70], LES performed for neutral and dry atmospheric conditions, is coupled with statistical machine learning methods such as reduced order modelling and recurrent neural networks (RNNs) to simulate wind conditions around a cubical building for the safe operation of sUAS (small unmanned aerial systems). Specifically, the paper exploits proper orthogonal decomposition (POD) as the ROM technique to reduce the number of modal coefficients of the mean fluctuation flow field, obtained from the LES snapshots. Later, the RNN algorithm, long short-term memory (LSTM), is trained on specific modal coefficients to predict the flow field for future snapshots. The authors claim that the predicted results match the trained samples and encounter only a slight deviation when the prediction period is increased. However, this method employs simplification strategies like the consideration of a smaller domain and horizontal wind velocity component alone for the prediction, thereby making this wind data generation technique rely on the training sample assumption and accuracy.
In [71], PALM is utilized in combination with historical weather data to resolve turbulent flow across an urban landscape by conducting several simulations, which are variegated by key parameters such as domain size, number of grid points, grid spacing, atmospheric stability, magnitude and direction of the geostrophic wind, surface heat flux, and simulation time. It was identified that the results are sensitive to the initial wind direction, and the approach is ineffectual for operational forecasts due to longer computation time. Therefore, the authors stressed the need for the generation of a database and careful selection of simulation parameters to decrease the overall simulation time. Similarly, ref. [72] uses historical data in combination with a RANS CFD solver to study the wind field of an area in Toronto City and generate historical real-time forecasts with the help of an application programming interface (API). The authors also validate the results by comparing them to local weather station measurement data. The paper claims that 85% of the modelled data contain an error of only 8–12%. However, this approach also suffers from longer computation time (54 h for simulating wind field for 36 wind directions with 12 million grid cells and 128 h for 32 million cells). With time for convergence being the biggest challenge with CFD-based hybrid models, the authors in ref. [73] explore the use of a fast-computing wind flow solver called QUIC-CFD to determine performance-efficient quadrotor flight trajectory within the UBL. QUIC-CFD is based on RANS CFD models and historical weather data and was built by the Los Alamos National Laboratory for the determination of pollution dispersion in an urban environment. The results obtained from the QUIC-CFD model were validated through comparison of sensor data, and about 81% of modelled data seemed to show errors of less than 50% of the measured data. However, the simulation was performed under the assumption that turbulence is only a form of uncertainty for a steady incoming flow under neutral atmospheric stability, which is not the case in reality.

5.2. Cluster 2: Historical Weather Data

Papers identified in this category extrapolate historical weather observation data to predict the wind and gust characteristics for UAM applications.
METAR (Meteorological Terminal Aviation Routine) wind and gust data from airports are collected for a certain period of time and extrapolated to achieve the following: 1. Evaluate the wind impacts on vertiport operations and drone deliveries. 2. Determine the runway orientations for short take-off and landing (STOL) aircraft in the context of Sub-Urban Air Mobility. 3. Test and develop new software frameworks that analyze weather data for improving BVLOS (beyond visual line of sight) UAS operation safety [74,75,76,77]. Likewise, mesoscale satellite weather data obtained from the ECMWF (European Centre for Medium-Range Weather Forecasts) and GFS (Global Forecast System) are used to define energy-efficient flight routes [78]. Historical data from weather stations are used to identify weather-related operational risk levels and ideal weather conditions for safe drone operations through statistical and qualitative approaches such as pattern analysis and Beaufort wind scales [79,80].
This straightforward approach of using observation data would eliminate the need for complex wind modelling, but the prediction may not sustain accuracy for wider areas. This is due to the fact that extrapolating data from METAR, ECMWF, GFS, and weather stations does not take into account the topographical changes and corresponding ramifications to the wind flow.

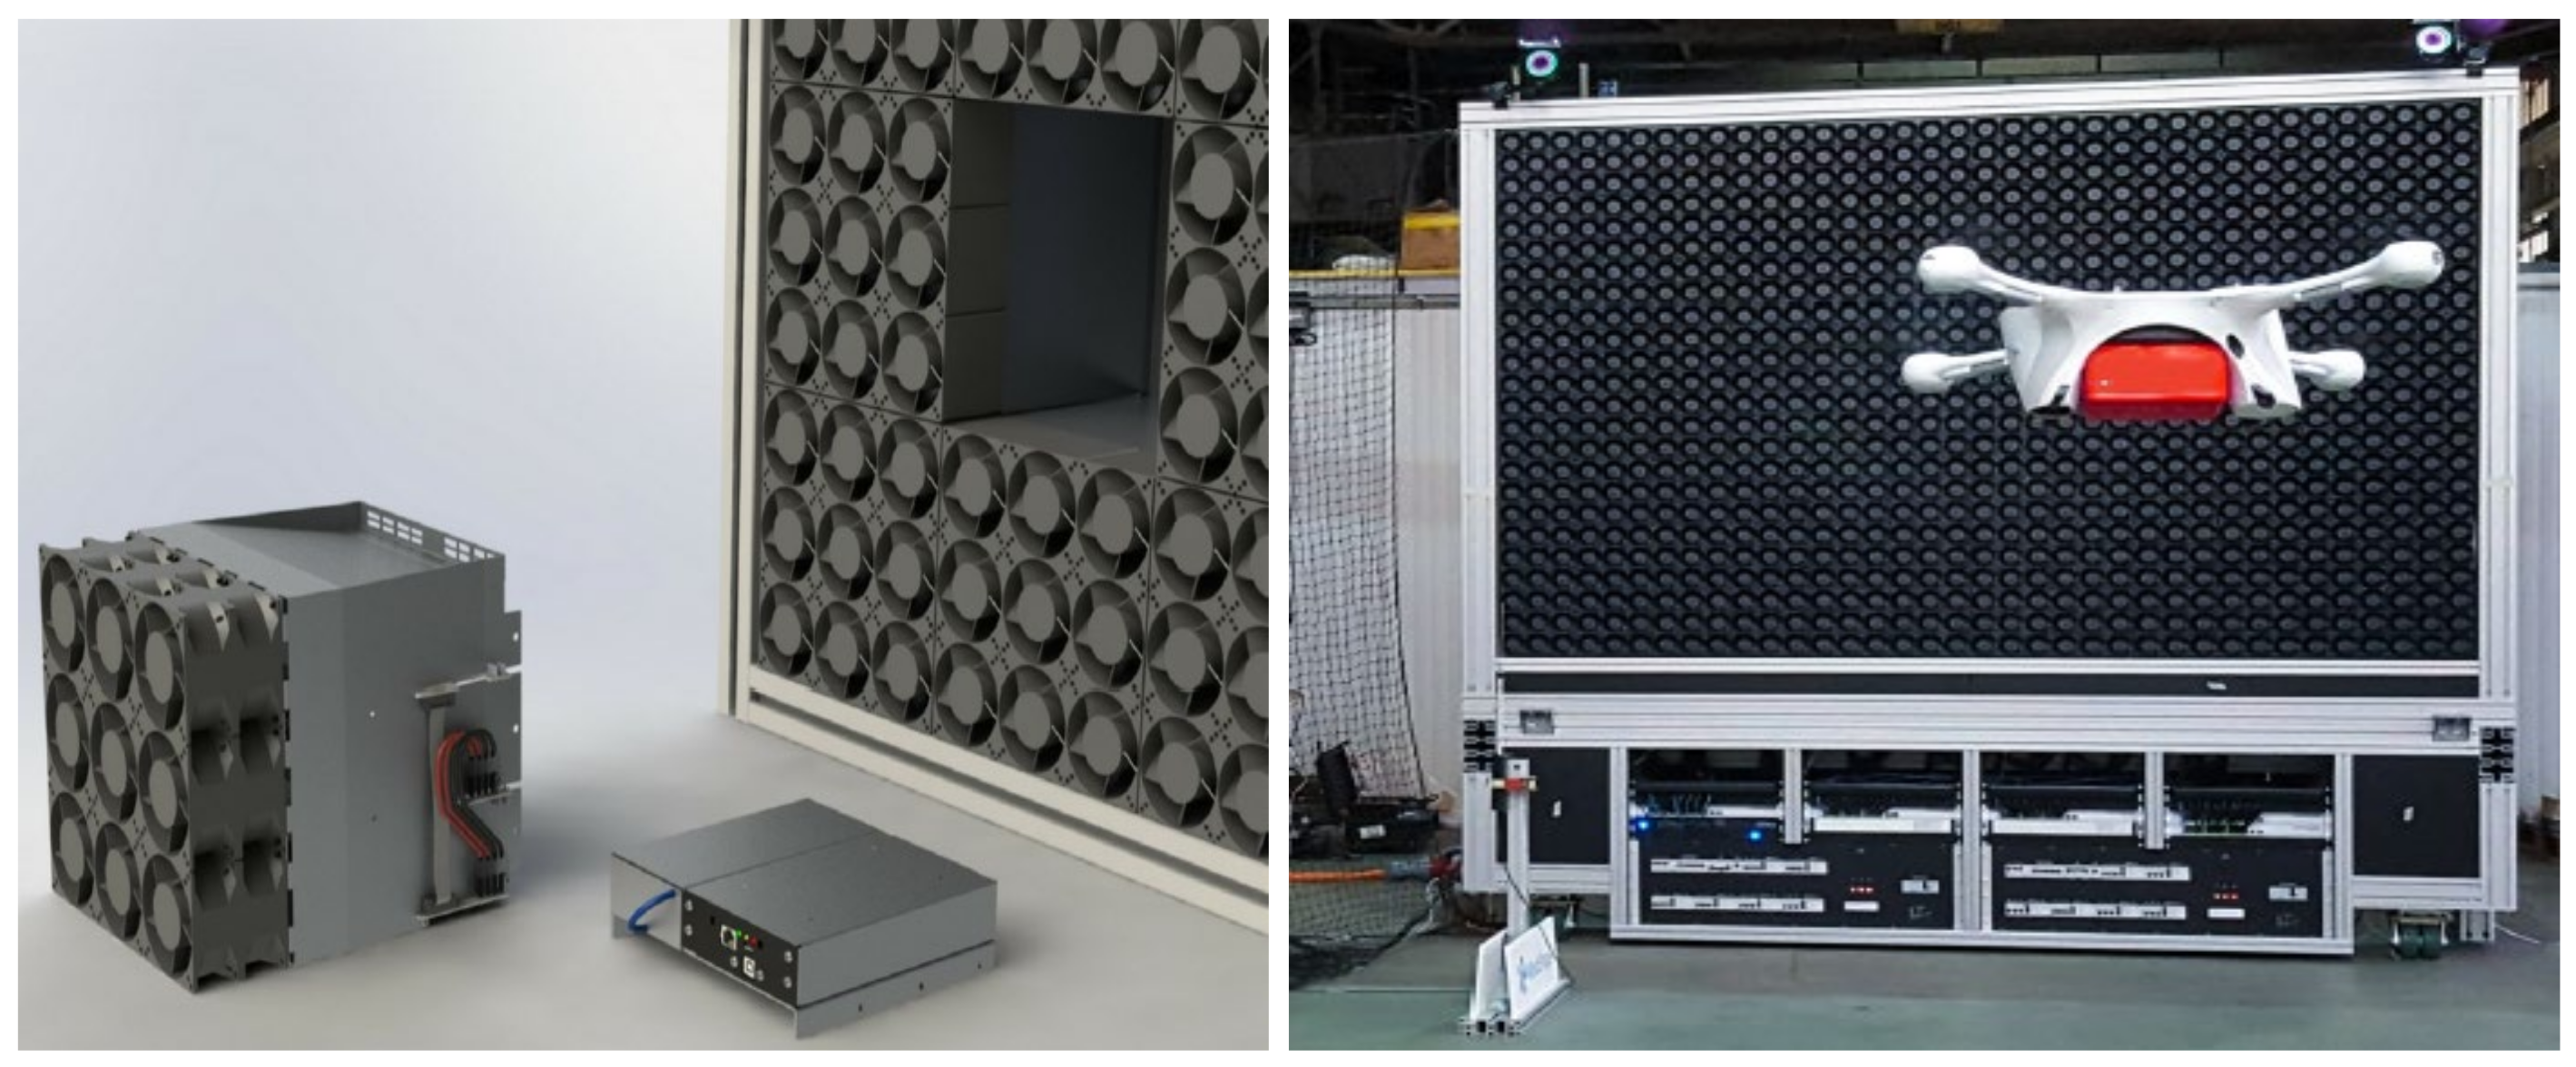
5.3. Cluster 3: Experimental

There are many ways to obtain urban wind field data experimentally, and so far, the UAM community has utilized wind tunnels, experimental flight tests, and novel wind simulator facilities like WindShape, which is developed and utilized to conduct free drone flight tests under various atmospheric conditions in a controlled environment [81,82]. WindShape employs multifan technology (refer to Figure 11), where multiple fans are stacked on top of each other in an arbitrary array, and each fan can be independently controlled, allowing for faster changes and reproduction of high-intensity gusts and wind shear; while such technology can be used to test the integrity of the UAM aircraft structure and system performance, it may not be enough to exactly replicate wind flow for an urban environment.
ABL wind tunnel tests are conducted on a 1:400 scale urban landscape model to identify the areas with severe flow conditions for UAM applications [83] and to support a case study that is focused on determining vertiport operation interruptions by unfavorable weather conditions [84]. The test conditions are diversified with respect to wind direction, and the data are measured using probes at 36 select locations across the down-scaled model. The wind tunnel results prove that the wind speed in an urban environment varies widely, along with altitude and wind direction, when compared to local weather station reports, establishing the fact that atmospheric wind modelling for urban environments is a complex and onerous process.
In [85], a low-speed gust wind tunnel is employed to emulate two types of gust response, isolated 1-cosine shape and continuous gust, and to perform free-flight tests with the help of a motion capture sensor system for evaluating the gust response of a prototype small UAS. However, wind tunnel tests are quite expensive, despite their ability to produce near-realistic urban conditions. Thus, operational or test flights could be another way of conveniently collecting wind data for the urban environment. For example, in [86], the authors perform live UAS flight tests in authorized airspace to characterize the effects of adverse weather on flight performance through the data obtained from onboard sensors. The study states that sudden bursts of gusts were prevalent throughout the testing phase. However, one of the major disadvantages of such flight tests would be the operational risks involved and the strict need for the careful fabrication of robust risk mitigation procedures.

5.4. Cluster 4: CFD

CFD models, in general, trade-off between computation time, expense, and accuracy. That is, a model that predicts wind flow field for an urban environment with increased accuracy will usually have a higher computational expense and time, and vice versa.
In [87], Joint Outdoor–Indoor Urban Large Eddy Simulation (JOULES), a GPU-enabled LES-based CFD solver that can predict urban wind fields 150 times faster than the traditional LES model for a resolution of 0.3 m, is assessed for suitability to be applied within the UAM domain. Likewise, ref. [88] compares two CFD techniques, steady-state RANS and unsteady IDDES (Improved Delayed Detached Eddy Simulation) against static anemometer observations and drone-gathered weather measurements. The paper claims that RANS provides an accurate and informative model when compared to averaged observation data, while IDDES poses as a suitable model representing the turbulent leeward side when the comparison is made with the drone-gathered data. JOULES, RANS, IDDES, and LES can all produce wind flow fields for UAM applications. But CFD models take more than an hour (or even days) to attain convergence and hence cannot be used for routine UAM usage [89]. This is due to the computing capacity limitations. However, this issue can be partially solved by the generation of a database or wind atlas. In fact, one of the oldest papers (published in 2011) found for this review article, focusing on the modelling of wind fields for unmanned rotorcraft flight in an urban setting, uses a “Wind Simulation Database (WSD)”, which contains data from RANS and k- ε -based CFD simulations for different building geometries [90].

5.5. Cluster 5: Spectral

Several papers that investigate gust loads on UAM aircraft were seen to use the traditional von Kármán and Dryden models for simulating gusts; however, the urban built environment would violate many core assumptions made within these models [94,105]. Thus, low-altitude turbulence flow field generating software such as TurbSim is seen to be used to assess flight responses of different-sized quadcopters [91]. TurbSim is a stochastic inflow turbulence generator that allows the user to choose a range of spectral methods like Kaimal, Risø smooth terrain model, etc., to produce time series data of the 3D turbulence velocity components [106]. Furthermore, in [92], a novel spectral method is developed based on Taylor’s frozen turbulence hypothesis and von Kármán’s turbulence model with third and fourth order shaping filters to study rotorcraft pilot workload for operations in low-altitude atmospheric turbulence. The authors use pre-warped Tustin’s transformation to discretize the shaping filters and obtain the 3D turbulence components within a specific frequency range for more accuracy in turbulence modelling. It is claimed that this innovative method can generate high-intensity turbulence by also considering the terrain roughness. However, it is still unclear how accurately this method can imitate urban atmospheric wind conditions.

5.6. Cluster 6: Semi-Empirical

Researchers from MIT use WRF models for predicting the wind conditions for an area in Dallas–Fort Worth to evaluate the wind constraints in the AAM operating airspace [93]. Three domains with different sizes, i.e., 2.5 km, 500 m, and 100 m, are nested within the WRF model. Data from HRRR (High-Resolution Rapid Refresh) are used to set the initial and boundary conditions of the 2.5 km domain. WRF is a mesoscale model, but the authors state that WRF could be a good starting point for increased weather awareness for AAM operations, nonetheless.

5.7. Cluster 7: Miscellaneous

This section provides a list of papers that are based on extensive literature reviews, including novel nontechnical ideas and measurement suitability assessments.
Refs. [95,96,97] are literature review papers that discuss the following: 1. wind sensing and simulation techniques; 2. effects of urban wind flow on UAS operations; and 3. UAM sectors focus on now-casting techniques like data assimilation, machine-learning algorithms, and variational and time-series analysis in combination with CFD techniques to estimate urban wind parameters accurately and efficiently. Likewise, ref. [94] provides a detailed description of the effects of gusts on fixed-wing UAVs operating close to obstacles, and a case study of the effects of gusts on UAM operations with the help of a CFD-based wind model from [59].
Refs. [98,99] advocate for a crowdsourcing approach to collect weather data for UAM applications by introducing a “crowdsensing” model that the authors define as a “cyber-physical urban meteorological observational system”. The overall idea of the paper is to collect quality dynamic urban weather data from mobile phone apps, passive IoT devices with sensors, etc. This could be a smart idea; however, there will be a need for the involvement and agreement of many stakeholders for the successful enforcement of such models.
In [100], the authors explore three turbulence models, von Kármán, Kaimal, and LES, to model low-altitude atmospheric turbulence as part of an investigation to determine the dynamic response of a flexible aircraft. The paper assumes a neutral atmospheric boundary layer and flat surface with three different roughness values defining three flow conditions for a robust comparison of results from the three wind models. The authors claim that Kaimal and LES agree well with the vertical mean velocity profiles, whereas von Kármán performs poorly beyond the reference altitude. In the same suitability assessment category, NASA researchers compare LiDAR- and SoDAR-based wind measurement data with onboard IMU data of UAS [101]. The paper discusses the advantages and disadvantages of each system and concludes by stating that the usage of a combination of wind measurement techniques should be considered for enhancing the safety of UAV operations in urban environments. Another paper that discusses the development of ground-based remote sensing systems using a combination of Doppler weather radars and wind LiDARs is [102] by TruWeather Solutions (TWS), a microweather analytics and technology company that collaborates with NASA and other field players like DM-AirTech and ResilienX to develop weather solutions for the development of AAM.
Lastly, in [103,104], high-fidelity LES data of over an hour are integrated into an additional “wind module” within the AirSim simulator’ however, since the papers are mainly focused on developing and validating a simulator user interface that displays the wind data, there is not much information provided on how the wind is modelled within the “wind module”.

6. Summary and Remarks

The extensive body of research on urban wind flow reveals that a multitude of factors, including diurnal variations, the Coriolis effect, altitude changes, geographic positioning, topography, surface roughness, flow incidence angle, building and street configurations, building aspect ratios, roof shapes, and building heights, collectively shape the wind flow characteristics within the UBL. As a result, the wind velocity and fluctuation components within the UBL exhibit frequent spatio-temporal variations and complex flow patterns or regions that are distinct from those encountered at high altitudes where traditional aircraft typically operate for most of their flight duration. This underscores the necessity to evaluate and integrate the low-altitude urban microscale wind data within the UAM system design, development, and testing to ensure the safe operations of UAM. Moreover, it can be said that these convoluted flow features and variations contribute significantly to the scarcity of observational wind data for urban environments, as observing or recording such highly dynamic flows would require the emplacement of multiple sensors at different altitudes and sides of the building, street, etc.
The general review of the wind models used for weather forecasting, pollution dispersion, etc., unveiled that the atmospheric wind simulations can be differentiated into spatial and temporal classifications based on the prediction resolution and time. To establish a more structured approach and analysis for this paper, these simulations were initially segmented into six categories, following the modelling techniques (refer to Figure 7), before being distinguished under the different spatial and temporal classes. The analysis indicated that high-fidelity CFD methods like LES or RANS, semi-empirical mesoscale models like WRF, and weather satellite-based observation data are commonly employed for weather forecasting, pollution dispersion, and pedestrian comfort estimation by atmospheric scientists. On the contrary, spectral models like Kaimal, Mann, etc., and statistical methods like machine learning and AI were observed to be used for the determination of wind turbine loads and wind power generation forecasts within the wind engineering community. Furthermore, it was noted that the prediction resolution depended on the nature of the application, the type of research, and the results sought, while the accuracy and prediction time were directly proportional to the prediction resolution—i.e., realistic models or models that employed finer grids were seen to generate accurate predictions but take a longer time, and simplified models were noted to produce less accurate results for a shorter time. To overcome this setback in simulation, many papers that are in the context of the atmospheric science discipline suggest dimensionality reduction for wind modelling. However, there is still a lot of information disparity within the existing research on the parameters that highly affect and influence the urban wind flow to enable this solution. Similarly, an alternative option, which is discerned to be trending among the recent publications on wind modelling, is the use of hybrid models that encompass two or more wind modelling types and assimilation techniques. This rising trend is also visible within the UAM sector.
The majority of the current research that discusses the effects of wind on UAM aircraft controls, rotor performance, etc., seems to delve into the utilization of standardized von Kármán and Dryden wind turbulence models, which represent the turbulence scale as a constant value, in contradiction to the reality of urban wind flow conditions. Moreover, only 42 publications were found to be disseminated, from 2011 to 2023, with regard to the incorporation and representation of low-altitude urban wind data in the context of UAM applications. This denotes that there remains a notable lack of research and awareness within the UAM community about the effects of low-altitude urban microscale wind conditions on the safety of UAM.
The 42 identified papers were grouped into seven clusters, as described in Table 3, for comprehensive literary analysis, and the following points provide a summary of deductions drawn from this review:
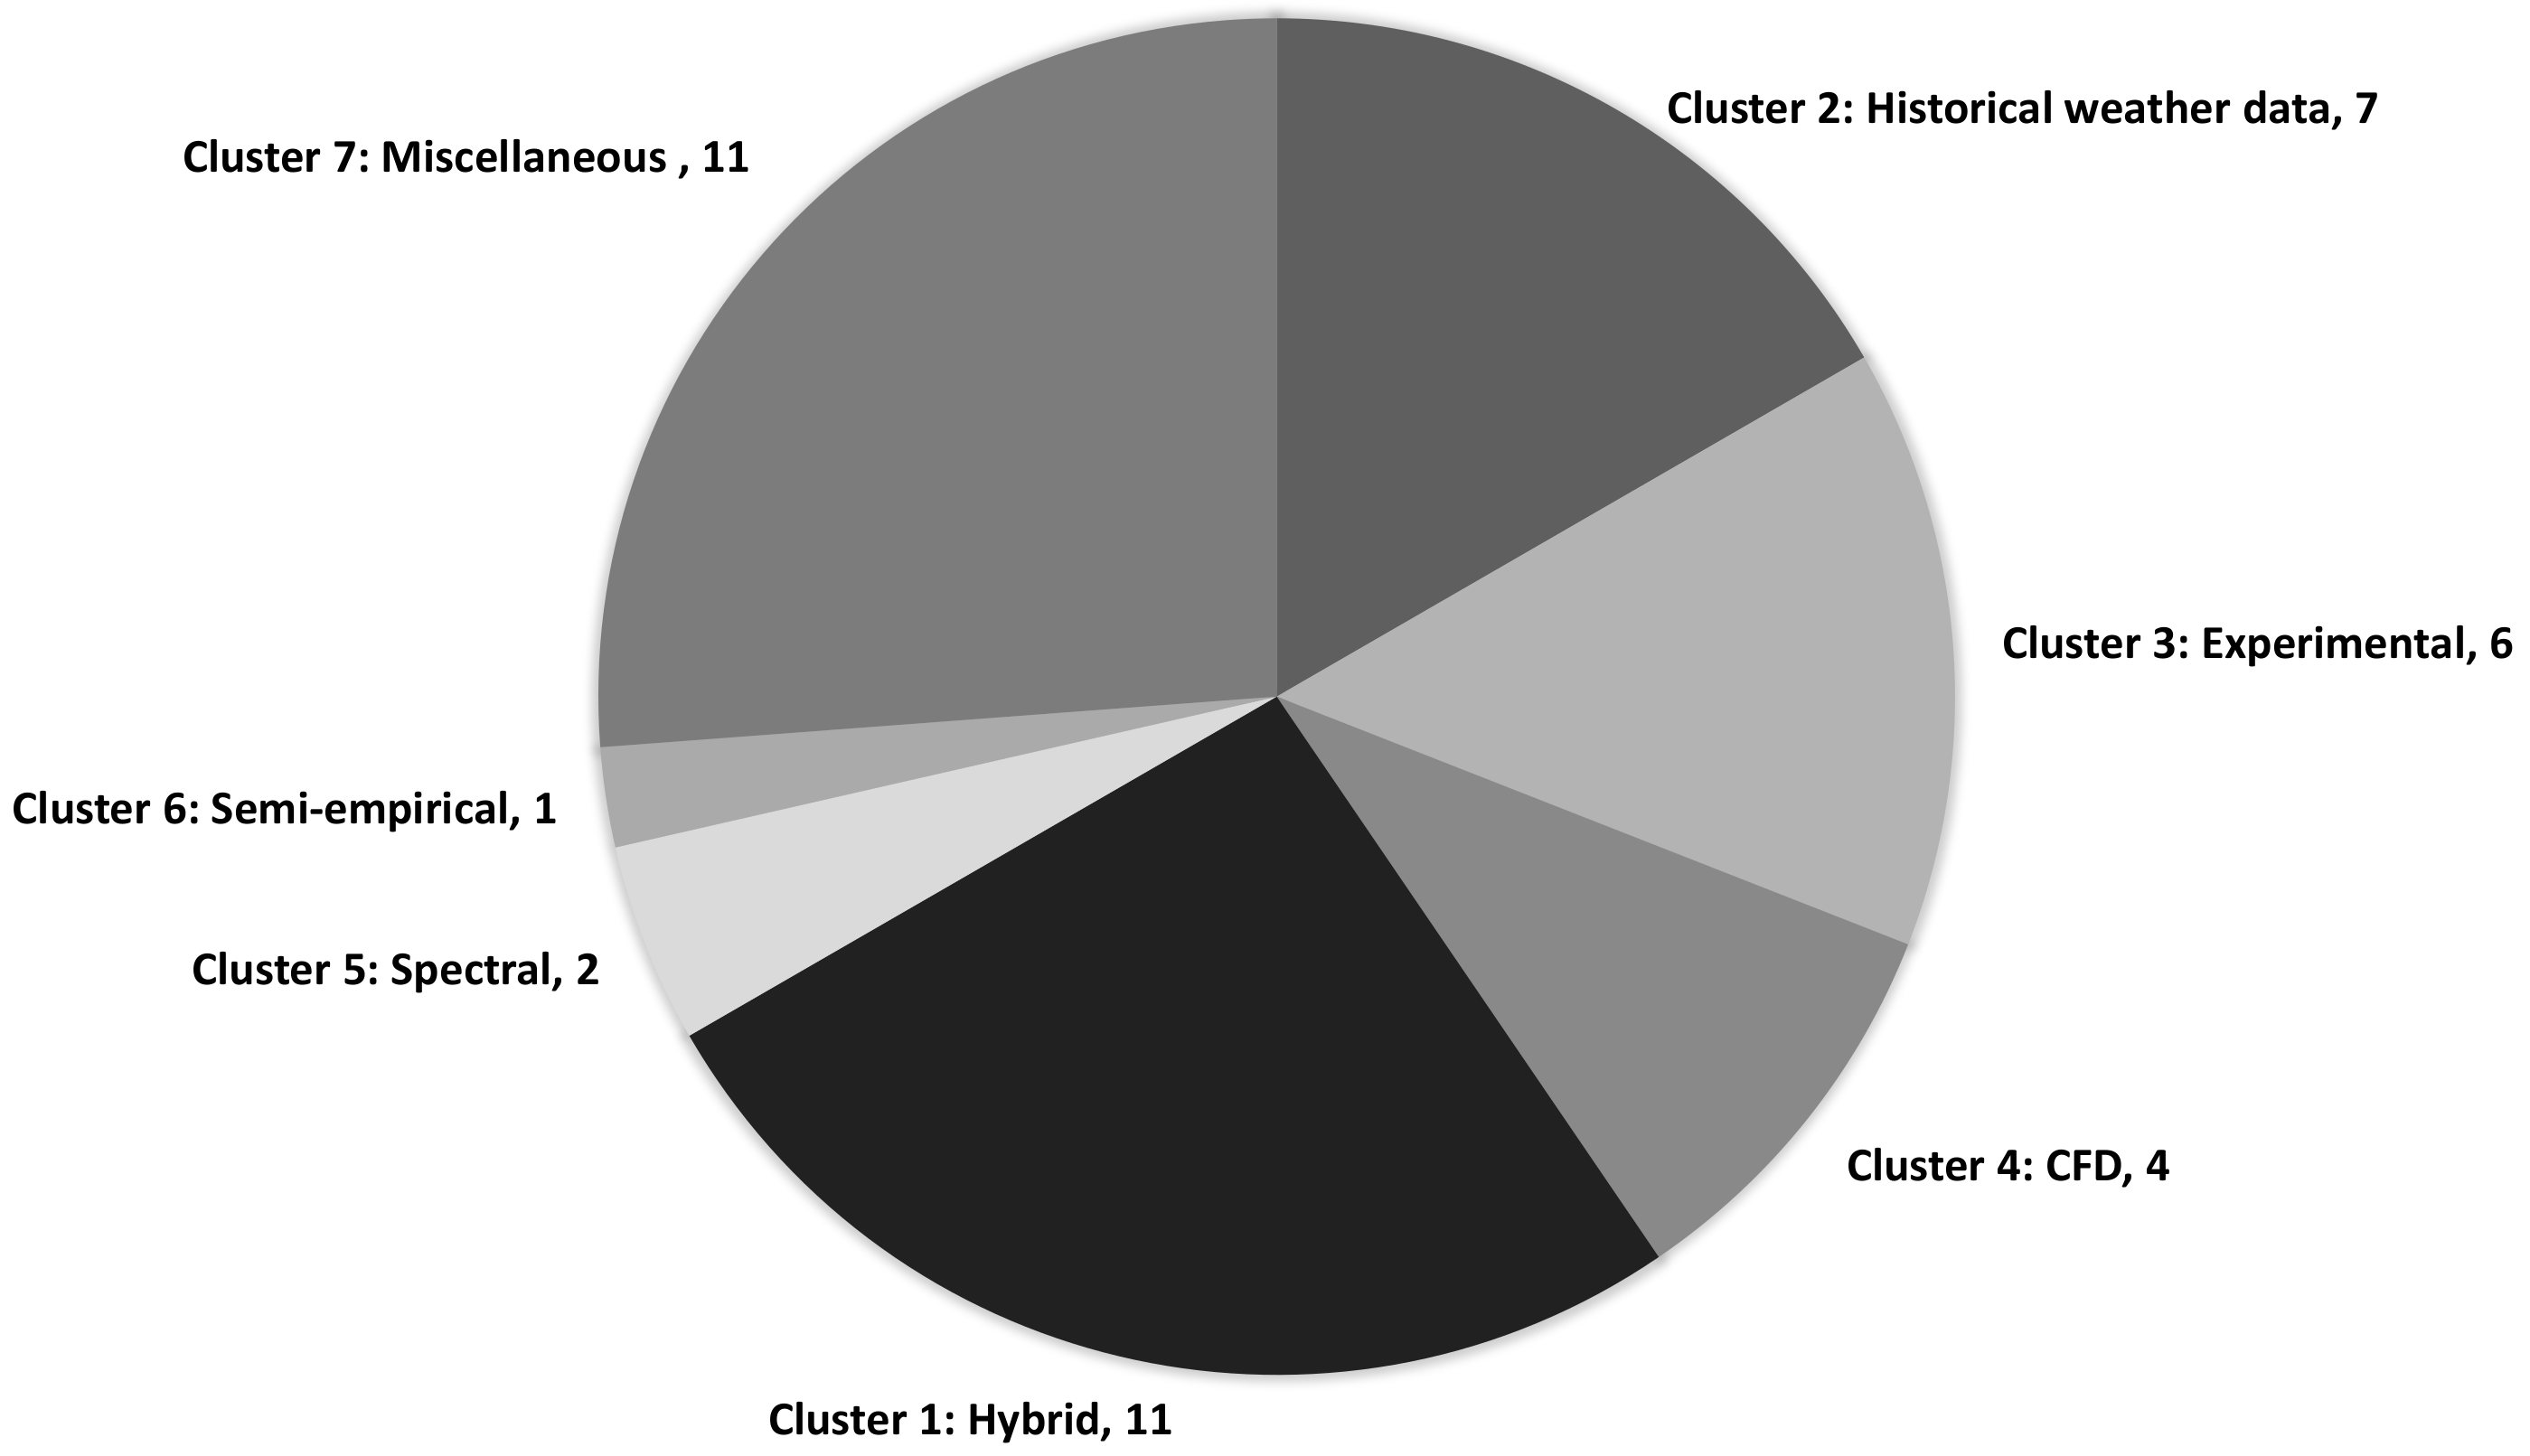
  • About 26% of the 42 papers explore the potential of hybrid models in estimating urban wind fields for UAM. These models integrate WRF, historical weather data, ML, or AI with CFD to generate accurate results with less computational time and expense. However, it was observed that the prediction accuracy and time varied depending on the selection of coupled models. That is, a hybrid model that nested CFD methods like RANS within a WRF mesoscale domain had a computation time of more than a few hours for increased accuracy, in contrast to an ML + CFD based model that had a comparatively shorter prediction time. Thus, the choice of the models to be combined must be carefully considered, as overly simplified models lack accuracy, CFD-based models have a higher convergence time, and ML- or AI-based model accuracy depends on the training data.
  • All the papers included in this review consistently emphasize the discordant UAM demand for faster and more accurate wind forecasting models. However, the existing ConOps, or the certification standards, do not specify how accurate and fast these wind forecasts or models should be, —i.e., there are no requirements that quantify the maximum and minimum expected uncertainties, latency, etc.— nor do they specify which wind parameters to use and how the wind data must be dispensed by the weather service providers. Moreover, the interpretation of the terms “faster” and “accurate” may vary depending on the context of the application. For example, precise real-time weather forecasts are vital during landing, approach, cruise, hover, and transitional flight phases to enable timely decision making for in-flight safety systems and for enhancing operational safety management. Conversely, near-real-time forecasts might suffice for the takeoff phase to strategically postpone, reject, or reschedule flight operations if adverse wind conditions are detected at the touchdown and lift-off (TLOF) and final approach and takeoff (FATO) areas. Similarly, wind modelling for urban wind database generation to determine the certification standards and operational guidelines could slightly trade prediction time for accuracy. On the whole, these deductions indicate that there is still ambiguity in determining the weather requirement standards.
  • Current research on wind modelling for UAM applications is limited, as around 48% of the papers that discuss microscale wind modelling for UAM from a generic standpoint suggest the use of CFD, but it is evident from the review in Section 3 that there are wind modelling systems, like QES-winds, Quic-Urb, URock, etc., that use highly parameterized methods for ultrafast wind prediction. Similarly, turbulence models like Kaimal, Mann, etc., used within the wind engineering domain to depict low-altitude wind conditions may also be applicable and efficient for use within the UAM sector.
  • With regard to the varying accuracy and prediction time of the wind models, it can be inferred that the technique used for generating microscale wind data would vary depending on the UAM application scenario. For example, LES and DNS are not applicable for UAM operational forecasts; however, the data from these methods could be used for validating wind data from low-fidelity simulators. RANS could be used to simulate wind fields for multiple scenarios and test conditions, and the data generated from these tests could be stored in a database to define AD levels for different flight phases and UAM configurations. Similarly, an initial high-level qualitative suitability and efficiency evaluation of other microscale wind field simulators can be performed for diverse UAM applications as shown in Table 4.
Furthermore, this research could be expanded to quantitatively assess the effectiveness of highly parameterized wind models, like QES-winds, Quic-Urb, or URock, for UAM applications through replication of high-fidelity wind simulations (such as wind tunnel tests, DNS, or LES simulations) and results comparison. This would facilitate the estimation and analysis of wind model uncertainties, identification of the underlying physical reasons for uncertainty, and refinement of wind models for UAM applications. Moreover, the quantification of wind prediction uncertainties would aid in incorporating sufficient safety buffers within the UAM certification standards and operational guidelines. Additionally, hybrid models that comprise numerical weather predictors like WRF, highly parameterized systems, and low-altitude turbulence generators like TurbSim should be developed and explored to generate and forecast data for UAM certification and routine operations.
Overall, this manuscript cataloged several microscale wind models which can be used to generate synthetic wind data for diverse UAM applications. The insights from this literature review can assist the UAM community in making well-informed decisions regarding the selection of appropriate wind models for specific UAM research and needs. Additionally, the information contained within this article can serve as a first step to solve some of the larger UAM hindrances, like the identification of exhaustive weather data requirements for UAM operations; specification of standards for designing weather geofences and in-flight safety management system services such as alerts and warnings, dynamic rerouting, collision avoidance, etc.; determination of vertiport emplacements within the city; design of TLOF and FATO zones; and assessment of UAM aircraft operational limits for different atmospheric disturbance levels.

Author Contributions

Conceptualization, D.S.N. and G.Q; methodology, software, formal analysis, writing—original draft preparation, D.S.N.; writing—review and editing, V.M. and G.Q; writing—review, M.L; supervision, G.Q., V.M. and M.L. All authors have read and agreed to the published version of the manuscript.

Funding

This research was conducted under the REDI (RMIT European Doctoral Innovators) Program. This project has received funding from the European Union’s Horizon 2020 research and innovation programme under the Marie Skłodowska-Curie grant agreement no. 101034328.

Data Availability Statement

The data are available upon request from the corresponding author.

Conflicts of Interest

The authors declare no conflicts of interest. Results reflect the authors’ view only. The European Union had no role in the design of the study; in the collection, analysis, or interpretation of data; in the writing of the manuscript; or in the decision to publish the results. The Research Executive Agency is not responsible for any use that may be made of the information the article contains.

References

  1. European Union Aviation Safety Agency (EASA). Study on the Societal Acceptance of Urban Air Mobility in Europe; European Union Aviation Safety Agency (EASA): Cologne, Germany, 2021.
  2. Federal Aviation Administration (FAA). Urban Air Mobility (UAM): Concept of Operations v2.0; US Department of Transportation, Federal Aviatiom Administration (FAA), Office of NextGen: Washington, DC, USA, 2023.
  3. European Union Aviation Safety Agency (EASA). Special Condition Vertical Take-Off and Landing (VTOL) Aircraft; European Union Aviation Safety Agency (EASA): Cologne, Germany, 2019.
  4. European Union Aviation Safety Authority EASA. Vertiports: Prototype Technical Specifications for the Design of VFR Vertiports for Operation with Manned VTOL-Capable Aircraft Certified in the Enhanced Category (PTS-VPT-DSN); European Union Aviation Safety Agency EASA: Cologne, Germany, 2022.
  5. Doo, J.T.; Tsairides, M.A.; Pavel, M.D.; Smith, M.; Didey, A.; Bennet, E.; Hange, C.; Bromfield, M.; Diller, N.P.; Mooberry, J. NASA Electric Vertical Takeoff and Landing (eVTOL) Aircraft Technology for Public Services—A White Paper (NASA Transformative Vertical Flight Working Group 4 (TVF4)); Technical Report; NASA: Washington, DC, USA, 2021. [Google Scholar]
  6. Ranquist, E.; Steiner, M.; Argrow, B. Exploring the range of weather impacts on UAS operations. In Proceedings of the 18th Conference on Aviation, Range and Aerospace Meteorology, Seattle, WA, USA, 22–26 January 2017. [Google Scholar]
  7. Reiche, C.; Cohen, A.P.; Fernando, C. An initial assessment of the potential weather barriers of Urban Air Mobility. IEEE Trans. Intell. Transp. Syst. 2021, 22, 6018–6027. [Google Scholar] [CrossRef]
  8. Hamilton, B.A. Urban Air Mobility (UAM) Market Study—Final Report; Technical Report; NASA: Washington, DC, USA, 2018. [Google Scholar]
  9. Federal Aviation Administration (FAA). Unmanned Aircraft System (UAS) Traffic Management (UTM): Concept of Operations, v2.0; FAA: Washington, DC, USA, 2020. [Google Scholar]
  10. EUROCONTROL. U-Space ConOps and Architecture, 4th ed.; EUROCONTROL, European Union: Brussels, Belgium, 2023. [Google Scholar]
  11. Geister, D.; Korn, B. Blueprint: Concept for Urban Airspace Integration, v1.0; Technical Report; Institute of Flight Guidance, DLR: Cologne, Germany, 2017. [Google Scholar]
  12. Bauranov, A.; Rakas, J. Designing airspace for urban air mobility: A review of concepts and approaches. Prog. Aerosp. Sci. 2021, 125, 100726. [Google Scholar] [CrossRef]
  13. Lascara, B.; Lacher, A.; DeGarmo, M.; Maroney, D.; Niles, R.; Vempati, L. Urban Air Mobility Airspace Integration Concepts; Technical Report; The MITRE Corporation: Bedford, MA, USA, 2019. [Google Scholar]
  14. European Union Aviation Safety Agency EASA. Proposed Means of Compliance with the Special Condition VTOL (MOC SC-VTOL); European Union Aviation Safety Agency EASA: Cologne, Germany, 2021; Issue 2.
  15. Cohen, A.P.; Shaheen, S.A.; Farrar, E.M. Urban Air Mobility: History, Ecosystem, Market Potential, and Challenges. IEEE Trans. Intell. Transp. Syst. 2021, 22, 6074–6087. [Google Scholar] [CrossRef]
  16. Annon. Elsevier Scopus APIs: Getting Started Guide (User Guide); Elsevier R&D Solutions: Amsterdam, The Netherlands, 2023. [Google Scholar]
  17. Federal Aviation Administration FAA. Engineering Brief 105—Vertiport Design; Federal Aviation Administration FAA: Washington, DC, USA, 2022.
  18. Grimmond, C.S.B.; Oke, T.R. Turbulent heat fluxes in urban areas: Observations and a local-scale urban meteorological parameterisation scheme (LUMPS). J. Appl. Meteorol. Climatol. 2002, 41, 792–810. [Google Scholar] [CrossRef]
  19. Britter, R.E.; Hanna, S.R. Flow and Dispersion in Urban Areas. Annu. Rev. Fluid Mech. 2003, 35, 469–496. [Google Scholar] [CrossRef]
  20. Stull, R. An Introduction to Boundary Layer Meteorology; Kluwer Academic Publishers: Dordrecht, The Netherlands, 1988. [Google Scholar]
  21. Bottema, M. Urban roughness modeling in relation to pollutant dispersal. Atmos. Environ. 1997, 31, 3059–3075. [Google Scholar] [CrossRef]
  22. Richardson, L.F. Weather Prediction by Numerical Process; Cambridge University Press: London, UK, 1922. [Google Scholar]
  23. Gultepe, I.; Sharman, R.; Williams, P.D.; Zhou, B.; Ellrod, G.; Minnis, P.; Trier, S.; Griffin, S.; Yum, S.S.; Gharabaghi, B.; et al. A Review of High Impact Weather for Aviation Meteorology. Pure Appl. Geophys. 2019, 176, 1869–1921. [Google Scholar] [CrossRef]
  24. Aviation Weather Handbook; U.S. Department of Transportation & Federal Aviation Administration (FAA): Washington, DC, USA, 2022; Chapter 19.
  25. Lang, P.R.; Lombargo, F.S. (Eds.) Atmospheric Turbulence, Meteorological Modelling and Aerodynamics; Nova Science Publishers, Inc.: New York, NY, USA, 2010. [Google Scholar]
  26. Peterka, J.A.; Meroney, R.N.; Kothari, K.M. Wind flow patterns around buildings. J. Wind Eng. Ind. Aerodyn. 1985, 21, 21–38. [Google Scholar] [CrossRef]
  27. Blocken, B.; Stathopoulos, T.; Carmeliet, J.; Hensen, J. Application of computational fluid dynamics in building performance simulation for the outdoor environment: An overview. J. Build. Perform. Simul. 2011, 4, 157–184. [Google Scholar] [CrossRef]
  28. Pourteimouri, P.; Campmans, G.H.P.; Wijnberg, K.M.; Hulscher, S. A Numerical Study on the Impact of Building Dimensions on Airflow Patterns and Bed Morphology around Buildings at the Beach. J. Mar. Sci. Eng 2022, 10, 13. [Google Scholar] [CrossRef]
  29. Hunt, J. The effect of single buildings and structures. Philos. Trans. R. Soc. Lond. Ser. A Math. Phys. Sci. 1971, 269, 457–467. [Google Scholar]
  30. Hunt, J. Fundamental studies of wind flow near buildings. In Models and Systems in Architecture and Building—LUBFS; Conference Proceedings No. 2; Construction Press: Berlin, Germany, 1975. [Google Scholar]
  31. Xie, Z.T.; Coceal, O.; Castro, I.P. Large-Eddy Simulation of flows over Random Urban-like Obstacles. Bound.-Layer Meteorol. 2008, 129, 1–23. [Google Scholar] [CrossRef]
  32. Kima, J.J.; Baikb, J.J. A numerical study of the effects of ambient wind direction on flow and disperion in urban street canyons using the RNG k–e turbulence model. Atmos. Environ. 2004, 38, 3039–3048. [Google Scholar] [CrossRef]
  33. Jacobson, M.Z. Fundamentals of Atmospheric Modelling, 2nd ed.; Cambridge University Press: Cambridge, UK, 2005. [Google Scholar]
  34. Soman, S.S.; Zareipour, H.; Malik, O.; Mandal, P. A review of wind power and wind speed forecasting methods with different time horizons. In Proceedings of the North American Power Symposium 2010, Arlington, TX, USA, 26–28 September 2010; pp. 1–8. [Google Scholar]
  35. Cermak, J. Wind tunnel design for physical modelling of atmospheric boundary layers. J. Eng. Mech. Div. ASCE 1981, 108, 523–642. [Google Scholar]
  36. Aly, A.M. Atmospheric Boundary-Layer simulation for the built environment: Past, present and future. Build. Environ. 2014, 75, 206–221. [Google Scholar] [CrossRef]
  37. Lee, R.G.; Zan, S.J. Wind tunnel testing of a helicopter fuselage and rotor in a ship airwake. J. Am. Helicopter Soc. 2004, 49, 149–159. [Google Scholar] [CrossRef]
  38. Taymourtash, N.; Zagaglia, D.; Zanotti, A.; Muscarello, V.; Gibertini, G.; Quaranta, G. Experimental study of a helicopter model in shipboard operations. Aerosp. Sci. Technol. 2021, 61, 97–108. [Google Scholar] [CrossRef]
  39. Stoll, R.; Gibbs, J.A.; Salesky, S.T.; Anderson, W.; Calaf, M. Large-Eddy Simulation of the Atmospheric Boundary Layer. Bound. Layer Meteorol. 2020, 177, 541–581. [Google Scholar] [CrossRef]
  40. Damle, R.; Soria, M.; Lehmkuhl, O.; Colomer, G.; Oliva, A. Large Eddy Simulation of Airflow in a Single-Family House. In Proceedings of the International High Performance Buildings Conference, West Lafayette, IN, USA, 24–28 May 2010. [Google Scholar]
  41. Sarlak, H. Large Eddy Simulation of Turbulent Flows in Wind Energy. Ph.D. Thesis, DTU Wind Energy, Copenhagen, Denmark, 2014. [Google Scholar]
  42. Gronemeler, T.; Surm, K.; Harms, F.; Leitl, B.; Maronga, B.; Raasch, S. Evaluation of the dynamic core of the PALM model system 6.0 in a neutrally stratified urban environment: Comparison between LES and wind tunnel experiments. Eur. Geosci. Union 2021, 14, 3317–3333. [Google Scholar]
  43. Toja-Silva, F.; Kono, T.; Peralta, C.; Lopez-Garcia, O.; Chen, J. A review of computational fluid dynamics (CFD) simulations of the wind flow around buildings for urban wind energy exploitation. J. Wind Eng. Ind. Aerodyn. 2018, 180, 66–87. [Google Scholar] [CrossRef]
  44. Zhang, A.; Gao, C.; Zhang, L. Numerical simulation of the wind field around different building arrangements. J. Wind Eng. Ind. Aerodyn. 2005, 93, 891–904. [Google Scholar] [CrossRef]
  45. Longo, R.; Ferrarotti, M.; Sanchez, C.G.; Derudi, M.; Parente, A. Advanced turbulence models and boundary conditions for flows around different configurations of ground-mounted buildings. J. Wind Eng. Ind. Aerodyn. 2017, 167, 160–182. [Google Scholar] [CrossRef]
  46. Hertwig, D.; Patnaik, G.; Leitl, B. LES validation of urban flow-part 1-flow statistics and frequency distribution. Environ. Fluid. Mech. 2017, 17, 521–550. [Google Scholar] [CrossRef]
  47. US Department of Defense Interface Standard. Flying Qualities of Piloted Aircraft (MIL-STD-1797A); Technical Report; Federal Aviation Administration (FAA): Washington, DC, USA, 2004.
  48. Dong, L.; Lio, W.H.; Simley, E. On turbulence models and lidar measurements for wind turbine control. Wind Energy Sci. 2021, 6, 1491–1500. [Google Scholar] [CrossRef]
  49. Jones, A.R.; Cetiner, O.; Smith, M.J. Physics and Modeling of Large Flow Disturbances: Discrete Gust Encounters for Modern Air Vehicles. Annu. Rev. Fluid Mech. 2022, 54, 469–493. [Google Scholar] [CrossRef]
  50. Tahbaz, M. Estimation of the Wind Speed in Urban Areas—Height less than 10 Metres. Int. J. Vent. 2009, 8, 75–84. [Google Scholar] [CrossRef]
  51. Bernard, J.; Lindberg, F.; Oswald, S. URock 2023a: An open-source GIS-based wind model for complex urban settings. Geosci. Model Dev. 2023, 16, 5703–5727. [Google Scholar] [CrossRef]
  52. Bozorgmehr, B.; Willemsen, P.; Margairaz, F.; Gibbs, J.A.; Patterson, Z.; Stoll, R.; Pardyjak, E.R. QES Winds v 1.0: Theory and User’s Guide; University of Utah: Salt Lake City, UT, USA, 2021. [Google Scholar]
  53. Pardyjak, E.R.; Brown, M.J. QUIC URB v. 1. 1 Theory and User’s Guide; Technical Report; Los Alamos National Laboratory: Los Alamos, NM, USA, 2003. [Google Scholar]
  54. Sharma, A.; Fernando, H.J.S.; Hamlet, A.F.; Hellmann, J.J.; Barlage, M.; Chen, F. Urban meteorological modeling using WRF: A sensitivity study. Int. J. Climatol. 2017, 37, 1885–1900. [Google Scholar] [CrossRef]
  55. Cheng, W.Y. A literature review of wind forecasting methods. J. Power Energy Eng. 2014, 2, 161. [Google Scholar] [CrossRef]
  56. Yu, E.; Xu, G.; Han, Y.; Li, Y. An efficient short-term wind speed prediction model based on cross-channel data integration and attention mechanisms. Energy 2022, 256, 124569. [Google Scholar] [CrossRef]
  57. Mi, L.; Han, Y.; Shen, L.; Cai, C.; Wu, T. Multi-scale numerical assessments of urban wind resource using coupled WRF-BEP and RANS Simulation: A case study. Atmosphere 2022, 13, 1753. [Google Scholar] [CrossRef]
  58. Tang, X.Y.; Zhao, S.; Fan, B.; Peinke, J.; Stoevesandt, B. Micro-scale wind resource assessment in complex terrain based on CFD coupled measurement from multiple masts. Appl. Energy 2019, 238, 806–815. [Google Scholar] [CrossRef]
  59. Mohamed, A.; Carrese, R.; Fletcher, D.F.; Watkins, S. Scale-resolving simulation to predict the updraught regions over buildings for MAV orographic lift soaring. J. Wind Eng. Ind. Aerodyn. 2015, 140, 34–48. [Google Scholar] [CrossRef]
  60. Xiao, D.; Heaney, C.E.; Mottet, L.; Fang, F.; Lin, W.; Navon, I.M.; Guo, Y.; Matar, O.K.; Robins, A.G.; Pain, C. A reduced order model for turbulent flows in the urban environment using machine learning. Build. Environ. 2018, 148, 323–337. [Google Scholar] [CrossRef]
  61. Pinto, J.G.; Neuhaus, C.P.; Leckebusch, G.C.; Reyers, M.; Kerschgens, M. Estimation of windstorm impacts over western Germany under future climate conditions using a statistical–dynamical downscaling approach. Tellus A Dyn. Meteorol. Oceanol. 2010, 62, 188–201. [Google Scholar] [CrossRef]
  62. Frank, H.P.; Landberg, L. Modelling the wind climate of Ireland. Bound.-Layer Meteorol. 1997, 85, 359–377. [Google Scholar] [CrossRef]
  63. Tabib, M.V.; Helge, S.; Rasheed, K.T. Towards understanding wind impact for drone operations: A comparison of wind models operating on different scales in a nested multiscale set-up. In Proceedings of the 14th International Conference on CFD in Oil & Gas, Metallurgical and Process Industries, Trondheim, Norway, 12–14 October 2020. [Google Scholar]
  64. Tabib, M.V.; Rasheed, A.; Kvamsdal, T. High-resolution CFD modelling and prediction of terrain-induced wind shear and turbulence for aviation safety. In Proceedings of the National Conference on Computational Mechanics, Austin, TX, USA, 28 July–1 August 2019. [Google Scholar]
  65. Chrit, M.; Majdi, M. Improving wind speed forecasting for Urban Air Mobility using coupled simulations. Adv. Meteorol. 2022, 2022, 2629432. [Google Scholar] [CrossRef]
  66. Seon, D.; Jeong, S. Terrain-driven wind environment generation for UAM. In Proceedings of the Asia-Pacific International Symposium on Aerospace Technology (APISAT 2021), Jeju, Republic of Korea, 15–17 November 2021. [Google Scholar]
  67. Seon, D.; Jeong, S. Urban wind model for UAM using two-way nested WRF-LES. In Proceedings of the Korean Society of Computational Fluid Engineering Conference, Jeju, Republic of Korea, 16–19 November 2022. [Google Scholar]
  68. Chrit, M. Reconstructing urban wind flows for urban air mobility using reduced-order data assimilation. Theor. Appl. Mech. Lett. 2023, 13, 100451. [Google Scholar] [CrossRef]
  69. Vuppala, R.K.S.S.; Kara, K. A novel approach in realistic wind data generation for the safe operation of small Unmanned Aerial Systems in Urban Environment. In Proceedings of the AIAA Aviation Forum, Virtual Event, 2–6 August 2021. [Google Scholar]
  70. Vuppala, R.K.S.S.; Kara, K. A non-intrusive reduced order model using deep learning for realistic wind data generation for small unmanned aerial systems in urban spaces. AIP Adv. 2022, 12, 085020. [Google Scholar] [CrossRef]
  71. Giersch, S.; Guernaoui, O.E.; Raasch, S.; Sauer, M. Atmosphric flow simulation strategies to assess turbulent wind conditions for safe drone operations in urban environments. J. Wind Eng. Ind. Aerodyn. 2022, 229, 105136. [Google Scholar] [CrossRef]
  72. Gianfelice, M.; Aboshosha, H.; Ghazal, T. Real-time Wind Predictions for Safe Drone Flights in Toronto. Results Eng. 2022, 15, 100534. [Google Scholar] [CrossRef]
  73. Ware, J.; Roy, N. An analysis of Wind Field Estimation and Exploitation for Quadrotor Flight in the Urban Canopy Layer. In Proceedings of the 2016 IEEE International Conference on Robotics and Automation (ICRA), Stockholm, Sweden, 16–21 May 2016. [Google Scholar]
  74. Schweiger, K.; Schmitz, R.; Knabe, F. Impact of wind on eVTOL operations and implications for vertiport airside traffic flows: A case study of Hamburg and Munich. Drones 2023, 7, 464. [Google Scholar] [CrossRef]
  75. Oakey, A.; Cherrett, T. Quantifying Weather Tolerance Criteria for Delivery Drones—A UK Case Study. In Proceedings of the International Conference on Unmanned Aircraft Systems (ICUAS), Warsaw, Poland, 6–9 June 2023. [Google Scholar]
  76. Lundby, T.; Christiansen, M.P.; Jensen, K. Towards a weather analysis software framework to improve UAS Operational safety. In Proceedings of the International Conference on Unmanned Aircraft Systems (ICUAS), Atlanta, GA, USA, 11–14 June 2019. [Google Scholar]
  77. Somers, L.A.; Justin, C.Y.; Mavris, D.N. Wind and Obstacles Impact on Airpark Placement for STOL-based Sub-Urban Air Mobility. In Proceedings of the AIAA Aviation Forum, Dallas, TX, USA, 17–21 June 2019. [Google Scholar]
  78. Chan, Y.Y.; Ng, K.K.H.; Lee, C.K.M.; Hsu, L.T.; Keung, K.L. Wind dynamic and energy-efficiency path planning for unmanned aerial vehicles in the lower-level airspace and urban air mobility context. Sustain. Energy Technol. Assessments 2023, 57, 103202. [Google Scholar] [CrossRef]
  79. Lee, L.; Pang, B.; Low, K.H. Weather Data Analytics for safe drone operations in Low-Altitude urban environments. In Proceedings of the AIAA Aviation Forum, Chicago, IL, USA, 27 June–1 July 2022. [Google Scholar]
  80. Hu, X.; Pang, B.; Low, K.H. Wind patterns analysis on temporal scales for safe UAV operations using statistical approaches. In Proceedings of the IEEE & AIAA 41st Digital Avionics Systems Conference (DASC), Portsmouth, VA, USA, 18–22 September 2022. [Google Scholar]
  81. Noca, F.; Bujard, T.; Visvaratnam, G.; Catry, G.; Bosson, N. Flow profiling in a Windshaper for Testing Free-Flying Drones in Adverse Winds. In Proceedings of the AIAA Aviation Forum, Virtual Event, 2–6 August 2021. [Google Scholar]
  82. Noca, F.; Catry, G.; Bosson, N.; Bardazzi, L.J.; Marquez, S.; Gros, A. Wind and weather facility for testing free-flying drones. In Proceedings of the AIAA Aviation Forum, Dallas, TX, USA, 17–21 June 2019. [Google Scholar]
  83. Labbad, M.A.; Wall, A.; Larose, G.L.; Khouli, F.; Barber, H. Experimental investigations into the effect of urban airflow characteristics on urban air mobility applications. J. Wind Eng. Ind. Aerodyn. 2022, 229, 105126. [Google Scholar] [CrossRef]
  84. Schajnoha, S.; Larose, G.L.; Labbad, M.A.; Barber, H.; Wall, A. The safety of Advanced Air Mobility and the effects of wind in the Urban canyon. In Proceedings of the 78th Vertical Flight Society Annual Forum and Technology Display, San Jose, CA, USA, 25–27 January 2022. [Google Scholar]
  85. Kubo, D. Gust response evaluation of small UAS via free-flight in gust wind tunnel. In Proceedings of the AIAA SciTech Forum, Kissimmee, FL, USA, 8–12 January 2018. [Google Scholar]
  86. Dhulipalla, A.; Han, N.; Hu, H.; Hu, H. A comparative study to characterize the effects of adverse weathers on the flight performance of an Unmanned-Aerial-System. In Proceedings of the AIAA Aviation Forum, Chicago, IL, USA, 27 June–1 July 2022. [Google Scholar]
  87. Robinson, M.; Klimenko, V.; Diao, Q. Validation of Simulated Urban Microscale Weather Pertinent to Aviation Interests. In Proceedings of the AIAA Aviation Forum, Virtual Event, 15–19 June 2020. [Google Scholar]
  88. Staningford, D.; Sequeira, C.; Allan, M.; Rider, C.; Furse, G.; Sharpe, J. Validating airspace CFD models for Drone Operation with flight test data. In Proceedings of the 33rd Congress of the International Council of the Aeronautical Sciences, Stockholm, Sweden, 4–9 September 2022. [Google Scholar]
  89. Sutherland, M. Urban Wake Field Generation Using LES for Application to Quadrotor Flight. Master’s Thesis, Department of Mechanical and Aerospace Engineering, Carleton University, Ottawa, ON, Canada, 2015. [Google Scholar]
  90. Galway, D.; Etele, J.; Fusina, G. Modeling of urban wind field effects on Unmanned Rotorcraft flight. J. Aircr. 2011, 48, 1613–1620. [Google Scholar] [CrossRef]
  91. Bahr, M.; Ferede, E.; Gandhi, F. Flight Characteristics of AAM or UAM—Scale Quadcopters Under Atmospheric Turbulence. In Proceedings of the 78th Annual Forum & Technology Display, Vertical Flight Society, Fort Worth, TX, USA, 10–12 May 2022. [Google Scholar]
  92. Ji, H.; Chen, R.; Lu, L.; White, M.D. Pilot workload investigation for rotorcraft operation in low-altitude atmospheric turbulence. Aerosp. Sci. Technol. 2021, 111, 106567. [Google Scholar] [CrossRef]
  93. Jones, J.C.; Bonin, T.; Mitchell, E. Evaluating Wind Hazards for Advanced Air Mobility Operations. In Proceedings of the AIAA Aviation Forum, San Diego, CA, USA, 12–16 June 2023. [Google Scholar]
  94. Mohamed, A.; Marino, M.; Watkins, S.; Jaworski, J.; Jones, A. Gusts Encountered by Flying Vehicles in Proximity to Buildings. Drones 2023, 7, 22. [Google Scholar] [CrossRef]
  95. Abichandani, P.; Lobo, D.; Ford, G.; Bucci, D.; Kam, M. Wind Measurement and Simulation Techniques in Multi-rotor Small Unmanned Aerial Vehicles. IEEE Access 2020, 8, 54910–54927. [Google Scholar] [CrossRef]
  96. Adkins, K.A. Urban flow and small unmanned aerial system operations in the built environment. Int. J. Aviat. Aeronaut. Aerosp. 2019, 6, 10. [Google Scholar] [CrossRef]
  97. García-Gutiérrez, A.; Gonzalo, J.; López, D.; Delgado, A. Advances in CFD Modeling of Urban Wind Applied to Aerial Mobility. Fluids 2022, 7, 246. [Google Scholar] [CrossRef]
  98. Adkins, K.A.; Akbas, M.; Compere, M. Real-time Urban Weather Observations for Urban Air Mobility. Int. J. Aviat. Aeronaut. Aerosp. 2020, 7, 11. [Google Scholar] [CrossRef]
  99. Akbas, M.I.; Adkins, K.A.; Compere, M. Real-Time urban observations for Aviation. In Proceedings of the AIAA Aviation Forum, Virtual Event, 2–6 August 2021. [Google Scholar]
  100. Deskos, G.; del Carre, A.; Palacios, R. Assessment of low-altitude atmospheric turbulence models for aircraft aeroelasticity. J. Fluids Struct. 2020, 95, 102981. [Google Scholar] [CrossRef]
  101. Willhite, T.L.; Jacob, J.D. Intercomparison of ground and aerial systems for urban advanced air mobility wind field campaigns. In Proceedings of the AIAA SciTech Forum, National Harbor, MD, USA, 23–27 January 2023. [Google Scholar]
  102. Chrit, M.; Berchoff, D. Weather solutions for VTOL aircraft urban operations. In Proceedings of the VFS Aeromechanics for Advanced Vertical Flight Technical Meeting, San Jose, CA, USA, 25–27 January 2022. [Google Scholar]
  103. Tabassum, A.; DeSantis, M.; Bai, H.; Fala, N. Preliminary Design of Wind-Aware sUAS Simulation Pipeline for Urban Air Mobility. In Proceedings of the AIAA Aviation Forum, Chicago, IL, USA, 27 June–1 July 2022. [Google Scholar]
  104. Tabassum, A.; Bai, H.; Fala, N. A Study on Workload Assessment and Usability of Wind-Aware User Interface for Small Unmanned Aircraft System Remote Operations. In HCI International 2023—Late Breaking Papers; Kurosu, M., Hashizume, A., Marcus, A., Rosenzweig, E., Soares, M.M., Harris, D., Li, W.C., Schmorrow, D.D., Fidopiastis, C.M., Rau, P.L.P., Eds.; Springer Nature: Cham, Switzerland, 2023; pp. 444–460. [Google Scholar]
  105. Hoblit, F.M. Gust Loads on Aircraft: Concepts and Applications; American Institute of Aeronautics and Astronautics, Inc.: Reston, VA, USA, 1988. [Google Scholar]
  106. Jonkman, B.J. TurbSim User’s Guide v2.00.00; National Renewable Energy Laboratory (NREL): Golden, CO, USA, 2016.
Figure 1. Histogram of the number of publications discussing wind flow modelling in the context of UAM development from 2011 to 2023.
Drones 08 00147 g001
Figure 2. Depiction of urban wind flow and UBL sublayers. Adapted from [18].
Drones 08 00147 g002
Figure 3. Velocity profile changes for different sublayers in UBL. Adapted from [19,21].
Drones 08 00147 g003
Figure 4. Flow around an isolated building with a perpendicular inflow wind incidence angle. Taken from [28].
Drones 08 00147 g004
Figure 5. Two-dimensional representation of mean wind velocity component at various downstream positions for a flow over a cubical building. Adapted from [30].
Drones 08 00147 g005
Figure 6. TKE at Z = 0.5 h m plane ( h m is the mean height of the buildings, white squares represent buildings, and the numbers printed within the white squares denote the actual height of the buildings) [31].
Drones 08 00147 g006
Figure 7. Atmospheric wind flow modelling methods categorized and grouped based on prediction type, prediction resolution, and time.
Drones 08 00147 g007
Figure 8. Clustering of 42 identified papers on wind modelling techniques in the context of UAM.
Drones 08 00147 g008
Figure 9. Overall depiction of the hybrid modelling processes observed within the 11 found papers.
Drones 08 00147 g009
Figure 10. Multiscale wind modelling methodology from [63].
Drones 08 00147 g010
Figure 11. (Left) WindShape technology consisting of multiple fans [82] and (Right) WindShape technology facility setup [81].
Drones 08 00147 g011
Table 1. Atmospheric disturbance (AD) level classification provided in MOC SC-VTOL [14].
Atmospheric DisturbanceNotesProbability X AD
LightNo appreciable turbulence and steady-state winds less than 3 knots with no appreciable gusts. 10 0
ModerateLight to moderate turbulence. Changes in altitude and/or attitude occur. Usually causes variations in indicated airspeed.TBD
SevereTurbulence that causes large, abrupt deviations in altitude and/or attitude. Usually causes large variations in indicated airspeed.TBD
Table 2. Commonly used wind flow models in the context of UAM applications.
Model TypeSimulation TimeResolutionAccuracyRemarks
Experimental methods
Wind tunnel--High
  • Expensive.
  • Cannot produce high-intensity large-scale turbulence.
  • Test model scaling effects.
CFD-based methods
LESHours–daysMicro-/meso-scaleHigh
  • Initial and boundary conditions must be correctly defined or else the results would vary widely.
  • The higher the resolution, the higher the computational cost.
RANSHoursMicro-/meso-scaleMedium
  • RANS misrepresent the stream-wise gradients of vertical velocity profile and turbulence parameters.
Spectral methods
von Kármán, Dryden, Kaimal, MannSeconds–minutesMesoscaleLow
  • Not widely used to study urban wind flow, although Kaimal’s and Mann’s models are used to study low-altitude wind flow.
  • Does not describe various separation and vortex regions within the UCL.
Semi-empirical methods
Lagrangian, EulerianSeconds–minutesMicro-/meso-scaleLow compared to CFD-based methods
  • Lagrangian models are computationally expensive compared to Eulerian models.
  • Do not capture all the wind flow characteristics in the urban environment.
  • Widely used as an alternative to CFD-based models for urban wind flow studies.
WRFMinutes–hoursMesoscaleHigh compared to other semi-empirical methods
  • Computationally expensive compared to other semi-empirical models.
  • Requires nesting of domains of different sizes.
  • Prediction accuracy is usually higher for mesoscale forecasting compared to microscale.
Statistical methods
Machine learning, Artificial Intelligence-basedDepends on the samples used for trainingDepends on the samples used for trainingAs accurate as the training samples
  • Capable of real-time forecasting.
  • The quality of the forecast would highly depend on the data used for training the ML model.
Hybrid methods
CFD + semi-empirical, CFD + statisticalHours–daysMicro-/meso-scaleHigh
  • ROMs are used to reduce CFD computational time.
  • Mesoscale weather data (e.g., from WRF) used as initial and boundary conditions for CFD models to improve accuracy.
  • Often, coupling is not straightforward.
Table 3. Paper clustering and categorization.
S. No.CategoryCategory DescriptionPapers
Cluster 1HybridPapers that utilize a combination of atmospheric wind modelling types.[63,64,65,66,67,68,69,70,71,72,73]
Cluster 2Historical weather dataPapers that use historical weather observation data from satellites, sensors, etc.[74,75,76,77,78,79,80]
Cluster 3ExperimentalPapers that generate data through experimental techniques such as wind tunnel, etc.[81,82,83,84,85,86]
Cluster 4CFDPapers that employ CFD models to simulate wind data.[87,88,89,90]
Cluster 5SpectralPapers that compute wind data based on spectral methods like von Kármán, Dryden, etc.[91,92]
Cluster 6Semi-empiricalPapers that exploit Eulerian/Lagrangian semi-empirical approaches to simulate wind fields.[93]
Cluster 7MiscellaneousLiterature review papers, papers that suggest novel nontechnical ideas, etc.[94,95,96,97,98,99,100,101,102,103,104]
Table 4. Qualitative analysis of wind model suitability for different UAM application scenarios.
Wind Model TypeUAM Application Scenarios a
1 2 3 4 5 6
Wind tunnel tests 🗸 🗸 🗸
WindShape 🗸
DNS 🗸
LES 🗸
RANS 🗸 🗸
WRF 🗸
Kaimal, Mann 🗸
Historical data 🗸
WRF + CFD 🗸 🗸 🗸
Highly parameterized models b🗸 🗸 🗸 🗸 🗸
CFD ROMs 🗸 🗸
ML + CFD🗸 🗸 🗸
von Kármán, Dryden 🗸
a 1—UAM operational forecasts; 2—synthetic wind database generation (for determining certification standards, operational guidelines, operational wind thresholds, performance-based risks, etc.); 3—vehicle simulation testing and research of weather impact on UAM system; 4—wind data validation; 5—in-flight safety management systems or services (dynamic rerouting, constraint management, trajectory optimization, collision avoidance, etc.); 6—initial research or analyses of weather impacts on UAM operations or vertiports. Please note that the application scenarios and wind modelling methods are non-exhaustive. b QES-Winds, Quic-Urb, URock, etc.
Disclaimer/Publisher’s Note: The statements, opinions and data contained in all publications are solely those of the individual author(s) and contributor(s) and not of MDPI and/or the editor(s). MDPI and/or the editor(s) disclaim responsibility for any injury to people or property resulting from any ideas, methods, instructions or products referred to in the content.

