Article

Automatic Road Pavement Distress Recognition Using Deep Learning Networks from Unmanned Aerial Imagery

by
Farhad Samadzadegan
1,
Farzaneh Dadrass Javan
2,*,
Farnaz Ashtari Mahini
1,
Mehrnaz Gholamshahi
3 and
Francesco Nex
2
1
School of Surveying and Geospatial Engineering, College of Engineering, University of Tehran, Tehran 1439957131, Iran
2
Faculty of Geo-Information Science and Earth Observation (ITC), University of Twente, 7522 NB Enschede, The Netherlands
3
Department of Electrical and Computer Engineering, Faculty of Engineering, Kharazmi University, Tehran 1571914911, Iran
*
Author to whom correspondence should be addressed.
Drones 2024, 8(6), 244; https://doi.org/10.3390/drones8060244
Submission received: 16 April 2024 / Revised: 29 May 2024 / Accepted: 31 May 2024 / Published: 4 June 2024
(This article belongs to the Special Issue Applications of UAVs in Civil Infrastructure)

Abstract

:
Detecting and recognizing distress types on road pavement is crucial for selecting the most appropriate methods to repair, maintain, prevent further damage, and ensure the smooth functioning of daily activities. However, this task presents challenges, such as dealing with crowded backgrounds, the presence of multiple distress types in images, and their small sizes. In this study, the YOLOv8 network, a cutting-edge single-stage model, is employed to recognize seven common pavement distress types, including transverse cracks, longitudinal cracks, alligator cracks, oblique cracks, potholes, repairs, and delamination, using a dataset comprising 5796 terrestrial and unmanned aerial images. The network’s optimized architecture and multiple convolutional layers facilitate the extraction of high-level semantic features, enhancing algorithm accuracy, speed, and robustness. By combining high and low semantic features, the network achieves improved accuracy in addressing challenges and distinguishing between different distress types. The implemented Convolutional Neural Network demonstrates a recognition precision of 77%, accuracy of 81%, mAP of 79%, f1-score of 74%, and recall of 75%, underscoring the model’s effectiveness in recognizing various pavement distress forms in both aerial and terrestrial images. These results highlight the model’s satisfactory performance and its potential for effectively recognizing and categorizing pavement distress for efficient infrastructure maintenance and management.

1. Introduction

Roads are valuable transportation infrastructure for conducting commercial and social activities in all societies, and are an important component of a country’s economy [1,2]. They facilitate the movement of people and goods throughout the country and enable cost-effective transportation [3,4]. An efficient roadway system is a prerequisite for secure, rapid, economical, and trusty transportation throughout the country, and thus for a productive society. However, road infrastructures are damaged over time for a variety of reasons, leading to the deterioration of the transportation infrastructure and threatening economic conditions [5]. Changing weather conditions, heavy vehicles, human activities, natural disasters such as earthquakes and landslides, and the use of inappropriate materials are among the factors that destroy road pavements over time [6]. The delay in addressing various forms of pavement distress contributes to issues such as traffic accidents, diminished road usability, accelerated deterioration, and increased repair expenses [7]. Therefore, the occurrence of these problems requires the development of efficient techniques to detect and recognize all types of distress to monitor the condition of the structure and function and repair them promptly [8].
The detection and recognition of all types of pavement distress always face two challenges: the method of data collection and the method of processing the information [9]. One of the most popular methods in data collection is field inspection and the use of survey vehicles equipped with various sensors such as mobile laser scanning (MLS) systems [10,11,12]. Field inspection methods require human involvement and a lot of time for proper data analysis, and the resulting accuracy depends on the accuracy of the expert. In addition, methods such as mobile mapping are not cost-effective, require powerful processing equipment, and increase construction time and cost. Also, with this method, it is not possible to collect data in inaccessible areas such as roads under repair [12,13,14]. In recent years, the use of drones has attracted much attention due to their high efficiency and performance in various fields, including data collection [15,16,17]. These platforms are capable of capturing images with cameras that have high spectral and spatial resolution and provide the ability to collect more detailed information about the road pavement [18]. This method also makes it possible to plan routes before the imaging process, which also saves a significant amount of time. In addition, the use of drones allows quick and easy access to inaccessible roads and is more economical and safer compared to ground-based data collection methods [17]. Therefore, data collection using drones was used in the current study to address the problem of accurate pavement inspection.
The next challenge is to choose an appropriate method for data processing and recognition of different types of distress. In the field of investigation and recognition of various types of road pavement distress, it can be said that image processing methods are among the most widely used methods, e.g., thresholding [19], edge detection filters such as Canny [20,21], Sobel [22], Laplacian [23], and Prewit [24], morphological filters [25], and wavelet transform [26]. In general, these methods do not provide acceptable results with a constant parameter value in situations where the brightness and contrast of the images are different and require continuous adjustment to achieve the desired result [19,25,27].
Other methods for recognizing distresses are among the classical machine learning classification methods, such as Support Vector Machines (SVMs) [28], Random Forests (RFs) [29], and Neural Networks (NNs) [29], which are given manually extracted features to improve the accuracy of class identification. On the other hand, the presence of shadows and non-target objects such as the white lines of the road, the lack of sufficient brightness and contrast between the distress and the background, the smallness of the cracks, and the availability of multiple distresses, are among the inherent challenges in automatic road distress detection that are difficult to solve using traditional approaches [1].
Recently, Deep Learning Networks have received much attention due to their high power in computer vision applications. They do not cover the limitations of traditional detection methods, and eliminate hand-generated feature extraction [30,31,32,33]. In these networks, deep layers are used to extract features, and the most related features are selected by the architecture. Among Deep Learning Networks, the CNNs (Convolutional Neural Networks) play the role of the most significant representative, which is composed of multiple convolutional layers. In this network, images are first input to convolutional layers, and to find similarities, they are convolved with different kernels, and then feature maps are generated [34]. Other types of convolutional networks known for semantic segmentation and object detection as two-stage networks are the Region-based CNN (R-CNN), Spatial Pyramid Pooling (SPPNET) [35], and Faster R-CNN networks [36]. In these methods, the Region Proposal Networks (RPN) [37] algorithm is first applied to the proposed regions and then the recognition operation is performed. Another category of Deep Learning Networks known as one-stage algorithms include the Single Shot MultiBox Detector (SSD) [38] and YOLO (You Only Look Once) [39] networks, which can generally perform recognition operations in only one step after examining the entire image. The YOLO Deep Learning Network, which was built upon the CNN architecture, is an algorithm that not only detects objects but also provides detailed information about the class and attributes of the Bboxes (bounding boxes) encompassing the identified object [39]. Recently, several versions of the YOLO network have been developed, of which the fifth version quickly attracted attention due to its flexibility and favorable architecture. Impressive improvements in this network include the use of the PyTorch implementation, auto-bounding box anchors, and mosaic data expansion. Therefore, after the release of this version, several versions of it were forked, the latest of which is the 8th version [40]. The YOLOv8 Deep Learning Network is a cutting-edge, state-of-the-art (SOTA) model that builds upon the success of previous YOLO versions, introduces new features and improvements to further boost performance and flexibility, and can perform classification and segmentation operations [40]. In the present study, the utilized network is employed to swiftly and accurately detect and recognize various forms of road pavement distress, including transverse cracks, longitudinal cracks, alligator cracks, oblique cracks, potholes, repairs, and delamination, within both terrestrial and unmanned aerial images. Due to its multi-scale architecture, light weight, and sequential convolutional layers, this network can extract high-level semantic information with greater accuracy and speed than previous versions. For this reason, it is well suited for applications that require a high processing speed. Also, the YOLOv8 network achieves high speed through a one-stage recognition approach, where bounding boxes and class probabilities are predicted directly from the input image in a single pass. This eliminates the need for Region Proposal Networks (RPNs) used in two-stage detectors such as the Faster R-CNN and leads to faster inference times. For this reason, it is well suited for applications that require a high processing speed, such as autonomous vehicles, to ensure timely and smooth detection and response of objects. Moreover, this network combines high-level semantic information with low-level semantic information, which increases the ability to overcome challenges such as the small size of distresses, crowded backgrounds, the availability of multiple distresses, and the lack of sufficient illumination. Also, due to the anchor-free architecture, the training phase of this network is easier and faster to perform on terrestrial and aerial images [41].
In general, a comprehensive investigation of detecting and recognizing seven types of pavement distresses in challenging environments is conducted in this study. The proposed model with the aforementioned features and optimal architecture has the desired accuracy and characteristics to be used in real time. In addition to terrestrial images, aerial drone imagery is also used, which can be captured in less time, more accurately, and at a lower cost. Finally, the use of these two types of datasets has led to an increase in the generalizability of the model compared to the results of other studies in recognizing distresses in all types of imagery. The rest of this paper is organized as follows. In Section 2, for a better understanding of the structure of pavement distresses, its types are explained. Section 3 discusses research on pavement damage detection and presents the limitations of each method. Section 4 describes our proposed deep learning method and the architecture used, and presents the results of the detection and recognition of seven types of pavement distresses, and Section 5 and Section 6 present discussions and conclusions.

Pavement Distresses

By ensuring proper design and continuous maintenance, pavement can effectively operate as intended and experience reduced damage over an extended period [32]. In addition, pavements suffer from various problems due to temperature fluctuations, natural disasters, heavy vehicles, and traffic loads [42]. The common road pavement distresses investigated in the current article include the following four categories:
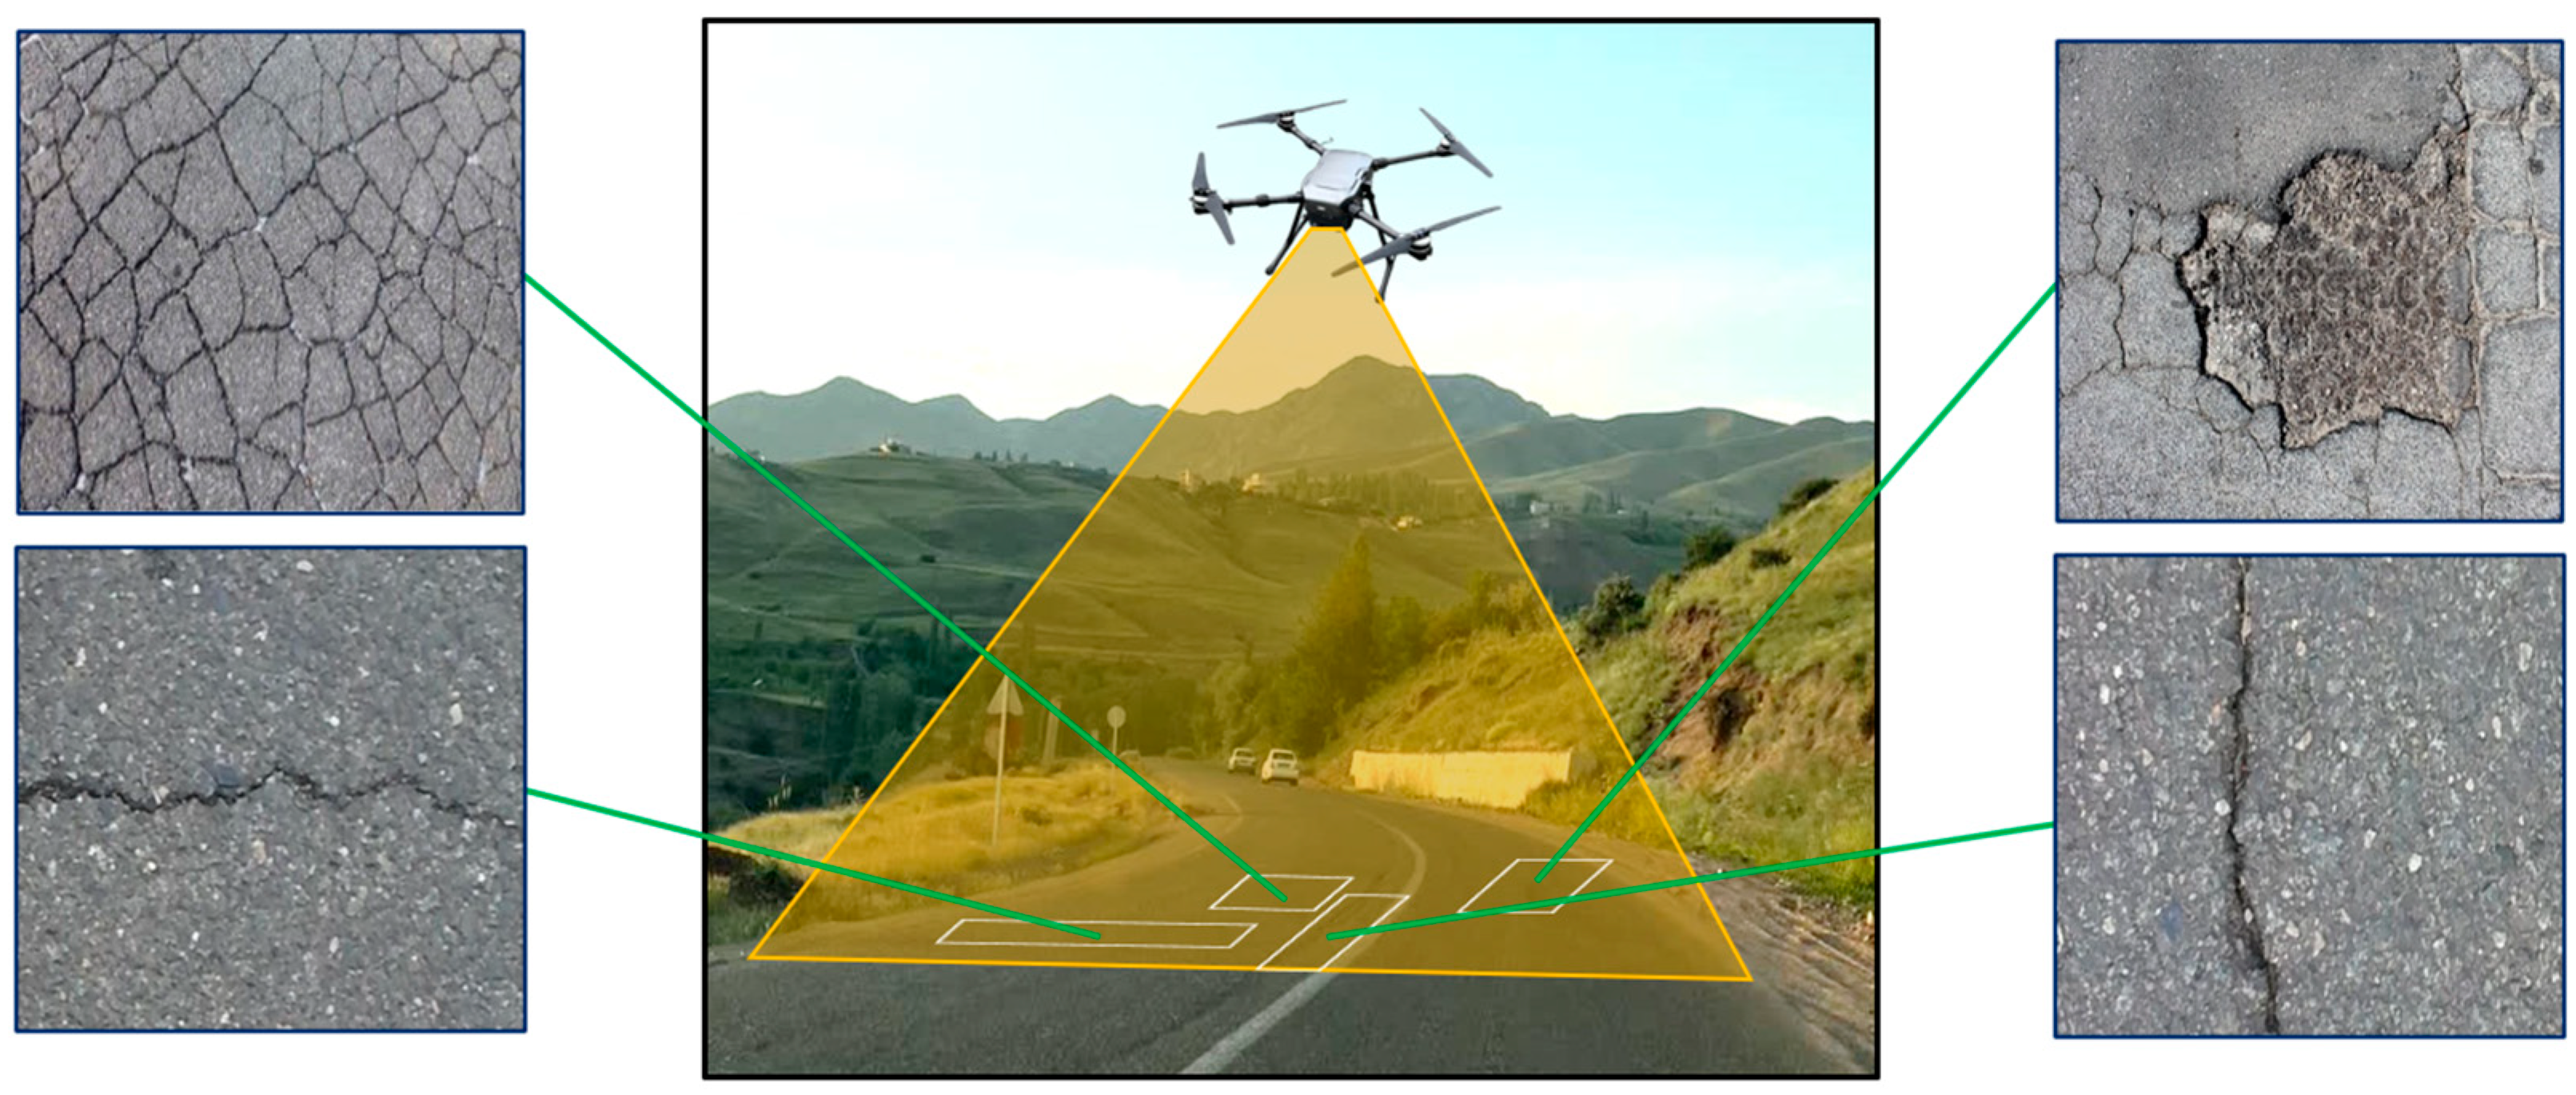
  • Pavement Crack Group: The crack group in this article includes transverse, longitudinal, oblique, and alligator cracks (Figure 1a). Causes of this type of distress include climatic changes (the most important cause), weak line connections, thermal expansion and contraction of the surface, and surface deviations on an unstable substrate. Alligator cracking, on the other hand, is related to asphalt concrete surface fatigue from repeated traffic loading, a weak or thin base or surface, or inadequate drainage [10].
  • Repaired Segment: Repaired segments are portions of a pavement surface that are removed and replaced after construction of the original surface or on which additional material is placed (Figure 1b). To repair distresses in the road surface or to cover a utility trench, patches are generally used. This distress is caused by inadequate compaction of the patch and improper infrastructure [10].
  • Delamination: This is a type of distress that occurs in different pavement layers. In this case, the asphalt layers wear away and the lower layer appears (Figure 2a). Several things can lead to this type of distress, such as the breaking of the bonds between the layers due to water seeping through the asphalt, the presence of a weak layer under the wearing surface, and an inadequate tack coat before the placement of the upper layers [43].
  • Pothole: These are bowl-shaped holes in the road surface that can occur for various reasons (Figure 2b). The reasons for the formation of potholes include damage to the subgrade, base course, or pavement bed, poor drainage, movement of small pavement pieces that are not held firmly in place, and defects in the construction of the asphalt mix [10].
  • Distresses: These have been investigated as transverse cracks, longitudinal cracks, alligator cracks, oblique cracks, potholes, repairs, and delamination.

2. Related Works

Automating the distress detection and recognition process has already attracted a lot of interest in the literature. In recent decades, various research projects have addressed the problems caused by pavement distress [30,31,44]. These projects include research on pavement condition prediction [45], pavement deterioration prevention [46], and the relationship between pavement distress and traffic accidents [47]. Moreover, wide research has been conducted to detect and recognize the different types of road pavement distress.
Deep Convolutional Neural Networks are rapidly becoming a successful approach for automatic distress recognition [1]. Recently, many researchers have investigated the detection and recognition of pavement distresses, using some technical solutions for information acquisition and qualification [48,49]. In 2019, Song et al. recognized four types of pavement distresses, including cracks, oil bleeding, potholes, and spot surfaces. In this study, 6498 pavement images were trained with Faster R-CNN, and the accuracy and recognition results reached 90% and 89%, respectively. Data were collected using a time-consuming and expensive method, and the other types of pavement damage such as repairs and delamination were not investigated. [50]. In 2020, Silva et al. recognized potholes in pavements using a Deep Learning Network based on simultaneous image inspection. UAV aerial imagery was used, and the results achieved more than 95% accuracy. However, this study did not examine the other types of pavement distresses such as cracks, repairs, and delamination [51].
In 2021, Yang et al. used the VGGNet13, ResNet18, and AlexNet to classify cracks, and the ResNet18 network performed better than the other two networks with a precision of 98.8%. In this article, crack classification using the third version of the YOLO network was also performed. The results showed that this network can be more precise and effective for crack detection and classification than traditional methods. However, this work did not address the recognition of other types of pavement distresses such as potholes, delamination, or alligator cracks [52]. Also in 2021, Chun et al. implemented a deep learning method for the automatic detection of cracks in road pavement images captured by a 3D mobile mapping system. In this work, the classes were divided into six categories: cracked area, non-cracked area, white line (with/without cracks), and road facilities (with/without cracks). They achieved 94% accuracy in verifying the training process in images with cracks, but they did not recognize other pavement distresses such as potholes, repaired segments, and delamination. In addition, the use of the mobile mapping data collection method was not cost-effective; it required powerful equipment for processing, and access to roads under repair may be limited with this equipment [53]. In 2021, Yan et al. recognized pavement cracks in unmanned aerial images using three SSD, improved SSD, and YOLOv4 networks. In this work, five types of distresses (longitudinal cracks, map cracks, transverse cracks, pavement markings, and repairs) were detected. The results showed that the mAP value of all categories in the test dataset was 85.11% with the proposed model, which was 10.4% and 0.55% higher than the YOLO model and the original SSD model, respectively [44].
Guo et al. also implemented an improved fourth version of the YOLO network for road distress detection, using two aerial and terrestrial datasets with a large number of cracks in the pavement. The mAP value in the first and second datasets was 47.35% and 62.62%, which were 5.29% and 5.22% higher than that of the original network, respectively [6]. In 2021, Shaghouri et al. detected potholes in two terrestrial public datasets using the third and fourth versions of YOLO and SSD-TensorFlow networks. Pothole detection using SSD-TensorFlow achieved 73% accuracy and 32.5% mAP. The third version of YOLO achieved 78% recall, 84% accuracy, and 83.62% mAP, and the fourth version also achieved 81% recall, 85% accuracy, and 85.39% mAP. Finally, the results showed that the fourth version of the YOLO network is faster and more accurate than the other two methods [54].
In 2021, Shu et al. investigated the crack detection method using the fifth version of the YOLO network in the Street View dataset and compared it with the third version of the YOLO network. In this study, the fifth version achieved 73% mAP and the third version achieved 64% mAP in recognizing cracks [55]. However, this paper did not address the recognition of other types of distress, and only four types of alligator cracks, transverse cracks, longitudinal cracks, and partial patching were recognized. Also in 2021, Park et al. detected potholes in real time and on various visible terrestrial images using three versions of YOLO networks. The results showed that the value of mAP in YOLOv4, YOLOv4-tiny, and YOLOv5s was 77.7%, 78.7%, and 74.8%, respectively. [56]. In 2021, Hu et al. successfully detected longitudinal cracks, fatigue cracks, and transverse cracks, by using the fifth version of the YOLO network and a series of visible manual images. In this work, the highest detection accuracy of 88.01% was attributed to the large version of the YOLOv5 model. Also, the shortest recognition time was attributed to the YOLOv5s model and was 11.1 milliseconds for each image [57]. In the last two articles, only a limited number of pavement distresses were discussed and other common types of damages such as repairs and delaminations were not recognized.
In 2022, Zhu et al. used UAV aerial imagery to recognize six types of transverse cracks, longitudinal cracks, alligator cracks, oblique cracks, repairs, and potholes pavement distresses in unmanned aerial images. In this study, three advanced object detection algorithms based on convolutional networks (faster R-CNN, YOLOv3, and YOLOv4) were trained using the road pavement distress dataset. Compared to other networks, the third version of the YOLO Deep Learning Network showed the best performance with an average accuracy of 56.6%, but this value still needs to be improved [31]. Also, Xu et al. detected cracks that appear in a single form in public terrestrial pavement images using mask R-CNNs and faster R-CNNs. Furthermore, their investigation encompassed evaluating the performance of the system in accurately recognizing various types of cracks, including straight and curved cracks, deep and shallow cracks, as well as cracks affected by sunlight interference, utilizing different learning rates. In the faster R-CNN with a learning rate of 0.005 all cracks were detected well, but the mask R-CNN was sensitive to the value of the learning rate, and when it was set to the value of 0.0002, cracks were completely indiscoverable. In this work, challenges such as background separation, recognition of small cracks at long distances, and the occurrence of hybrid distress were not considered. [58].
In 2022, Fan et al. successfully recognized cracks in road pavements using a residual network (Parallel ResNet). In this study, two datasets (CrackTree200 and CFD) were used, and crack detection accuracies of 97.27% and 96.21% were achieved, respectively. However, other pavement distresses such as potholes, repairs, and delamination were not investigated in this study [59]. Hou et al. also detected pavement cracks using the FS-Net strip pooling method in a vast number of terrestrial visible images. The findings indicate that the proposed method achieves an average accuracy that is 4.96% and 3.67% higher than the faster R-CNN and YOLOv3 networks, respectively. However, this study did not address the recognition of other types of pavement distresses such as delamination. In addition, the data collection was conducted with an expensive survey vehicle, which takes an enormous amount of time and does not cover a large area [32].
According to previous studies, it can be concluded: (1) They have focused on recognizing the limited number of pavement distresses, and few studies have investigated their types; (2) Pavement distress recognition always faces challenges such as crowded backgrounds, the small size of distresses, availability of multiple distresses, and similarity between them, which have not been extensively studied yet; (3) In most of these works, data collection is ground-based and with expensive surveying equipment, which is not cost-effective, takes a lot of time, and it is not possible to collect data in inaccessible areas; and (4) Given the importance of accuracy and real time recognition of different types of distresses, it can be said that it is better to use advanced deep learning methods such as YOLO, which have received much attention recently. However, a limited amount of research has used this category of networks.

3. Methodology

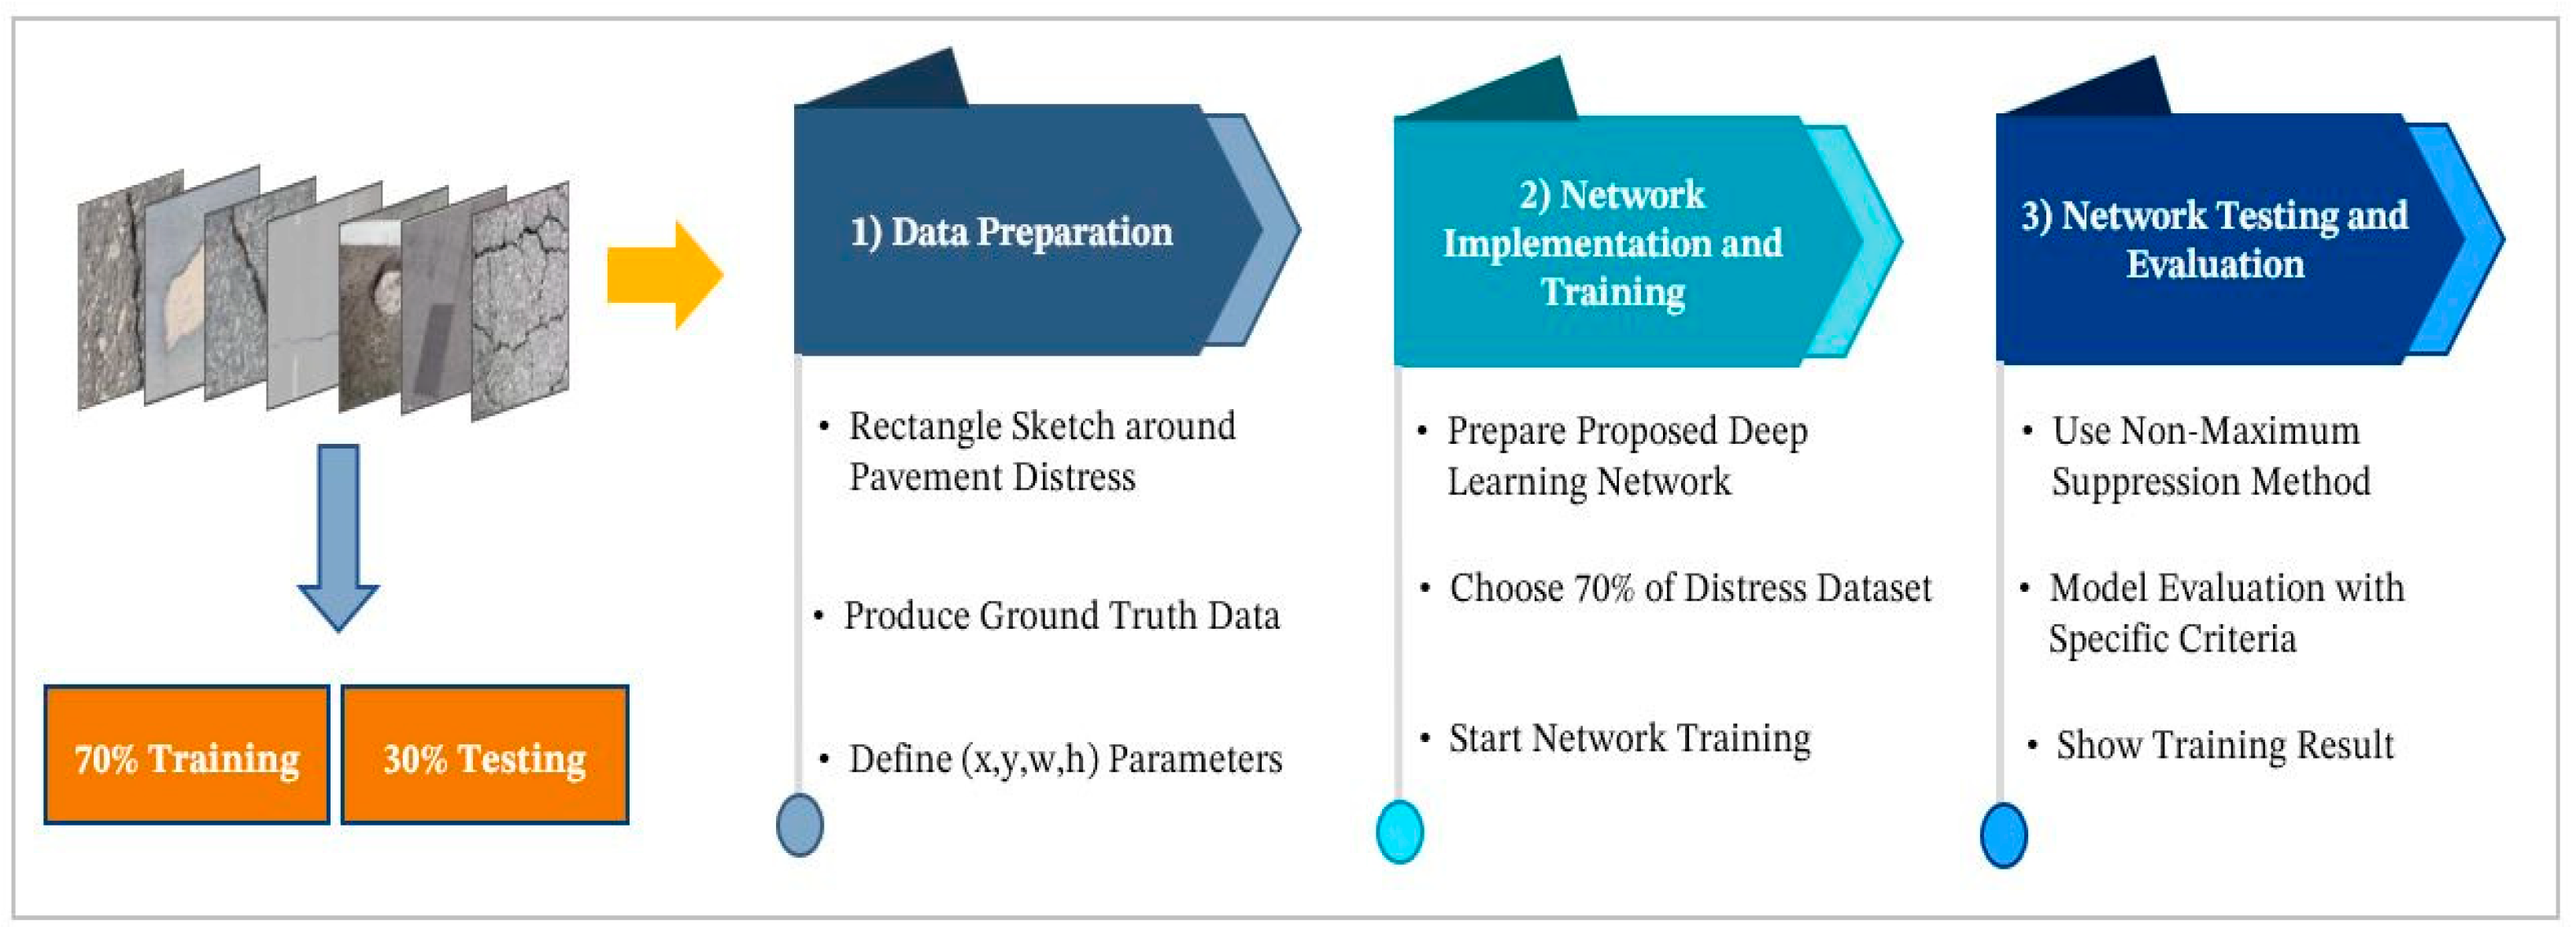
The current study was conducted utilizing the most up-to-date version of the YOLO Deep Learning Network and includes three phases: data preparation, network implementation and training, and finally testing and evaluation of the implemented model. In the first phase, the types of distresses and the needed preparations as ground truth data are described. In the second phase, the proposed architecture of the network and its layers are explained in detail, and finally, the evaluation criteria are discussed to evaluate the network performance in pavement distress recognition (Figure 3).

3.1. Data Preparation

Collecting high-quality, diverse, and challenging datasets is one of the most important parts of an object recognition project and a prerequisite for achieving an acceptable performance of deep learning algorithms. Using a limited dataset increases the possibility of problems like network overfitting [60]. In the current study, 828 images of each type of pavement distress (transverse cracks, longitudinal cracks, alligator cracks, oblique cracks, potholes, repairs, and delamination) are collected from UAV images, public images, and videos of pavements, resulting in a total of 5796 aerial and terrestrial images. The prepared dataset includes two categories of aerial and terrestrial images captured by an ADTi 26MP camera. In this dataset, the number of terrestrial and aerial images is divided in a ratio of 1 to 2, so that the number of terrestrial images is 2898 and the number of aerial images is 2898.
Using a set of terrestrial and aerial images and recognizing the types of distresses in both images through a single model is one of the innovations in the field of data collection. The use of terrestrial images alone does not increase the generalizability of the model to recognize distress in aerial images (and vice versa), and there are specific features in each of these two types of images that differ from each other. Therefore, to benefit from the features of both types of images and to increase the generalizability of the model, a set of terrestrial and aerial images was used. In the results section, aerial and terrestrial images are presented separately so that the model’s ability to detect distresses is visible in both cases. Prepared images were aimed to cover all types of distress in different aspects and dimensions, and under complex situations, such as the availability of multiple distresses, the absence of adequate contrast between the background and the distress, coupled with the existence of shadows. To obtain images against a crowded background, images were taken in urban and non-urban environments where the white lines of the street and distress overlapped. To investigate the challenge of the small size of the cracks, the drone images were taken at a height of 50 m so that the cracks appeared smaller than normal. To investigate the challenge of similarity between different types of distresses, the similarity of cracks and repairs was used to demonstrate the model’s ability to recognize and distinguish between the two. To examine the model under different lighting condition and shadow, the images were taken during day and night times when the sun was at an angle, so some cracks were in the shadow of cars or trees, creating difficult conditions for the model. Also, there is more than one type of distress in each image of the road, which can be challenging for the network to recognize their type. In addition to the aerial and terrestrial images, public training and test images were also selected under different conditions to create a comprehensive dataset with all types of challenges. After completing the data collection, all data were labeled using the LabelImg [61] tool. The labels contain information about the object class, the center box coordinate, and its width and height (as presented in Figure 4). In conclusion, 70% of the samples were allocated for training the model, while the remaining 30% were reserved for testing purposes. In the training phase, the number of terrestrial images was 2020 and the number of aerial images was 2037. In the test phase, the number of terrestrial images was 878 and the number of aerial images was 861.

3.2. The Implementation and Training of the Network

During this phase, the network underwent training using 70% of the available data, to achieve proficiency in recognizing and classifying seven distinct types of road distresses. The architecture of the YOLOv8 Deep Learning Network was created by applying changes to the architecture of the fifth version. The incorporation of a multi-scale architecture, anchor-free approach, and lightweight design in this network has significantly enhanced accuracy, while simultaneously reducing complexity and the number of parameters [62].

The Network Architecture

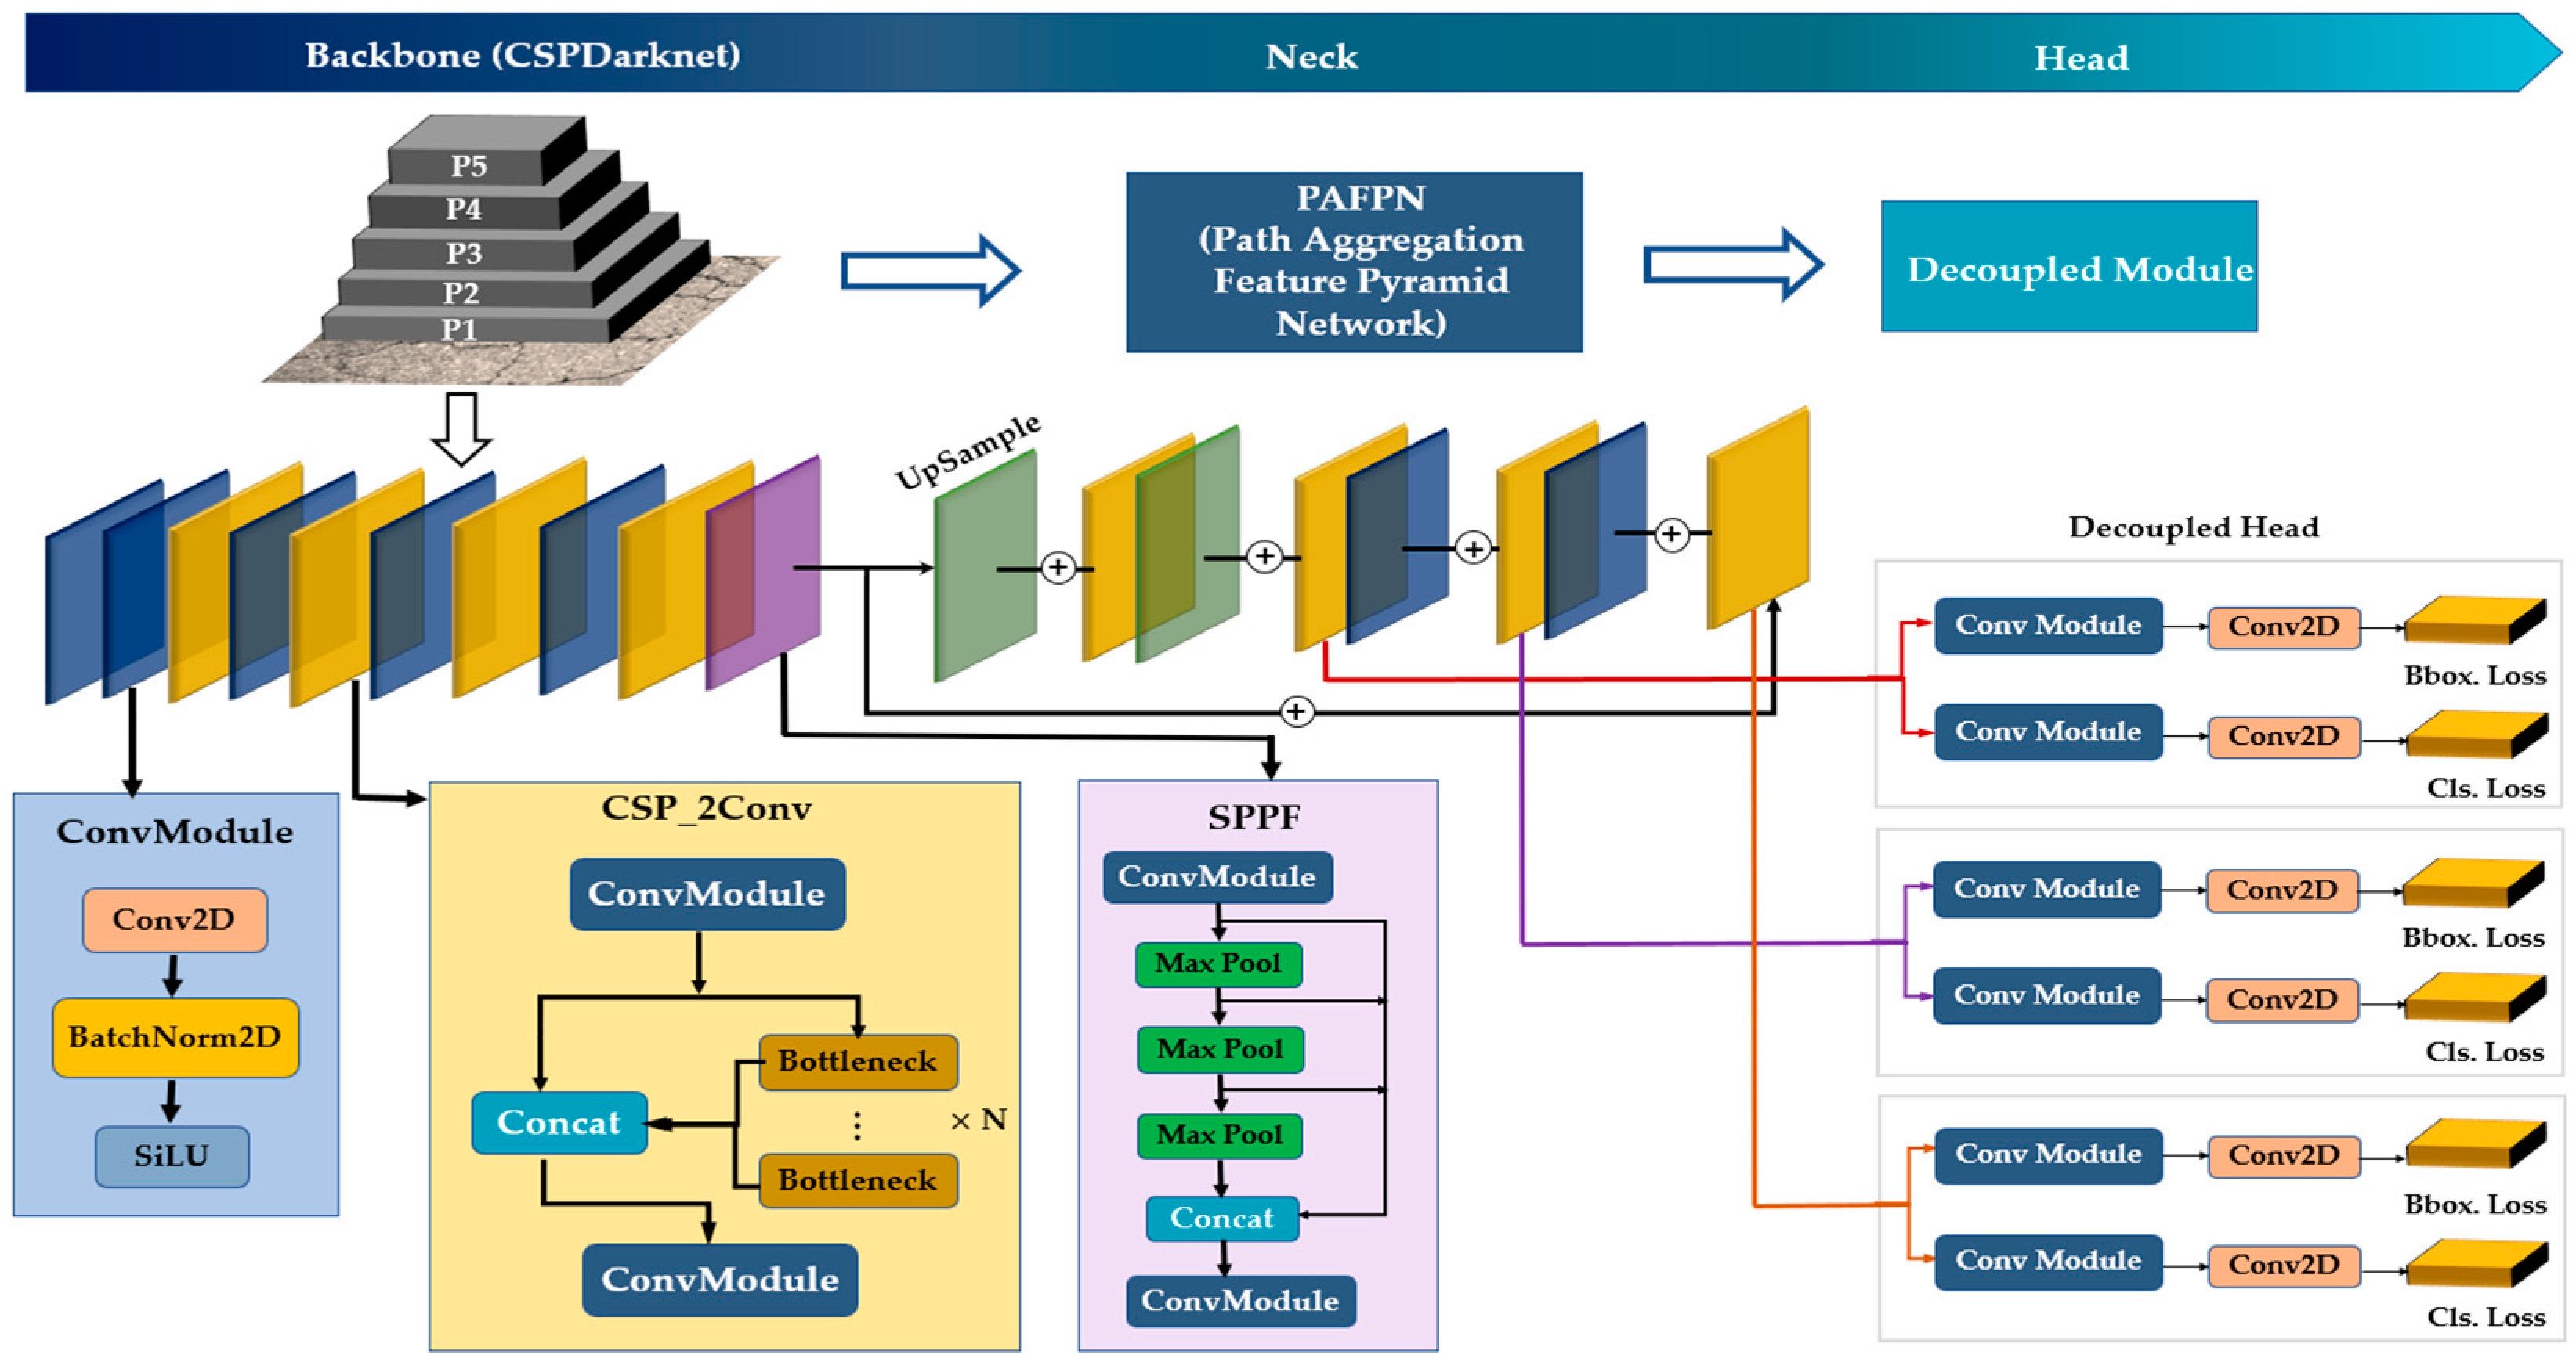
As presented in Figure 5, the structure of the implemented Deep Neural Network consists of three separate items, including the backbone part, the neck part, and the head part.
The backbone is a CNN network designed to generate feature maps. The neck part consists of layers that are responsible for receiving features from the backbone, combining them, and finally transmitting them to the head part. In the final stage, this component receives the features transmitted from the neck and carries out the essential tasks of bounding box and object class prediction. The proposed Deep Learning Network is introduced in five versions: nano, small, medium, large, and extra-large, which differ in depth and number of layers. As the depth of the layers in the different versions of this network increases, the memory space and the final accuracy increase, but the execution time decreases [62]. The nano version consequently is the fastest and smallest version, while the extra-large version is the most accurate but slowest [63]. In the current study, the large version is used to achieve the desired accuracy within a reasonable execution time [62]. The network architecture is defined as follows:
  • Backbone
The architecture of this section consists of three main modules, Bottleneck CSP (Cross Stage Network) [64], C2F (Bottleneck CSP with two convolutions), and SPPF (Spatial Pyramid Pooling Fast) [65], described as follows:
  • Bottleneck CSP Module
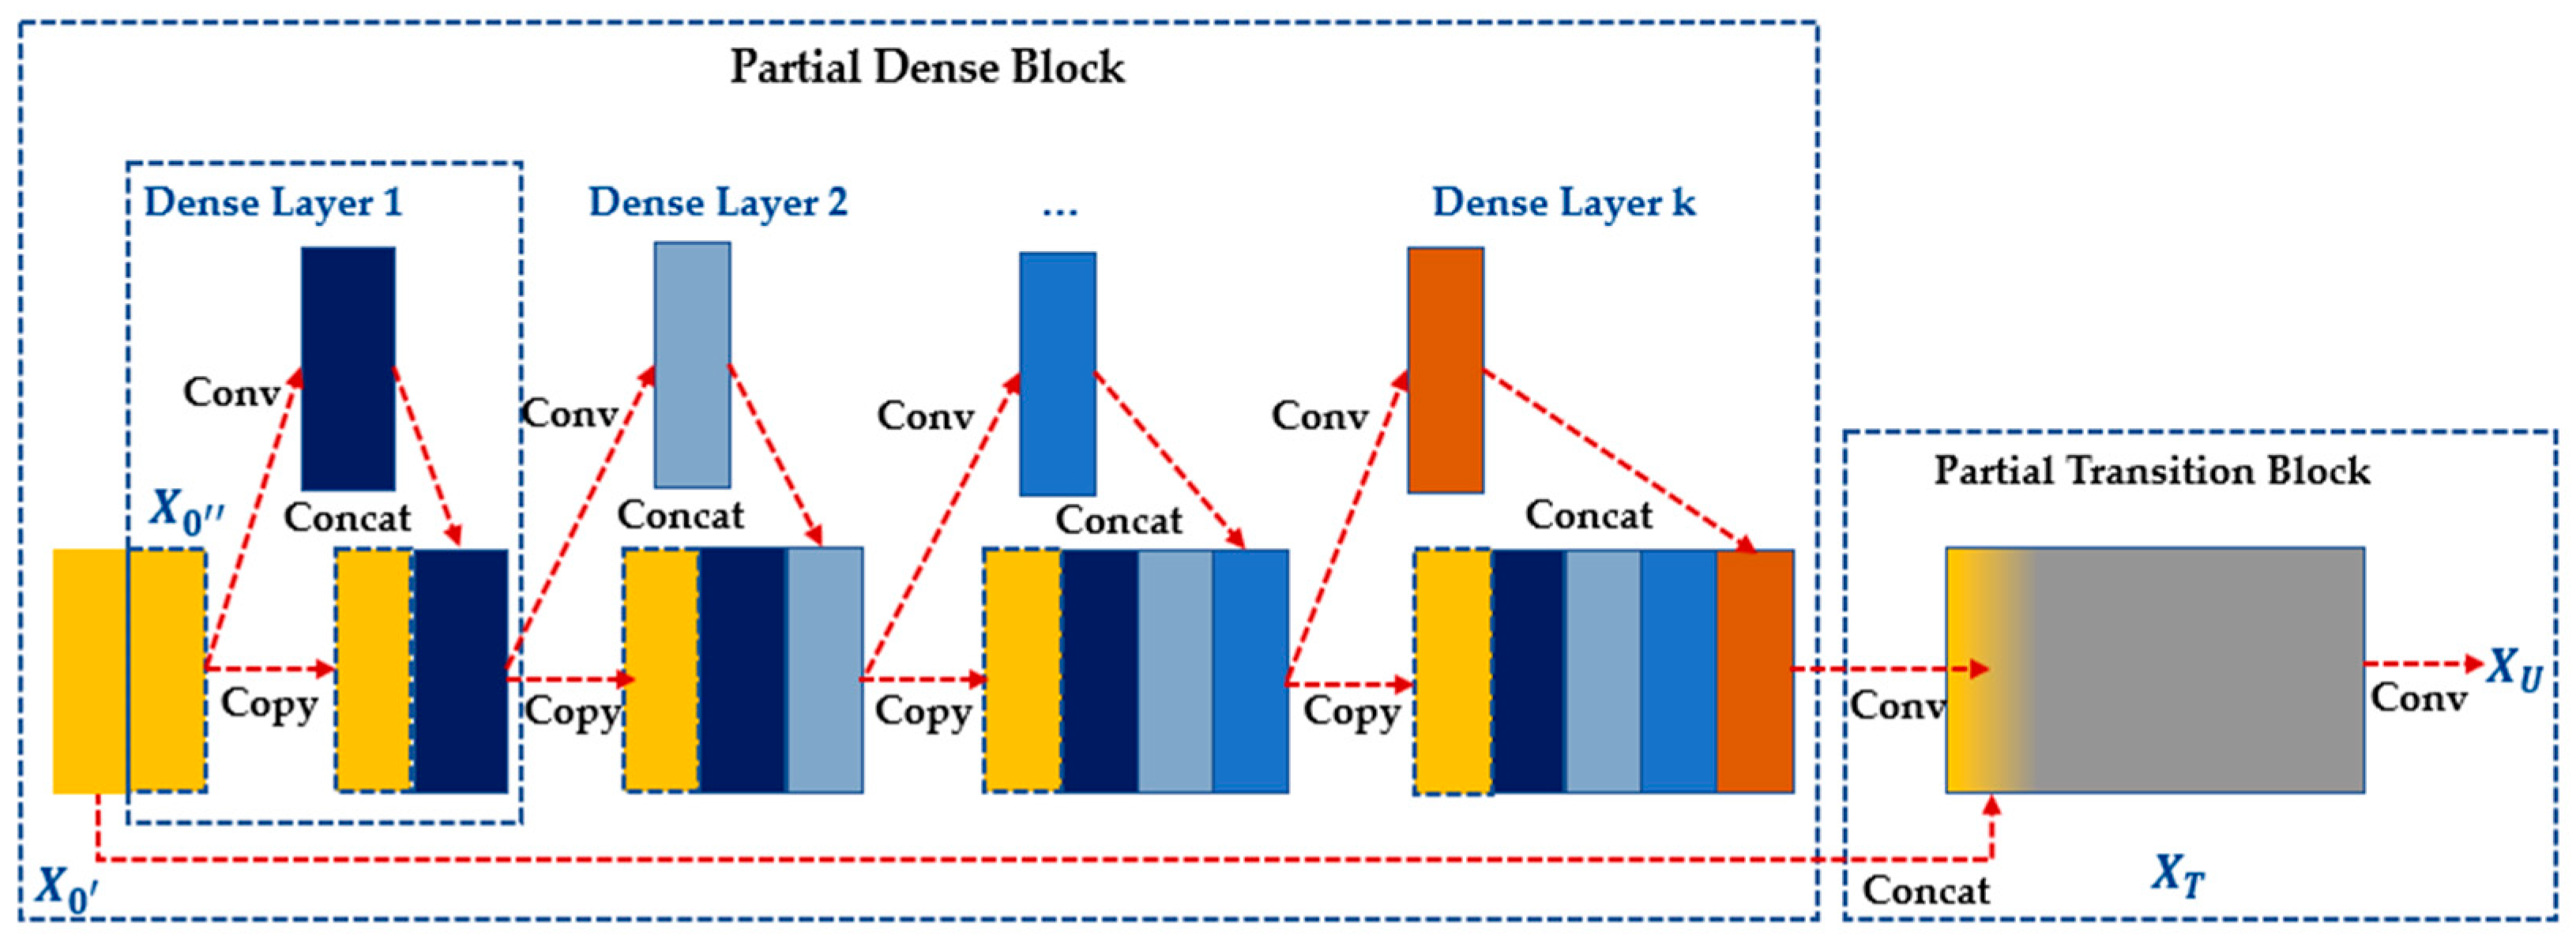
This module is used to formulate image features and extract extensive useful features from an input image and deals with large-scale iterative gradient problems. In addition to integrating gradient changes into the feature map, this element effectively reduces the parameter count, leading to improved accuracy during inference, while simultaneously enhancing speed [64]. The CSPDarknet53 block [64] is used in the backbone of the proposed network. As shown in Figure 6, the CSP models are based on the DenseNet network.
In this figure, “conv” is an abbreviated form of convolution layers. In the CSP block, the DenseNet is modified to extract the base-level feature map by copying it, sending a copy through the DenseNet block, and sending another directly to the next step. The idea of CSPs is to improve learning by transmitting the unprocessed version of the feature map and removing the computational bottlenecks of the DenseNet [66]. Also, in the bottleneck module, the first convolutional layer (conv layer) is changed from 1 × 1 to 3 × 3.
  • C2F Module
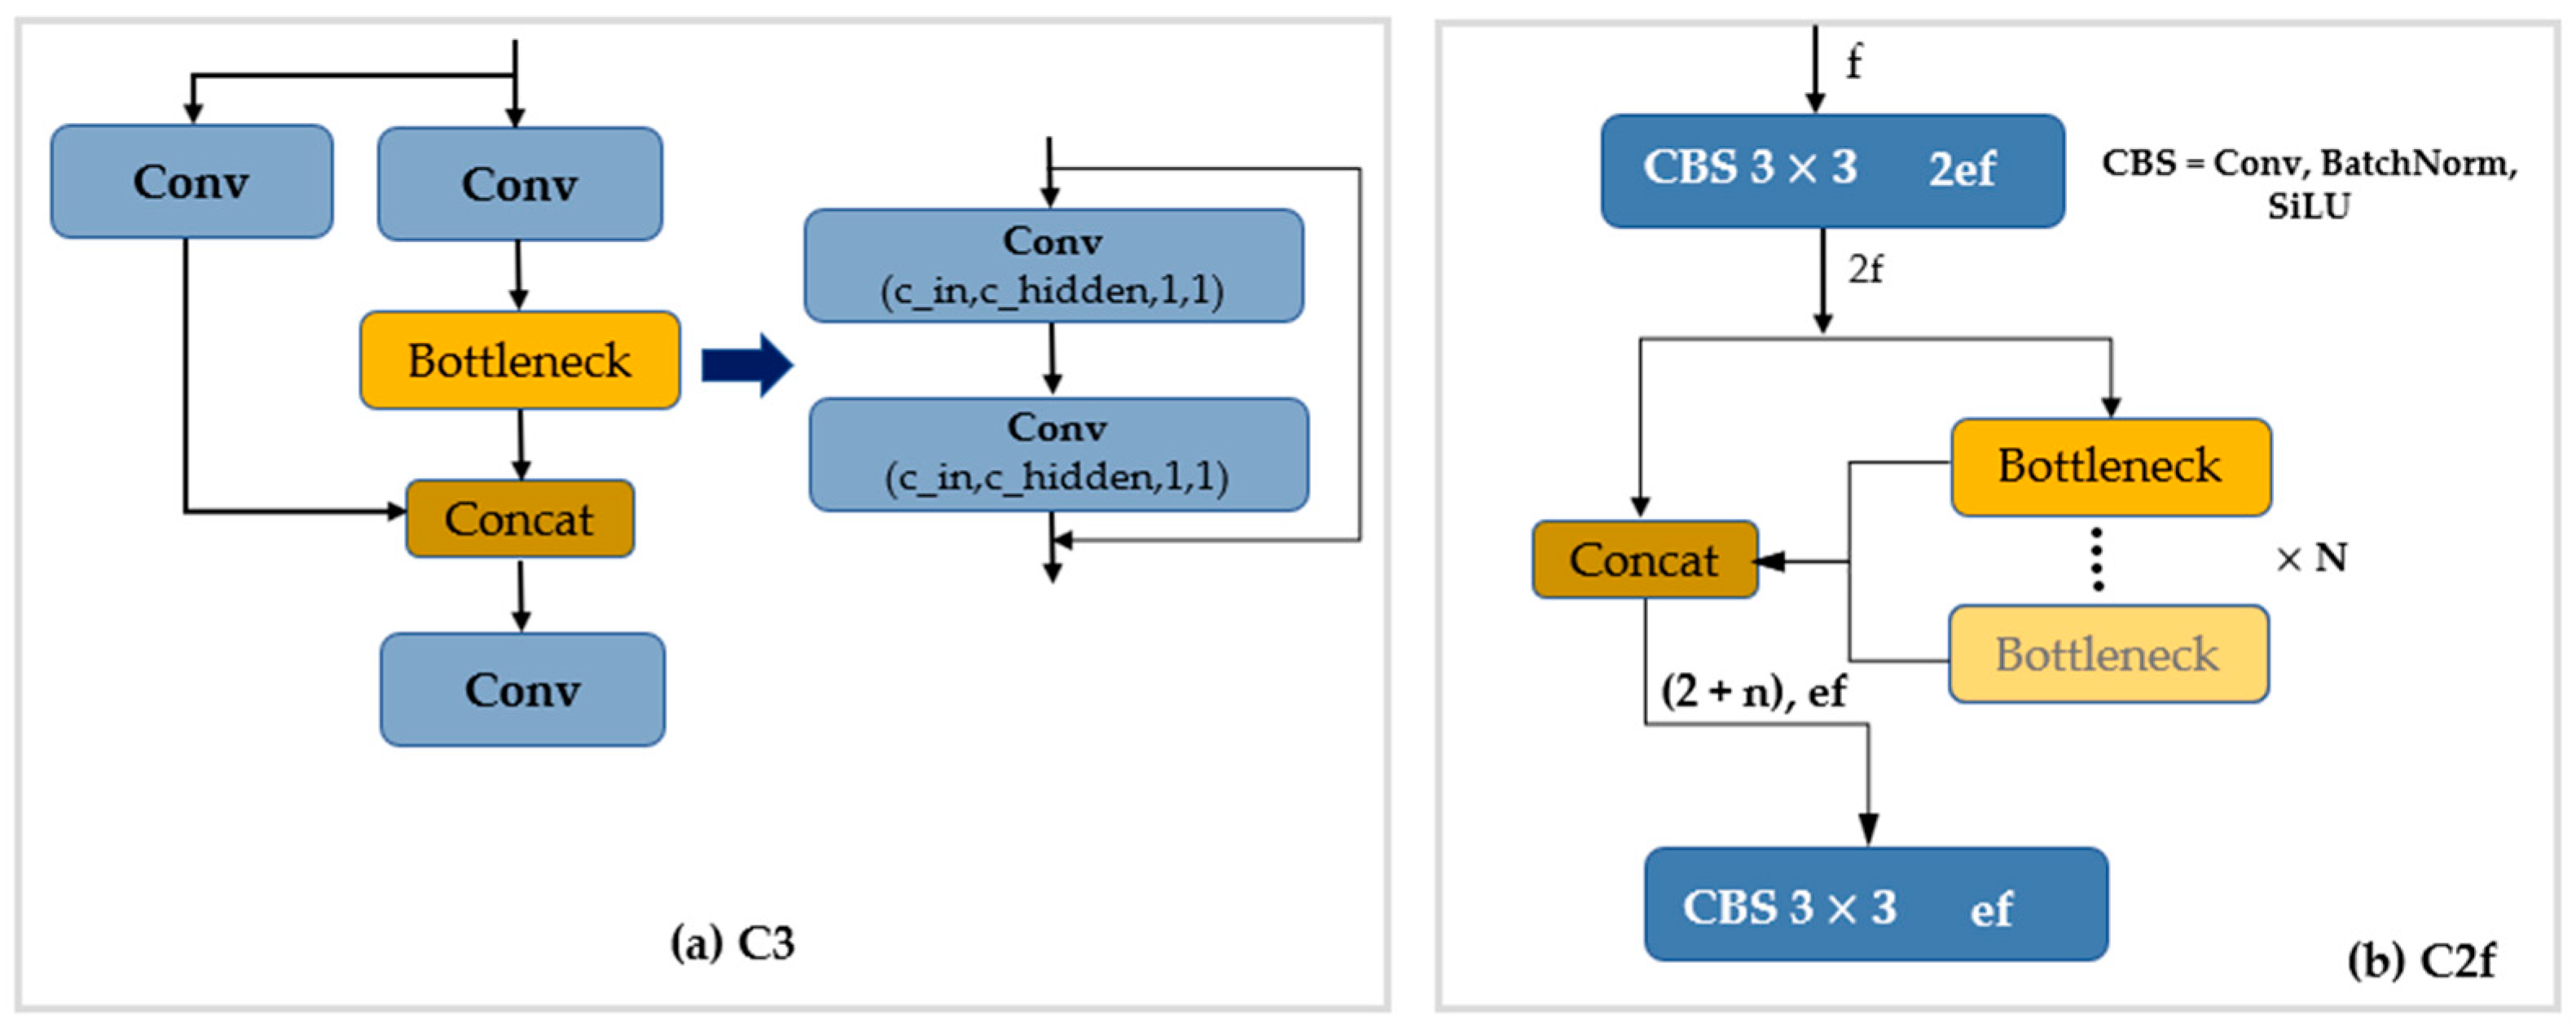
This module consists of a bottleneck CSP with two convolutional layers and two CBS modules. CBS is a block consisting of a convolutional layer, a batch normalization layer, and a SiLU (Sigmoid-Weighted Linear Unit) [67] activation function [68]. In the proposed network, the C2F module is inserted instead of the C3 module. According to Figure 7, the first convolutional layer is 3 × 3. Moreover, all the outputs of the bottleneck are connected, while in the C3 module, only the output of the last bottleneck is used. In this figure, “f” represents the number of features, and “e” represents the expansion rate [41].
  • SPPF Module
The Spatial Pyramid Pooling (SPP) layer removes the fixed size limit for input to the network. This layer is located between the last convolutional layer and the first fully linked layer, and due to the presence of this layer, convolutional layers do not require fixed-size input [65]. According to Figure 8 (SPP module), at the beginning and the end of the spatial pyramid layer is the CBS module, which halves the number of channels. Also, the down-sampling process is performed using three parallel max-pooling layers (5 × 5, 9 × 9, and 13 × 13), and the local features are preserved in the output of these three convolutional layers. In addition, a general convolution is applied to the input to extract the main features. Finally, the results of the three max-pooling layers and the main convolutional layer are combined, and suitable features are extracted. The extracted features are a combination of original and local features, which leads to a better understanding and doubles the number of channels at a low cost.
Moreover, the input with a different size and a fixed length enters the fully connected layers after passing through the SPP layer [65]. To double the network speed, a change was made in the architectural structure of this layer, which led to the creation of the SPPF (Spatial Pyramid Pooling Fast) module [69]. As it appears from Figure 7 (SPPF Module), the main features are combined with SPP, with changes only in the max pooling layers. In this architecture, instead of running three kernels in parallel with a larger one, three 5 × 5 kernels are used in series, and the results of each kernel are connected to a different input. This module not only increases speed but can also significantly improve the problem of target fusion at multiple levels [70].
2.
Neck
The proposed network uses the PANet (Path Aggregation Network) [71] in the necking phase. This network consists of PAFPN (Path Aggregation Feature Pyramid Network) [72], which is used to create feature pyramids and has led to a successful generalization of the model in detecting objects of different dimensions. In this network, the features are directly connected in the channel dimensions without creating pressure. This feature reduces the number of parameters and the total size of tensors. In this network, each layer represents a feature layer in the CSP backbone. The two convolutional layers are also reduced compared to the YOLOv5 network. In addition, all C2F modules have been replaced by C3 modules [41].
3.
Head
The YOLO network is used in the head to perform the detection process [73]. The most important change in this part is the change from anchor-based to anchor-free and from the original coupling structure to the decoupling one. The proposed network uses a known anchor box instead of an offset directly predicts the object center and is an anchorless model. This means that it directly predicts the object center rather than using an offset from a known anchor box. By employing this detection method, the speed of the NMS (Non-Maximum Suppression) algorithm is enhanced, resulting in a reduction in the number of predicted boxes and ultimately reducing the overall complexity of the model [41]. Another difference is the removal of the objectness branch, and, according to Figure 9, only the decoupled classification and regression branches have been retained [74].
Activity functions also play an important role in neural networks. These functions help to understand nonlinear and complex mappings between input and output, improve the learning rate, and better learn the existing patterns between data. One of the most important features of the proposed network architecture is the use of the Mish activity function [75]. The mathematical definition of this function is given by Equation (1):
f x = x tanh ( ln ( 1 + e x ) )
In this equation, the minimum value of f(x) is observed to be ≈ −0.3088 in x ≈ −1.192. Mish activation function has outstanding characteristics such as smooth, continuous, self-regulating, and non-monotonic, which makes it popular among other activation functions.
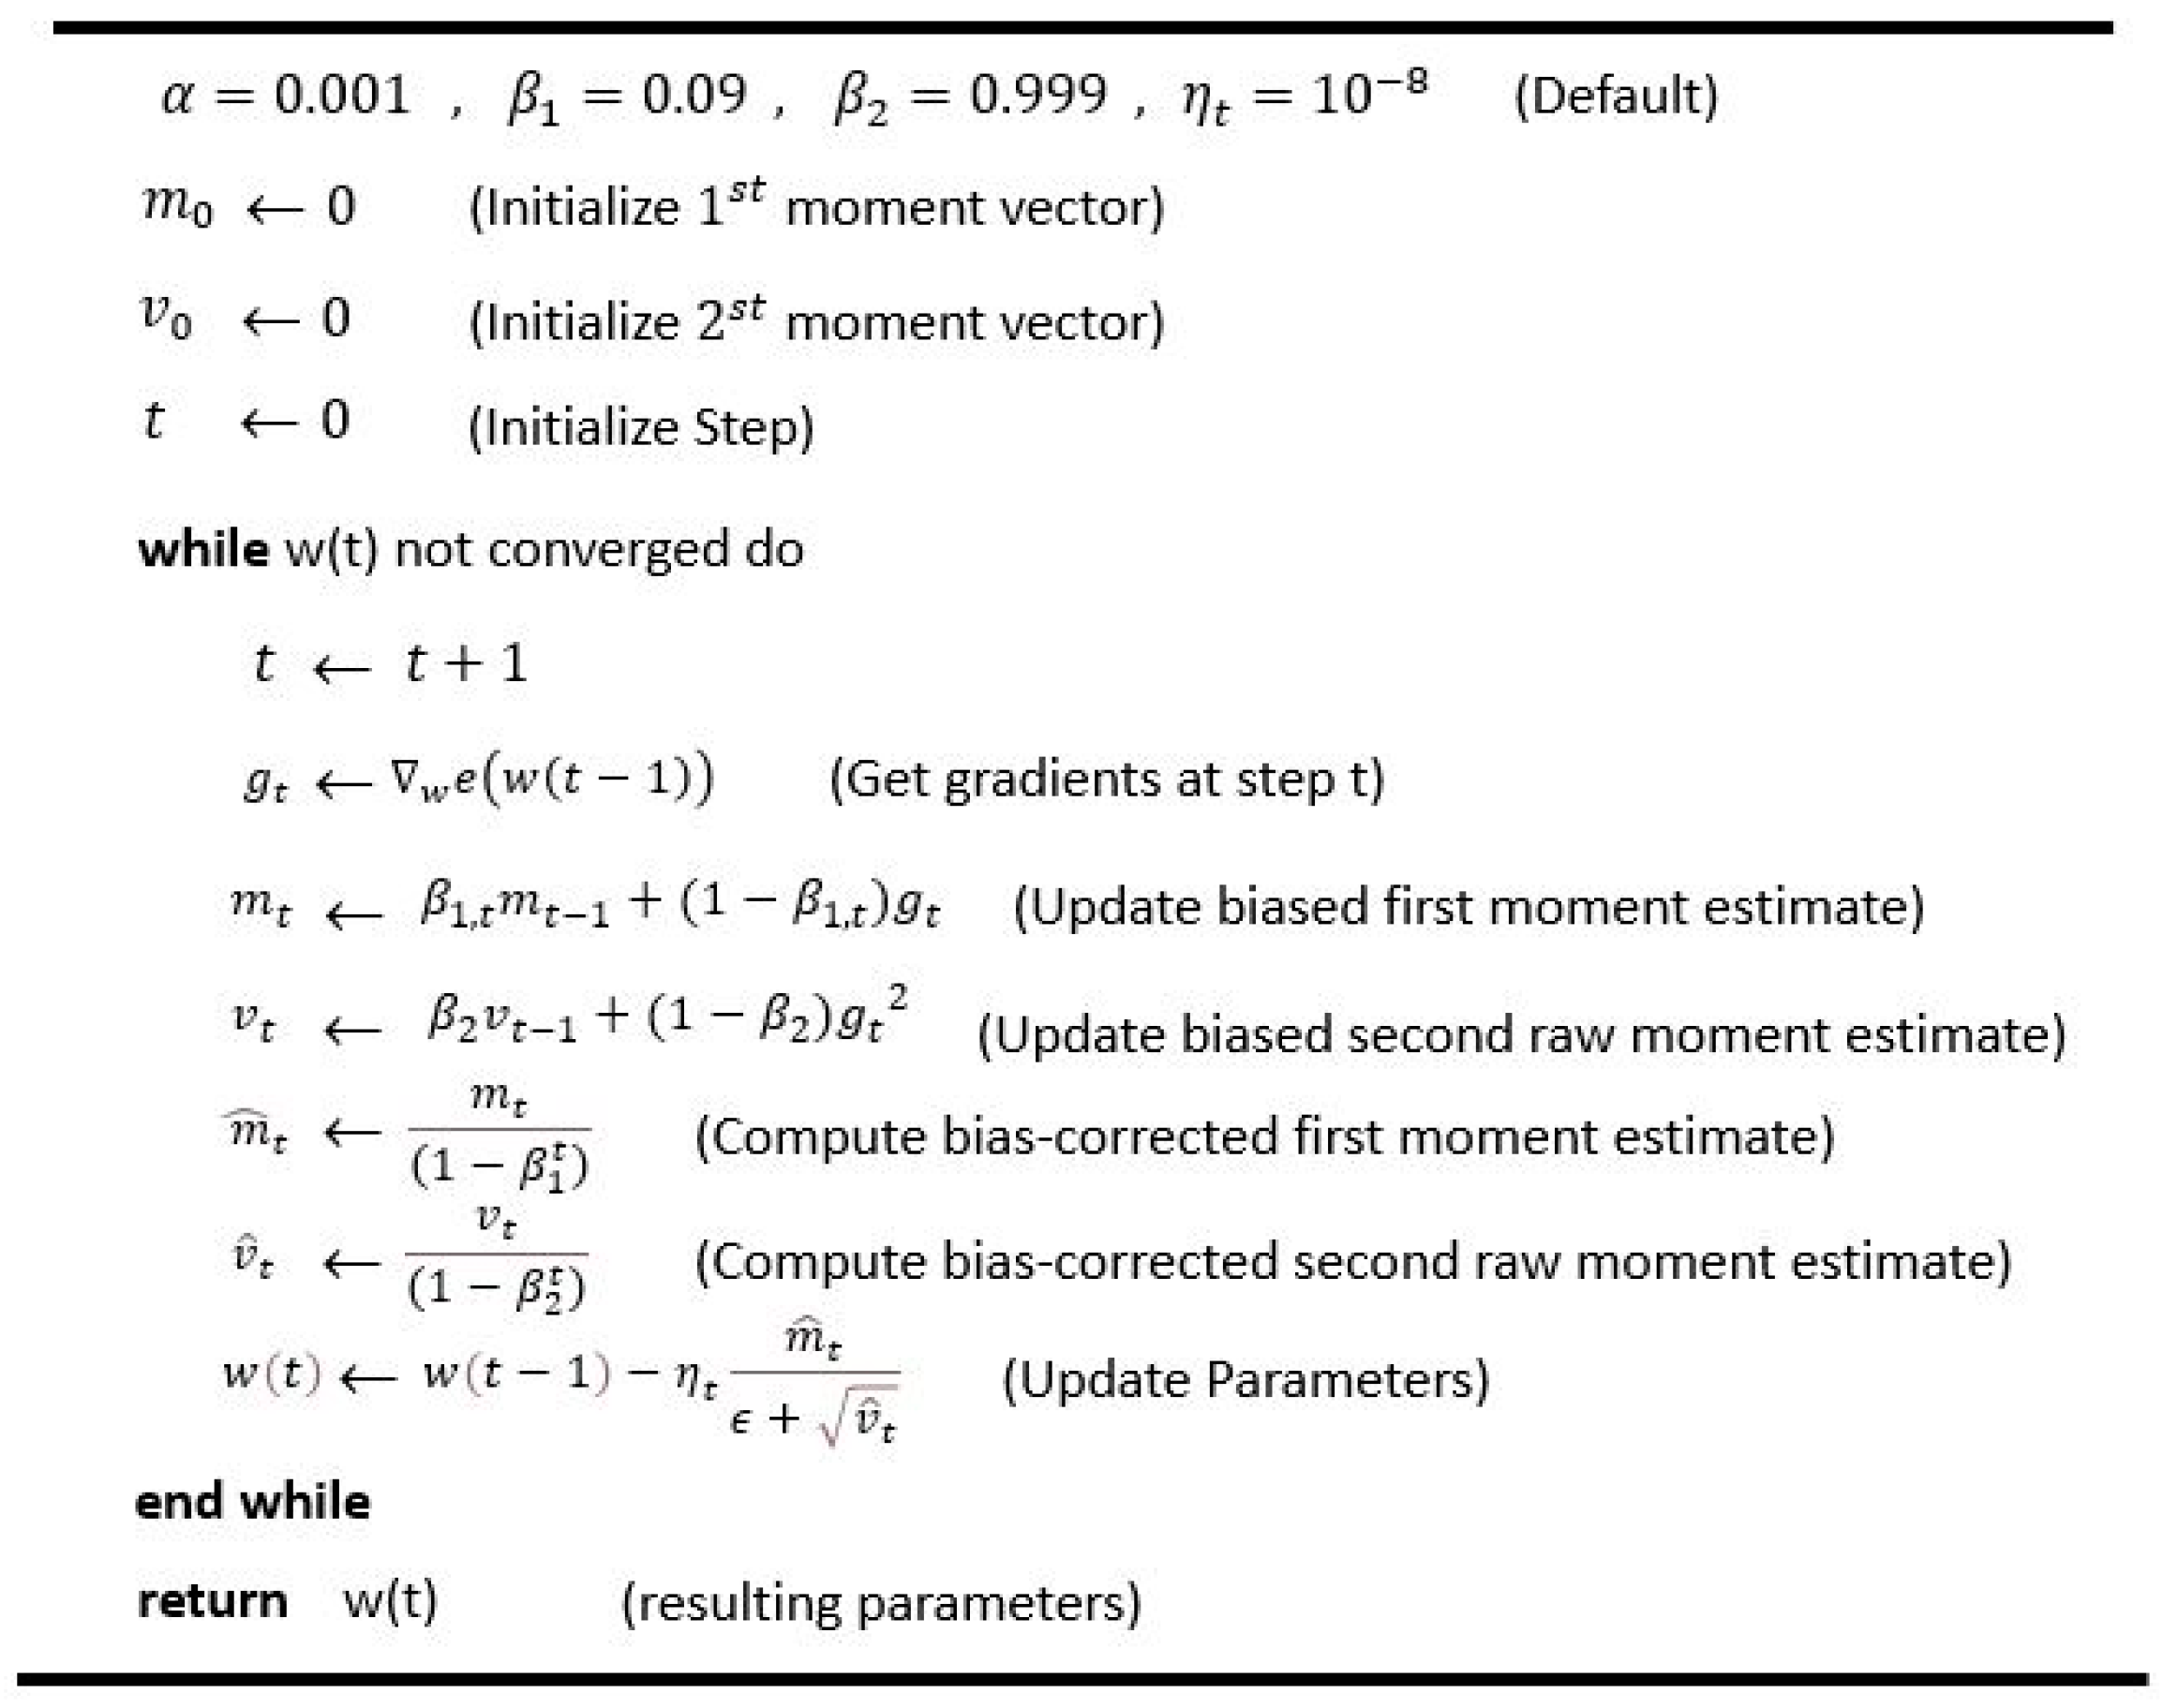
In the current study, the Adam (Adaptive Movement Estimation) optimization function is used to minimize the error function. Adam is one of the most popular gradient descent optimization algorithms, which is computationally efficient and has a simple implementation. It is also well suited for problems with many parameters and data and require little memory. This algorithm calculates adaptive learning rates for each parameter and is a combination of RMSprop (Root Mean Square Propagation) and the momentum method [76,77]. The definition of this function is given by Equation (2):
w t + 1 = w t α ϵ + v ^ t × m ^ t
As in the RMSprop algorithm, w t is weight in time t, w t + 1 is weight in time t + 1, and the gradient component is the parameter m t , i.e., the exponential moving average of the gradients. The learning rate component is also calculated by dividing α (learning rate) by the square root of v t (bias-corrected estimate) which is the exponential moving average of the squared gradients, and the following formulas are used to correct for bias (Equations (3) and (4)) [76].
v ^ t = v t 1 β 2 t
m ^ t = m t 1 β 1 t
The values of m t and v t are initially zero, and β 1 , β 2 ϵ 0 , 1 are defined as the decay rate for the moment estimates. The parameter e ( w ( t ) ) is the convex differentiable error function, the parameter w ( 0 ) is the initial weight vector, and β 1 , t = β 1 λ t 1 that λ ϵ 0 , 1 ,   ϵ > 0 . The pseudocode of ADAM algorithm is defined as follows (Figure 10):
Where t is a unit, g t is the objective stochastic gradients, m t is the biased first-moment estimate, v t is the biased second-row moment estimate, m ^ t is the bias-corrected first-moment estimate, v ^ t is the bias-corrected second-row moment estimate, in this algorithm, while loops are continuing until w(t) converges, and the value of w 0 is returned at each step [76].
The implemented network can detect and recognize all types of road pavement distress in different sizes with great accuracy and in the shortest possible time. In addition, it successfully overcomes challenges such as crowded backgrounds, the availability of multiple distresses, the presence of them in the shadow, and the lack of sufficient contrast and illumination in aerial and terrestrial images. This powerful model uses a single GPU to accurately recognize all types of pavement distress. The training phase used 80% of the data, and after applying the specific changes in the configuration files, this network passed the training phase and was ready for the test and evaluation phase.

3.3. Network Testing and Evaluation

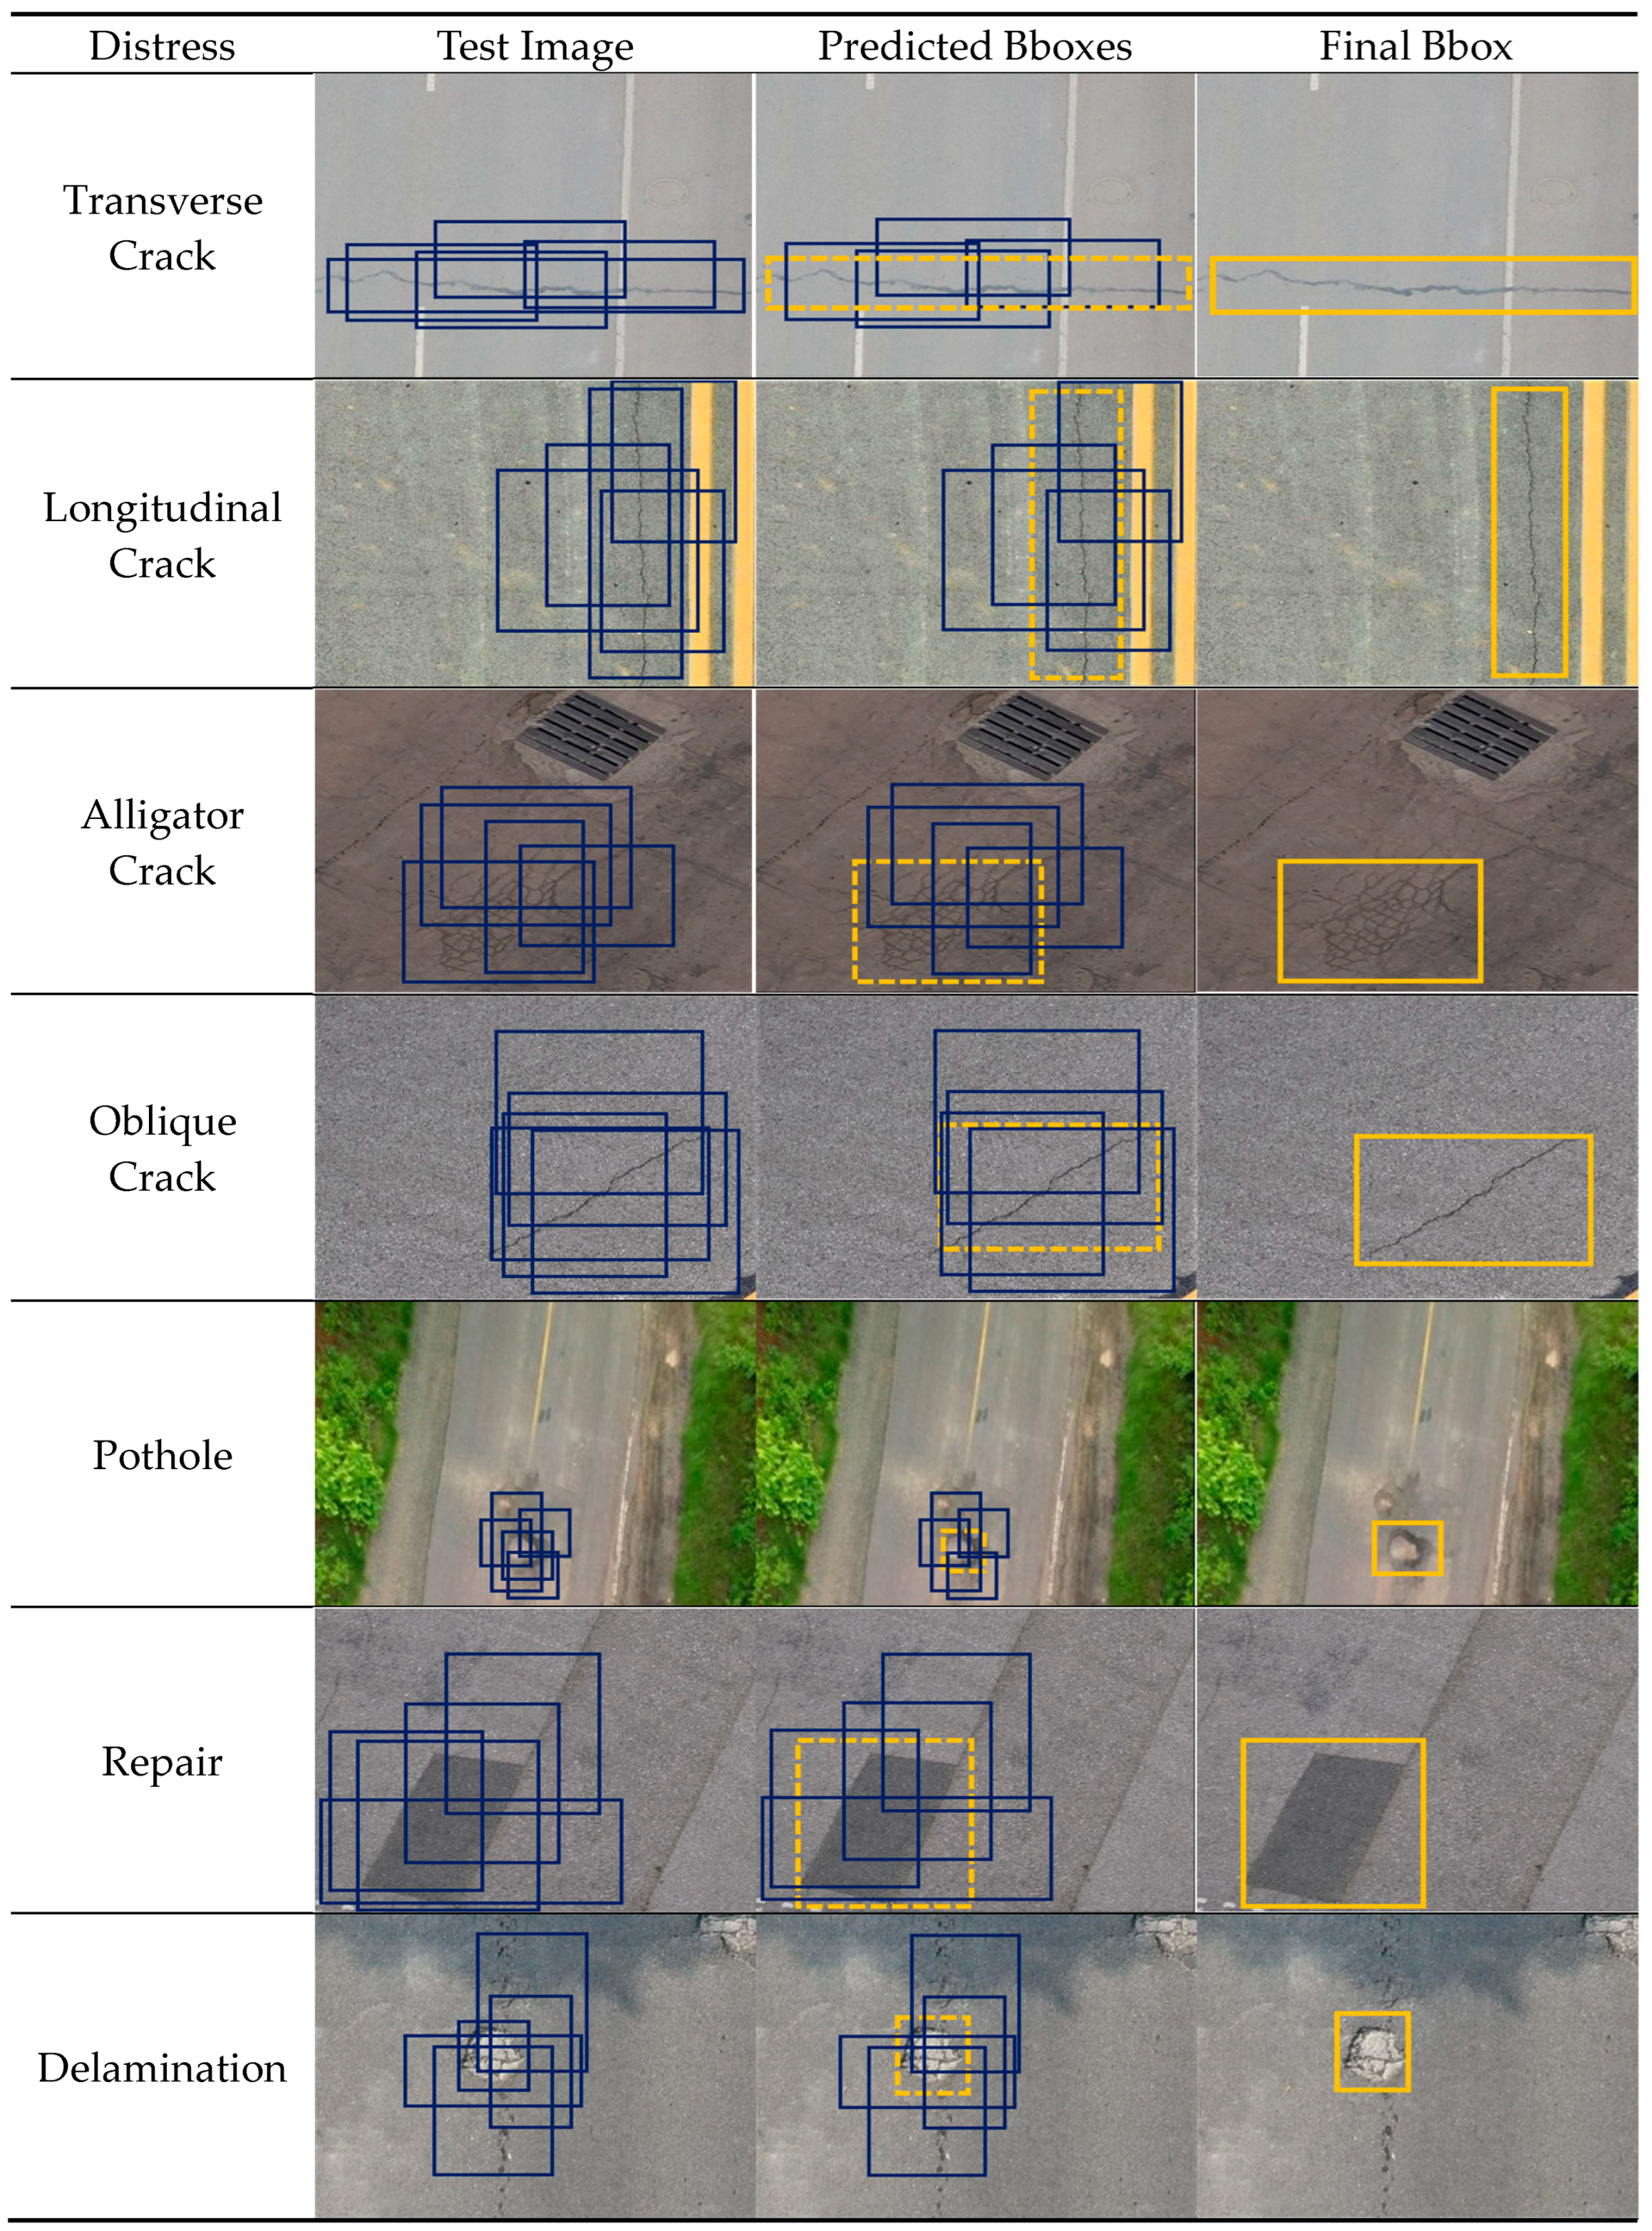
The testing phase was performed to choose the final box containing the pavement distress and to measure the performance of the final model using 20% of the data. During this step, various boxes of different sizes were detected; however, the objective was to carefully select the optimal and definitive bounding box that encompassed the object, ensuring that no other bounding box overlapped with critical regions of interest. Deep learning algorithms use the NMS algorithm to choose the final box containing the object [78]. In this step, boxes with a low confidence factor were removed and the final bounding box that contained the road distresses was selected. As illustrated in Figure 11, the “yellow” bounding box represents the most optimal and conclusive selection encompassing the distress. Following the model testing phase, the evaluation criteria of precision, recall, f1-score, and accuracy were utilized to gain deeper insights into the proposed network’s performance in accurately recognizing various types of pavement distress. Precision calculates the percentage of correct predictions among all predicted samples and evaluates the level of misdiagnosis (Equation (5)).
Recall measures the level of missed detections and calculates the proportion of correct predictions among all true samples (Equation (6)) [34].
P r e c i s i o n = T P T P + F P
R e c a l l = T P T P + F N
The precision and recall values are very important. For this reason, in addition to calculating these two criteria separately, this study uses the f1-score, the weighted average of the precision and recall criteria, to accurately evaluate the performance of the proposed algorithm (Equation (7)) [34].
f 1 s c o r e = 2 T P 2 T P + F P + F N
Accuracy is also an evaluation metric that measures the model efficiency in all classes and represents the ratio between the number of correct predictions and the total number of predictions. In this study, this criterion is used as one of the most important criteria to measure the general performance of the model in all network classes (Equation (8)). Also, mAP (Mean Average Precision) is used to calculate the average of the Average Precision (AV) metric across all classes in a model, and its value is measured between 0 and 1 (Equation (9)) [34].
A c c u r a c y = T P + T N T P + T N + F P + F N
m A P = 1 C l a s s e s c C l a s s e s T P ( c ) T P c + F P ( c )
To calculate the above evaluation criteria, the values for the number of True Positives (TPs), True Negatives (TNs), False Positives (FPs), and False Negatives (FNs) of the model are used.

3.4. Platform and Data Acquisition

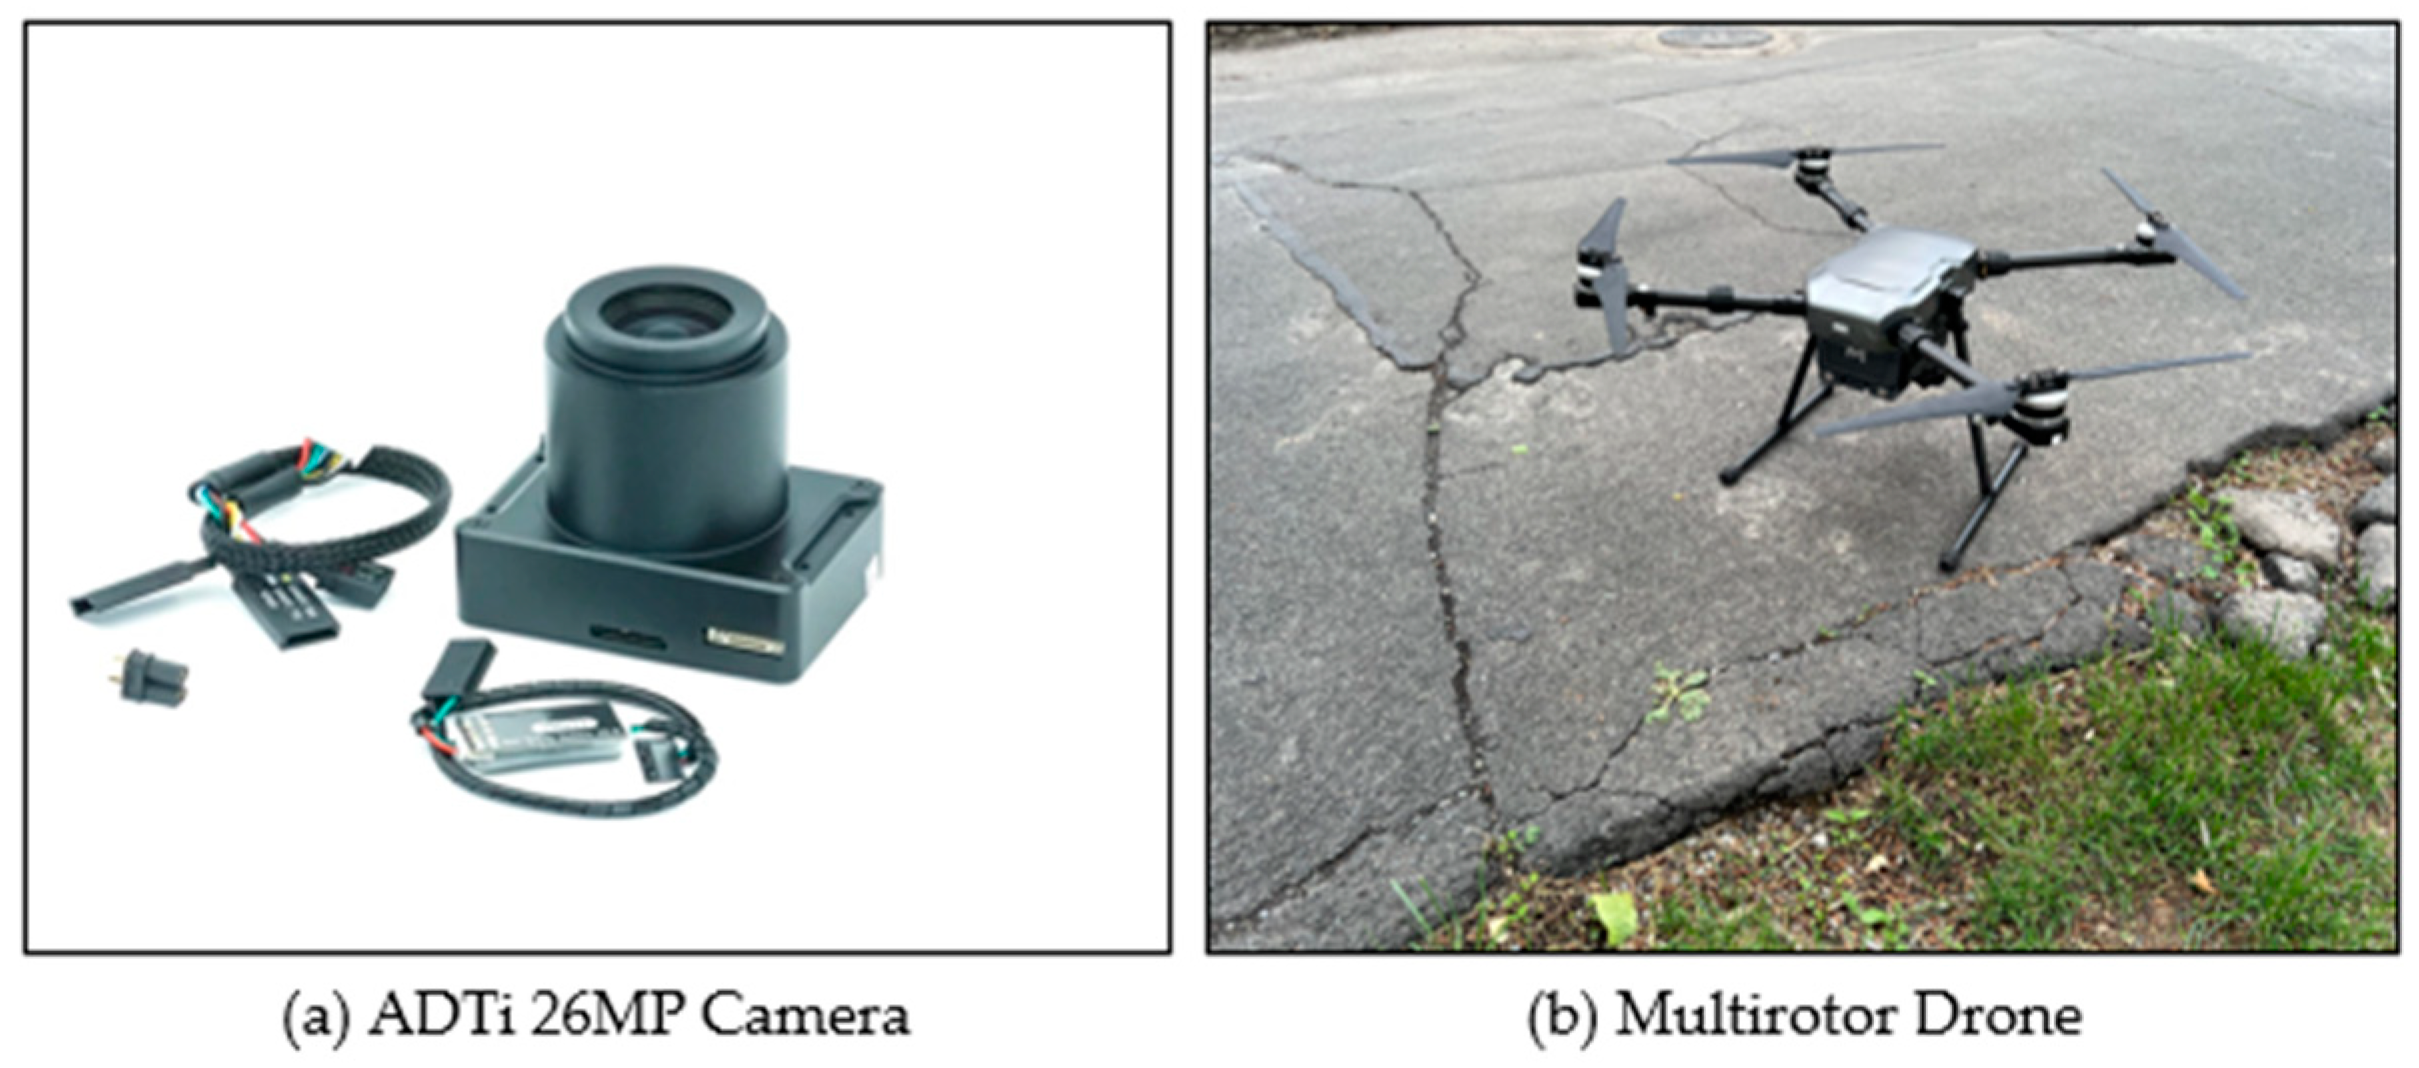
To develop and evaluate the proposed Deep Learning Network, a series of 5796 visible aerial and terrestrial images belonging to seven types of distress (transverse cracks, longitudinal cracks, alligator cracks, oblique cracks, potholes, repairs, and delamination) were used. For public data, images and videos from Google and YouTube were used, referring to various locations. The aerial data captured by the multirotor drone and the ADTI camera also referred to Iran, for which a flight permit was obtained for the city of Semnan. In these images, the defects appear under different conditions, such as in the shadow of the vehicle, in crowded backgrounds, and with different sizes. Aerial and terrestrial images of pavements with different distresses were also obtained. In the current study, a multirotor drone with lower flight altitude and speed and flexible mobility was used to acquire aerial images due to the specific anatomy of the roads and the coverage of multiple distresses. The aerial and terrestrial images used to train the model and test the implemented Deep Learning Network were acquired using the ADTi 26MP mapping camera (Figure 12). The aerial images were captured from different heights, angles, backgrounds, and views to ensure the diversity of the dataset and the pixel quality of the images was 6192 × 4128. Table 1 shows the information about the camera used. The GSD (Ground Sample Distance) with a flight height of 20 to 50 m is about 2 to 5 cm in ADTi 26MP camera.

4. Experiment and Result

In order to assess the performance of the implemented network in recognizing various forms of road pavement distresses, the YOLOv8 Deep Learning Network’s implementation steps were executed. Also, the types of collected images and the method of increasing the data, the training and testing steps are described in detail.
The trees in an area not only obscure the road surface but also affect the flight altitude of the drone. The flight altitude is an important parameter because it not only creates a crowded background and affects the clarity of different types of distress, but also can affect the intensity of the wind. This is because the higher the drone is, the more likely it is that the wind will blow in the direction of the drone [79]. Determining flight altitude depends on the height of the various obstacles that are in the drone’s flight path. For example, the minimum height of obstacles such as trees is 5 to 8 m, streetlights are 4 to 12 m, and traffic lights are 2.5 to 7.5 m [31]. In the current study, the flight altitude changes by a minimum of 20 m and a maximum of 50 m.

4.1. Data Preparation

In the current study, a series of visible aerial and terrestrial images belonging to seven types of distress (transverse cracks, longitudinal cracks, alligator cracks, oblique cracks, potholes, repairs, and delamination) were used. Almost 70% of this dataset was used for the training phase and 30% for the testing phase. To prepare these images, the labelImg [61] tool was used, which is a useful tool for deep learning projects. Within this dataset, transverse cracks are categorized within the first class, longitudinal cracks within the second class, alligator cracks within the third class, oblique cracks within the fourth class, potholes within the fifth class, repairs within the sixth class, and delamination within the seventh class.
Object detection and recognition algorithms require a large amount of data in the training phase to achieve high accuracy and reliability. However, collecting this amount of data is expensive and time-consuming. Therefore, using a model with this capability is very valuable and helps in creating a sufficient and diverse dataset. According to Figure 13, the proposed network uses the data augmentation technique with the mosaic data enhancement method [41].
The YOLOv8 network uses the mosaic data augmentation method to augment the training data. This network randomly selects a group of images from the training images containing different types of distress from aerial and terrestrial data (Figure 14). In this method, images are randomly cropped and combined into one image to augment the training images. As shown in Figure 14, a random group of 16 images is first selected from the collected training data. In the next step, four images are randomly selected from the 16 images. Then, four randomly selected images are cropped to a size of 104 (a quarter of the original image size) and combined. The final image has the same size as the input images of the network (416 × 416). Finally, the above operations are repeated for other batches, and the mosaic data is input to the neural network for training. This process is performed to enrich the training data, strengthen the network, and reduce the GPU video memory usage.

4.2. Model Implementation

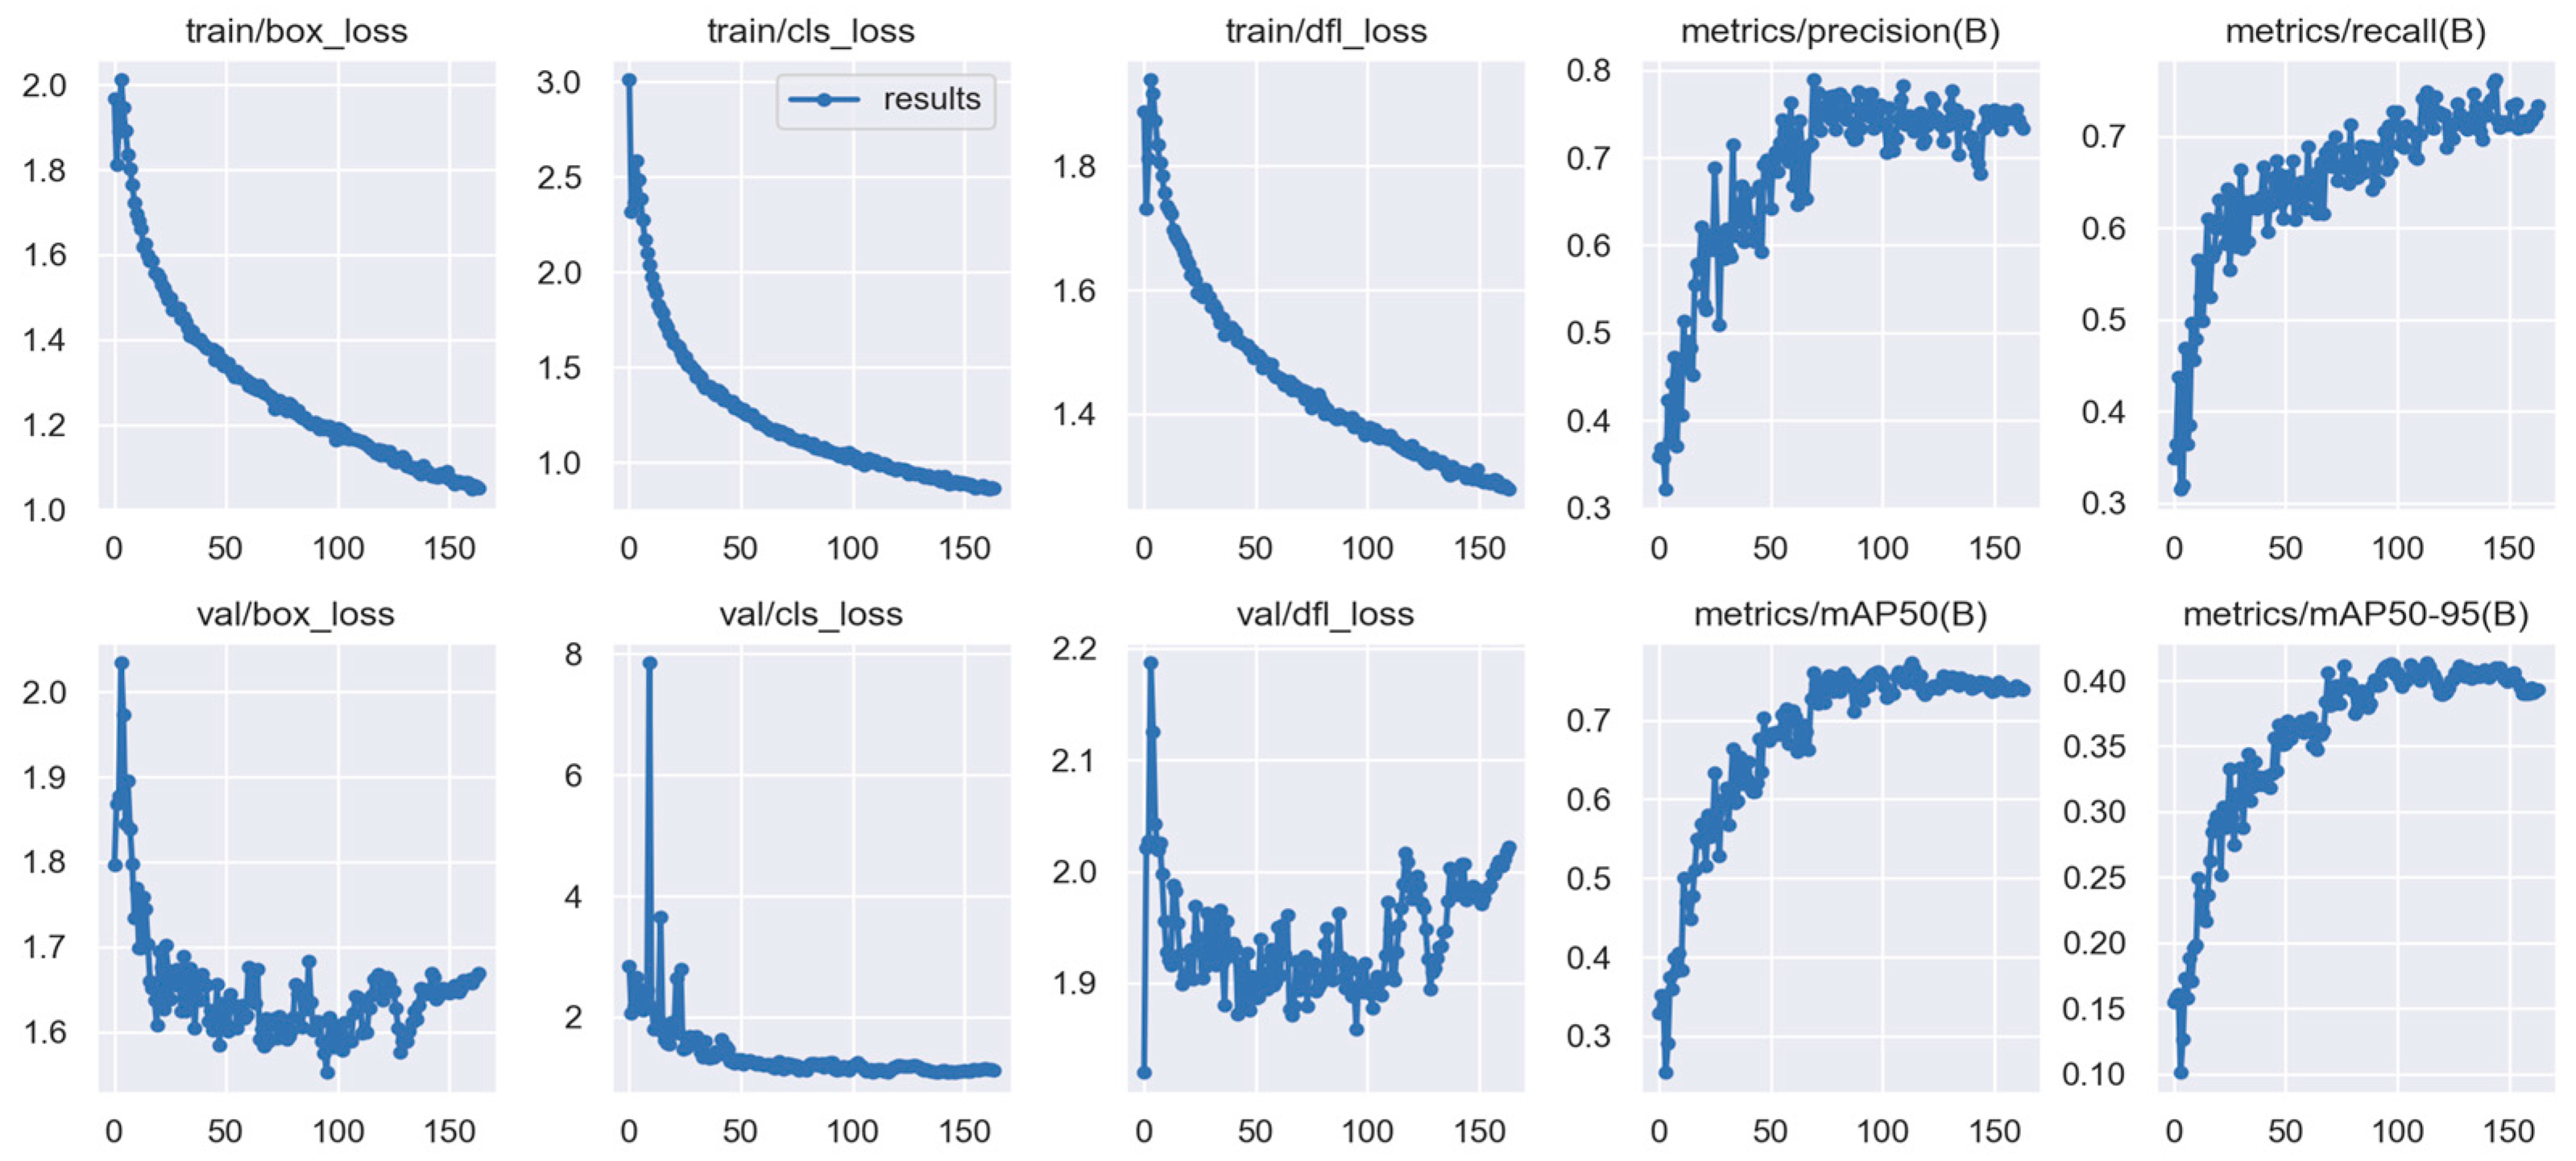
The suggested Deep Learning Network was trained utilizing Nvidia GeForce RTX 3050 Ti and 400 iterations. In this network, the input image dimensions were set to 416 × 416. Also, the number of classes was set to 7 and the batch value was set to 16. The proposed network relies on the PyTorch framework (version 1.9.0), the Compute Unified Device Architecture toolkit (version 10.0), and the CUDA Deep Neural Network library (version 8.2) to initiate the training and evaluate the network. After completing the training process, the final summary of the training results is shown in Figure 15. The three figures for box-loss, cls-loss, and dfl-loss show the classification accuracy and robustness of the recognized bounding boxes during the training process and the network validation process. The downward trend of these graphs shows that the classification error has decreased during the network training and testing, and the detected bounding boxes have come closer to the ground truth box. The figure for precision, recall, and mAP also show the changes in these three evaluation criteria during the training and testing process. The upward trend of these graphs shows the improvement of the classification and recognition process during the training and validation of the network.

4.3. Model Evaluation

To evaluate the network performance in detecting seven types of road pavement distresses in the training phase, the criteria of accuracy, mAP, recall, precision, and f1-score were used. Table 2 shows the results of the evaluation metrics of the proposed model. From this table, it can be seen that the average values for precision, recall, f1-score, mAP, and accuracy in all classes reach 77%, 75%, 74%, 79%, and 81%, respectively. The obtained values show that the proposed model performed acceptably in correctly recognizing all classes and has a low error rate. The obtained results show that the implemented network performs best in detecting and recognizing longitudinal cracks with mAP of 87%, recall of 83%, f1-score of 86%, and precision of 92%. According to these values, 92% of all longitudinal cracks are correctly classified and only 8% are misclassified.
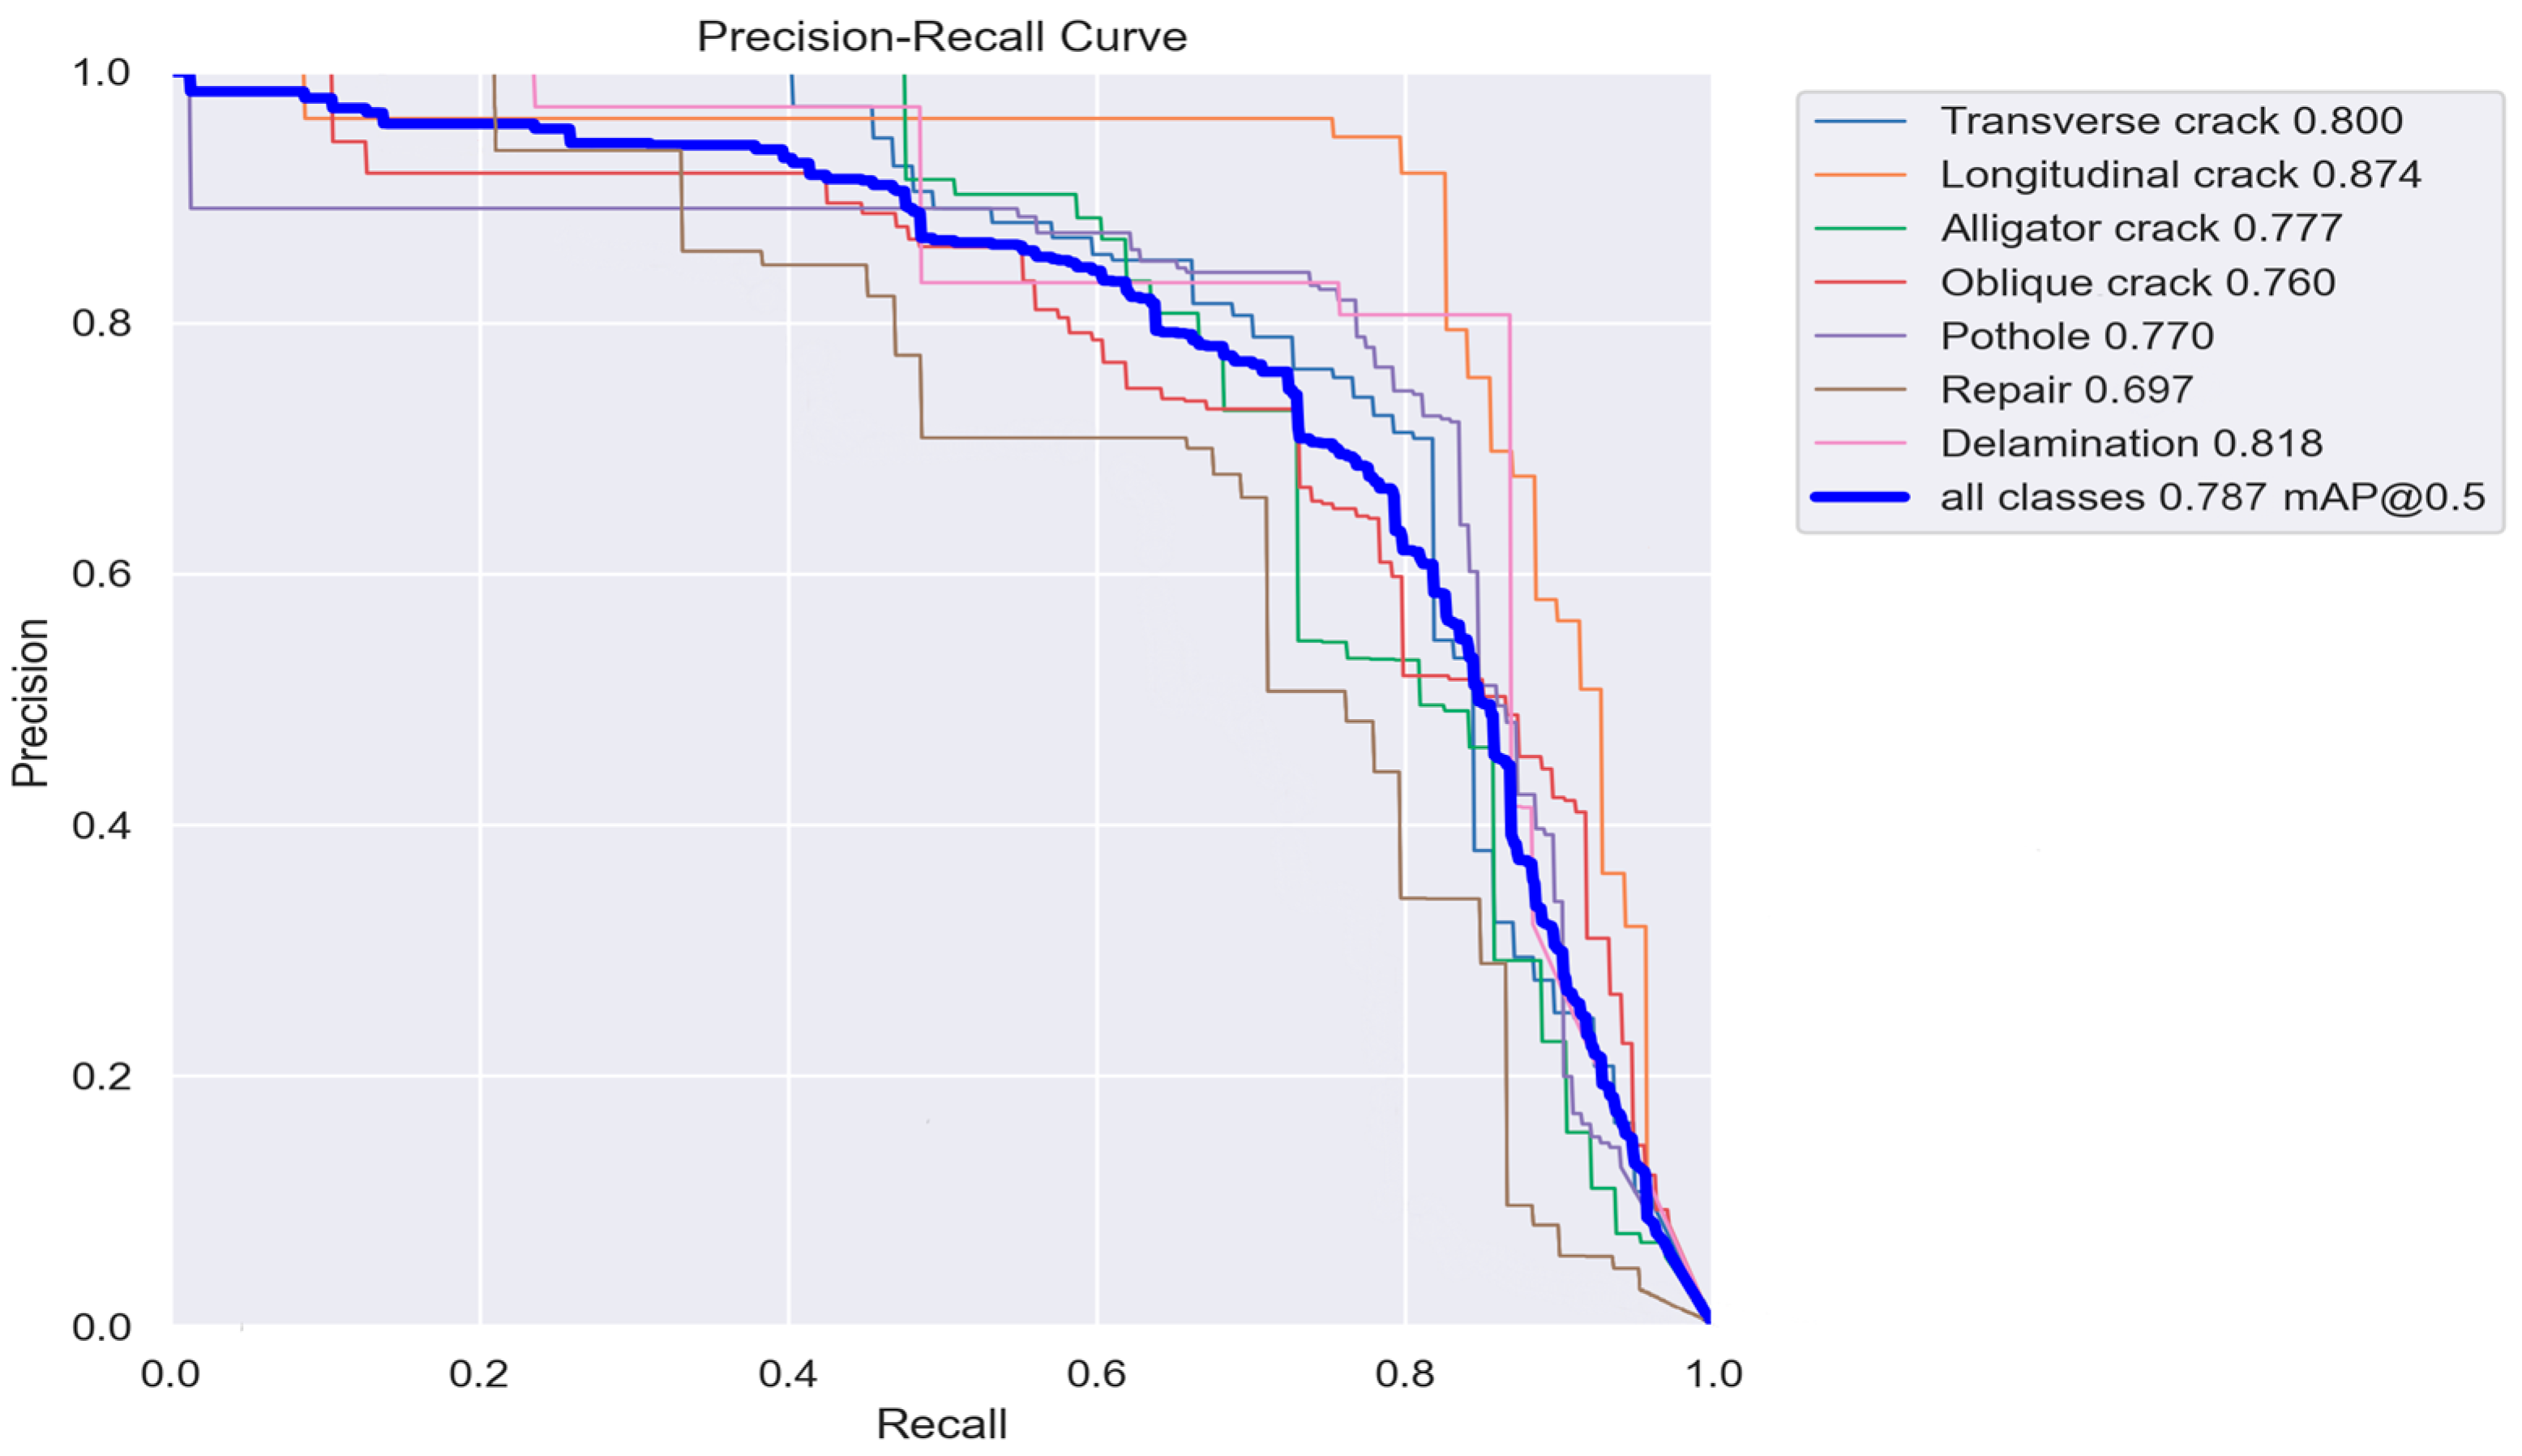
According to the recall value, 83% of the detected longitudinal cracks are longitudinal cracks, and only 17% of the other classes are misclassified as longitudinal cracks. Furthermore, the model shows the weakest performance in the repair class with a precision of 60%, recall of 69%, f1-score of 64%, and mAP of 69%. The reason for the poor performance of the model in this class compared to other classes is the similarity of the anatomy to other road pavement distresses. For this reason, the model may confuse this class with other classes, so the precision value is lower than other classes. In addition, the PR (precision-recall) curve is plotted to evaluate the model’s prediction preciseness (see Figure 16). In this figure, the recall values are plotted on the x-axis, and the precision on the y-axis. The more the curve leans toward the upper right corner (values closer to 1), the lower the misclassification rate for this model. In other words, the larger the AUC (area under the curve) in a class, the better the model performance in that class. Thus, in the figure, it can be seen that the best performance of the model is in the longitudinal cracks class and the worst performance is in the repairs class. As mentioned earlier, the training dataset is composed of aerial and terrestrial images, and the evaluation of the proposed network is examined in both categories.

4.3.1. Test Results on UAV Aerial Imagery

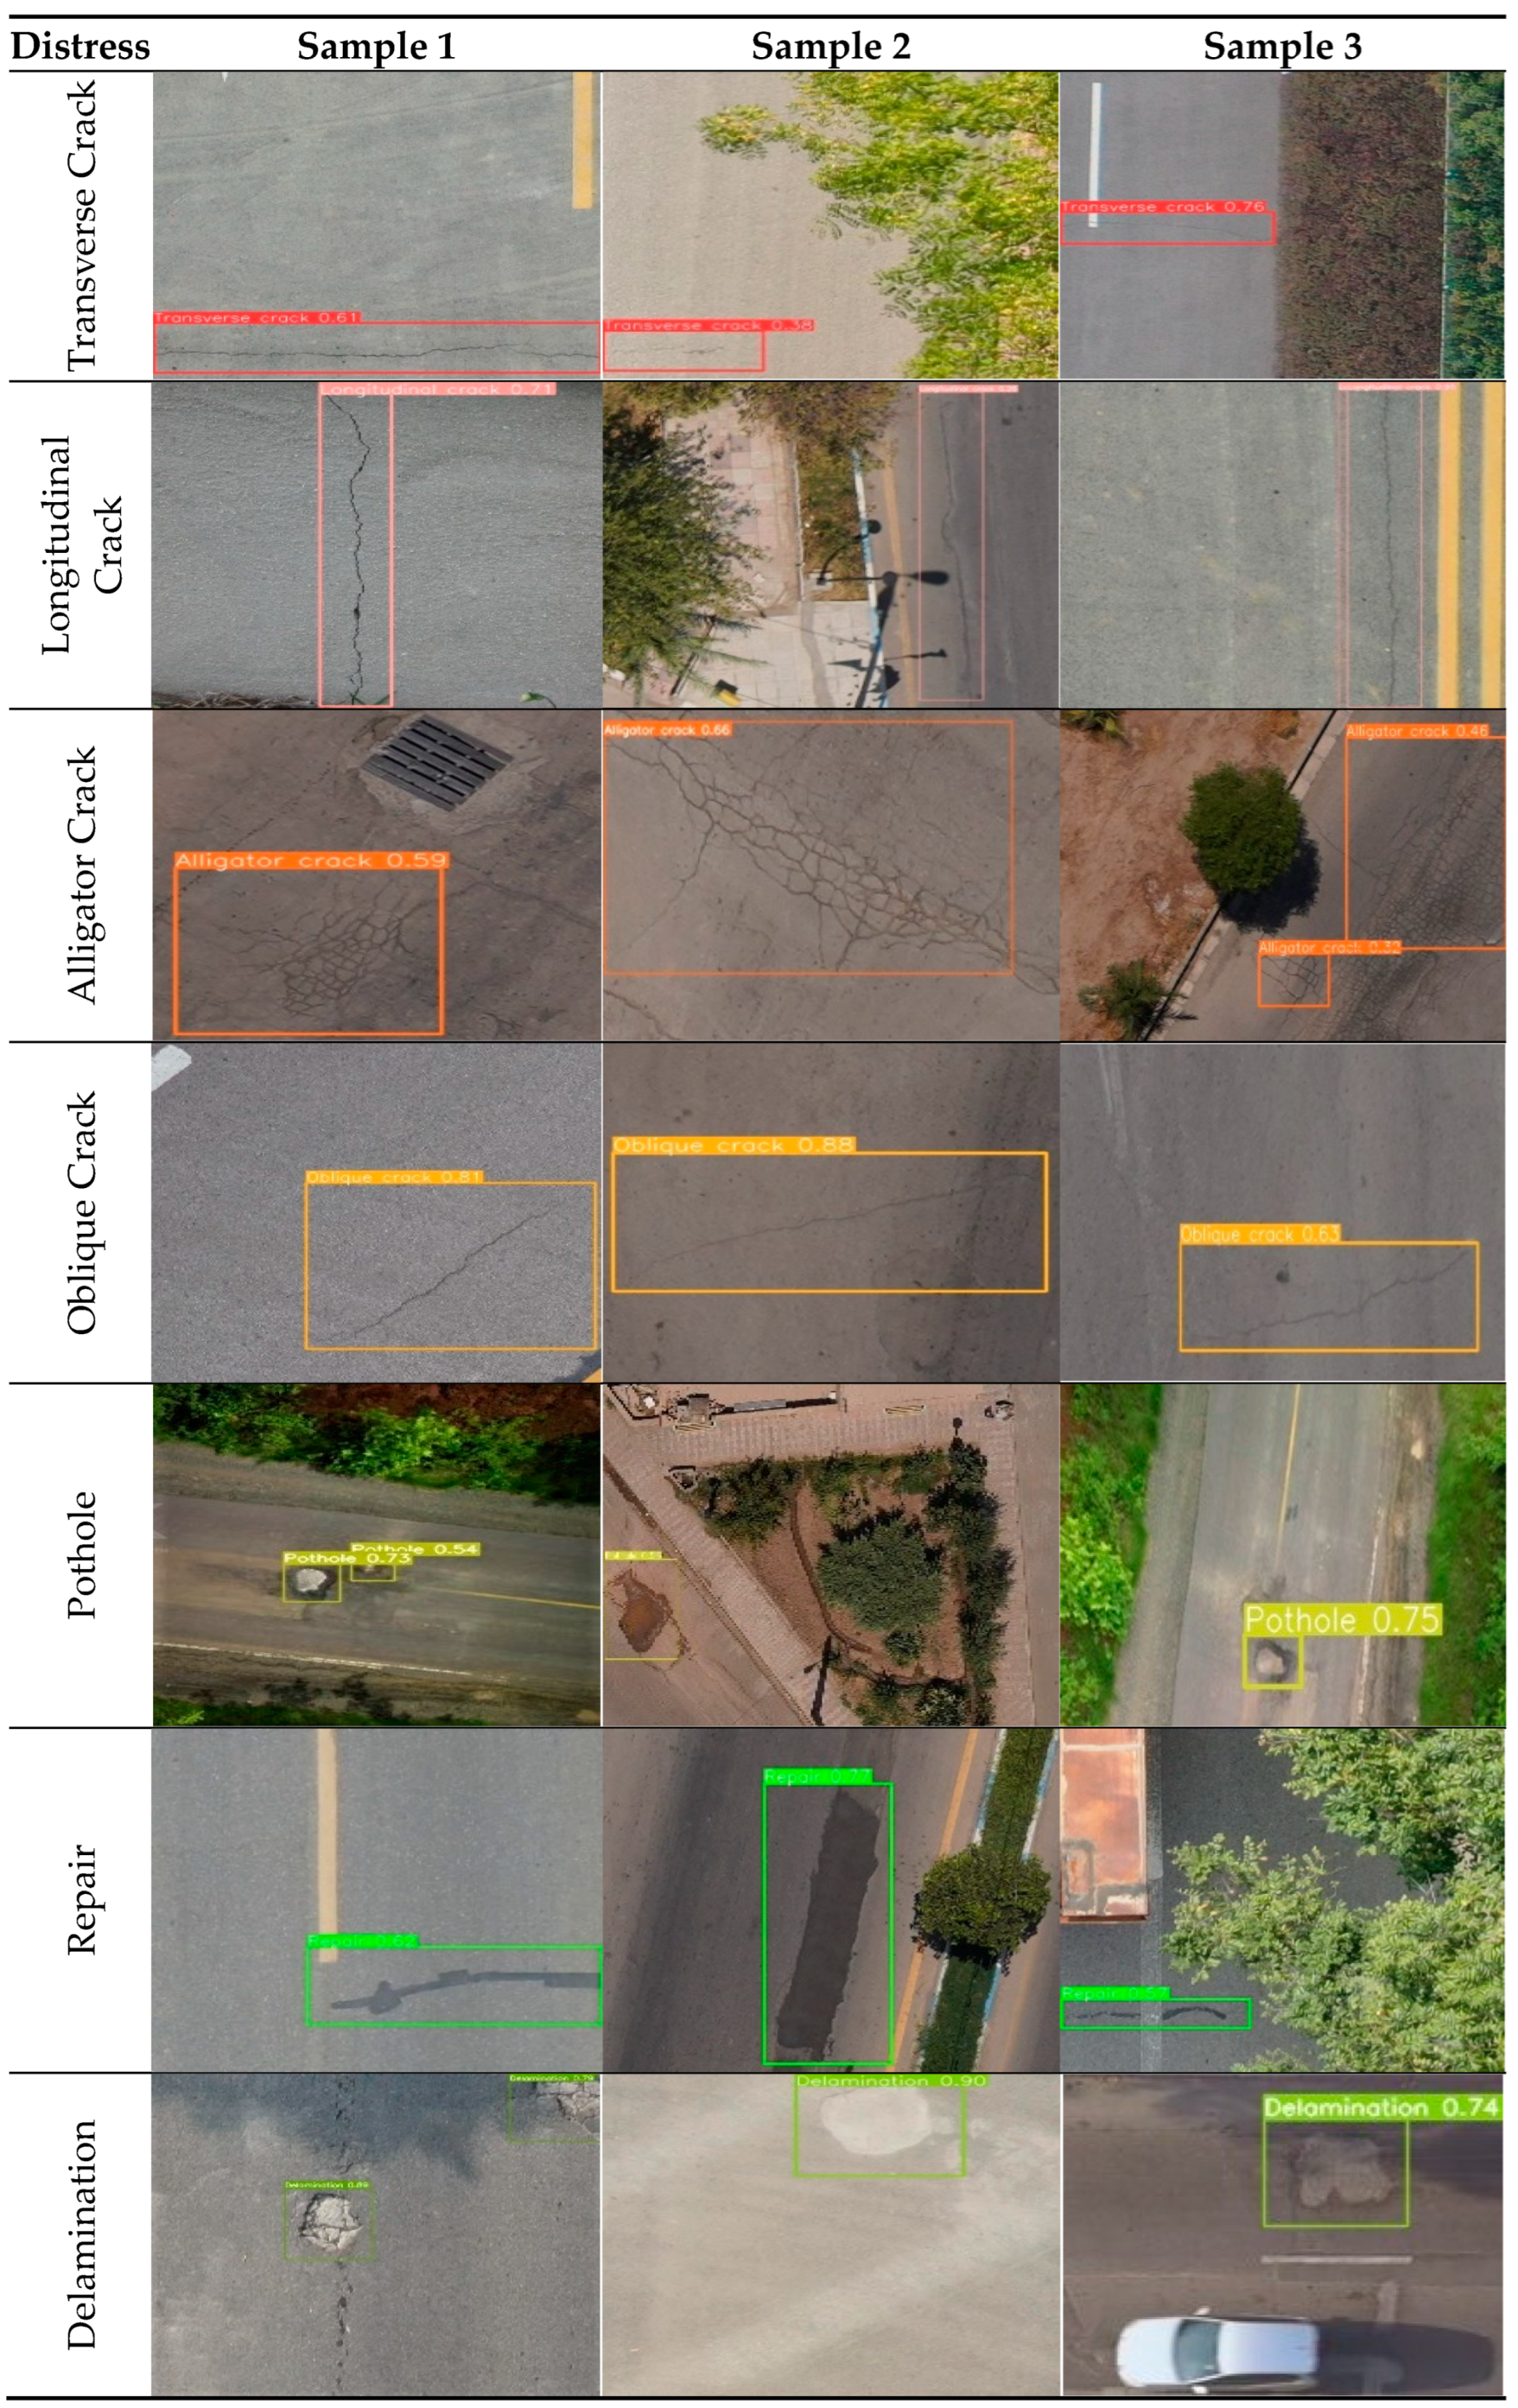
Figure 17 illustrates some samples of recognizing pavement distresses (transverse crack, longitudinal crack, alligator crack, oblique crack, pothole, repair, and delamination) in aerial images using the proposed network. The first row shows the results related to the transverse cracks. As it appears, transverse cracks are recognized at different heights from the road surface. Even in the images where the crack is not very clear, the network can recognize the crack well. In the second row, the results for longitudinal crack recognition are shown.
As it appears from this figure, the network can recognize the cracks in situations where it is not possible to separate the background. For example, in the first and third images, the contrast between the crack and the background is insignificant, and the separation of the background cannot be made easily. Also in the second image, the crack is next to some obstacles like the shadow of the streetlight, and the network is able to recognize it. The third and fourth rows show the results of alligator and oblique crack detection and recognition. The network can recognize single or multiple cracks and draw a correct bounding box around the crack.
The fifth row shows the types of potholes, single and multiple, and the network can detect different sizes of them correctly. The sixth row shows the results of the repair class. As it appears, the general anatomy of these defects is almost similar to others, and basically, these problems are used to repair types of damage in the pavement. Moreover, the difference in gray levels between the repair and the background is very small in some images. However, the network can recognize the types of this distress in different images. The seventh row shows the results of delamination distress. As it appears, this type of distress is very similar to the damage caused by potholes. In the second image, the delamination is also very similar to the background. However, the network can recognize it with the correct bounding box.

4.3.2. Test Results on Terrestrial Imagery

Figure 18 shows the results of pavement distress recognition in terrestrial images.
In this figure, the first row shows the results of transverse crack detection in different images with different angles to the camera. As it appears in the third image, the difference between the crack color and the background is negligible. The second row shows the results of longitudinal cracks further away from the camera and in low ambient light. The third and fourth rows show alligator and oblique cracks in different environments. In all of these images, the results of recognizing all crack types in terrestrial images are completely successful. The fifth row shows the results of the pothole recognition. As it appears, the network is able to recognize single or multiple potholes in images where the difference with the background is negligible. The sixth row shows the results of repair distress recognition. For example, in the first image, the alligator crack is repaired, and the network can assign it to the repair class without mistaking it for a crack. The last row shows the results of the detection of delamination, which can be easily distinguished from potholes despite their structural similarity.
As shown in the previous section, height does not play a role in terrestrial images and the camera is close to the ground. For this reason, the anatomy of the distress types is clear, and the network recognizes distress types with a higher overlap with the ground truth data. Furthermore, since the model is trained with a variety of terrestrial images with different angles, it is able to detect and recognize distress in a variety of oblique images. However, as the angle increases (the camera is closer to the ground), the physical appearance of the distress changes and it no longer overlaps with the ground truth data, so the ability of the network to recognize distress decreases. Regarding image resolution, the higher the image resolution, the greater the ability of the network to recognize distresses, as the anatomy is clearer. One of the challenges in detecting damage types is distinguishing between two types of damage, such as pothole and delamination, in aerial images due to the long distance. Another challenge is the presence of repairs that appear in the form of a crack instead of a patch, and can be mistakenly recognized as a crack. Distinguishing between different types of distresses in terrestrial images is easy as the network is able to find more similarities between the test data and the training data. However, the detection of distresses using terrestrial imagery cannot be used for large areas and requires human resources. Moreover, access to certain roads sometimes requires specialized vehicles, which can be solved by using drones and aerial imagery.
For aerial images from urban and non-urban areas, the performance of the network depends on the flight altitude. That is, the higher the altitude, the smaller the dimension of the distress and the weaker the network capability compared to the situation when the camera is close to the ground. For example, pothole distress and delamination are similar at an altitude of 50 m and a GSD of 5 cm, and it is difficult to distinguish between the two. It is also difficult to distinguish between cracks and repair distress at this height (when they do not look like patches). Therefore, the high resolution of the images at high altitude can be a great help in the correct and accurate recognition of all types of distress. Therefore, it can be said that if the terrestrial and aerial dataset used is rich, problems such as the similarity between potholes and delamination and the similarity between repair and cracks do not occur, and different types of distress with different sizes at different heights can be recognized.

4.3.3. Addressing the Challenges of Network Implementation

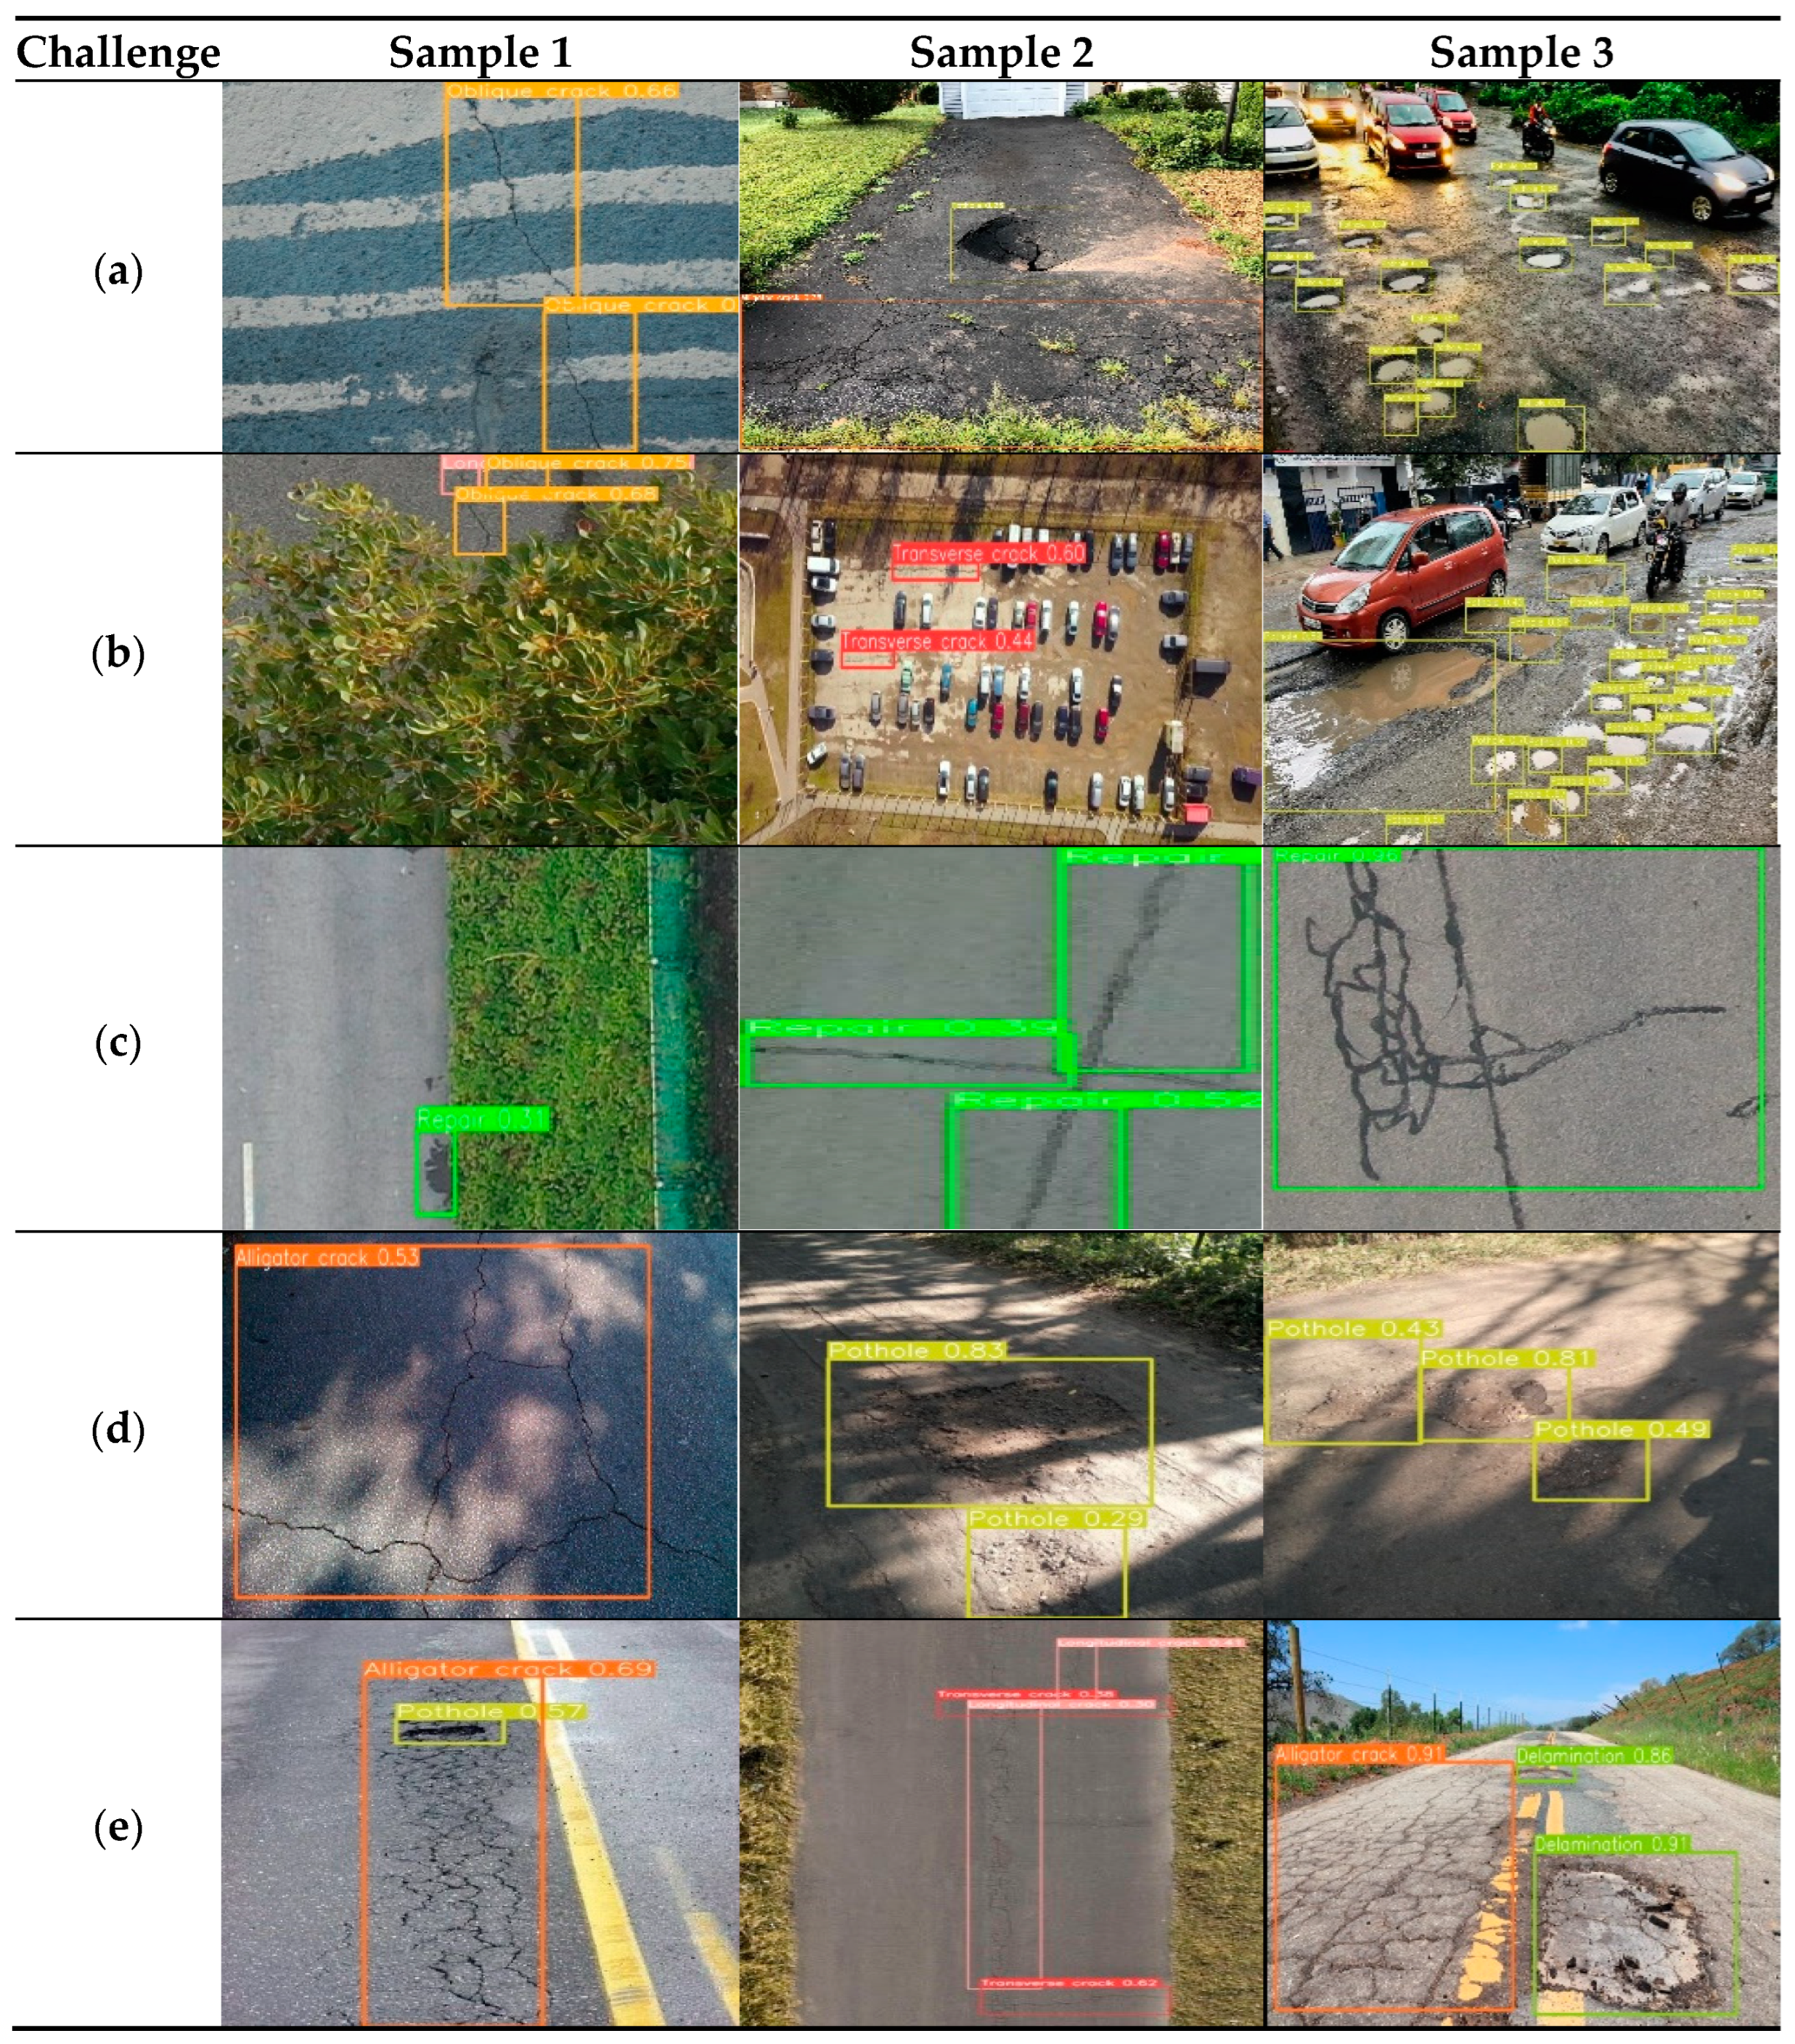
Recognizing different pavement distresses in visible images faces challenges, such as the incapacity to separate the background, the lack of sufficient contrast, a crowded background, the availability of multiple distresses, and light problems in the image. Also, the small size of the cracks and the presence of distresses in shadows and white lines on the road can affect the final accuracy in recognizing all types of pavement problems. In this article, using the YOLOv8 network together with performing techniques before starting the training process has solved all kinds of challenges in the distress recognition process, as shown in Figure 19.
In this way, different types of complex images in different and difficult environmental conditions are used in the data preparation phase. As a result, the generalizability of the model has been increased and it is able to manage well with the various challenging scenarios in the real world. The proposed network divides the received image into cells and assigns anchor boxes to each cell. By applying this technique, the model is able to recognize multiple types of distresses in the grid cells simultaneously. Moreover, by using feature maps at multiple scales with different prediction levels at each scale, distresses in different sizes are detected and recognized. In this network, spatial attention modules that focus on important areas and suppressing distracting factors such as busy backgrounds have led to accurate localization and detection of complications. Finally, after completing the detection process, YOLOv8 applied a Non-Maximum Suppression algorithm to filter the additional bounding boxes, eliminating duplicate detections and increasing detection accuracy. Therefore, the implemented neural network can overcome all kinds of problems and challenges in detecting seven types of distress such as transverse cracks, longitudinal cracks, alligator cracks, oblique cracks, potholes, repairs, and delamination under different conditions (Figure 19).

5. Discussion

In the current study, evaluation criteria such as mAP, f1-score, precision, accuracy, and recall were used to evaluate the performance of the implemented model. The obtained results in seven separate classes are as follows: 79% precision, 73% recall, 74% f1-score, 80% mAP for transverse cracks, 92% precision, 83% recall, 86% f1-score, 87% mAP for longitudinal cracks, 72% precision, 73% recall, 72% f1-score, 78% mAP for alligator cracks, 71% precision, 75% recall, 72% f1-score, 79% mAP for oblique cracks, 78% precision, 77% recall, 76% f1-score, 77% mAP for potholes, 60% precision, 69% recall, 64% f1-score, 70% mAP for repairs, and 83% precision, 76% recall, 78% f1-score, 82% mAP for delamination. According to the results and the definition of each criterion, the proposed model has an acceptable performance in recognizing and discriminating between the seven classes. Also, the overall accuracy and mAP of the model are 9% and 10%, respectively, and these two values indicate the desirable overall performance and low error rate of the model in classifying each distress.
Considering the results reported by published articles on selecting the data processing and deep learning methods and comparing them regarding accuracy, speed, and performance to overcome the existing challenges, the recent version of the YOLO Deep Learning Network is used in this study. The YOLOv8 Deep Learning Network represents the most recent advancement of the YOLO network, renowned for its exceptional accuracy and speed in object recognition. Its impressive computational power has garnered significant attention in the field [26]. This network, due to its multiscale architecture, light weight, and successive convolutional layers, is capable of recognizing different types of distresses at different sizes in challenging aerial and terrestrial datasets. The implemented Deep Learning Network can detect and recognize types of distress and solve challenges with accuracy and mAP values of 9% and 10%, respectively.
As depicted in Figure 19 in the first row, the proposed model exhibits the capability to recognize pavement distress in images that feature a cluttered background, where discerning such distress manually becomes challenging for the human eye. The second row also shows the model’s ability to detect and recognize small and distant distresses. The third row shows repair distresses that the model classified correctly with a true bounding box. As mentioned earlier, this type of distress is caused by compensation for other distresses, so it is very similar to some of them. The last two rows contain distresses in different lighting conditions, which are correctly classified by the proposed method. The collection of these images shows the performance of the implemented method in challenging conditions, which is due to the appropriate architecture of the proposed network, the proper setting of the training process, the optimal training, and the comprehensive data collection. However, because of the similarity of cracks, the similarity of repairs to other distresses, and the physical similarity of potholes to delamination, the network can sometimes get confused and fail to distinguish them. Of course, the distinction between these problems is not always recognizable to the human eye as well.

6. Conclusions

The excessive use of road infrastructure, the increase in traffic load, the occurrence of natural disasters, and weather changes cause damage to the road surface, which multiplies the need to recognize the types of distress, their accurate and timely monitoring, and repair. However, challenges such as the presence of shadows, the small size of the distress, the lack of sufficient brightness and contrast between the distress and the background, and the presence of multiple distresses in the image make them difficult to detect and recognize accurately and quickly. In the current study, the YOLOv8 Deep Learning Network with the advantage of lightweight and multiscale architecture was proposed to detect and recognize seven common types of distress such as transverse cracks, alligator cracks, longitudinal cracks, oblique cracks, potholes, repairs, and delamination. For this network, 5796 aerial and terrestrial images with different types of distress were prepared, of which 70% were used for the training phase and 30% for the testing phase. After training the network, its performance was evaluated using the criteria of mAP, f1-score, accuracy, precision, and recall, and reached values of 79%, 74%, 81%, 77%, and 75% respectively. These results show not only the high accuracy of the model in recognizing distress but also the generalizability of the model in the distress recognition challenges. Given the patch-based labeling process of the YOLO network and the impact on the accuracy of the network, semantic segmentation-based methods and skeleton process implementation can be used in future work to directly extract the shape of distress. Also, more types of distresses can be added to the dataset, and in addition to the two-dimensional study of distresses, their depth can be determined in three dimensions.

Author Contributions

Conceptualization, F.S. and F.D.J.; Methodology, F.A.M.; Software, M.G.; Validation, F.D.J., F.A.M. and F.N.; Investigation, F.A.M.; Data curation, M.G.; Writing—original draft, F.A.M. and M.G.; Writing—review & editing, F.S., F.D.J. and F.N.; Supervision, F.S. All authors have read and agreed to the published version of the manuscript.

Funding

This research received no external funding.

Data Availability Statement

The public part of our dataset can be accessible through: https://public.roboflow.com/object-detection/pothole (accessed on 1 September 2022). and https://paperswithcode.com/dataset/rdd-2020 (accessed on 1 September 2022).

Conflicts of Interest

The authors declare no conflicts of interest.

References

  1. Gopalakrishnan, K. Deep learning in data-driven pavement image analysis and automated distress detection: A review. Data 2018, 3, 28. [Google Scholar] [CrossRef]
  2. Eisenbach, M.; Stricker, R.; Seichter, D.; Amende, K.; Debes, K.; Sesselmann, M.; Ebersbach, D.; Stoeckert, U.; Gross, H.-M. How to get pavement distress detection ready for deep learning? A systematic approach. In Proceedings of the 2017 International Joint Conference on Neural Networks (IJCNN), Anchorage, AK, USA, 14–19 May 2017; pp. 2039–2047. [Google Scholar]
  3. Zhang, L.; Yang, F.; Zhang, Y.D.; Zhu, Y.J. Road crack detection using deep convolutional neural network. In Proceedings of the 2016 IEEE International Conference on Image Processing (ICIP), Phoenix, AZ, USA, 25–28 September 2016; pp. 3708–3712. [Google Scholar]
  4. Deng, J.; Singh, A.; Zhou, Y.; Lu, Y.; Lee, V.C.-S. Review on computer vision-based crack detection and quantification methodologies for civil structures. Constr. Build. Mater. 2022, 356, 129238. [Google Scholar] [CrossRef]
  5. Sarmiento, J.-A. Pavement distress detection and segmentation using YOLOv4 and DeepLabv3 on pavements in the Philippines. arXiv 2021, arXiv:2103.06467. [Google Scholar]
  6. Guo, L.; Li, R.; Jiang, B. A road surface damage detection method using yolov4 with pid optimizer. Int. J. Innov. Comput. Inform. Control. 2021, 17, 1763–1774. [Google Scholar]
  7. Doshi, K.; Yilmaz, Y. Road damage detection using deep ensemble learning. In Proceedings of the 2020 IEEE International Conference on Big Data (Big Data), Atlanta, GA, USA, 10–13 December 2020; pp. 5540–5544. [Google Scholar]
  8. Rasol, M.; Pais, J.C.; Pérez-Gracia, V.; Solla, M.; Fernandes, F.M.; Fontul, S.; Ayala-Cabrera, D.; Schmidt, F.; Assadollahi, H. GPR monitoring for road transport infrastructure: A systematic review and machine learning insights. Constr. Build. Mater. 2022, 324, 126686. [Google Scholar] [CrossRef]
  9. Pan, Y.; Zhang, L. Roles of artificial intelligence in construction engineering and management: A critical review and future trends. Autom. Constr. 2021, 122, 103517. [Google Scholar] [CrossRef]
  10. Miller, J.S.; Bellinger, W.Y. Distress Identification Manual for the Long-Term Pavement Performance Program; No. FHWA-RD-03-031; Federal Highway Administration. Office of Infrastructure Research and Development: McLean, VA, USA, 2003. [Google Scholar]
  11. Dixit, A.M.; Singh, H.; Meitzler, T. Soft computing approach to crack detection and FPGA implementation. Mater. Eval. 2010, 68, 1263–1272. [Google Scholar]
  12. Zhong, M.; Sui, L.; Wang, Z.; Hu, D. Pavement Crack Detection from Mobile Laser Scanning Point Clouds Using a Time Grid. Sensors 2020, 20, 4198. [Google Scholar] [CrossRef]
  13. Fang, F.; Li, L.; Gu, Y.; Zhu, H.; Lim, J.-H. A novel hybrid approach for crack detection. Pattern Recognit. 2020, 107, 107474. [Google Scholar] [CrossRef]
  14. Cha, Y.J.; Choi, W.; Suh, G.; Mahmoudkhani, S.; Büyüköztürk, O. Autonomous structural visual inspection using region-based deep learning for detecting multiple damage types. Comput. Aided Civ. Infrastruct. Eng. 2018, 33, 731–747. [Google Scholar] [CrossRef]
  15. Chmaj, G.; Selvaraj, H. Distributed processing applications for UAV/drones: A survey. In Progress in Systems Engineering: Proceedings of the Twenty-Third International Conference on Systems Engineering; Springer: Berlin/Heidelberg, Germany, 2015; pp. 449–454. [Google Scholar]
  16. Hassanalian, M.; Abdelkefi, A. Classifications, applications, and design challenges of drones: A review. Prog. Aerosp. Sci. 2017, 91, 99–131. [Google Scholar] [CrossRef]
  17. Sawrate, S.; Dhavalikar, M.N. A Review of Applications of Unmanned Aerial Vehicles in Science and Engineering. Int. J. Eng. Technol. Manag. Appl. Sci. 2016, 4, 150–155. [Google Scholar]
  18. Jordan, S.; Moore, J.; Hovet, S.; Box, J.; Perry, J.; Kirsche, K.; Lewis, D.; Tse, Z.T.H. State-of-the-art technologies for UAV inspections. IET Radar Sonar Navig. 2018, 12, 151–164. [Google Scholar] [CrossRef]
  19. Oliveira, H.; Correia, P.L. Automatic road crack segmentation using entropy and image dynamic thresholding. In Proceedings of the 2009 17th European Signal Processing Conference, Glasgow, UK, 24–28 August 2009; pp. 622–626. [Google Scholar]
  20. Zhao, H.; Qin, G.; Wang, X. Improvement of canny algorithm based on pavement edge detection. In Proceedings of the 2010 3rd International Congress on Image and Signal Processing, Yantai, China, 16–18 October 2010; pp. 964–967. [Google Scholar]
  21. Zhang, D.; Li, Q.; Chen, Y.; Cao, M.; He, L.; Zhang, B. An efficient and reliable coarse-to-fine approach for asphalt pavement crack detection. Image Vis. Comput. 2017, 57, 130–146. [Google Scholar] [CrossRef]
  22. Gao, W.; Zhang, X.; Yang, L.; Liu, H. An improved Sobel edge detection. In Proceedings of the 2010 3rd International Conference on Computer Science and Information Technology, Chengdu, China, 9–11 July 2010; pp. 67–71. [Google Scholar]
  23. Wang, X. Laplacian operator-based edge detectors. IEEE Trans. Pattern Anal. Mach. Intell. 2007, 29, 886–890. [Google Scholar] [CrossRef]
  24. Levkine, G. Prewitt, Sobel and Scharr gradient 5 × 5 convolution matrices. Image Process. Artic. Second Draft 2012. [Google Scholar]
  25. Cord, A.; Chambon, S. Automatic road defect detection by textural pattern recognition based on AdaBoost. Comput. Aided Civ. Infrastruct. Eng. 2012, 27, 244–259. [Google Scholar] [CrossRef]
  26. Subirats, P.; Dumoulin, J.; Legeay, V.; Barba, D. Automation of pavement surface crack detection using the continuous wavelet transform. In Proceedings of the 2006 International Conference on Image Processing, Atlanta, GA, USA, 8–11 October 2006; pp. 3037–3040. [Google Scholar]
  27. Abdel-Qader, I.; Abudayyeh, O.; Kelly, M.E. Analysis of edge-detection techniques for crack identification in bridges. J. Comput. Civ. Eng. 2003, 17, 255–263. [Google Scholar] [CrossRef]
  28. Prasanna, P.; Dana, K.J.; Gucunski, N.; Basily, B.B.; La, H.M.; Lim, R.S.; Parvardeh, H. Automated crack detection on concrete bridges. IEEE Trans. Autom. Sci. Eng. 2014, 13, 591–599. [Google Scholar] [CrossRef]
  29. Chen, J.-H.; Su, M.-C.; Cao, R.; Hsu, S.-C.; Lu, J.-C. A self organizing map optimization based image recognition and processing model for bridge crack inspection. Autom. Constr. 2017, 73, 58–66. [Google Scholar] [CrossRef]
  30. Valipour, P.S.; Golroo, A.; Kheirati, A.; Fahmani, M.; Amani, M.J. Automatic pavement distress severity detection using deep learning. Road Mater. Pavement Des. 2023, 2023, 1–17. [Google Scholar] [CrossRef]
  31. Zhu, J.; Zhong, J.; Ma, T.; Huang, X.; Zhang, W.; Zhou, Y. Pavement distress detection using convolutional neural networks with images captured via UAV. Autom. Constr. 2022, 133, 103991. [Google Scholar] [CrossRef]
  32. Hou, Y.; Dong, Y.; Zhang, Y.; Zhou, Z.; Tong, X.; Wu, Q.; Qian, Z.; Li, R. The Application of a Pavement Distress Detection Method Based on FS-Net. Sustainability 2022, 14, 2715. [Google Scholar] [CrossRef]
  33. Ali, L.; Alnajjar, F.; Khan, W.; Serhani, M.A.; Al Jassmi, H. Bibliometric Analysis and Review of Deep Learning-Based Crack Detection Literature Published between 2010 and 2022. Buildings 2022, 12, 432. [Google Scholar] [CrossRef]
  34. Simonyan, K.; Zisserman, A. Very deep convolutional networks for large-scale image recognition. arXiv 2014, arXiv:1409.1556. [Google Scholar]
  35. JitendraMalik, R.J.T. Rich feature hierarchies for accurate object detection and semantic segmentation. In Proceedings of the IEEE Conference on Computer Vision and Pattern Recognition, Columbus, OH, USA, 23–28 June 2014. [Google Scholar]
  36. Ren, S.; He, K.; Girshick, R.; Sun, J. Faster r-cnn: Towards real-time object detection with region proposal networks. Adv. Neural Inf. Process. Syst. 2015, 28, 91–99. [Google Scholar] [CrossRef]
  37. Long, J.; Shelhamer, E.; Darrell, T. Fully convolutional networks for semantic segmentation. In Proceedings of the IEEE Conference on Computer Vision and Pattern Recognition, New York, NY, USA, 15–17 June 1993; pp. 3431–3440. [Google Scholar]
  38. Liu, W.; Anguelov, D.; Erhan, D.; Szegedy, C.; Reed, S.; Fu, C.-Y.; Berg, A.C. Ssd: Single shot multibox detector. In Proceedings of the Computer Vision–ECCV 2016: 14th European Conference, Amsterdam, The Netherlands, 11–14 October 2016; Proceedings, Part I 14. pp. 21–37. [Google Scholar]
  39. Redmon, J.; Divvala, S.; Girshick, R.; Farhadi, A. You only look once: Unified, real-time object detection. In Proceedings of the IEEE Conference on Computer Vision and Pattern Recognition, Las Vegas, NV, USA, 27–30 June 2016; pp. 779–788. [Google Scholar]
  40. Skalski, P. How to Train YOLOv8 Object Detection on a Custom Dataset. Available online: https://blog.roboflow.com/how-to-train-yolov8-on-a-custom-dataset/ (accessed on 1 September 2022).
  41. Jacob Solawetz, F. What is YOLOv8? The Ultimate Guide. Available online: https://blog.roboflow.com/whats-new-in-yolov8/ (accessed on 1 September 2022).
  42. Samadzadegan, F.; Dadrass Javan, F.; Hasanlou, M.; Gholamshahi, M.; Ashtari Mahini, F. Automatic Road Crack Recognition Based on Deep Learning Networks from Uav Imagery. ISPRS Ann. Photogramm. Remote Sens. Spat. Inf. Sci. 2023, 10, 685–690. [Google Scholar] [CrossRef]
  43. SHRP2 Research Highlights Pavement Delamination Fixes. Available online: https://aashtojournal.org/2019/05/31/video-shrp2-research-highlights-pavement-delamination-fixes/#:~:text=%E2%80%9CDelamination%E2%80%9D%20refers%20to%20a%20condition,especially%20in%20the%20early%20stages (accessed on 1 September 2022).
  44. Yan, K.; Zhang, Z. Automated Asphalt highway pavement crack detection based on deformable single shot multi-box detector under a complex environment. IEEE Access 2021, 9, 150925–150938. [Google Scholar] [CrossRef]
  45. Yandell, W.; Pham, T. A fuzzy-control procedure for predicting fatigue crack initiation in asphaltic concrete pavements. In Proceedings of the 1994 IEEE 3rd International Fuzzy Systems Conference, Orlando, FL, USA, 26–29 June 1994; pp. 1057–1062. [Google Scholar]
  46. Tsubota, T.; Yoshii, T.; Shirayanagi, H.; Kurauchi, S. Effect of Pavement Conditions on Accident Risk in Rural Expressways. In Proceedings of the 2018 21st International Conference on Intelligent Transportation Systems (ITSC), Maui, HI, USA, 4–7 November 2018; pp. 3613–3618. [Google Scholar]
  47. Wang, M.; Sun, M.; Zhang, X.; Wang, Y.; Li, J. Mechanical behaviors of the thin-walled SHCC pipes under compression. In Proceedings of the 2015 International Conference on Transportation Information and Safety (ICTIS), Wuhan, China, 25–28 June 2015; pp. 797–801. [Google Scholar]
  48. Coenen, T.B.; Golroo, A. A review on automated pavement distress detection methods. Cogent Eng. 2017, 4, 1374822. [Google Scholar] [CrossRef]
  49. McGhee, K.H. Automated Pavement Distress Collection Techniques; Transportation Research Board: Washington, DC, USA, 2004; Volume 334. [Google Scholar]
  50. Song, L.; Wang, X. Faster region convolutional neural network for automated pavement distress detection. Road Mater. Pavement Des. 2021, 22, 23–41. [Google Scholar] [CrossRef]
  51. Silva, L.A.; Sanchez San Blas, H.; Peral García, D.; Sales Mendes, A.; Villarubia González, G. An architectural multi-agent system for a pavement monitoring system with pothole recognition in UAV images. Sensors 2020, 20, 6205. [Google Scholar] [CrossRef]
  52. Yang, C.; Chen, J.; Li, Z.; Huang, Y. Structural crack detection and recognition based on deep learning. Appl. Sci. 2021, 11, 2868. [Google Scholar] [CrossRef]
  53. Chun, P.-j.; Yamane, T.; Tsuzuki, Y. Automatic detection of cracks in asphalt pavement using deep learning to overcome weaknesses in images and GIS visualization. Appl. Sci. 2021, 11, 892. [Google Scholar] [CrossRef]
  54. Shaghouri, A.A.; Alkhatib, R.; Berjaoui, S. Real-time pothole detection using deep learning. arXiv 2021, arXiv:2107.06356. [Google Scholar]
  55. Shu, Z.; Yan, Z.; Xu, X. Pavement Crack Detection Method of Street View Images Based on Deep Learning. J. Phys. Conf. Ser. 2021, 1952, 022043. [Google Scholar] [CrossRef]
  56. Park, S.-S.; Tran, V.-T.; Lee, D.-E. Application of various yolo models for computer vision-based real-time pothole detection. Appl. Sci. 2021, 11, 11229. [Google Scholar] [CrossRef]
  57. Hu, G.X.; Hu, B.L.; Yang, Z.; Huang, L.; Li, P. Pavement crack detection method based on deep learning models. Wirel. Commun. Mob. Comput. 2021, 2021, 5573590. [Google Scholar] [CrossRef]
  58. Xu, X.; Zhao, M.; Shi, P.; Ren, R.; He, X.; Wei, X.; Yang, H. Crack Detection and Comparison Study Based on Faster R-CNN and Mask R-CNN. Sensors 2022, 22, 1215. [Google Scholar] [CrossRef]
  59. Fan, Z.; Lin, H.; Li, C.; Su, J.; Bruno, S.; Loprencipe, G. Use of Parallel ResNet for High-Performance Pavement Crack Detection and Measurement. Sustainability 2022, 14, 1825. [Google Scholar] [CrossRef]
  60. Whang, S.E.; Roh, Y.; Song, H.; Lee, J.-G. Data collection and quality challenges in deep learning: A data-centric AI perspective. VLDB J. 2023, 32, 791–813. [Google Scholar] [CrossRef]
  61. Tzutalin/LabelImg. Available online: https://github.com/heartexlabs/labelImg (accessed on 1 June 2015).
  62. Rath, S. YOLOv8 Ultralytics: State-of-the-Art YOLO Models. Available online: https://learnopencv.com/ultralytics-yolov8/ (accessed on 1 September 2022).
  63. Akyildiz, B. YOLOv8: A Comprehensive Framework for Object Detection, Instance Segmentation, and Image Classification. Available online: https://medium.com/@beyzaakyildiz/what-is-yolov8-how-to-use-it-b3807d13c5ce (accessed on 19 March 2023).
  64. Wang, C.-Y.; Liao, H.-Y.M.; Wu, Y.-H.; Chen, P.-Y.; Hsieh, J.-W.; Yeh, I.-H. CSPNet: A new backbone that can enhance learning capability of CNN. In Proceedings of the IEEE/CVF Conference on Computer Vision and Pattern Recognition Workshops, Seattle, WA, USA, 14–19 June 2020; pp. 390–391. [Google Scholar]
  65. He, K.; Zhang, X.; Ren, S.; Sun, J. Spatial pyramid pooling in deep convolutional networks for visual recognition. IEEE Trans. Pattern Anal. Mach. Intell. 2015, 37, 1904–1916. [Google Scholar] [CrossRef]
  66. Solawetz, J. What is YOLOv5? A Guide for Beginners. Available online: https://blog.roboflow.com/yolov5-improvements-and-evaluation/ (accessed on 20 May 2024).
  67. Elfwing, S.; Uchibe, E.; Doya, K. Sigmoid-weighted linear units for neural network function approximation in reinforcement learning. Neural Netw. 2018, 107, 3–11. [Google Scholar] [CrossRef]
  68. Zhang, C.; Xu, Y.; Shen, Y. Compconv: A compact convolution module for efficient feature learning. In Proceedings of the IEEE/CVF Conference on Computer Vision and Pattern Recognition, Nashville, TN, USA, 20–25 June 2021; pp. 3012–3021. [Google Scholar]
  69. Liu, H.; Sun, F.; Gu, J.; Deng, L. Sf-yolov5: A lightweight small object detection algorithm based on improved feature fusion mode. Sensors 2022, 22, 5817. [Google Scholar] [CrossRef]
  70. Xue, Z.; Lin, H.; Wang, F. A small target forest fire detection model based on YOLOv5 improvement. Forests 2022, 13, 1332. [Google Scholar] [CrossRef]
  71. Wang, K.; Liew, J.H.; Zou, Y.; Zhou, D.; Feng, J. Panet: Few-shot image semantic segmentation with prototype alignment. In Proceedings of the IEEE/CVF International Conference on Computer Vision, Seoul, Republic of Korea, 27 October–2 November 2019; pp. 9197–9206. [Google Scholar]
  72. Liu, S.; Qi, L.; Qin, H.; Shi, J.; Jia, J. Path aggregation network for instance segmentation. In Proceedings of the IEEE Conference on Computer Vision and Pattern Recognition, Long Beach, CA, USA, 15–20 June 2019; pp. 8759–8768. [Google Scholar]
  73. Redmon, J.; Farhadi, A. Yolov3: An incremental improvement. arXiv 2018, arXiv:1804.02767. [Google Scholar]
  74. OpenMMLab. Dive into YOLOv8: How Does This State-of-the-Art Model work? Available online: https://openmmlab.medium.com/dive-into-yolov8-how-does-this-state-of-the-art-model-work-10f18f74bab1 (accessed on 20 May 2024).
  75. Sharma, S.; Sharma, S.; Athaiya, A. Activation functions in neural networks. Towards Data Sci. 2017, 6, 310–316. [Google Scholar] [CrossRef]
  76. Kingma, D.P.; Ba, J. Adam: A method for stochastic optimization. arXiv 2014, arXiv:1412.6980. [Google Scholar]
  77. Ruder, S. An overview of gradient descent optimization algorithms. arXiv 2016, arXiv:1609.04747. [Google Scholar]
  78. Hosang, J.H.; Benenson, R.; Schiele, B. Learning Non-maximum Suppression. In Proceedings of the 2017 IEEE Conference on Computer Vision and Pattern Recognition (CVPR), Honolulu, HI, USA, 21–26 July 2017; pp. 6469–6477. [Google Scholar]
  79. Astor, Y.; Nabesima, Y.; Utami, R.; Sihombing, A.V.R.; Adli, M.; Firdaus, M.R. Unmanned aerial vehicle implementation for pavement condition survey. Transp. Eng. 2023, 12, 100168. [Google Scholar] [CrossRef]
Figure 1. Examples of road pavement distress: (a) pavement cracks, (b) repairs segments.
Drones 08 00244 g001
Figure 2. Examples of road pavement distress: (a) delamination, and (b) potholes.
Drones 08 00244 g002
Figure 3. Recognition process using the implemented Deep Learning Network.
Drones 08 00244 g003
Figure 4. Ground truth bounding box sketch example.
Drones 08 00244 g004
Figure 5. Proposed network architecture.
Drones 08 00244 g005
Figure 6. Cross Stage Partial DenseNet module.
Drones 08 00244 g006
Figure 7. Difference between the C3 and C2F block.
Drones 08 00244 g007
Figure 8. Difference between the SPP and SPPF block.
Drones 08 00244 g008
Figure 9. Difference between the coupled head and the proposed decoupled head.
Drones 08 00244 g009
Figure 10. The pseudocode related to the ADAM activity function.
Drones 08 00244 g010
Figure 11. The process of the Non-Maximum Suppression (NMS) algorithm in the proposed Deep Learning Network.
Drones 08 00244 g011
Figure 12. Sensor and platform for data acquisition.
Drones 08 00244 g012
Figure 13. Data augmentation in the proposed network.
Drones 08 00244 g013
Figure 14. Capturing images of various types of distresses with a multirotor drone.
Drones 08 00244 g014
Figure 15. Overall network training summary.
Drones 08 00244 g015
Figure 16. The PR (precision-recall) curve.
Drones 08 00244 g016
Figure 17. Some examples of road pavement distress recognition in aerial images.
Drones 08 00244 g017
Figure 18. Some examples of road pavement distress recognition in terrestrial images.
Drones 08 00244 g018
Figure 19. Some examples of model ability in addressing recognition challenges in aerial and terrestrial images. (a) Crowded Backgrounds; (b) Small Size of Distresses; (c) Similarities Between Distresses; (d) Distress in Shadows; (e) Availability of Multiple Distresses.
Drones 08 00244 g019
Table 1. Specifications of the camera on the UAV.
DeviceADTi 26MP Mapping Camera
Image Size (pixel)6192 × 4128
Sensor Size (mm)23.4 × 15.6
Focal Length (37.5 mm eq.)25
FOV (degree)59
Lens Distortion (%)<0.5
Max Effective ISO2749
Shutter Speed (s)0.7
ApertureF/5.6
Table 2. Evaluation results of the proposed Deep Learning Network.
DatasetPrecision
%
Recall
%
F1-Score
%
mAP
%
Accuracy
%
Transverse Crack79737482-
Longitudinal Crack92838687-
Alligator Crack72737278-
Oblique Crack71757279-
Pothole78777677-
Repair60696470-
Delamination83767882-
Total7775747981
Disclaimer/Publisher’s Note: The statements, opinions and data contained in all publications are solely those of the individual author(s) and contributor(s) and not of MDPI and/or the editor(s). MDPI and/or the editor(s) disclaim responsibility for any injury to people or property resulting from any ideas, methods, instructions or products referred to in the content.