
Propagation Modeling of Unmanned Aerial Vehicle (UAV) 5G Wireless Networks in Rural Mountainous Regions Using Ray Tracing


Abstract
1. Introduction
- 1.
- Investigation of channel propagation characteristics in mountainous situations across four frequency bands (3.5, 6, 28 and 60 GHz) using Ray-Tracing method (RT). It focuses on path loss, angle and delay characteristics, phase shift, and losses caused by concrete, weather, and foliage. UAVs of varying heights were utilized to investigate the effects of fading and reflection, offering critical insights into signal behavior in tough terrains. The Received Signal Strength (RSS) models were derived based on a custom channel for each frequency.
- 2.
- Investigation of regional variability in field signal strength and identification of the best UAV height for the ideal user coverage. It explores the features of mmWave channels in complicated mountainous terrain using the 3D RT technique.
2. Literature Review
2.1. Wireless Channel Behaviours in Mountainous Areas
2.2. Navigating Multipath Challenges in Mountainous UAV Communication
2.3. Propagation Modeling for Mountainous Area
2.4. Foliage Losses Effects
2.5. Non-Line-of-Sight (NLOS) Propagation
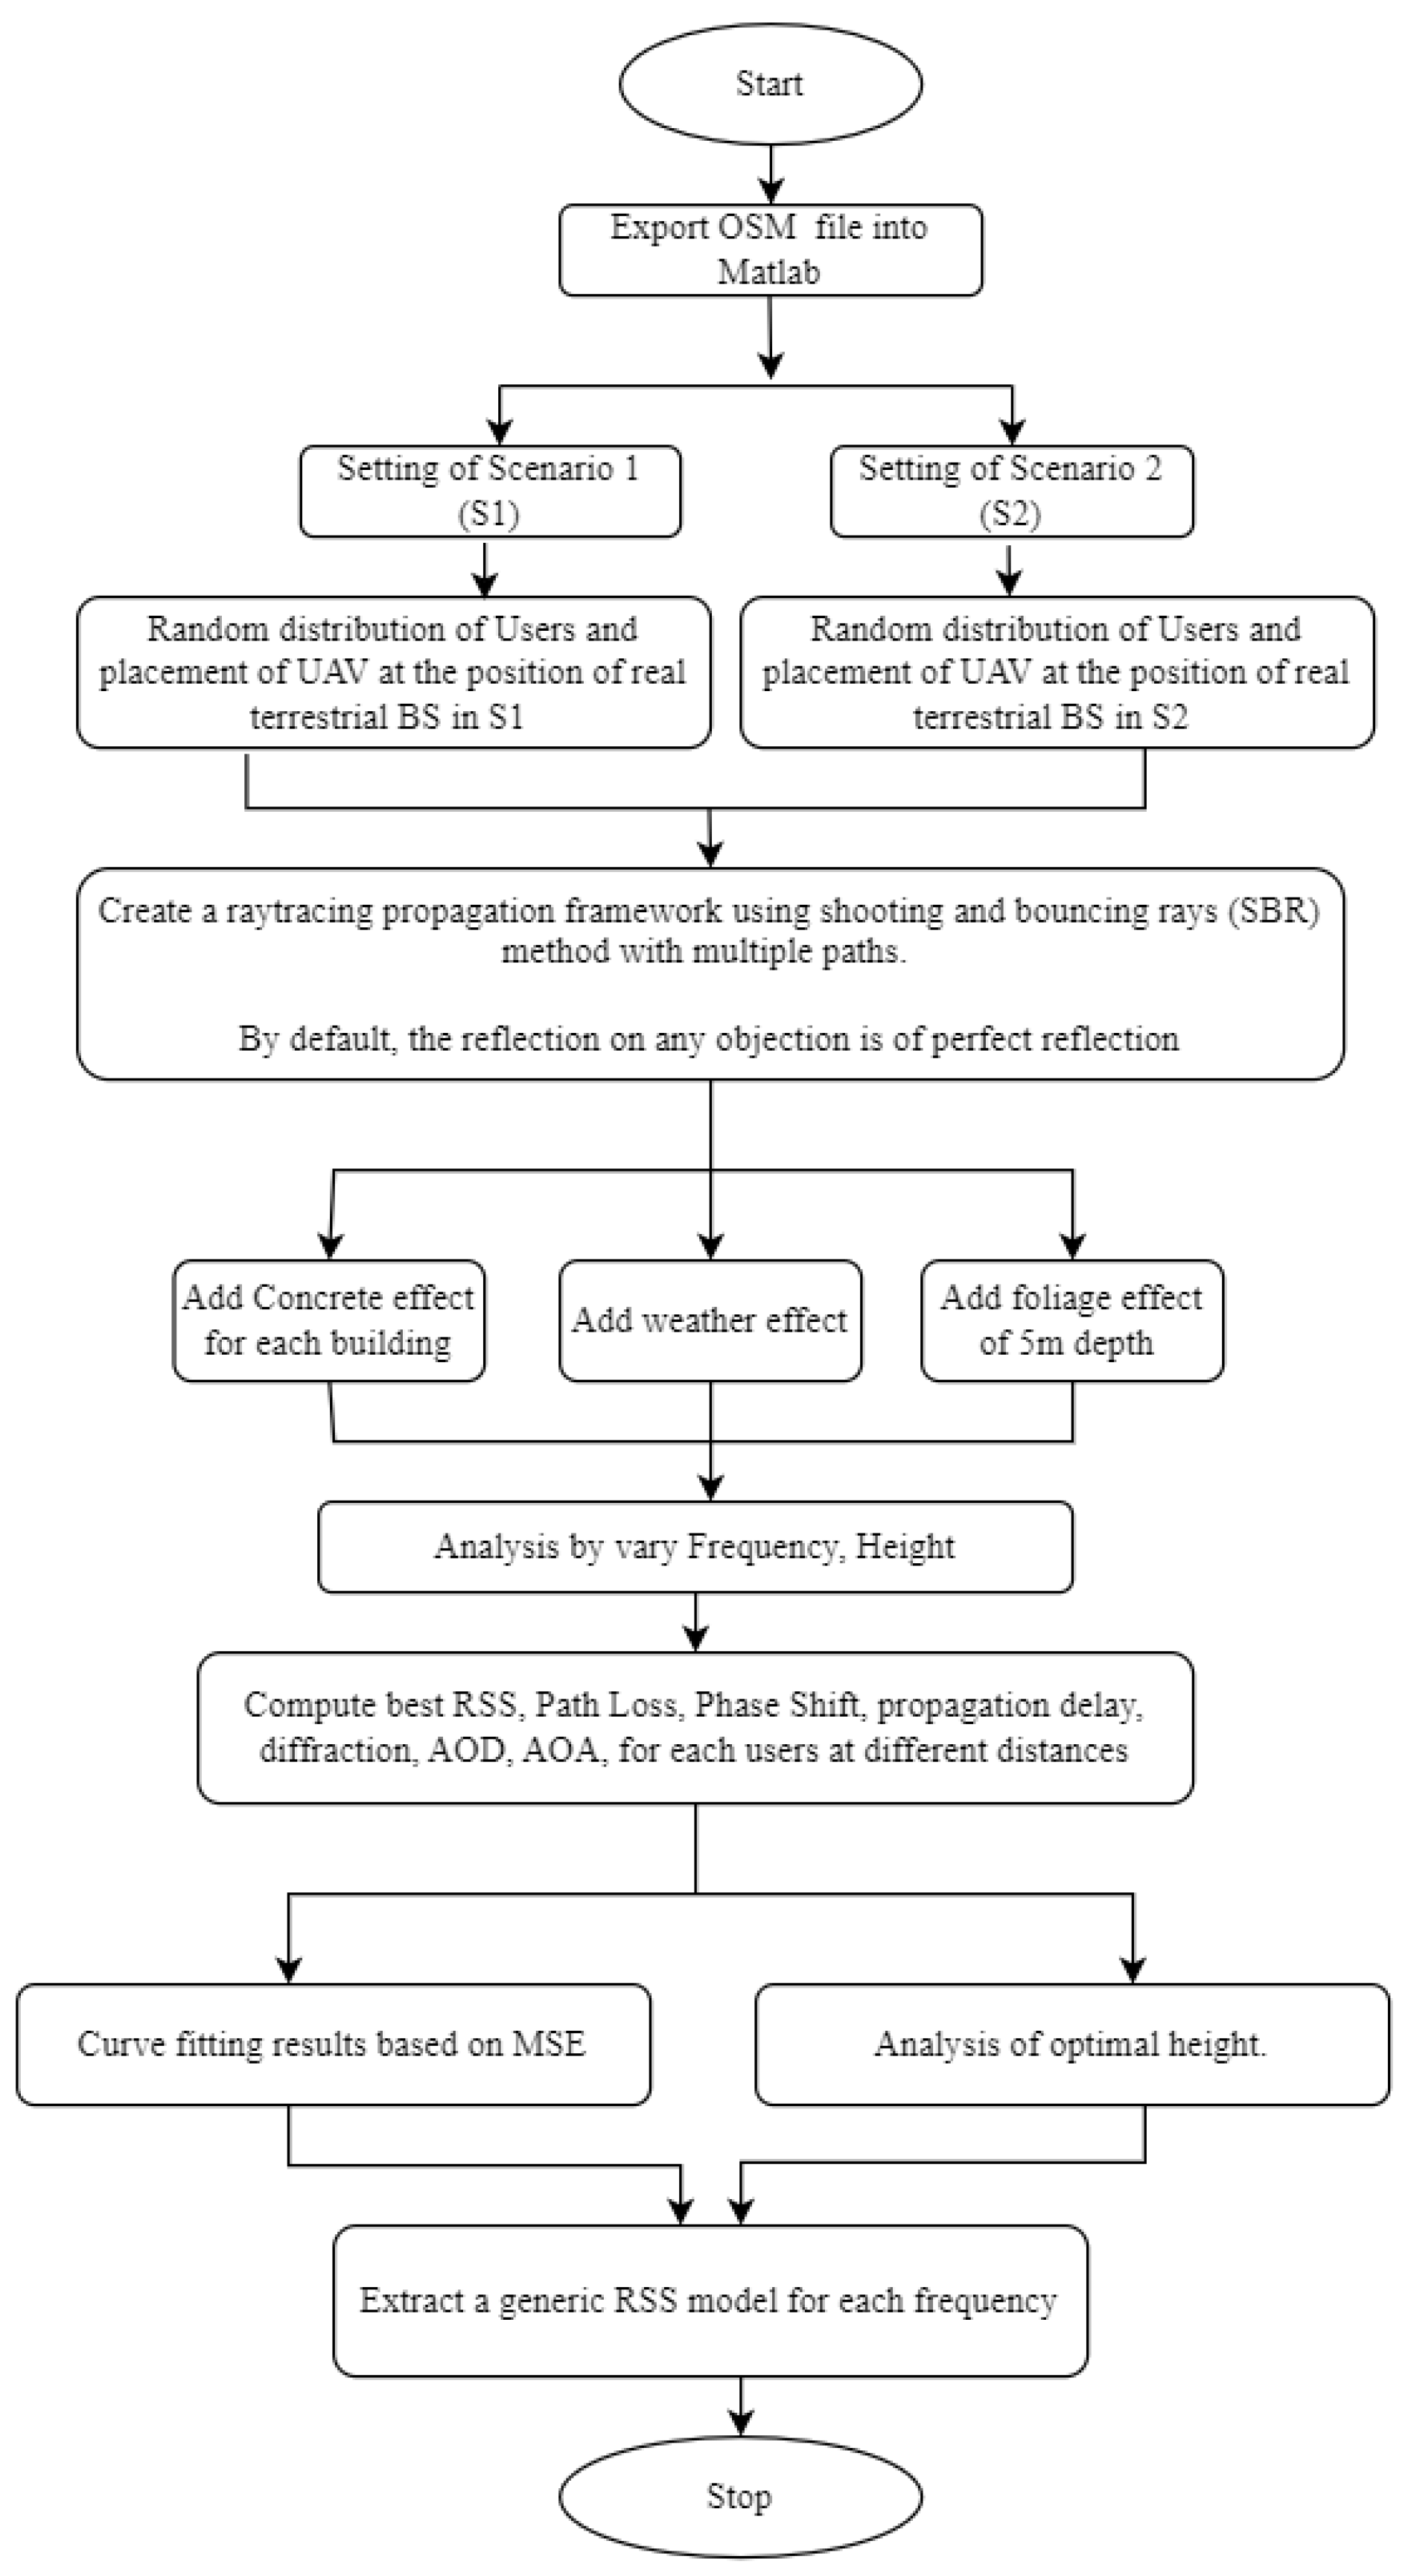
3. Methodology
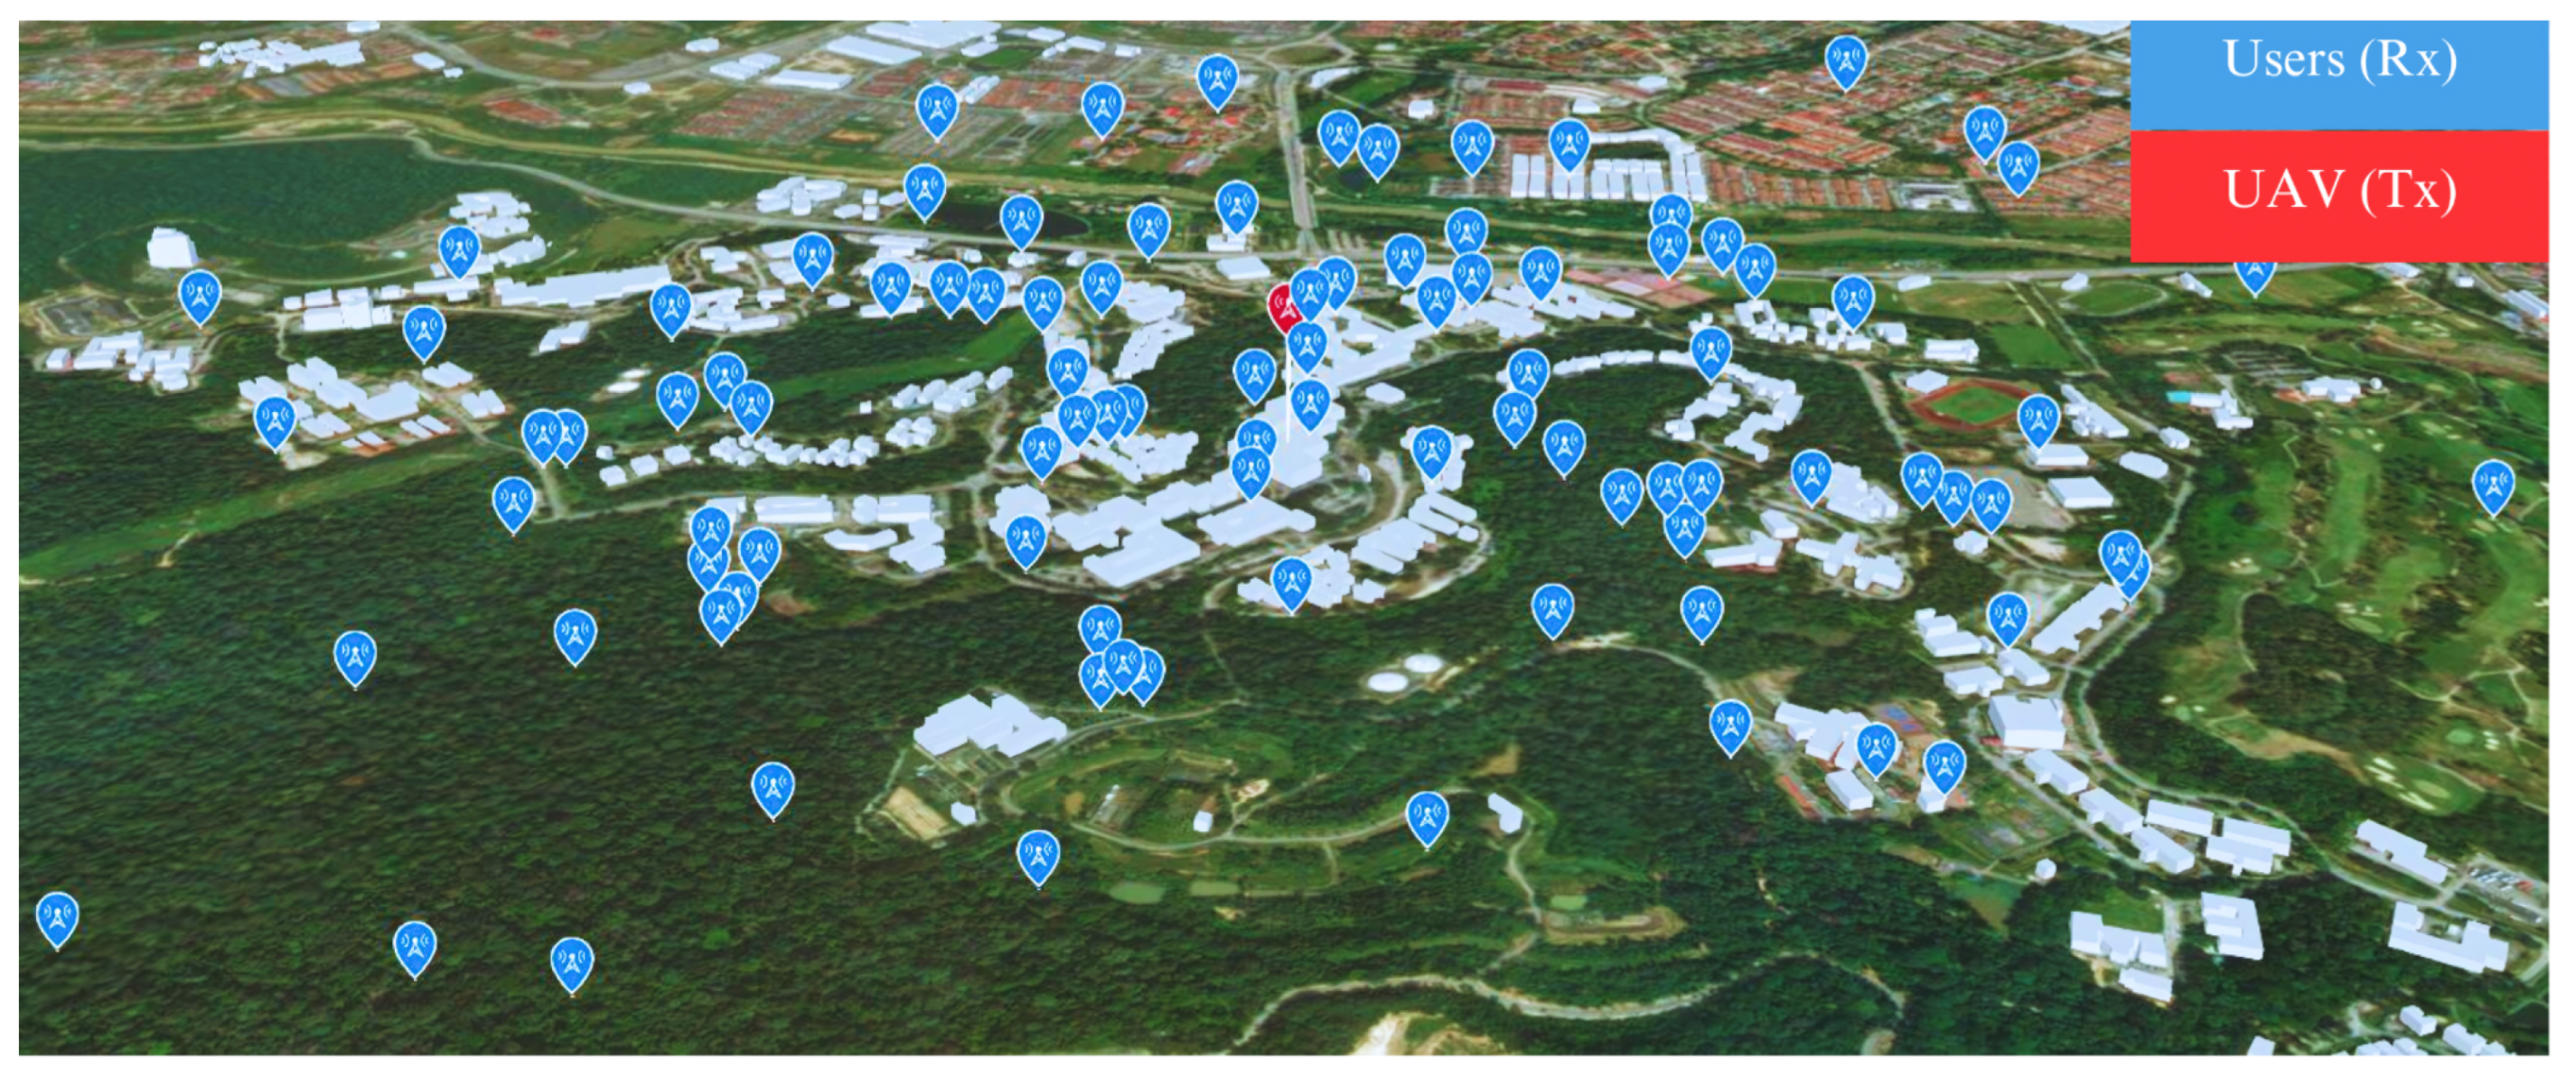
3.1. System Model
3.2. Modeling the Received Signal Strength
3.2.1. Path Loss Considerations
3.2.2. Received Power Levels
3.2.3. Frequency-Specific Observations
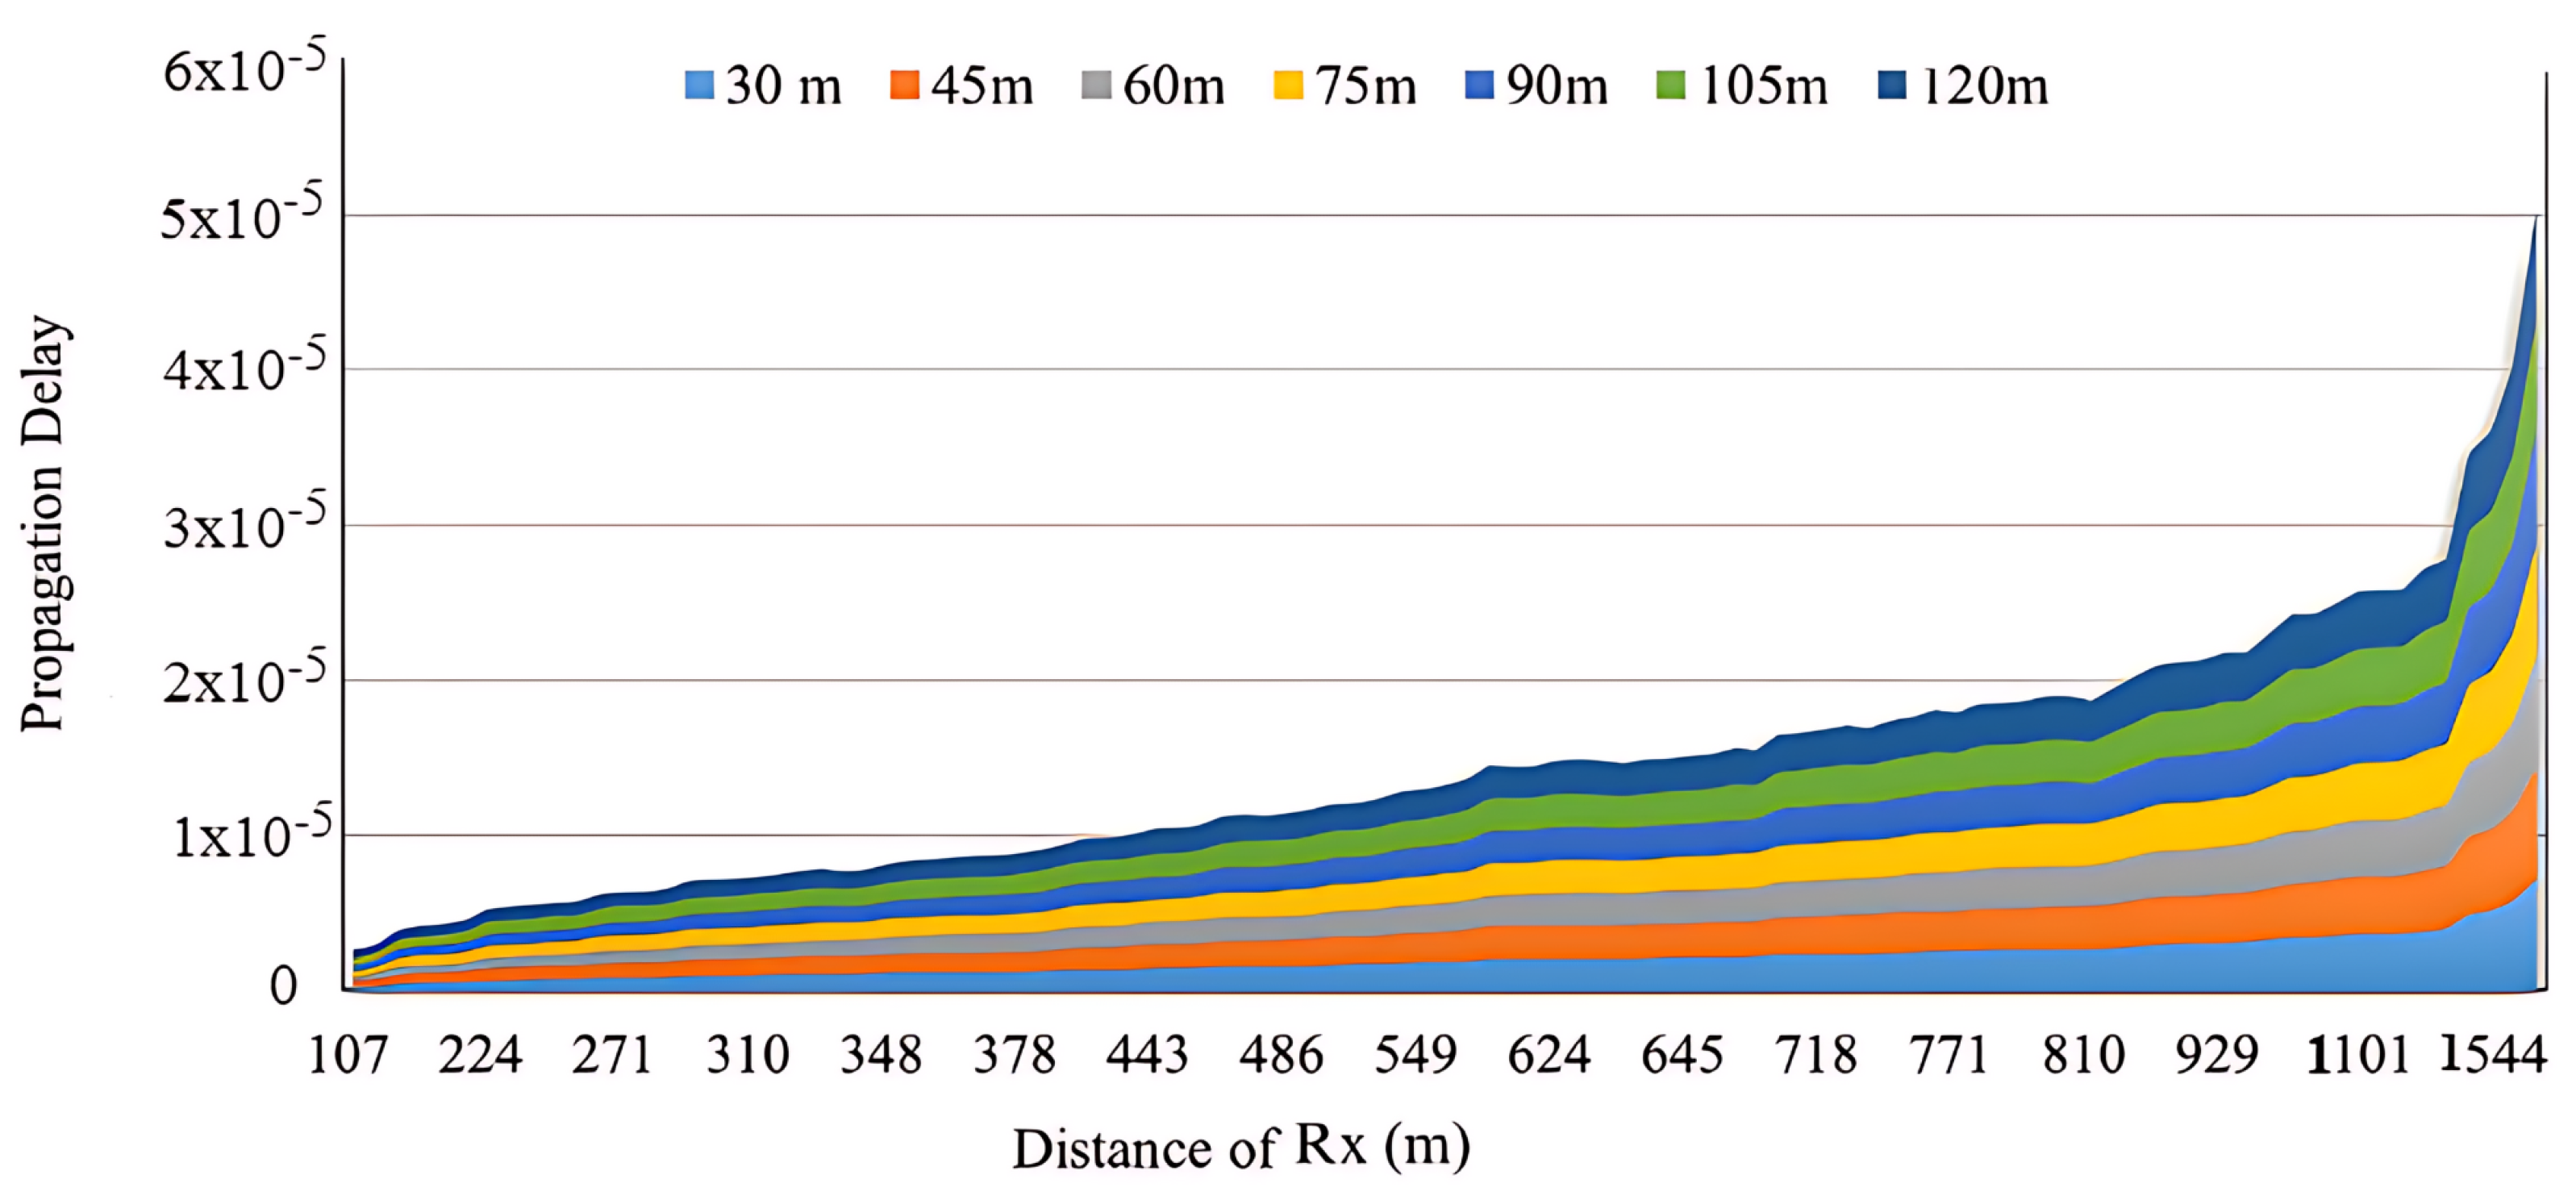
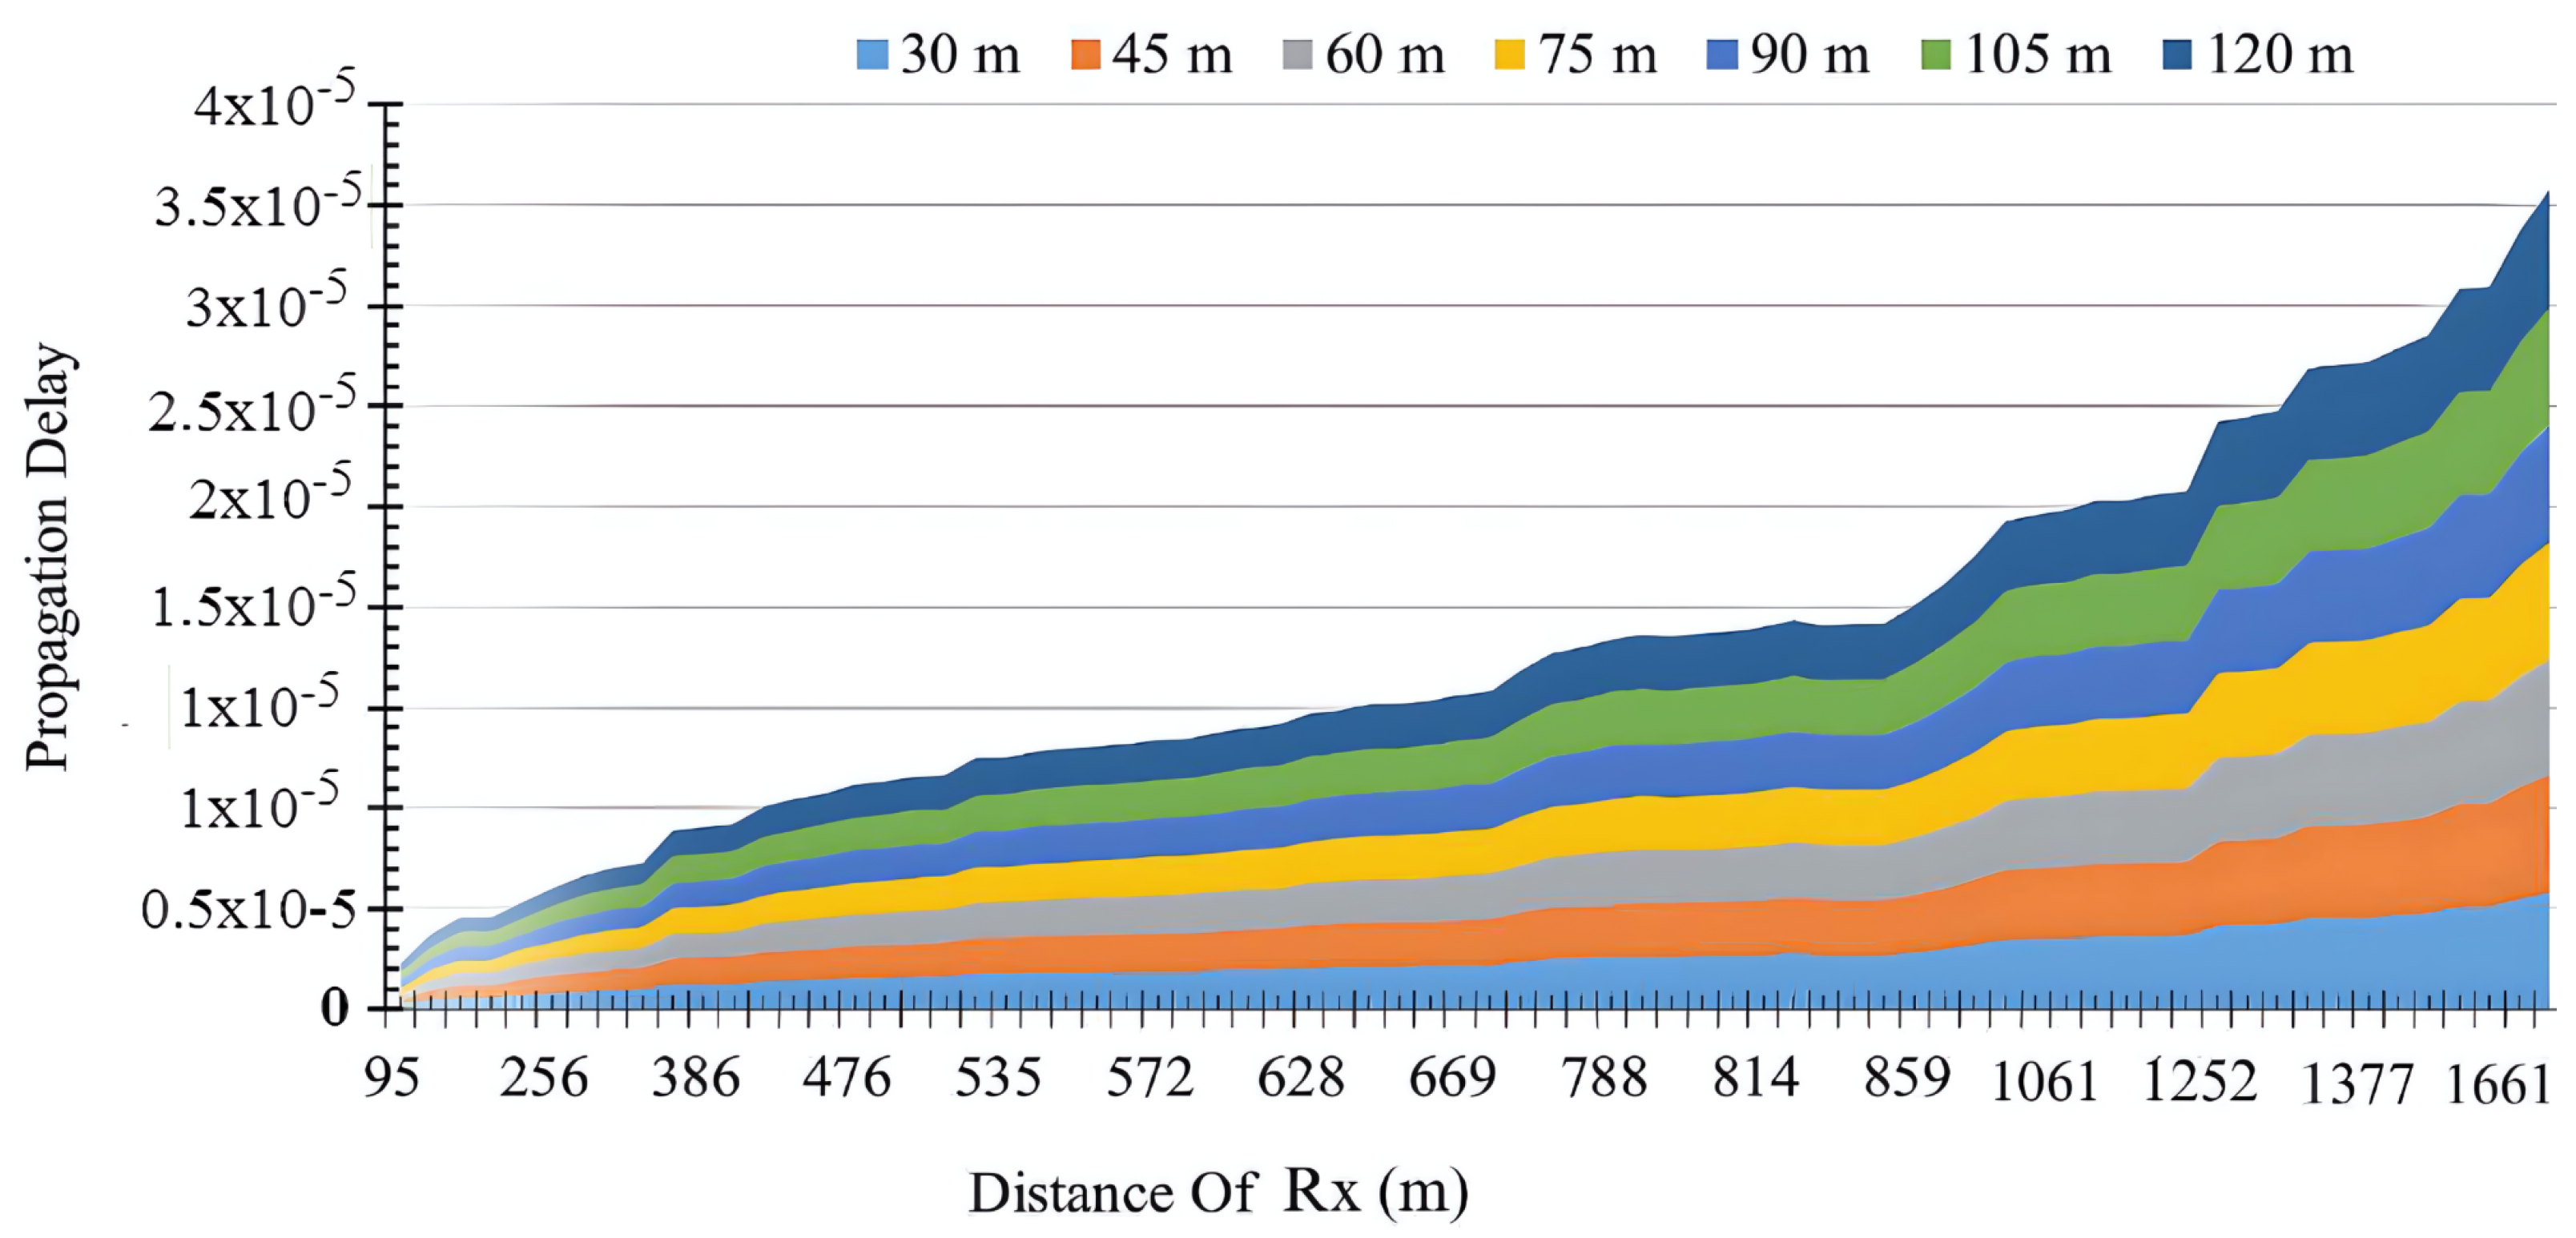
3.2.4. Propagation Delay Analysis
3.2.5. Ranges for Height Optimization
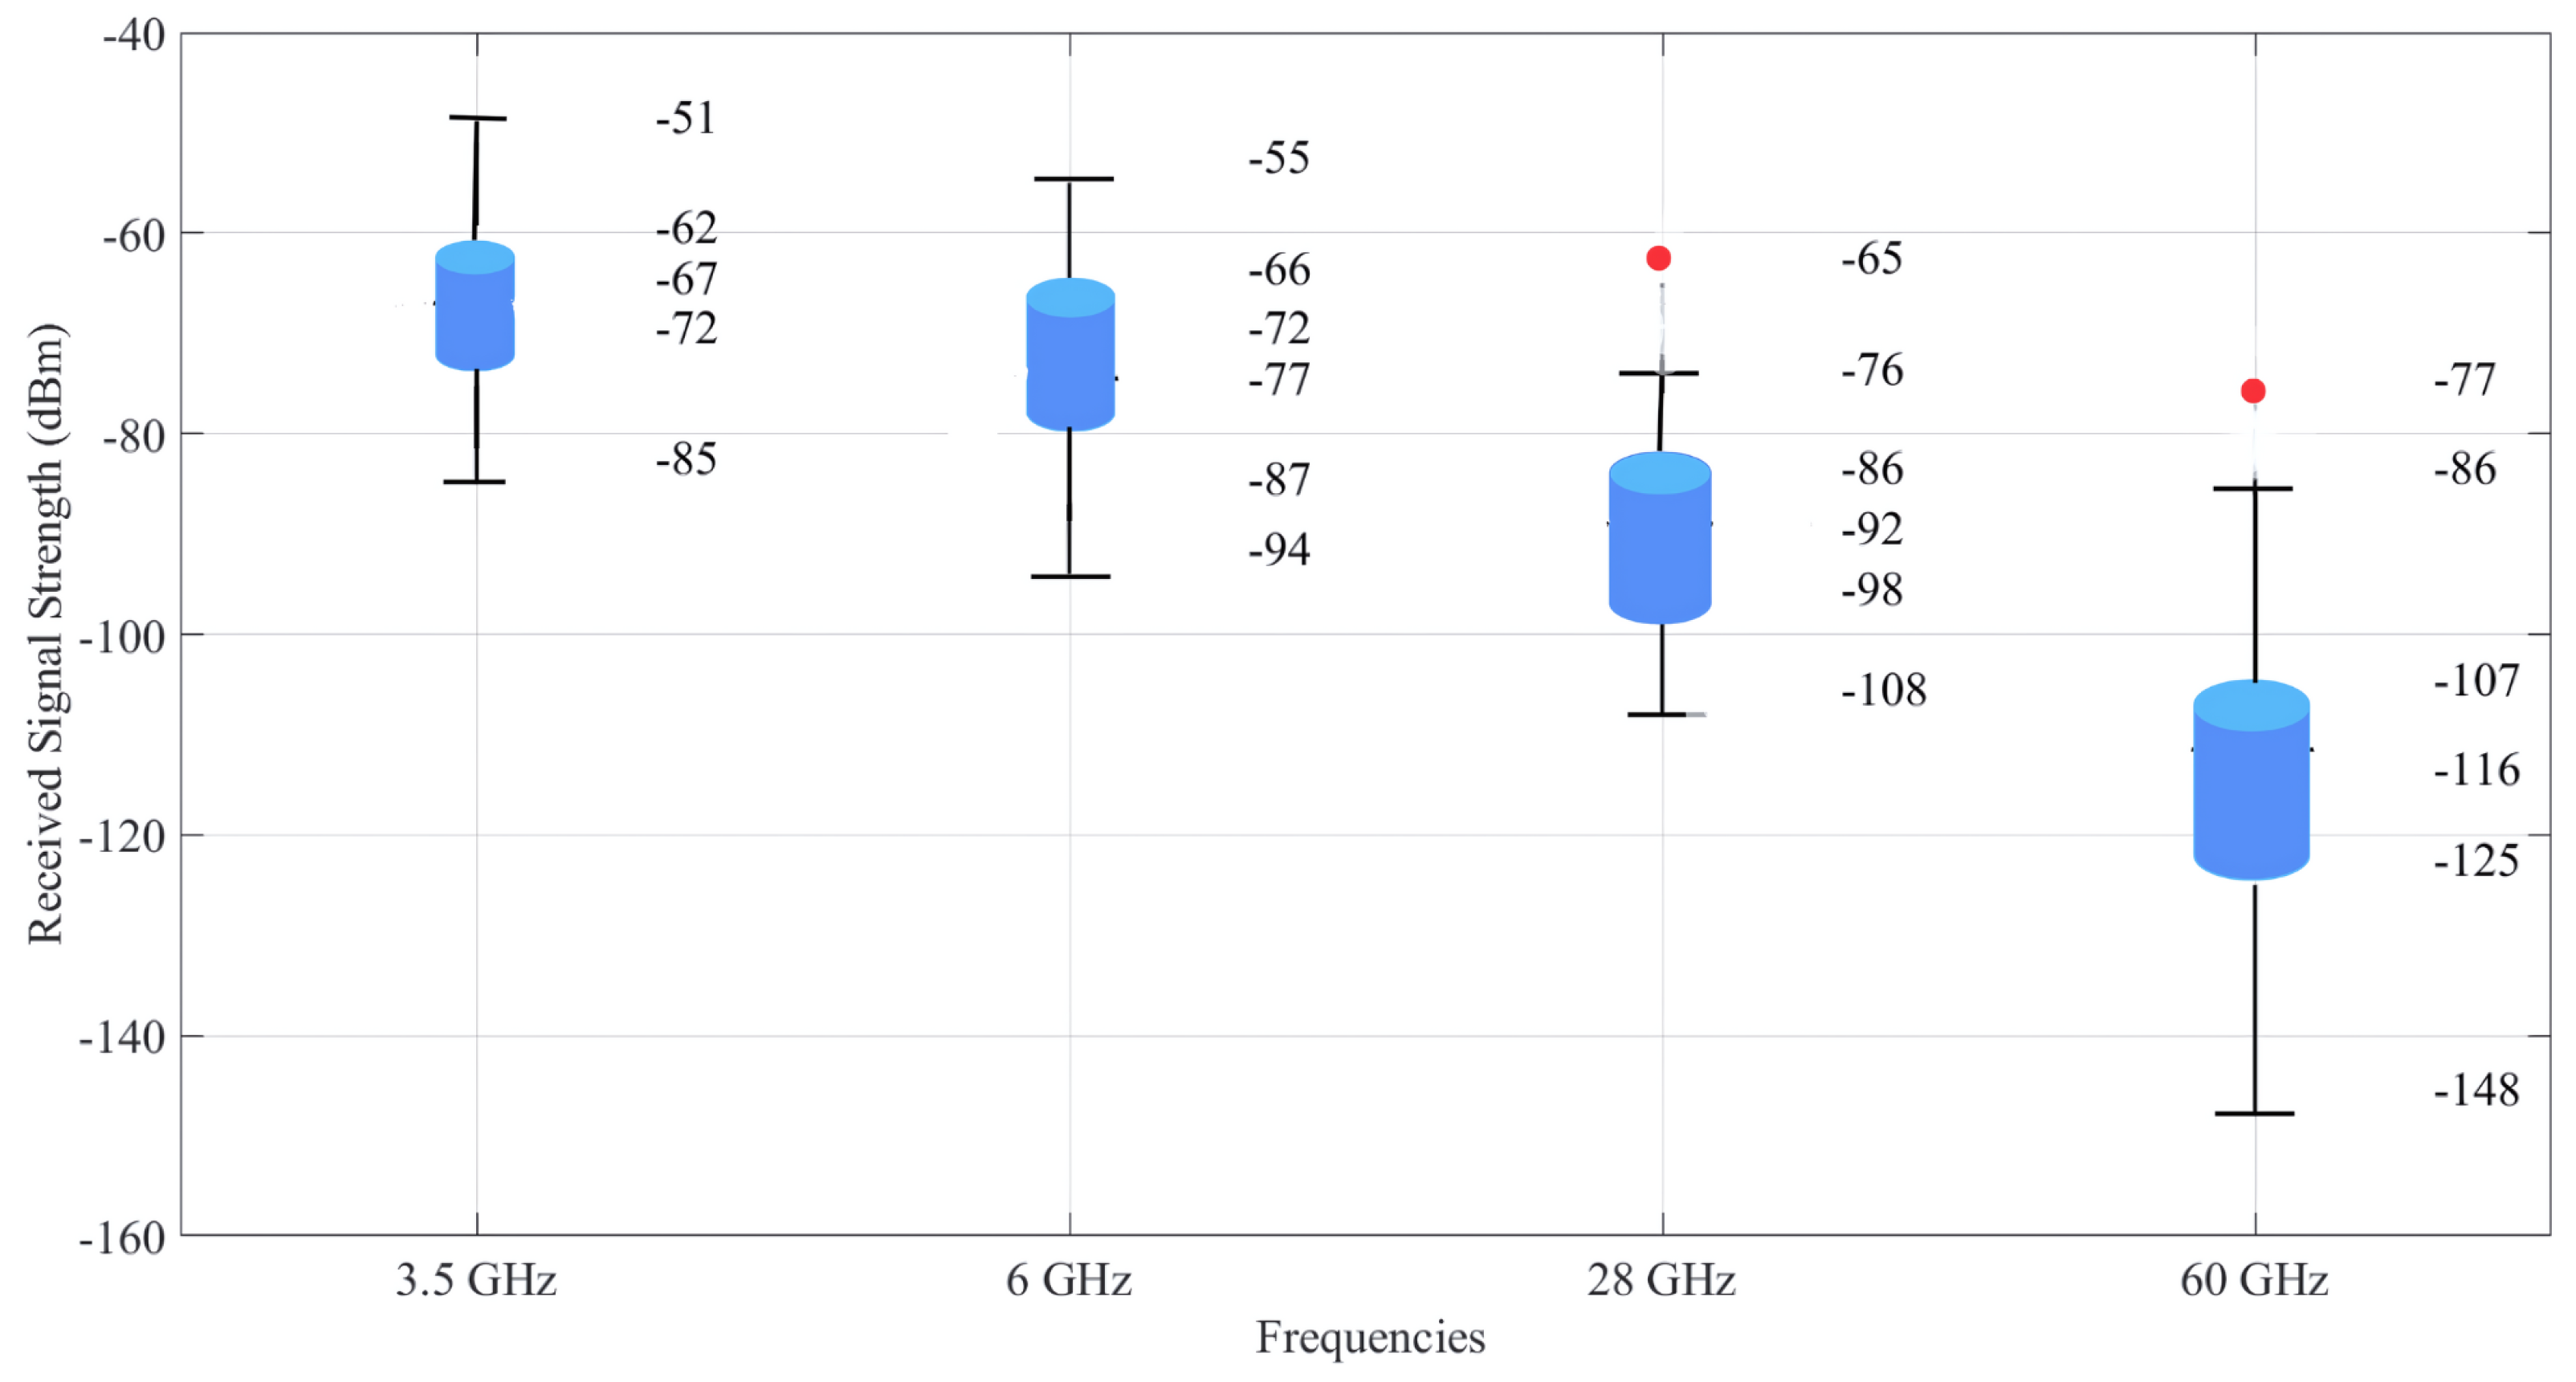
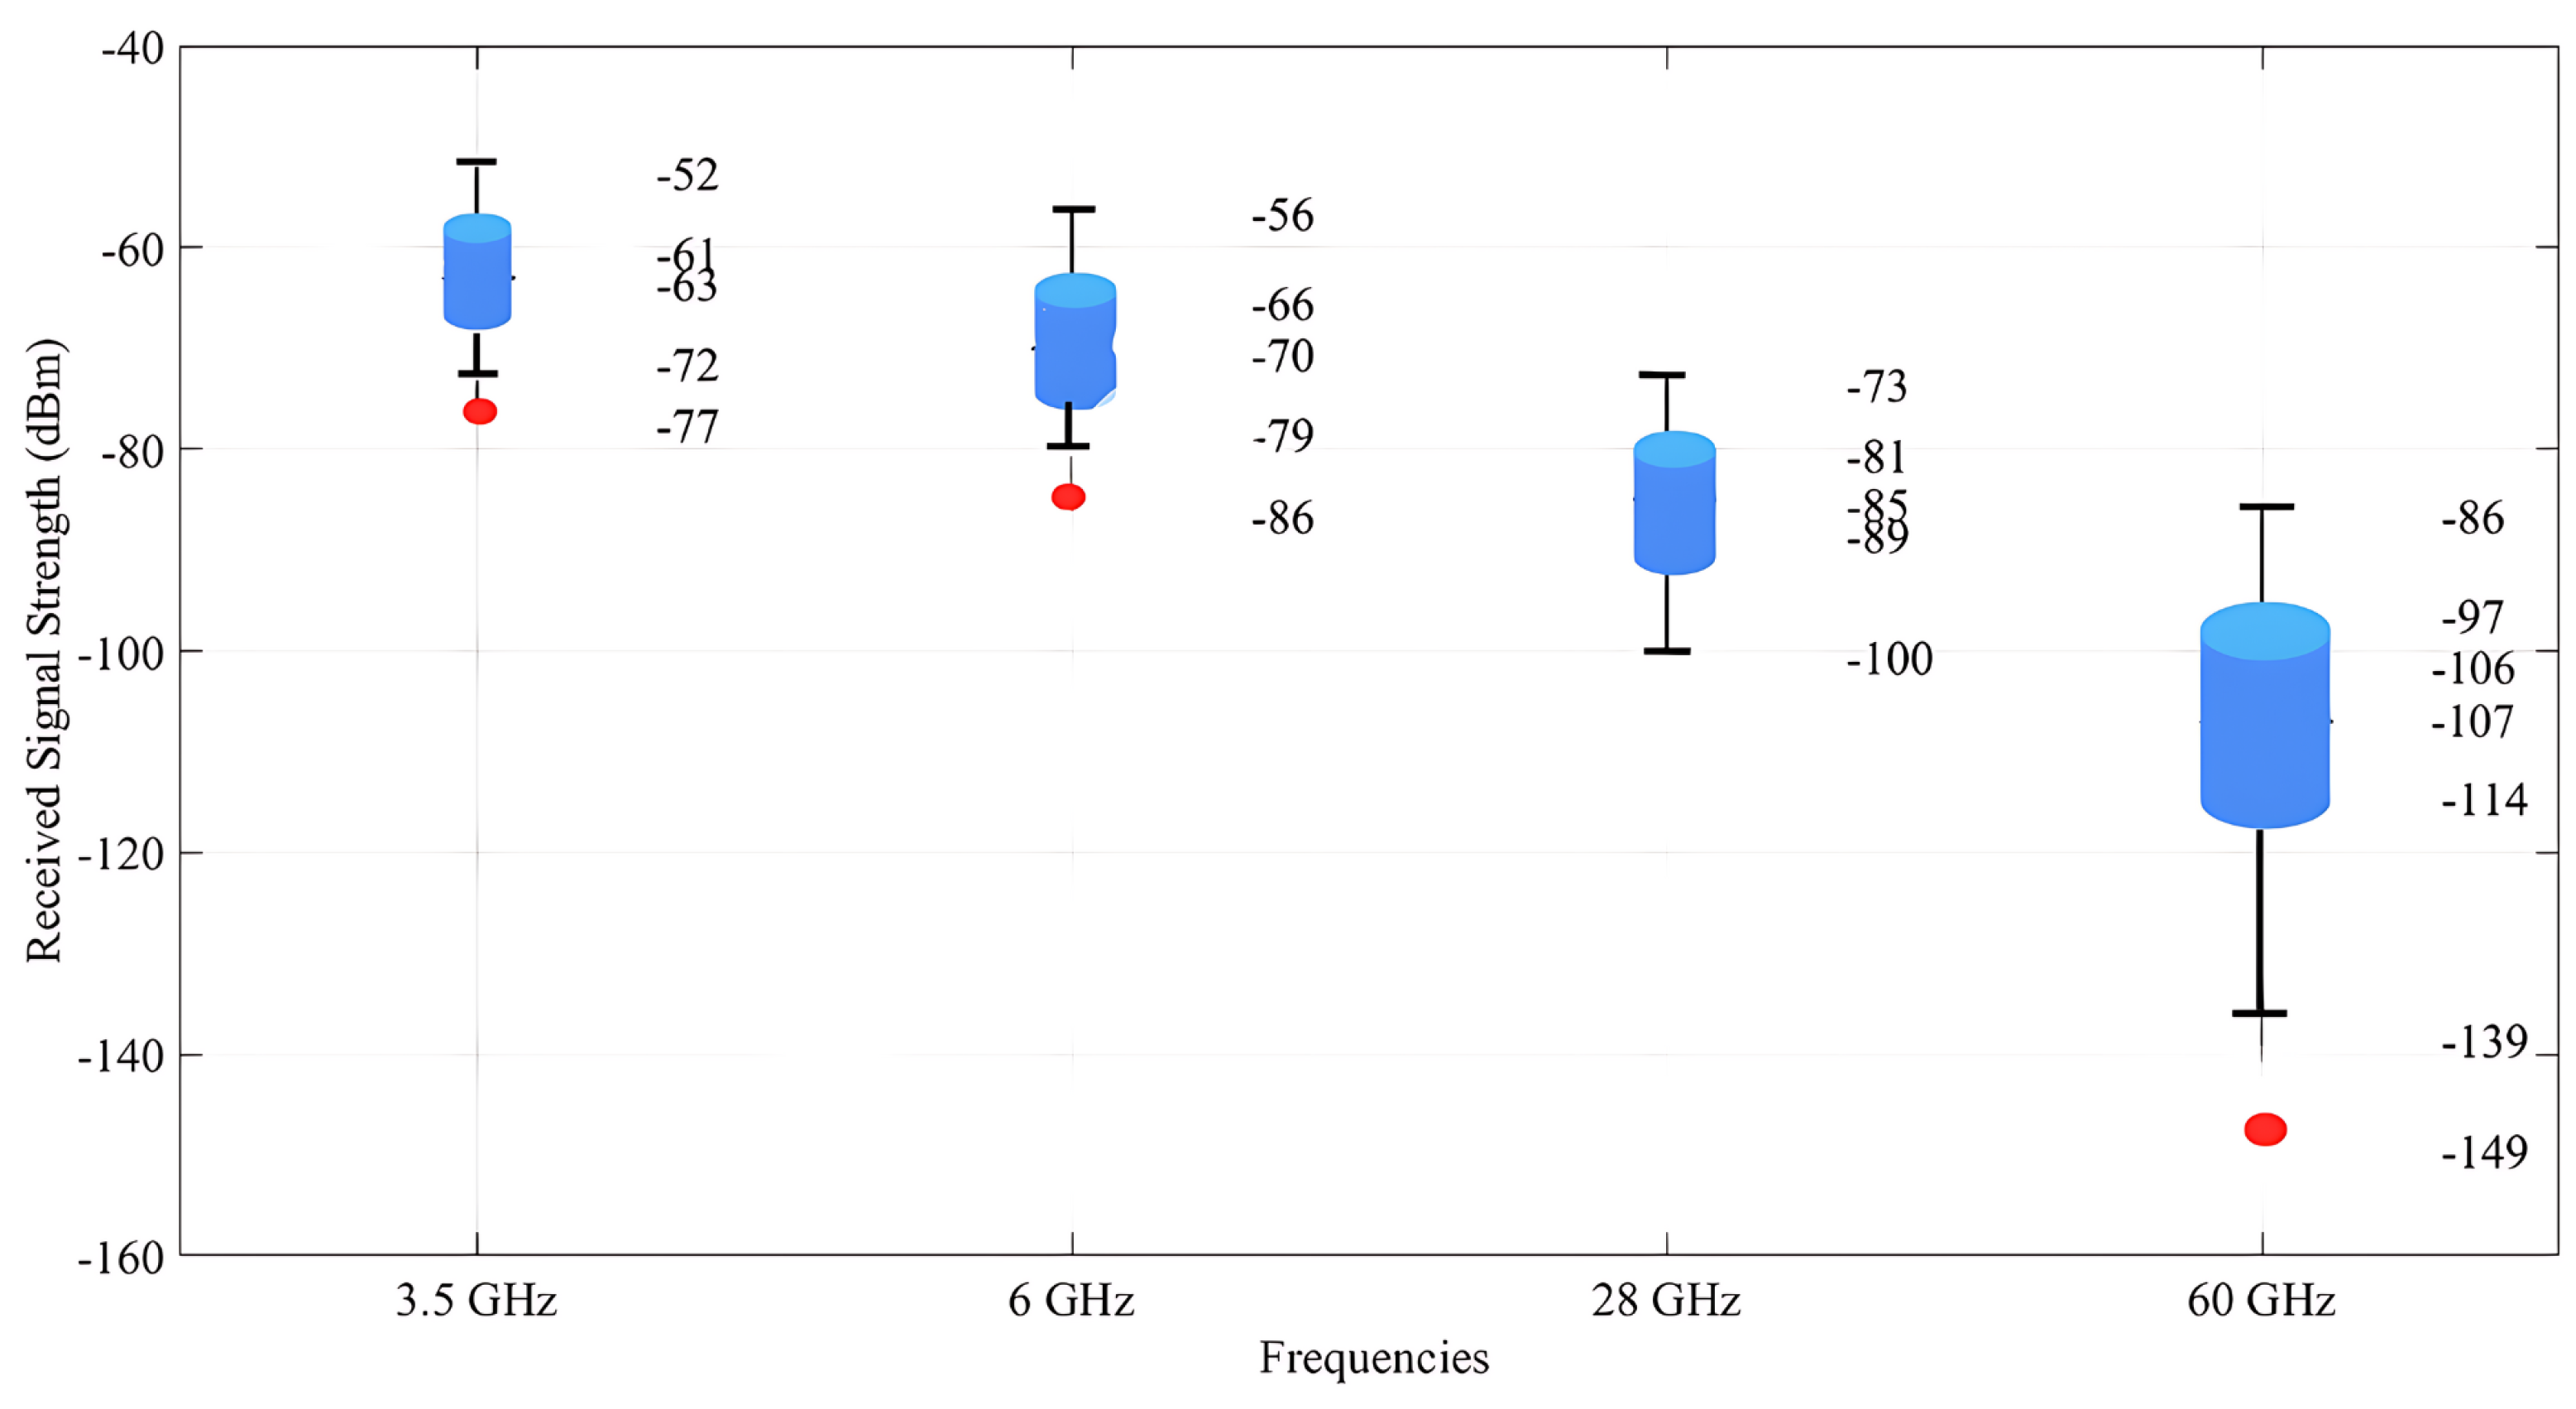
4. Results
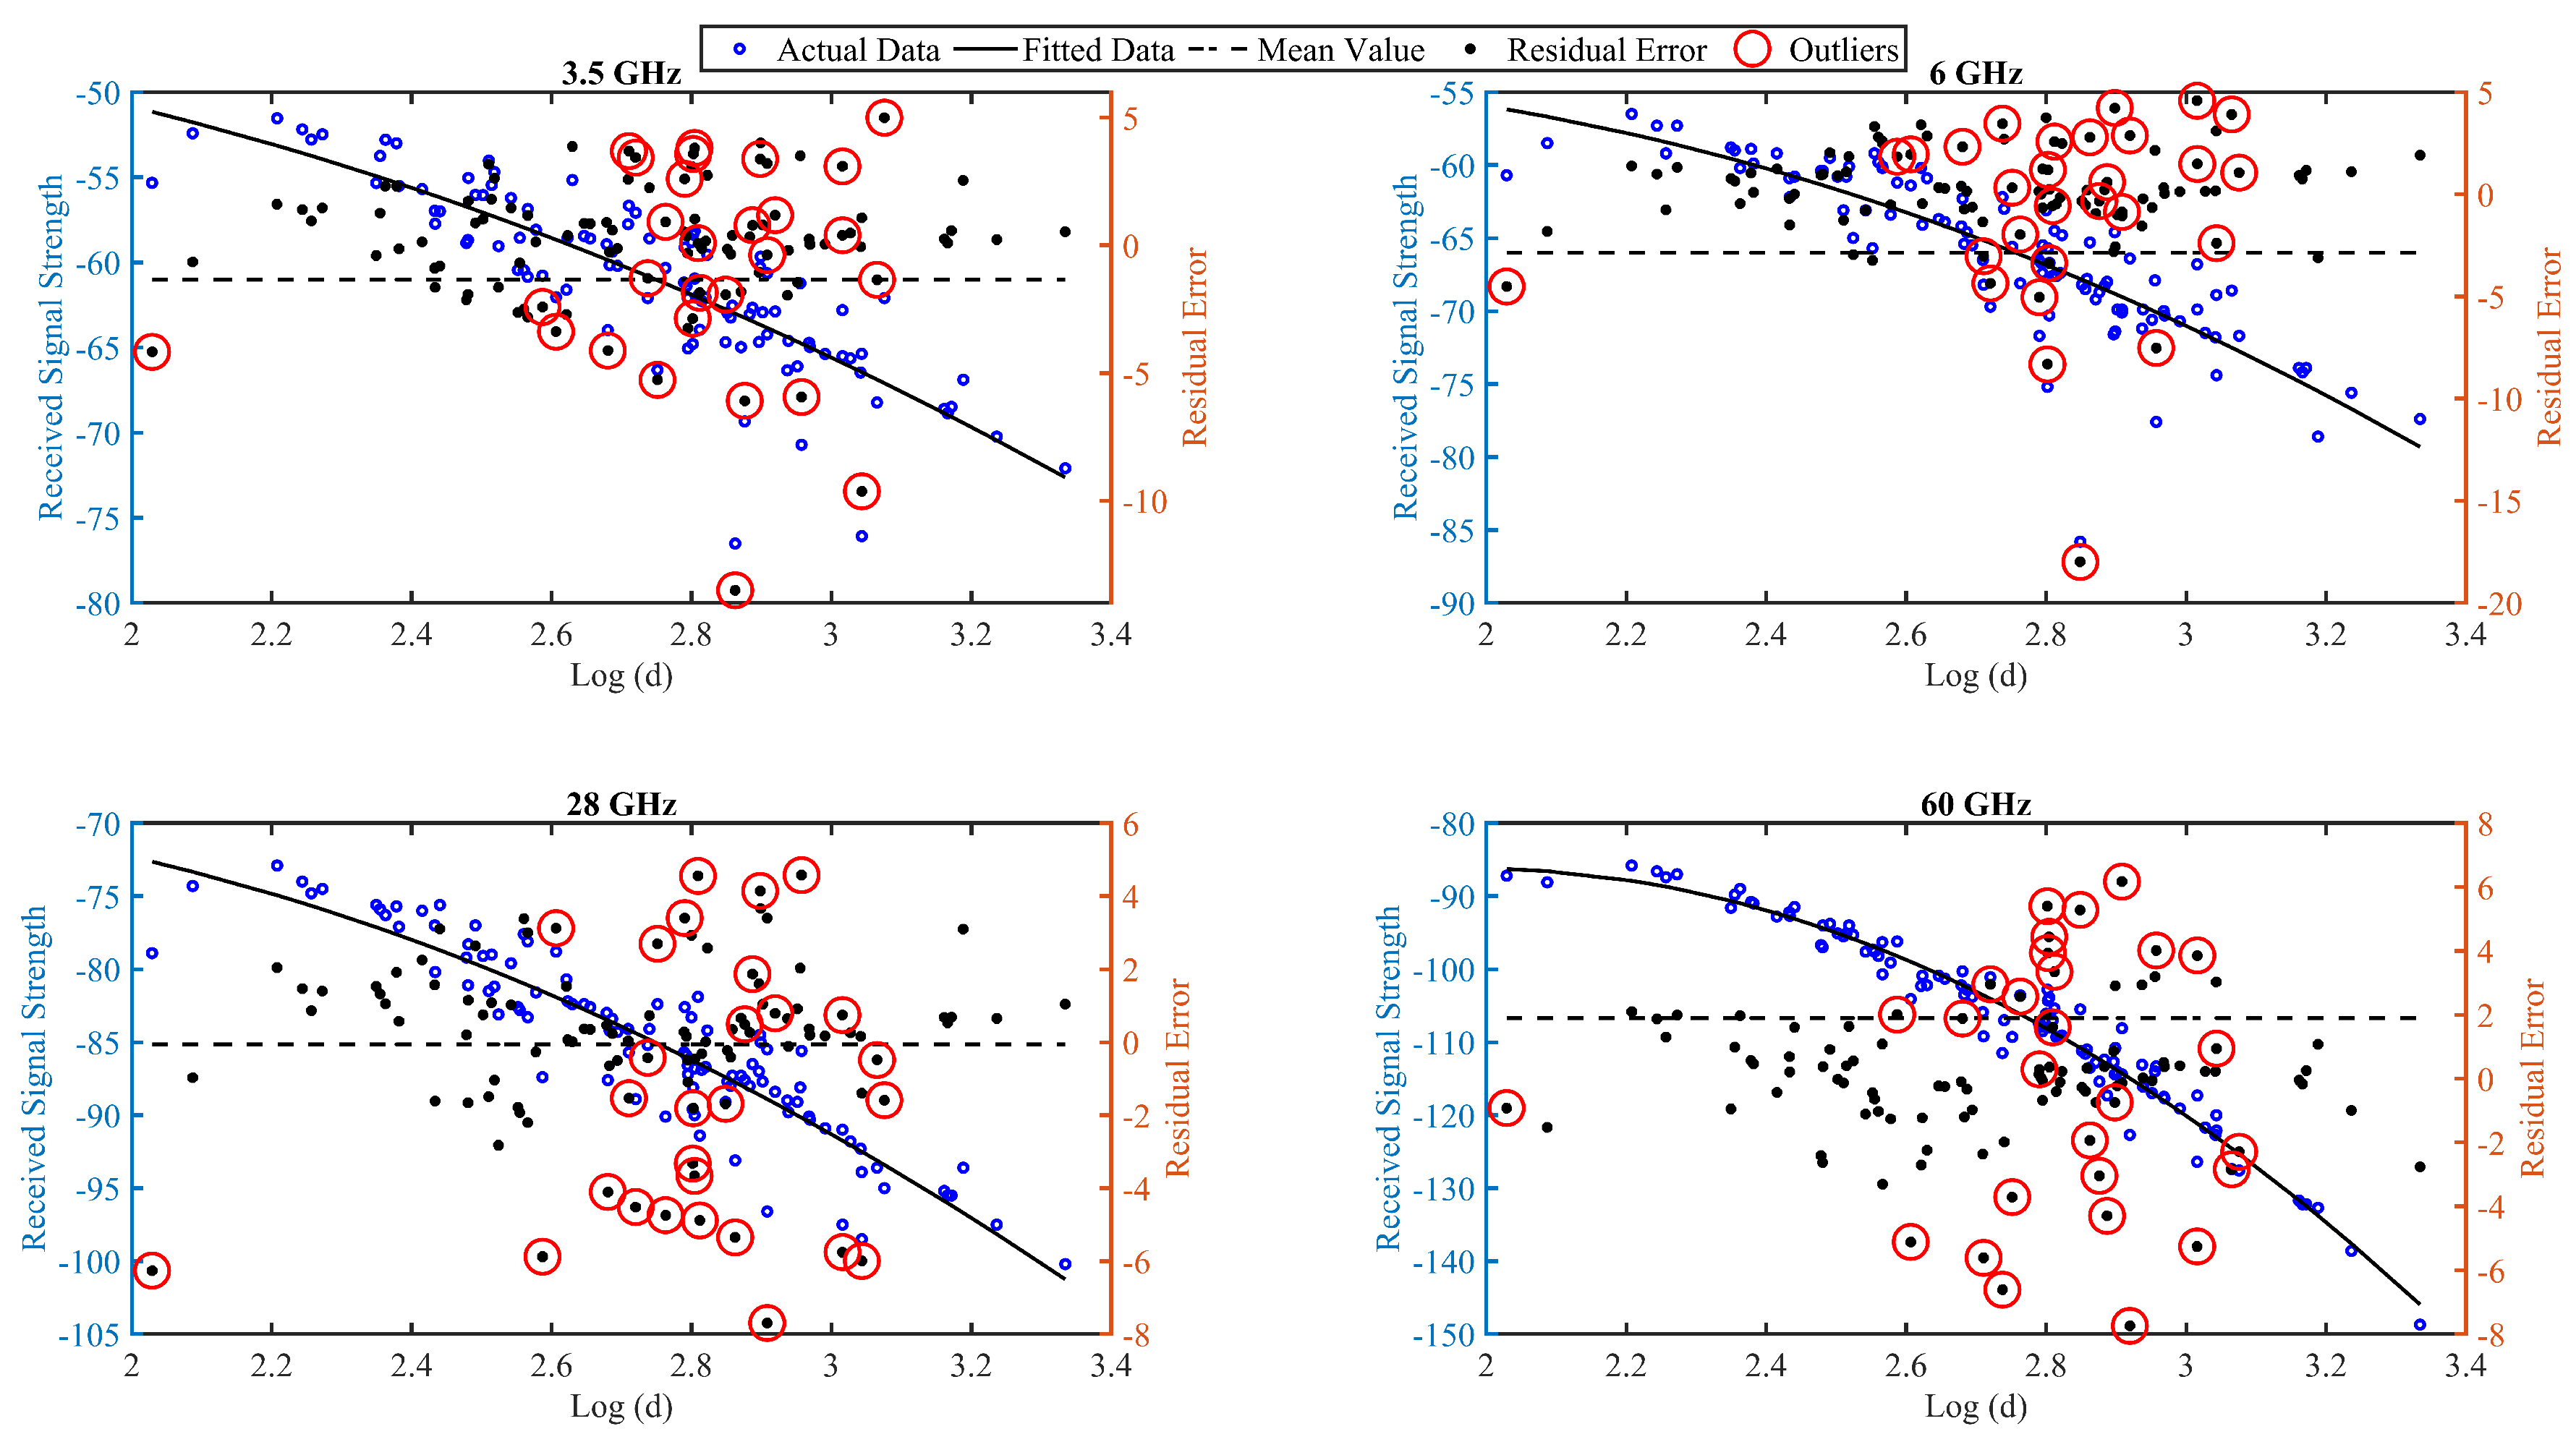
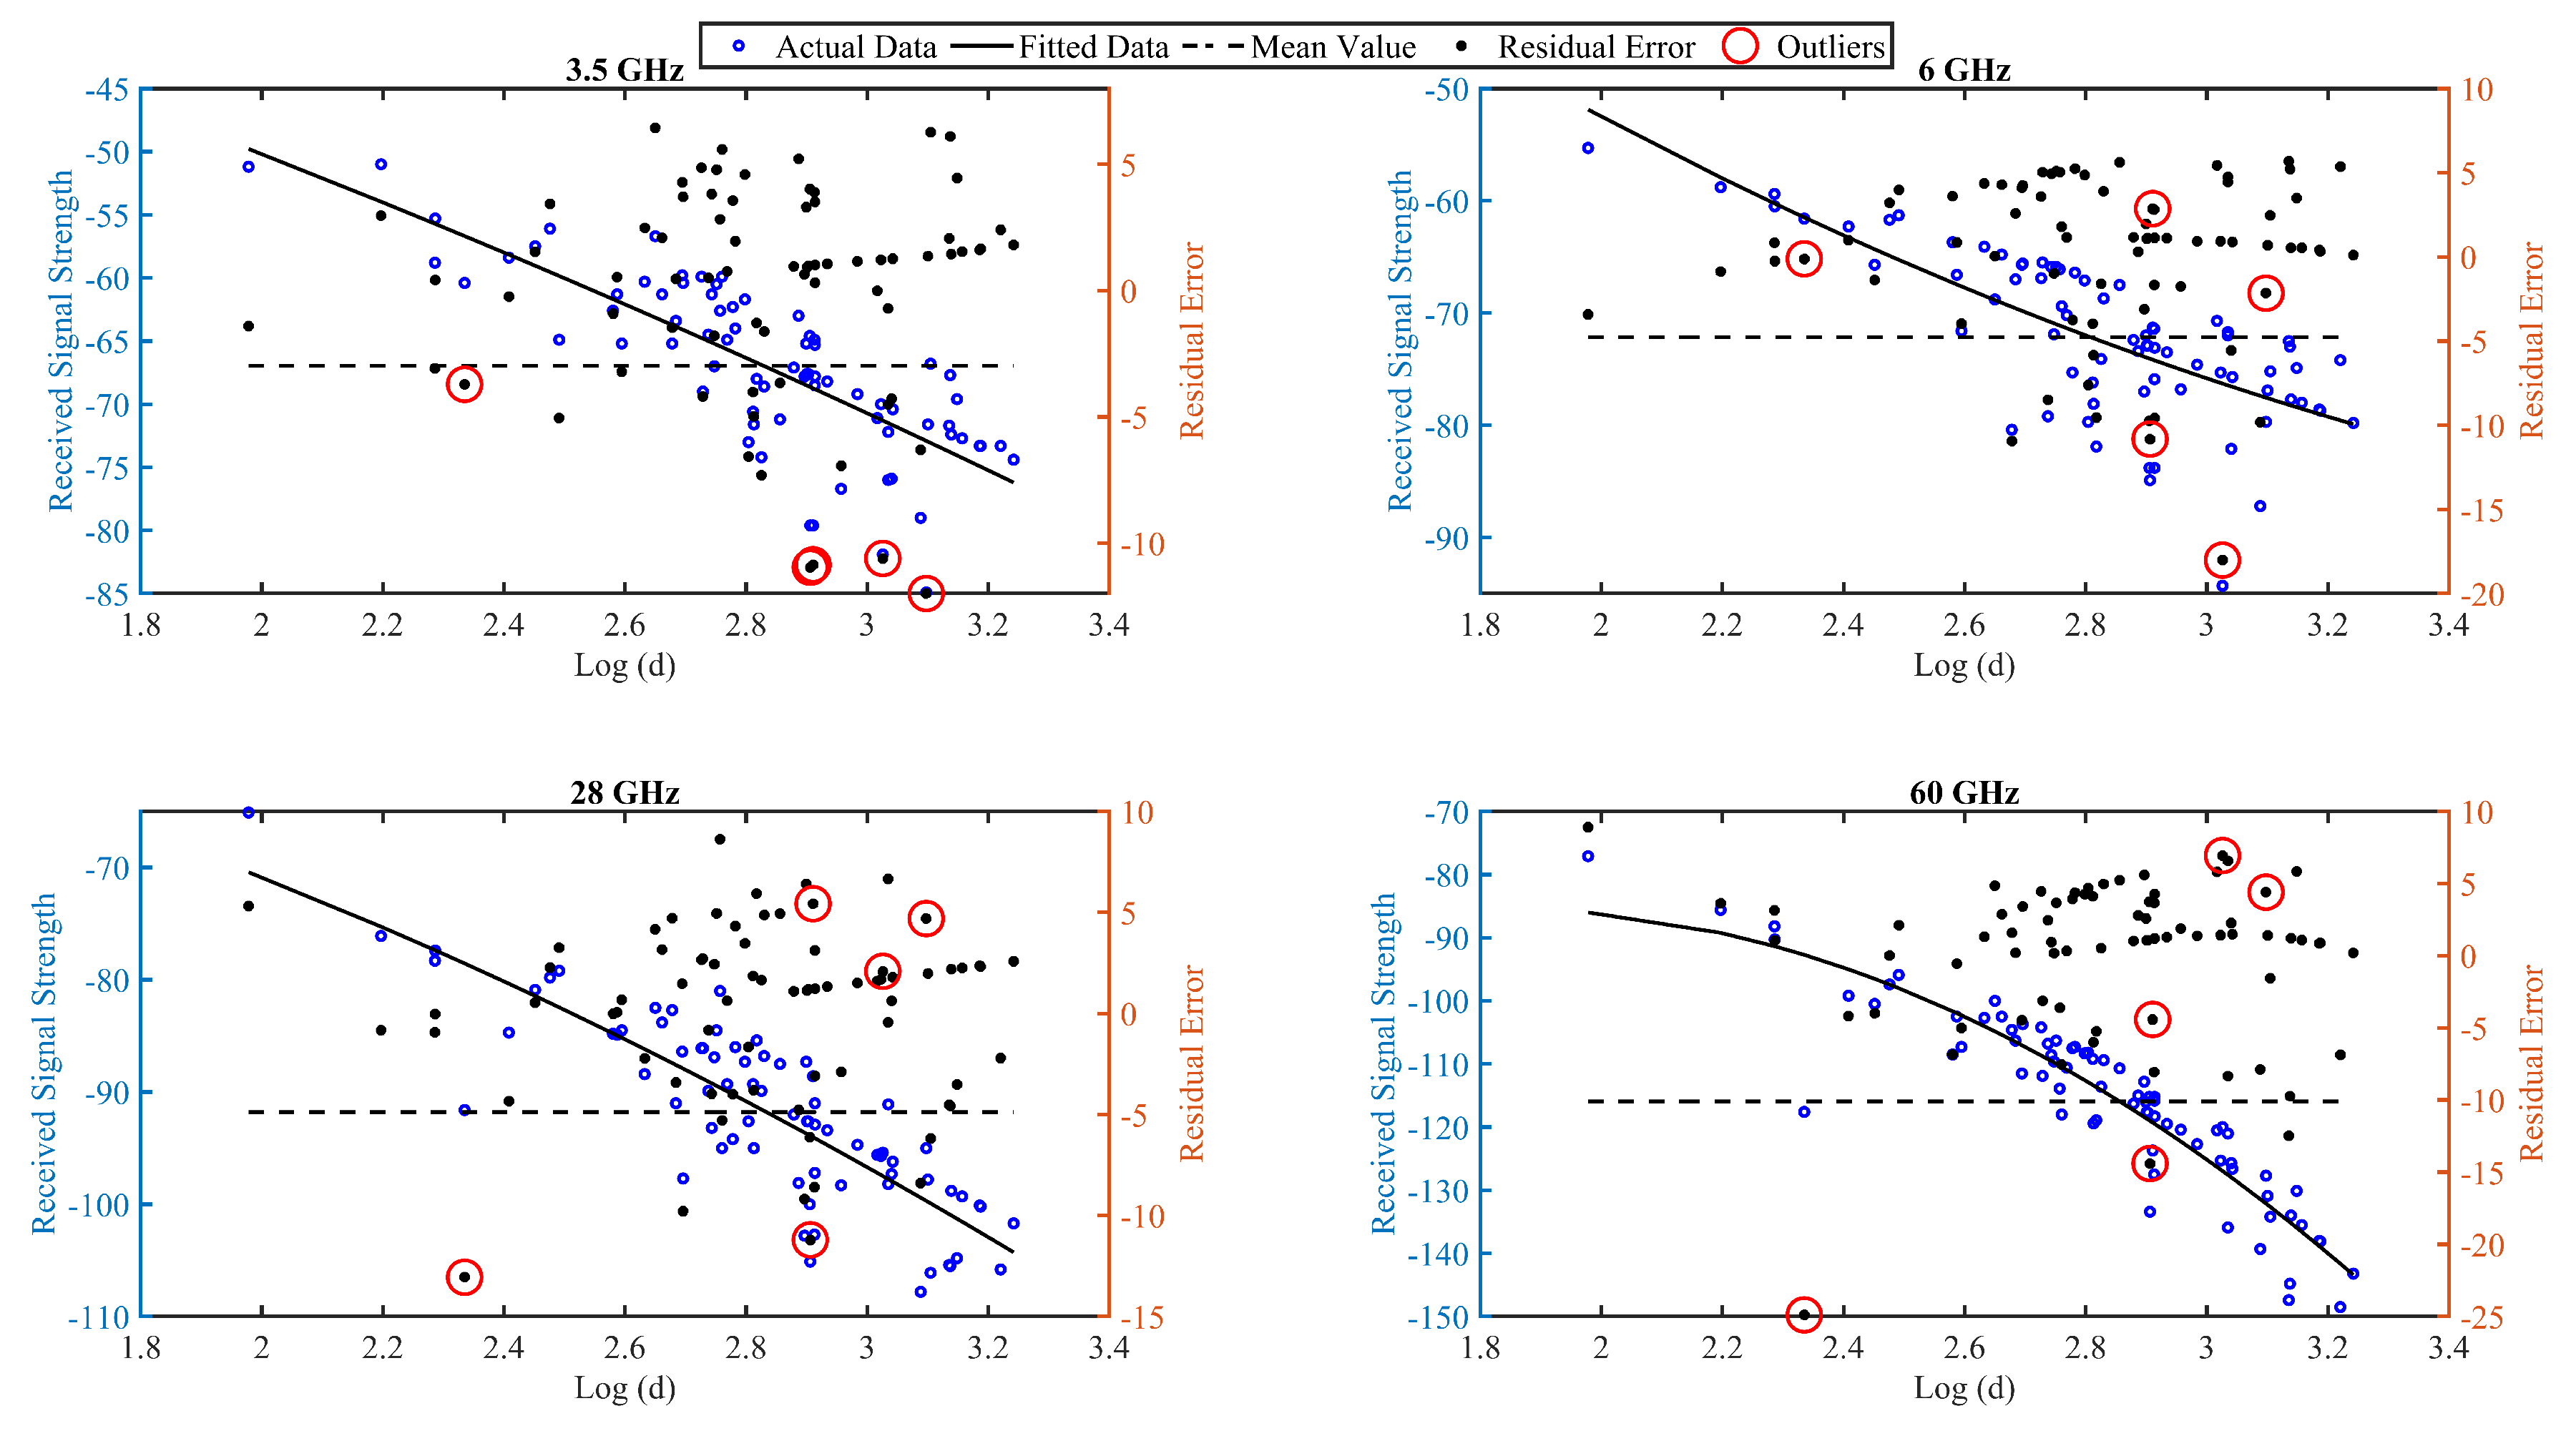
4.1. Received Signal Strength Modeling
4.2. Analysis of the Optimal UAV Position
4.3. Propagation Delay Analysis
4.4. Future Work and Considerations Beyond Our Current Scope
5. Conclusions
Author Contributions
Funding
Data Availability Statement
Conflicts of Interest
Abbreviations
| 5G | Fifth Generation (of Mobile Communication) |
| 6G | Sixth Generation |
| 3D | Three Dimensional |
| GHz | Gigahertz |
| PL | Path losses |
| mmWave | Millimeter wave |
| A2G | Air-to-Ground |
| LOS | Line-of-Sight |
| MB | Multiple Bounce |
| MSE | Mean Square Error |
| NLOS | Non-Line-of-Sight |
| dB | Decibel |
| GBSMs | Geometry-based stochastic models |
| MIMO | Multiple-Input Multiple-Output |
| 3GPP | Third-generation partnership project |
| m | Metre |
| Km | Kilometre |
| SBR | Shooting, and bouncing ray |
| RSS | Received Signal Strength |
| PITI | The total propagation loss |
| MATLAB | Matrix laboratory |
| UE | User Equipment |
| AOA | Angle of Arrival |
| AOD | Angle of Departure |
| Rx | Receiver |
| Tx | Transmitter |
| RT | Ray tracing |
| SB | Single Bounce |
| URLLC | Ultra Reliable Low Latency Communications |
| UAV | Unmanned Aerial Vehicle |
| UKM | Universiti Kebangsaan Malaysia (The National University of Malaysia) |
References
- Hayat, S.; Yanmaz, E.; Muzaffar, R. Survey on unmanned aerial vehicle networks for civil applications: A communications viewpoint. IEEE Commun. Surv. Tutor. 2016, 18, 2624–2661. [Google Scholar] [CrossRef]
- Saad, W.; Bennis, M.; Chen, M. A vision of 6G wireless systems: Applications, trends, technologies, and open research problems. IEEE Netw. 2019, 34, 134–142. [Google Scholar] [CrossRef]
- Zhang, C.; Zhang, W.; Wang, W.; Yang, L.; Zhang, W. Research challenges and opportunities of UAV millimeter-wave communications. IEEE Wirel. Commun. 2019, 26, 58–62. [Google Scholar] [CrossRef]
- Zhou, T.; Tao, C.; Salous, S.; Liu, L. Measurements and analysis of angular characteristics and spatial correlation for high-speed railway channels. IEEE Trans. Intell. Transp. Syst. 2017, 19, 357–367. [Google Scholar] [CrossRef]
- Jawad, A.M.; Nordin, R.; Jawad, H.M.; Gharghan, S.K.; Abu-Samah, A.; Abu-Alshaeer, M.J.; Abdullah, N.F. Wireless drone charging station using class-e power amplifier in vertical alignment and lateral misalignment conditions. Energies 2022, 15, 1298. [Google Scholar] [CrossRef]
- Alzahrani, B.; Oubbati, O.S.; Barnawi, A.; Atiquzzaman, M.; Alghazzawi, D. UAV assistance paradigm: State-of-the-art in applications and challenges. J. Netw. Comput. Appl. 2020, 166, 102706. [Google Scholar] [CrossRef]
- Zhu, L.; Zhang, J.; Xiao, Z.; Cao, X.; Wu, D.O.; Xia, X.G. 3-D beamforming for flexible coverage in millimeter-wave UAV communications. IEEE Wirel. Commun. Lett. 2019, 8, 837–840. [Google Scholar] [CrossRef]
- Liu, L.; Zhang, S.; Zhang, R. Multi-beam UAV communication in cellular uplink: Cooperative interference cancellation and sum-rate maximization. IEEE Trans. Wirel. Commun. 2019, 18, 4679–4691. [Google Scholar] [CrossRef]
- Wang, Z.; Duan, L. Chase or wait: Dynamic UAV deployment to learn and catch time-varying user activities. IEEE Trans. Mob. Comput. 2021, 22, 1369–1383. [Google Scholar] [CrossRef]
- Zakariaa, A.F.; Nasirb, M.F.M.; bin Mukhtar, A.; Ridzuand, M.N. Design Analysis of Open and Ducted Propellers in UAV Application. J. Kejuruter. 2022, 34, 119–125. [Google Scholar] [CrossRef]
- Mohd Kamal, N.; Sahwee, Z.; Norhashim, N.; Ahmad Shah, S.; Hashim, W. Throughput Performance of Cellular-Connected UAV Coexisting with Terrestrial Users. Unmanned Syst. 2024, 12, 535–543. [Google Scholar] [CrossRef]
- Helander, J.; Zhao, K.; Ying, Z.; Sjöberg, D. Performance analysis of millimeter-wave phased array antennas in cellular handsets. IEEE Antennas Wirel. Propag. Lett. 2015, 15, 504–507. [Google Scholar] [CrossRef]
- Alraih, S.; Nordin, R.; Shayea, I.; Abdullah, N.F.; Abu-Samah, A.; Alhammadi, A. Effectiveness of handover control parameters on handover performance in 5G and beyond mobile networks. Wirel. Commun. Mob. Comput. 2022, 2022, 2266282. [Google Scholar] [CrossRef]
- Zhang, J.; Ge, X.; Li, Q.; Guizani, M.; Zhang, Y. 5G millimeter-wave antenna array: Design and challenges. IEEE Wirel. Commun. 2016, 24, 106–112. [Google Scholar] [CrossRef]
- Zeng, Y.; Wu, Q.; Zhang, R. Accessing from the sky: A tutorial on UAV communications for 5G and beyond. Proc. IEEE 2019, 107, 2327–2375. [Google Scholar] [CrossRef]
- Ancans, G.; Bobrovs, V.; Haidine, A.; Aqqal, A. Spectrum usage for 5G mobile communication systems and electromagnetic compatibility with existent technologies. In Broadband Communications Networks-Recent Advances and Lessons from Practice; IntechOpen: London, UK, 2018; pp. 27–41. [Google Scholar]
- Abdullah, N.F.; Berraki, D.; Ameen, A.; Armour, S.; Doufexi, A.; Nix, A.; Beach, M. Channel parameters and throughput predictions for mmWave and LTE-A networks in urban environments. In Proceedings of the 2015 IEEE 81st Vehicular Technology Conference (VTC Spring), Glasgow, UK, 11–14 May 2015; IEEE: Piscataway, NJ, USA, 2015; pp. 1–5. [Google Scholar] [CrossRef]
- Rappaport, T.S.; Sun, S.; Mayzus, R.; Zhao, H.; Azar, Y.; Wang, K.; Wong, G.N.; Schulz, J.K.; Samimi, M.; Gutierrez, F. Millimeter wave mobile communications for 5G cellular: It will work! IEEE Access 2013, 1, 335–349. [Google Scholar] [CrossRef]
- Alobaidy, H.A.; Singh, M.J.; Behjati, M.; Nordin, R.; Abdullah, N.F. Wireless transmissions, propagation and channel modelling for iot technologies: Applications and challenges. IEEE Access 2022, 10, 24095–24131. [Google Scholar] [CrossRef]
- Zhao, N.; Lu, W.; Sheng, M.; Chen, Y.; Tang, J.; Yu, F.R.; Wong, K.K. UAV-assisted emergency networks in disasters. IEEE Wirel. Commun. 2019, 26, 45–51. [Google Scholar] [CrossRef]
- Wang, C.X.; Bian, J.; Sun, J.; Zhang, W.; Zhang, M. A survey of 5G channel measurements and models. IEEE Commun. Surv. Tutorials 2018, 20, 3142–3168. [Google Scholar] [CrossRef]
- Wang, C.X.; Lv, Z.; Gao, X.; You, X.; Hao, Y.; Haas, H. Pervasive wireless channel modeling theory and applications to 6G GBSMs for all frequency bands and all scenarios. IEEE Trans. Veh. Technol. 2022, 71, 9159–9173. [Google Scholar] [CrossRef]
- Cheng, X.; Huang, Z.; Chen, S. Vehicular communication channel measurement, modelling, and application for beyond 5G and 6G. IET Commun. 2020, 14, 3303–3311. [Google Scholar] [CrossRef]
- Yu, C.; Liu, Y.; Chang, H.; Zhang, J.; Zhang, M.; Poechmueller, P.; Wang, C. AG channel measurements and characteristics analysis in hilly scenarios for 6G UAV communications. China Commun. 2022, 19, 32–46. [Google Scholar] [CrossRef]
- Matolak, D.W.; Sun, R. Air–ground channel characterization for unmanned aircraft systems—Part III: The suburban and near-urban environments. IEEE Trans. Veh. Technol.y 2017, 66, 6607–6618. [Google Scholar] [CrossRef]
- Khawaja, W.; Ozdemir, O.; Guvenc, I. UAV air-to-ground channel characterization for mmWave systems. In Proceedings of the 2017 IEEE 86th Vehicular Technology Conference (VTC-Fall), Toronto, ON, Canada, 24–27 September 2017; IEEE: Piscataway, NJ, USA, 2017; pp. 1–5. [Google Scholar]
- Wheeb, A.H.; Nordin, R.; Samah, A.; Alsharif, M.H.; Khan, M.A. Topology-based routing protocols and mobility models for flying ad hoc networks: A contemporary review and future research directions. Drones 2021, 6, 9. [Google Scholar] [CrossRef]
- Liu, Y.; Wang, C.X.; Chang, H.; He, Y.; Bian, J. A novel non-stationary 6G UAV channel model for maritime communications. IEEE J. Sel. Areas Commun. 2021, 39, 2992–3005. [Google Scholar] [CrossRef]
- Chang, H.; Wang, C.X.; Liu, Y.; Huang, J.; Sun, J.; Zhang, W.; Gao, X. A novel nonstationary 6G UAV-to-ground wireless channel model with 3-D arbitrary trajectory changes. IEEE Internet Things J. 2020, 8, 9865–9877. [Google Scholar] [CrossRef]
- Mao, K.; Zhu, Q.; Song, M.; Hua, B.; Zhong, W.; Ye, X. A geometry-based beamforming channel model for UAV mmWave communications. Sensors 2020, 20, 6957. [Google Scholar] [CrossRef] [PubMed]
- Cui, Z.; Guan, K.; He, D.; Ai, B.; Zhong, Z. Propagation modeling for UAV air-to-ground channel over the simple mountain terrain. In Proceedings of the 2019 IEEE International Conference on Communications Workshops (ICC Workshops), Shanghai, China, 20–24 May 2019; IEEE: Piscataway, NJ, USA, 2019; pp. 1–6. [Google Scholar]
- Rappaport, T.S.; Heath Jr, R.W.; Daniels, R.C.; Murdock, J.N. Millimeter Wave Wireless Communications; Pearson Education: London, UK, 2015. [Google Scholar]
- Akdeniz, M.R.; Liu, Y.; Samimi, M.K.; Sun, S.; Rangan, S.; Rappaport, T.S.; Erkip, E. Millimeter wave channel modeling and cellular capacity evaluation. IEEE J. Sel. Areas Commun. 2014, 32, 1164–1179. [Google Scholar] [CrossRef]
- Hemadeh, I.A.; Satyanarayana, K.; El-Hajjar, M.; Hanzo, L. Millimeter-wave communications: Physical channel models, design considerations, antenna constructions, and link-budget. IEEE Commun. Surv. Tutorials 2017, 20, 870–913. [Google Scholar] [CrossRef]
- Azevedo, J.A.; Santos, F.E. A model to estimate the path loss in areas with foliage of trees. Aeu-Int. J. Electron. Commun. 2017, 71, 157–161. [Google Scholar] [CrossRef]
- Castellanos, G.D.; Teuta, G. Urban-Vegetation ratio evaluation for Path Loss model in Amazonian region for Television Bands. In Proceedings of the 2017 47th European Microwave Conference (EuMC), Nuremberg, Germany, 10–12 October 2017; IEEE: Piscataway, NJ, USA, 2017; pp. 699–702. [Google Scholar]
- Alraih, S.; Nordin, R.; Samah, A.A.; Shayea, I.; Abdullah, N.F. A survey on handover optimization in beyond 5G mobile networks: Challenges and solutions. IEEE Access 2023, 11, 59317–59345. [Google Scholar] [CrossRef]
- ITU. Attenuation in Vegetation. ITU-R Recommendation P.833-4 2021. Available online: https://www.itu.int/rec/R-REC-P.833-4-200304-S/en (accessed on 1 July 2023).
- Hejselbæk, J.; Nielsen, J.Ø.; Fan, W.; Pedersen, G.F. Empirical study of near ground propagation in forest terrain for internet-of-things type device-to-device communication. IEEE Access 2018, 6, 54052–54063. [Google Scholar] [CrossRef]
- Rougerie, S.; Israel, J.; Kan, T. Validation of ITU-R P. 833–9 tree attenuation model for Land Mobile Satellite propagation channel at Ku/Ka band. In Proceedings of the 2021 15th European Conference on Antennas and Propagation (EuCAP), Dusseldorf, Germany, 22–26 March 2021; IEEE: Piscataway, NJ, USA, 2021; pp. 1–5. [Google Scholar]
- Uwaechia, A.N.; Mahyuddin, N.M. A comprehensive survey on millimeter wave communications for fifth-generation wireless networks: Feasibility and challenges. IEEE Access 2020, 8, 62367–62414. [Google Scholar] [CrossRef]
- Yun, Z.; Iskander, M.F. Ray tracing for radio propagation modeling: Principles and applications. IEEE Access 2015, 3, 1089–1100. [Google Scholar] [CrossRef]
- Castellanos, G.; De Beelde, B.; Plets, D.; Martens, L.; Joseph, W.; Deruyck, M. Evaluating 60 GHz FWA Deployments for Urban and Rural Environments in Belgium. Sensors 2023, 23, 1056. [Google Scholar] [CrossRef] [PubMed]
- De Beelde, B.; De Beelde, R.; Tanghe, E.; Plets, D.; Verheyen, K.; Joseph, W. Vegetation loss at D-band frequencies and new vegetation-dependent exponential decay model. IEEE Trans. Antennas Propag. 2022, 70, 12092–12103. [Google Scholar] [CrossRef]
- Al-Nuaimi, M.; Stephens, R. Measurements and prediction model optimisation for signal attenuation in vegetation media at centimetre wave frequencies. IEE Proc.-Microwaves Antennas Propag. 1998, 145, 201–206. [Google Scholar] [CrossRef]
- Weissberger, M. An Initial Critical Summary of Models for Predicting the Attenuation of Radio Waves by Trees [Final Report]. 1982. Available online: https://ui.adsabs.harvard.edu/abs/1982ecac.rept.....W/abstract (accessed on 20 August 2023).
- Zhang, P.; Yang, B.; Yi, C.; Wang, H.; You, X. Measurement-based 5G millimeter-wave propagation characterization in vegetated suburban macrocell environments. IEEE Trans. Antennas Propag. 2020, 68, 5556–5567. [Google Scholar] [CrossRef]
- Zhang, Y.; Anderson, C.R.; Michelusi, N.; Love, D.J.; Baker, K.R.; Krogmeier, J.V. Propagation modeling through foliage in a coniferous forest at 28 GHz. IEEE Wirel. Commun. Lett. 2019, 8, 901–904. [Google Scholar] [CrossRef]
- Van Dooren, G.; Govaerts, H.; Herben, M. COST 235: Radiowave Propagation Effects on Next-Generation Fixed-Services Terrestrial Telecommunications Systems. 1997. Available online: https://op.europa.eu/en/publication-detail/-/publication/1b803f14-c913-11e6-ad7c-01aa75ed71a1 (accessed on 11 May 2023).
- Lagrone, A. Propagation of VHF and UHF electromagnetic waves over a grove of trees in full leaf. IEEE Trans. Antennas Propag. 1977, 25, 866–869. [Google Scholar] [CrossRef]
- Leonor, N.R.; Fernandes, T.R.; Sánchez, M.G.; Caldeirinha, R.F. A 3-D model for millimeter-wave propagation through vegetation media using ray-tracing. IEEE Trans. Antennas Propag. 2019, 67, 4313–4318. [Google Scholar] [CrossRef]
- Behjati, M.; Nordin, R.; Zulkifley, M.A.; Abdullah, N.F. 3D global path planning optimization for cellular-connected UAVs under link reliability constraint. Sensors 2022, 22, 8957. [Google Scholar] [CrossRef] [PubMed]
- Singh, S.; Chawla, M. A Review on Millimeter Wave Communication and Effects on 5G System. Int. Adv. Res. J. Sci. Eng. Technol. 2017, 4. [Google Scholar] [CrossRef]
- Rani, P.; Sharma, R. Intelligent transportation system performance analysis of indoor and outdoor internet of vehicle (iov) applications towards 5g. Tsinghua Sci. Technol. 2024, 29, 1785–1795. [Google Scholar] [CrossRef]
- Yamakura, H.; Ching, G.S.; Kishiki, Y.; Sekino, N.; Oshima, I.; Imai, T. Measurement and Ray Tracing Simulation with Urban Microcell Environments at 28GHz Band. Ieice Trans. Commun. 2022, 105, 748–756. [Google Scholar] [CrossRef]
- Sheikh, M.U.; Ruttik, K.; Saba, N.; Mutafungwa, E.; Jäntti, R.; Hämäläinen, J. Analysis of drone propagation with ray tracing from Sub-6 GHz upto terahertz frequencies in a real world urban environment. In Proceedings of the 2021 International Conference on Information Networking (ICOIN), Jeju, Republic of Korea, 13–16 January 2021; IEEE: Piscataway, NJ, USA, 2021; pp. 169–174. [Google Scholar]
- Tang, H.; Yang, N.; Zhang, Z.; Du, Z.; Shen, J. 5G NR and Enhancements: From R15 to R16; Elsevier: Amsterdam, The Netherlands, 2021. [Google Scholar]
- Pagliari, E.; Davoli, L.; Cicioni, G.; Palazzi, V.; Ferrari, G. On UAV Terrestrial Connectivity Enhancement through Smart Selective Antennas. J. Phys. Conf. Ser. 2024, 2716, 012057. [Google Scholar] [CrossRef]
- Norhashim, N.; Kamal, N.M.; Shah, S.A.; Sahwee, Z.; Ruzani, A.A. A review of unmanned aerial vehicle technology adoption for precision agriculture in Malaysia. Unmanned Syst. 2023, 1–19. [Google Scholar] [CrossRef]
- ITU, I.T.U. Effects of Building Materials and Structures on Radiowave Propagation above about 100 MHz. ITU-R Recommendation P.2040-3. 2023. Available online: https://www.itu.int/rec/R-REC-P.2040-3-202308-I/en (accessed on 10 October 2023).
- ITU. Electrical Characteristics of the Surface of the Earth. ITU-R Recommendation P.527-6. 2021. Available online: https://www.itu.int/rec/R-REC-P.527-6-202109-I/en (accessed on 8 September 2023).
- ITU, I.T.U. Specific Attenuation Model for Rain for Use in Prediction Methods. ITU-R Recommendation P.838-3. 2005. Available online: https://www.itu.int/rec/R-REC-P.838-3-200503-I/en (accessed on 15 July 2023).
- ITU, I.T.U. Attenuation by Atmospheric Gases and Related Effects. ITU-R Recommendation P.676-13. 2022. Available online: https://www.itu.int/rec/R-REC-P.676-13-202208-I/en (accessed on 12 July 2023).
- Banafaa, M.; Pepeoğlu, Ö.; Shayea, I.; Alhammadi, A.; Shamsan, Z.; Razaz, M.A.; Alsagabi, M.; Al-Sowayan, S. A comprehensive survey on 5G-and-beyond networks with UAVs: Applications, emerging technologies, regulatory aspects, research trends and challenges. IEEE Access 2024, 12, 7786–7826. [Google Scholar] [CrossRef]
- Stöcker, C.; Bennett, R.; Nex, F.; Gerke, M.; Zevenbergen, J. Review of the current state of UAV regulations. Remote. Sens. 2017, 9, 459. [Google Scholar] [CrossRef]


| Model | A | B | C | F (GHz) | D (m) |
|---|---|---|---|---|---|
| CCIR [40] | 0.2 | 0.3 | 0.6 | 0.2–95 | 0, 400 |
| Wiesberger_a [46] | 1.33 | 0.248 | 0.588 | 0.23–95 | 14, 400 |
| Wiesberger_b [46] | 0.45 | 0.248 | 1 | 0.23–95 | 0, 14 |
| Ko et al. [47] | 0.805 | 0.261 | 0.277 | 28 | 20, 370 |
| Lv et al. [48] | 2.143 | 0.078 | 0.650 | 38–40 | 2.9, 11.8 |
| FITU-R [49] | 0.39 | 0.39 | 0.25 | 9–40 | 0, 200 |
| Cost235 [50] | 15.6 | −0.009 | 0.26 | 9.6–57.6 | 0, 200 |
| Horak et al. [51] | 0.39 | 0.39 | 0.25 | 9.6–57 | 0, 200 |
| Ref. | Freq GHz | Env. | Contributions |
|---|---|---|---|
| [20] | 1–100 | Suburban | The research considers channel characteristics across spectra and scenarios, offering adaptability to simplify specific channel models through parameter adjustments. |
| [23] | 60 | Suburban | Measurements carried out at the American College of Greece. It offers insights into excess loss, azimuth gain degradation, and temporal power fluctuations. |
| [29] | mmWaves | Sea | It analyzes statistical properties and validates the model’s accuracy through comparison with measurement data, aiding system design and performance evaluation for UAV communication networks at sea. |
| [30] | mmWaves | Urban | Stochastic model for UAV-to-vehicle communication. It validates the model’s time-variant statistical properties through simulations based on measured and RT data, enhancing understanding of UAV communication channels. |
| [54] | mmWaves | Suburban | This article compares indoor and outdoor mmWave propagation using free space path loss models. Despite increased route loss outside, the approach delivers high packet delivery ratios, average throughput, and low latency. |
| [55] | mmWaves | Urban | This study explores outdoor propagation, comparing real-world measurements with RT simulations to refine mmWaves wireless design. RT is proven accurate and aids in theoretical coverage area modeling. |
| This work | 3.6, 6, 28, 60 | S1, S2 | Provides insights into optimizing network design and UAV placement in 5G networks across diverse terrains, aiding wireless communication system performance in challenging environments. |
| Parameter | Value |
|---|---|
| Carrier Frequency | 3.5, 6, 28 and 60 GHz |
| Tx Antenna Type | Omni directional |
| UE Antenna type | Omni directional |
| Transmitter Power | 5 W |
| Maximum range of Transmitter | 3 km |
| UAV altitude | 30–120 m |
| UEs Height | 1.5 m AGL |
| Receiver Sensitivity | −100 dBm |
| Coverage Area | 2 × 3 km² |
| Foliage Depth | 5 m |
| Material | Mountain, Building = concrete |
| Weather | Rain and Gas |
| Scenario 1 (S1) | Skardu, Pakistan |
| Scenario 2 (S2) | UKM, Malaysia |
| Parameters | RSS with Concrete | Plus Weather | Plus Foliage | Final Path Loss | UEs with Outage | Final Phase Shift | |||
|---|---|---|---|---|---|---|---|---|---|
| Freq. (GHz) | Alt (m) | Average (dBm) | Nb | Max | Min | Avg | |||
| 30 | −62.9 | −63.0 | −66.2 | −101.3 | 5 | 6.3 | 0.0 | 3.2 | |
| 3.5 | 75 | −63.7 | −63.7 | −66.7 | −100.5 | 2 | 6.1 | 0.2 | 2.8 |
| 120 | −62.2 | −62.3 | −65.5 | −100.0 | 1 | 6.2 | 0.1 | 3.1 | |
| 30 | −68.3 | −68.4 | −72.1 | −106.1 | 6 | 6.2 | 0.2 | 3.4 | |
| 6 | 75 | −68.4 | −68.4 | −72.1 | −102.3 | 2 | 6.1 | 0.2 | 3.5 |
| 120 | −67.2 | −67.3 | −71.1 | −104.8 | 1 | 6.2 | 0.1 | 3.1 | |
| 30 | −81.1 | −85.1 | −90.9 | −123.5 | 8 | 6.2 | 0.1 | 3.1 | |
| 28 | 75 | −81.7 | −85.8 | −91.6 | −122.7 | 3 | 6.2 | 0.3 | 3.2 |
| 120 | −81.2 | −85.3 | −91.1 | −122.4 | 2 | 6.2 | 0.1 | 2.9 | |
| 30 | −89.4 | −110.2 | −117.4 | −148.5 | 9 | 6.2 | 0.1 | 3.0 | |
| 60 | 75 | −88.5 | −106.9 | −116.1 | −146.0 | 4 | 6.1 | 0.1 | 3.2 |
| 120 | −87.1 | −107.5 | −114.7 | −145.9 | 2 | 6.2 | 0.0 | 3.3 | |
| Parameters | RSS with Concrete | Plus Weather | Plus Foliage | Final Path Loss | UEs with Outage | Final Phase Shift | |||
|---|---|---|---|---|---|---|---|---|---|
| Freq. (GHz) | Alt (m) | Average (dBm) | Nb | Max | Min | Avg | |||
| 30 | −56.2 | −56.2 | −59.5 | −97.7 | 4 | 6.1 | 0.2 | 3.1 | |
| 3.5 | 75 | −57.6 | −57.5 | −60.7 | −97.9 | 1 | 6.1 | 0.0 | 2.9 |
| 120 | −58.1 | −57.9 | −61.2 | −98.5 | 0 | 6.2 | 0.2 | 3.2 | |
| 30 | −61.1 | −61.2 | −64.9 | −102.4 | 5 | 6.3 | 0.2 | 3.4 | |
| 6 | 75 | −61.9 | −61.9 | −65.8 | −102.6 | 1 | 6.2 | 0.1 | 3.2 |
| 120 | −63.2 | −63.1 | −66.8 | −102.8 | 0 | 6.2 | 0.1 | 3.2 | |
| 30 | −74.4 | −77.7 | −83.5 | −119.3 | 6 | 6.2 | 0.2 | 3.2 | |
| 28 | 75 | −75.4 | −79.0 | −84.8 | −119.5 | 2 | 6.2 | 0.2 | 3.2 |
| 120 | −76.3 | −79.9 | −85.7 | −119.9 | 1 | 6.2 | 0.1 | 3.1 | |
| 30 | −81.1 | −97.5 | −105.5 | −139.5 | 8 | 6.1 | 0.4 | 3.5 | |
| 60 | 75 | −81.8 | −98.6 | −105.8 | −140.0 | 3 | 6.0 | 0.1 | 2.9 |
| 120 | −82.6 | −99.7 | −106.9 | − 140.4 | 2 | 6.2 | 0.2 | 3.3 | |
| Scenario | Altitude (m) | Max Delay (s) | Min Delay (s) | Average Delay (s) |
|---|---|---|---|---|
| S1 | 45 | 7.20 | 0.28 | 2.09 |
| 75 | 7.21 | 0.32 | 2.08 | |
| 105 | 7.22 | 0.43 | 2.10 | |
| 120 | 7.23 | 0.48 | 2.11 | |
| S2 | 45 | 5.81 | 0.25 | 2.55 |
| 75 | 5.82 | 0.31 | 2.56 | |
| 105 | 5.83 | 0.40 | 2.58 | |
| 120 | 5.84 | 0.45 | 2.83 |
| Frequency (GHz) | a | b | c |
|---|---|---|---|
| 3.5 | −4.72 | 8.89 | −49.75 |
| 6 | −7.27 | 21.29 | −69.94 |
| 28 | −8.02 | 21.14 | −84.48 |
| 60 | −32.56 | 128.96 | −213.8 |
| Frequency (GHz) | a | b | c |
|---|---|---|---|
| 3.5 | −1.72 | −11.90 | −19.4 |
| 6 | 5.20 | −49.34 | 25.35 |
| 28 | −4.43 | −3.64 | −45.85 |
| 60 | −29.33 | 107.70 | −184.27 |
Disclaimer/Publisher’s Note: The statements, opinions and data contained in all publications are solely those of the individual author(s) and contributor(s) and not of MDPI and/or the editor(s). MDPI and/or the editor(s) disclaim responsibility for any injury to people or property resulting from any ideas, methods, instructions or products referred to in the content. |
© 2024 by the authors. Licensee MDPI, Basel, Switzerland. This article is an open access article distributed under the terms and conditions of the Creative Commons Attribution (CC BY) license (https://creativecommons.org/licenses/by/4.0/).
Share and Cite
Ali, S.; Abu-Samah, A.; Abdullah, N.F.; Mohd Kamal, N.L. Propagation Modeling of Unmanned Aerial Vehicle (UAV) 5G Wireless Networks in Rural Mountainous Regions Using Ray Tracing. Drones 2024, 8, 334. https://doi.org/10.3390/drones8070334
Ali S, Abu-Samah A, Abdullah NF, Mohd Kamal NL. Propagation Modeling of Unmanned Aerial Vehicle (UAV) 5G Wireless Networks in Rural Mountainous Regions Using Ray Tracing. Drones. 2024; 8(7):334. https://doi.org/10.3390/drones8070334
Chicago/Turabian StyleAli, Shujat, Asma Abu-Samah, Nor Fadzilah Abdullah, and Nadhiya Liyana Mohd Kamal. 2024. "Propagation Modeling of Unmanned Aerial Vehicle (UAV) 5G Wireless Networks in Rural Mountainous Regions Using Ray Tracing" Drones 8, no. 7: 334. https://doi.org/10.3390/drones8070334
APA StyleAli, S., Abu-Samah, A., Abdullah, N. F., & Mohd Kamal, N. L. (2024). Propagation Modeling of Unmanned Aerial Vehicle (UAV) 5G Wireless Networks in Rural Mountainous Regions Using Ray Tracing. Drones, 8(7), 334. https://doi.org/10.3390/drones8070334