Article

A Lightweight Insulator Defect Detection Model Based on Drone Images

by
Yang Lu
,
Dahua Li
*,†,
Dong Li
,
Xuan Li
,
Qiang Gao
and
Xiao Yu
School of Electrical Engineering and Automation, Tianjin University of Technology, Tianjin 300384, China
*
Author to whom correspondence should be addressed.
These authors contributed equally to this work.
Drones 2024, 8(9), 431; https://doi.org/10.3390/drones8090431
Submission received: 17 July 2024 / Revised: 22 August 2024 / Accepted: 22 August 2024 / Published: 26 August 2024

Abstract

:
With the continuous development and construction of new power systems, using drones to inspect the condition of transmission line insulators has become an inevitable trend. To facilitate the deployment of drone hardware equipment, this paper proposes IDD-YOLO (Insulator Defect Detection-YOLO), a lightweight insulator defect detection model. Initially, the backbone network of IDD-YOLO employs GhostNet for feature extraction. However, due to the limited feature extraction capability of GhostNet, we designed a lightweight attention mechanism called LCSA (Lightweight Channel-Spatial Attention), which is combined with GhostNet to capture features more comprehensively. Secondly, the neck network of IDD-YOLO utilizes PANet for feature transformation and introduces GSConv and C3Ghost convolution modules to reduce redundant parameters and lighten the network. The head network employs the YOLO detection head, incorporating the EIOU loss function and Mish activation function to optimize the speed and accuracy of insulator defect detection. Finally, the model is optimized using TensorRT and deployed on the NVIDIA Jetson TX2 NX mobile platform to test the actual inference speed of the model. The experimental results demonstrate that the model exhibits outstanding performance on both the proprietary ID-2024 insulator defect dataset and the public SFID insulator dataset. After optimization with TensorRT, the actual inference speed of the IDD-YOLO model reached 20.83 frames per second (FPS), meeting the demands for accurate and real-time inspection of insulator defects by drones.

1. Introduction

The inspection of transmission lines is critical for ensuring the stable operation of the power grid [1,2]. Insulators, as a core component of transmission lines, are frequently exposed to harsh natural environments, making them prone to failures that can, in turn, affect the stability of the power grid.
Traditional insulator inspection methods rely on manual operations, which are not only labor-intensive but also require personnel to climb mountains in extreme weather conditions. This approach not only consumes significant human resources but also increases the likelihood of missed or incorrect inspections. In recent years, drone technology has emerged as a powerful tool for inspecting power facilities due to its flexibility and efficiency [3]. Drones can carry high-definition cameras to fly over complex terrains, capturing high-resolution images of insulators [4].
Moreover, the introduction of deep learning has provided robust support for the automatic analysis of drone images [5,6]. By utilizing deep learning models such as Convolutional Neural Networks (CNNs), insulator defects in images, such as breakages and flashovers, can be automatically identified and classified. The integration of this technology not only enhances the accuracy of defect detection but also significantly improves processing speed, enabling drones to analyze large volumes of data in a short amount of time during actual operations.
However, due to the limited computing power of edge computing devices such as drones, most existing target detection models are difficult to deploy on drone hardware. Even though some lightweight detection models can be deployed on hardware devices, their accuracy is low and does not meet the requirements of actual inspection needs. Therefore, there is an urgent need to design a detection model that is both high in accuracy and lightweight. Additionally, existing insulator defect datasets usually focus only on a single type of defect, which does not meet the need for detecting multiple types of defects in practical situations. Thus, constructing a dataset that includes multiple types of insulator defects is also crucial.
To address the challenges of deploying insulator defect detection models on unmanned aerial vehicle (UAV) platforms, this paper proposes a lightweight insulator defect detection network, IDD-YOLO. This network is designed to enable the precise and rapid defect recognition of insulators in complex environments by drones. Additionally, we established a dataset, ID-2024, which includes multiple types of insulator defects, addressing the issue of existing datasets focusing only on a single type of defect.
Below are the main contributions of this paper:
(1)
We propose IDD-YOLO, a lightweight and accurate detection model, specifically designed for detecting insulator defects in transmission lines. Compared to the existing mainstream insulator defect detection models, IDD-YOLO demonstrates a higher accuracy and a smaller number of parameters. Additionally, we constructed ID-2024, a dataset that includes multiple types of insulator defects, to better meet practical inspection needs.
(2)
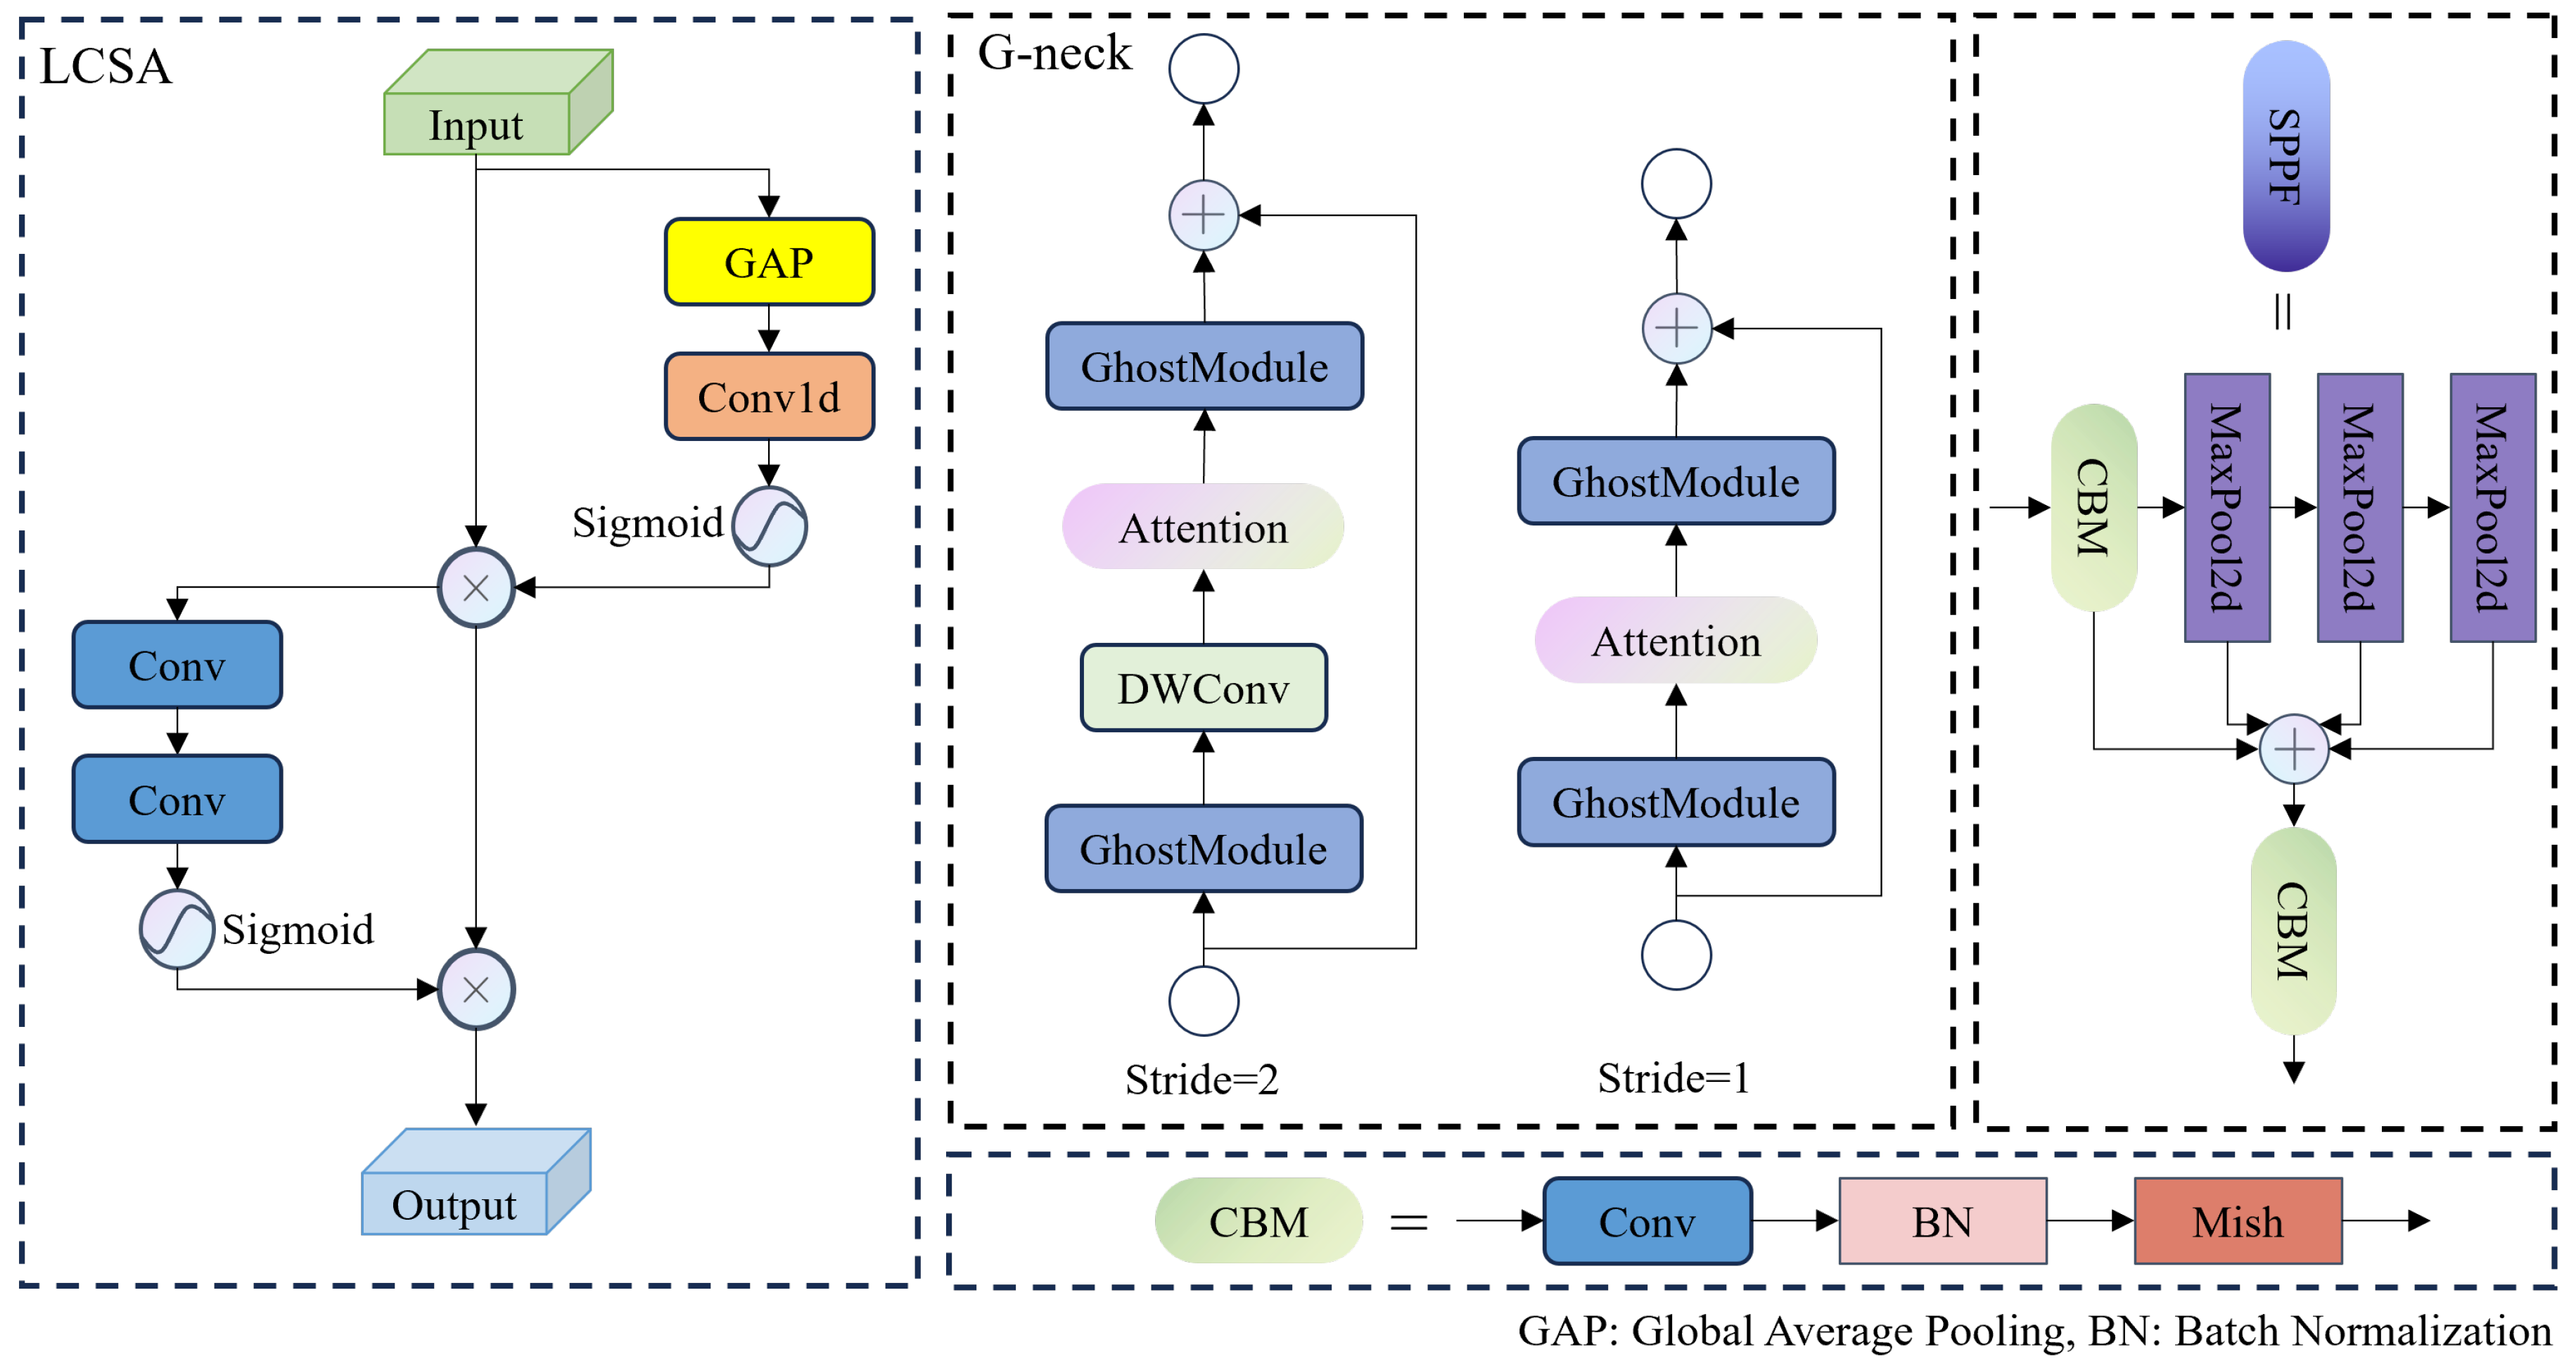
We propose LCSA, a novel attention mechanism, and integrate it with the GhostNet backbone network, enabling the model to extract features more comprehensively without increasing computational parameters.
(3)
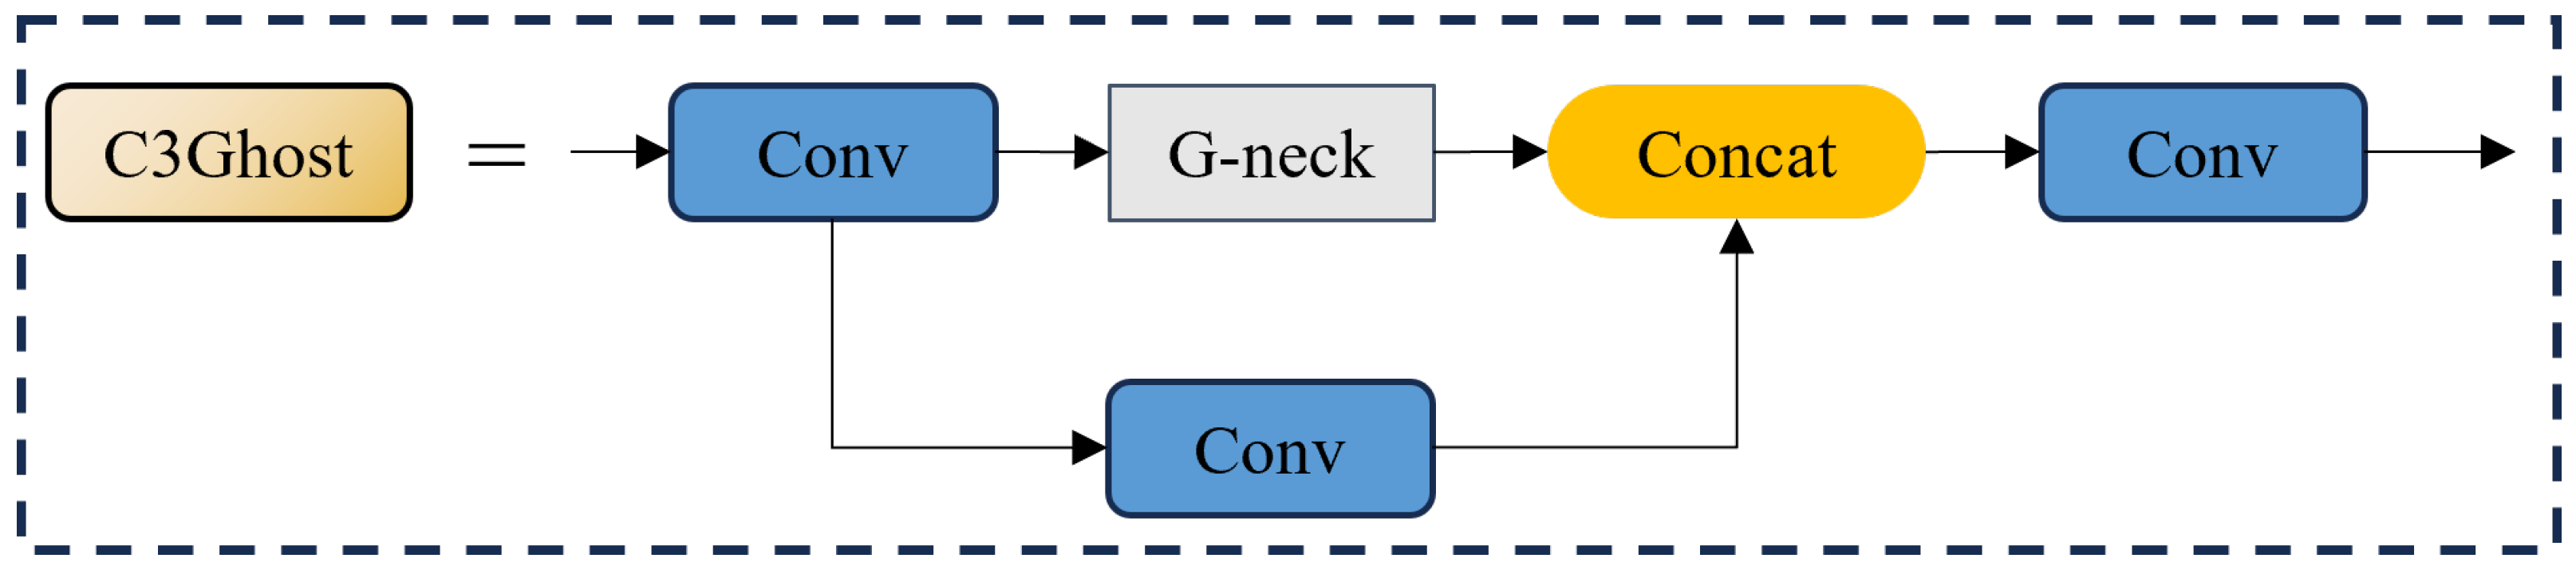
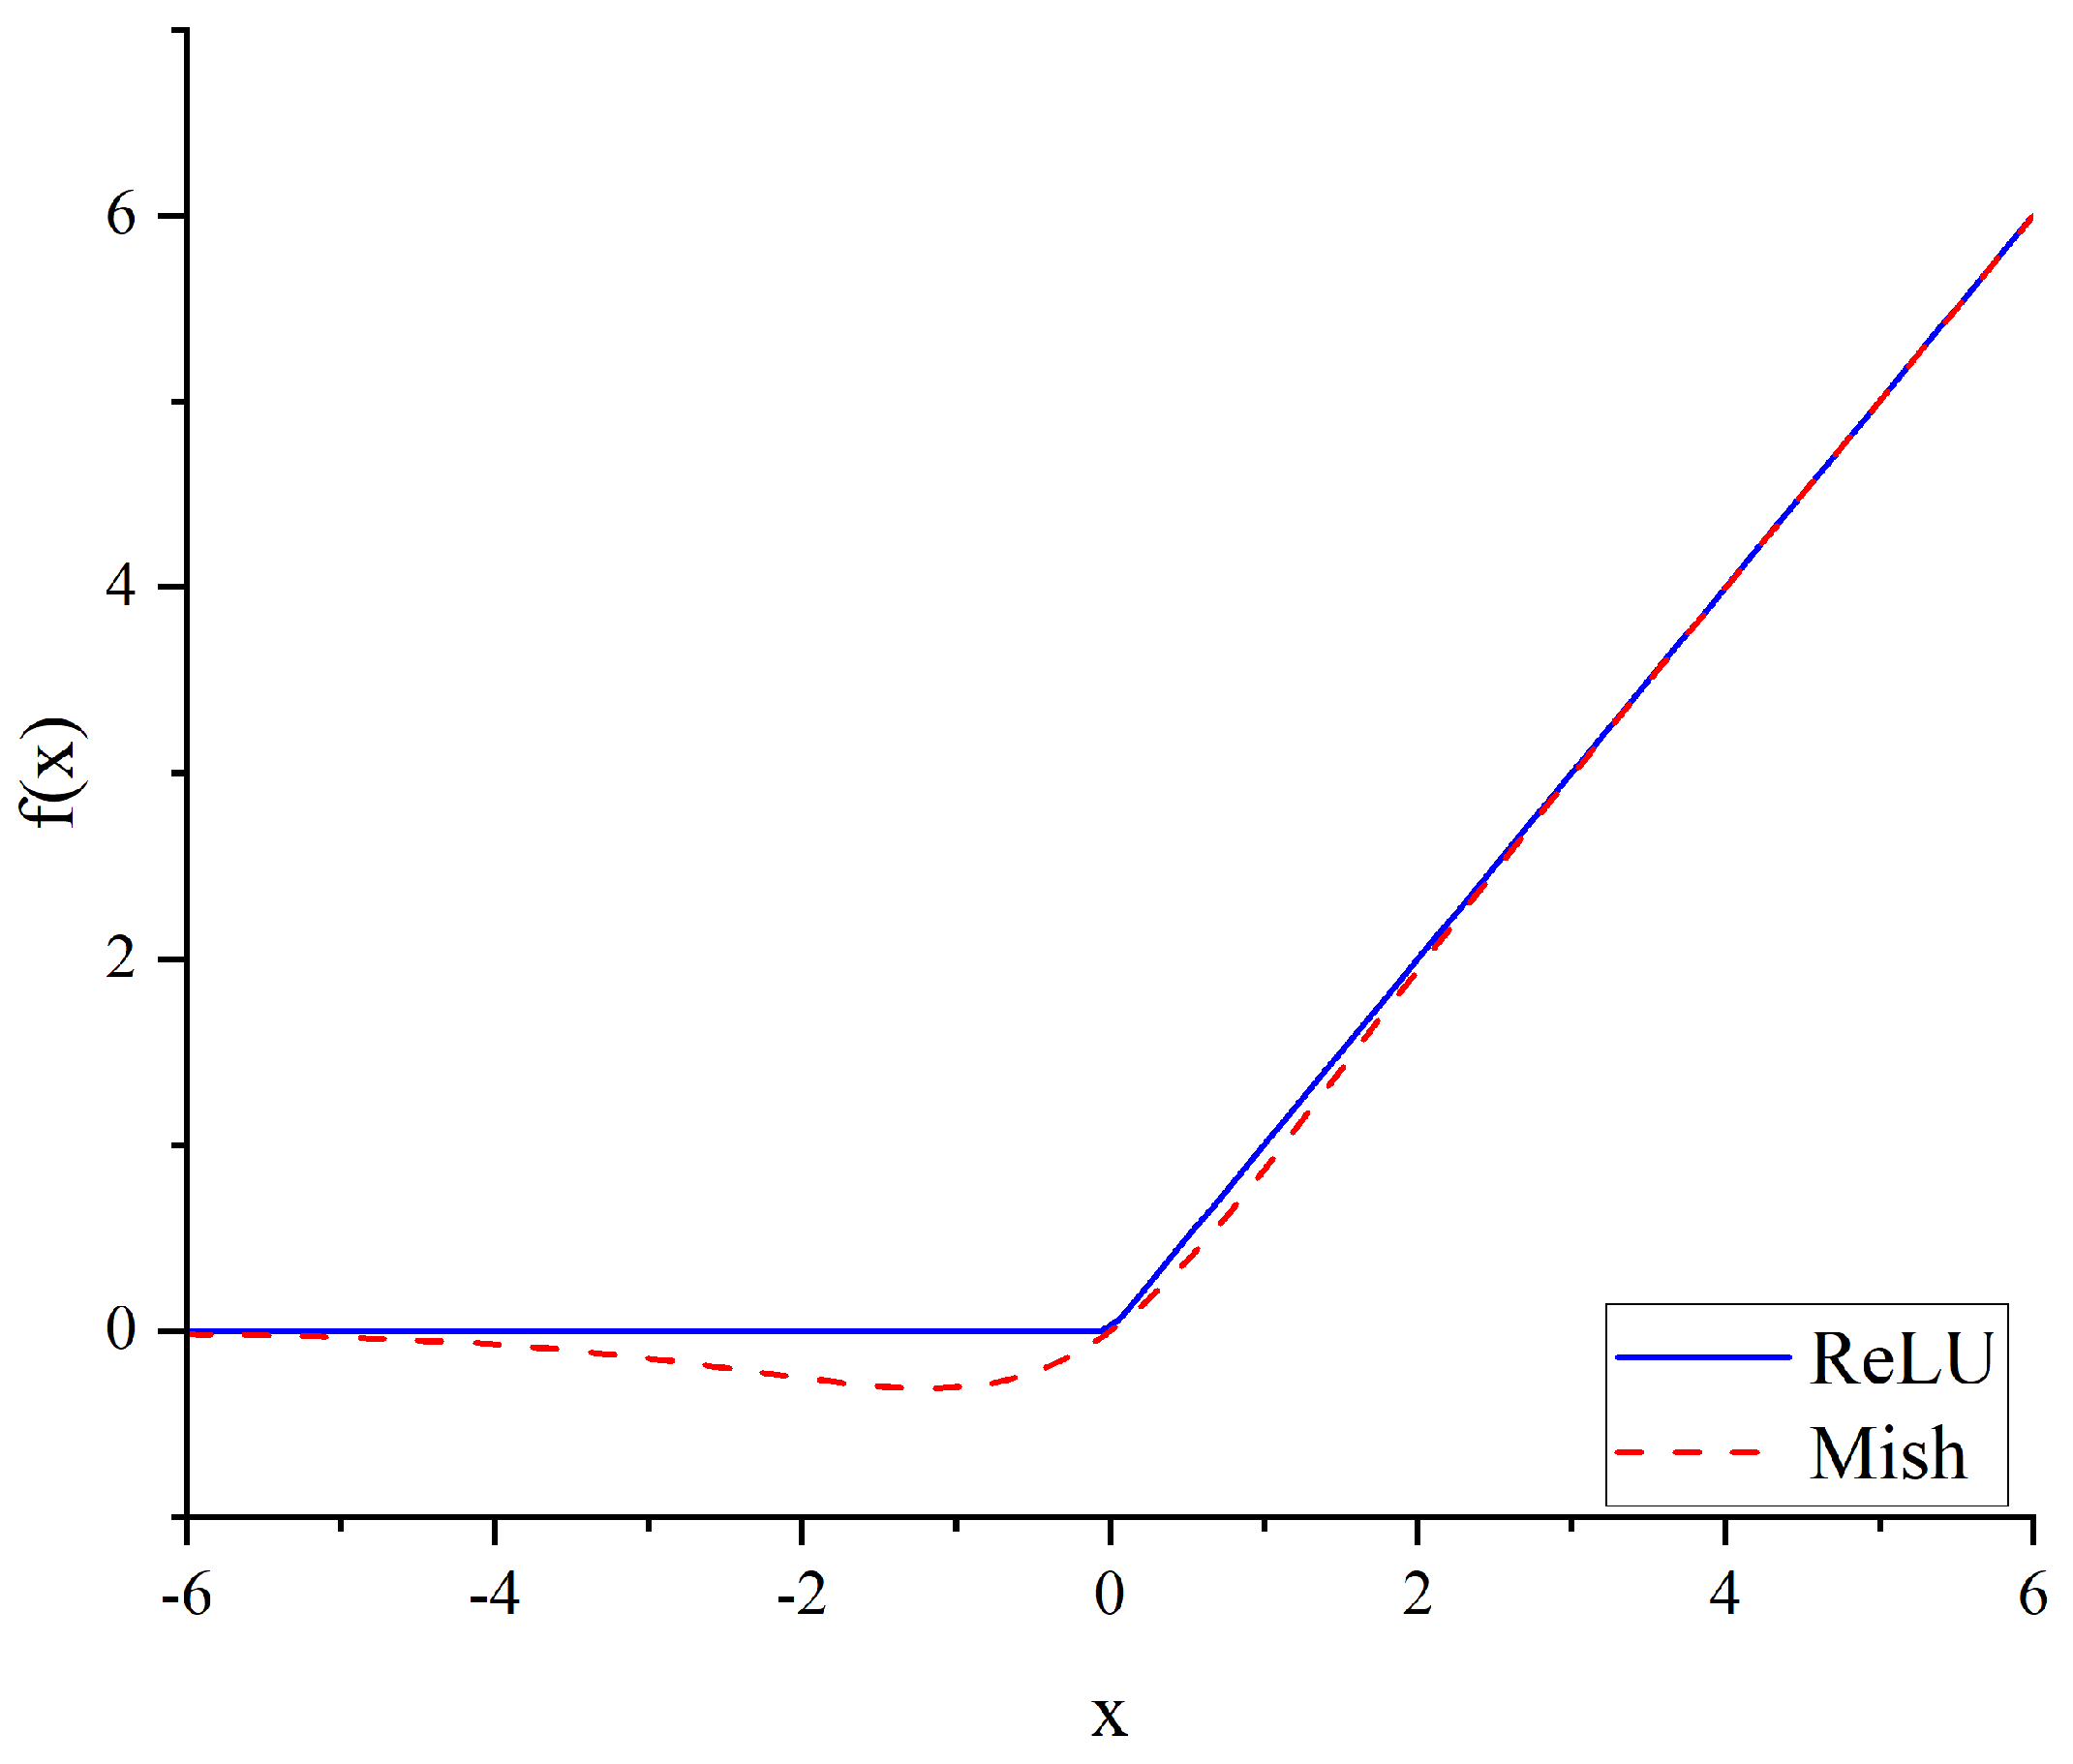
We incorporate the GSConv and C3Ghost modules into the neck network to reduce the model size. Additionally, the EIOU loss function and Mish activation function are utilized to optimize detection speed and accuracy.
(4)
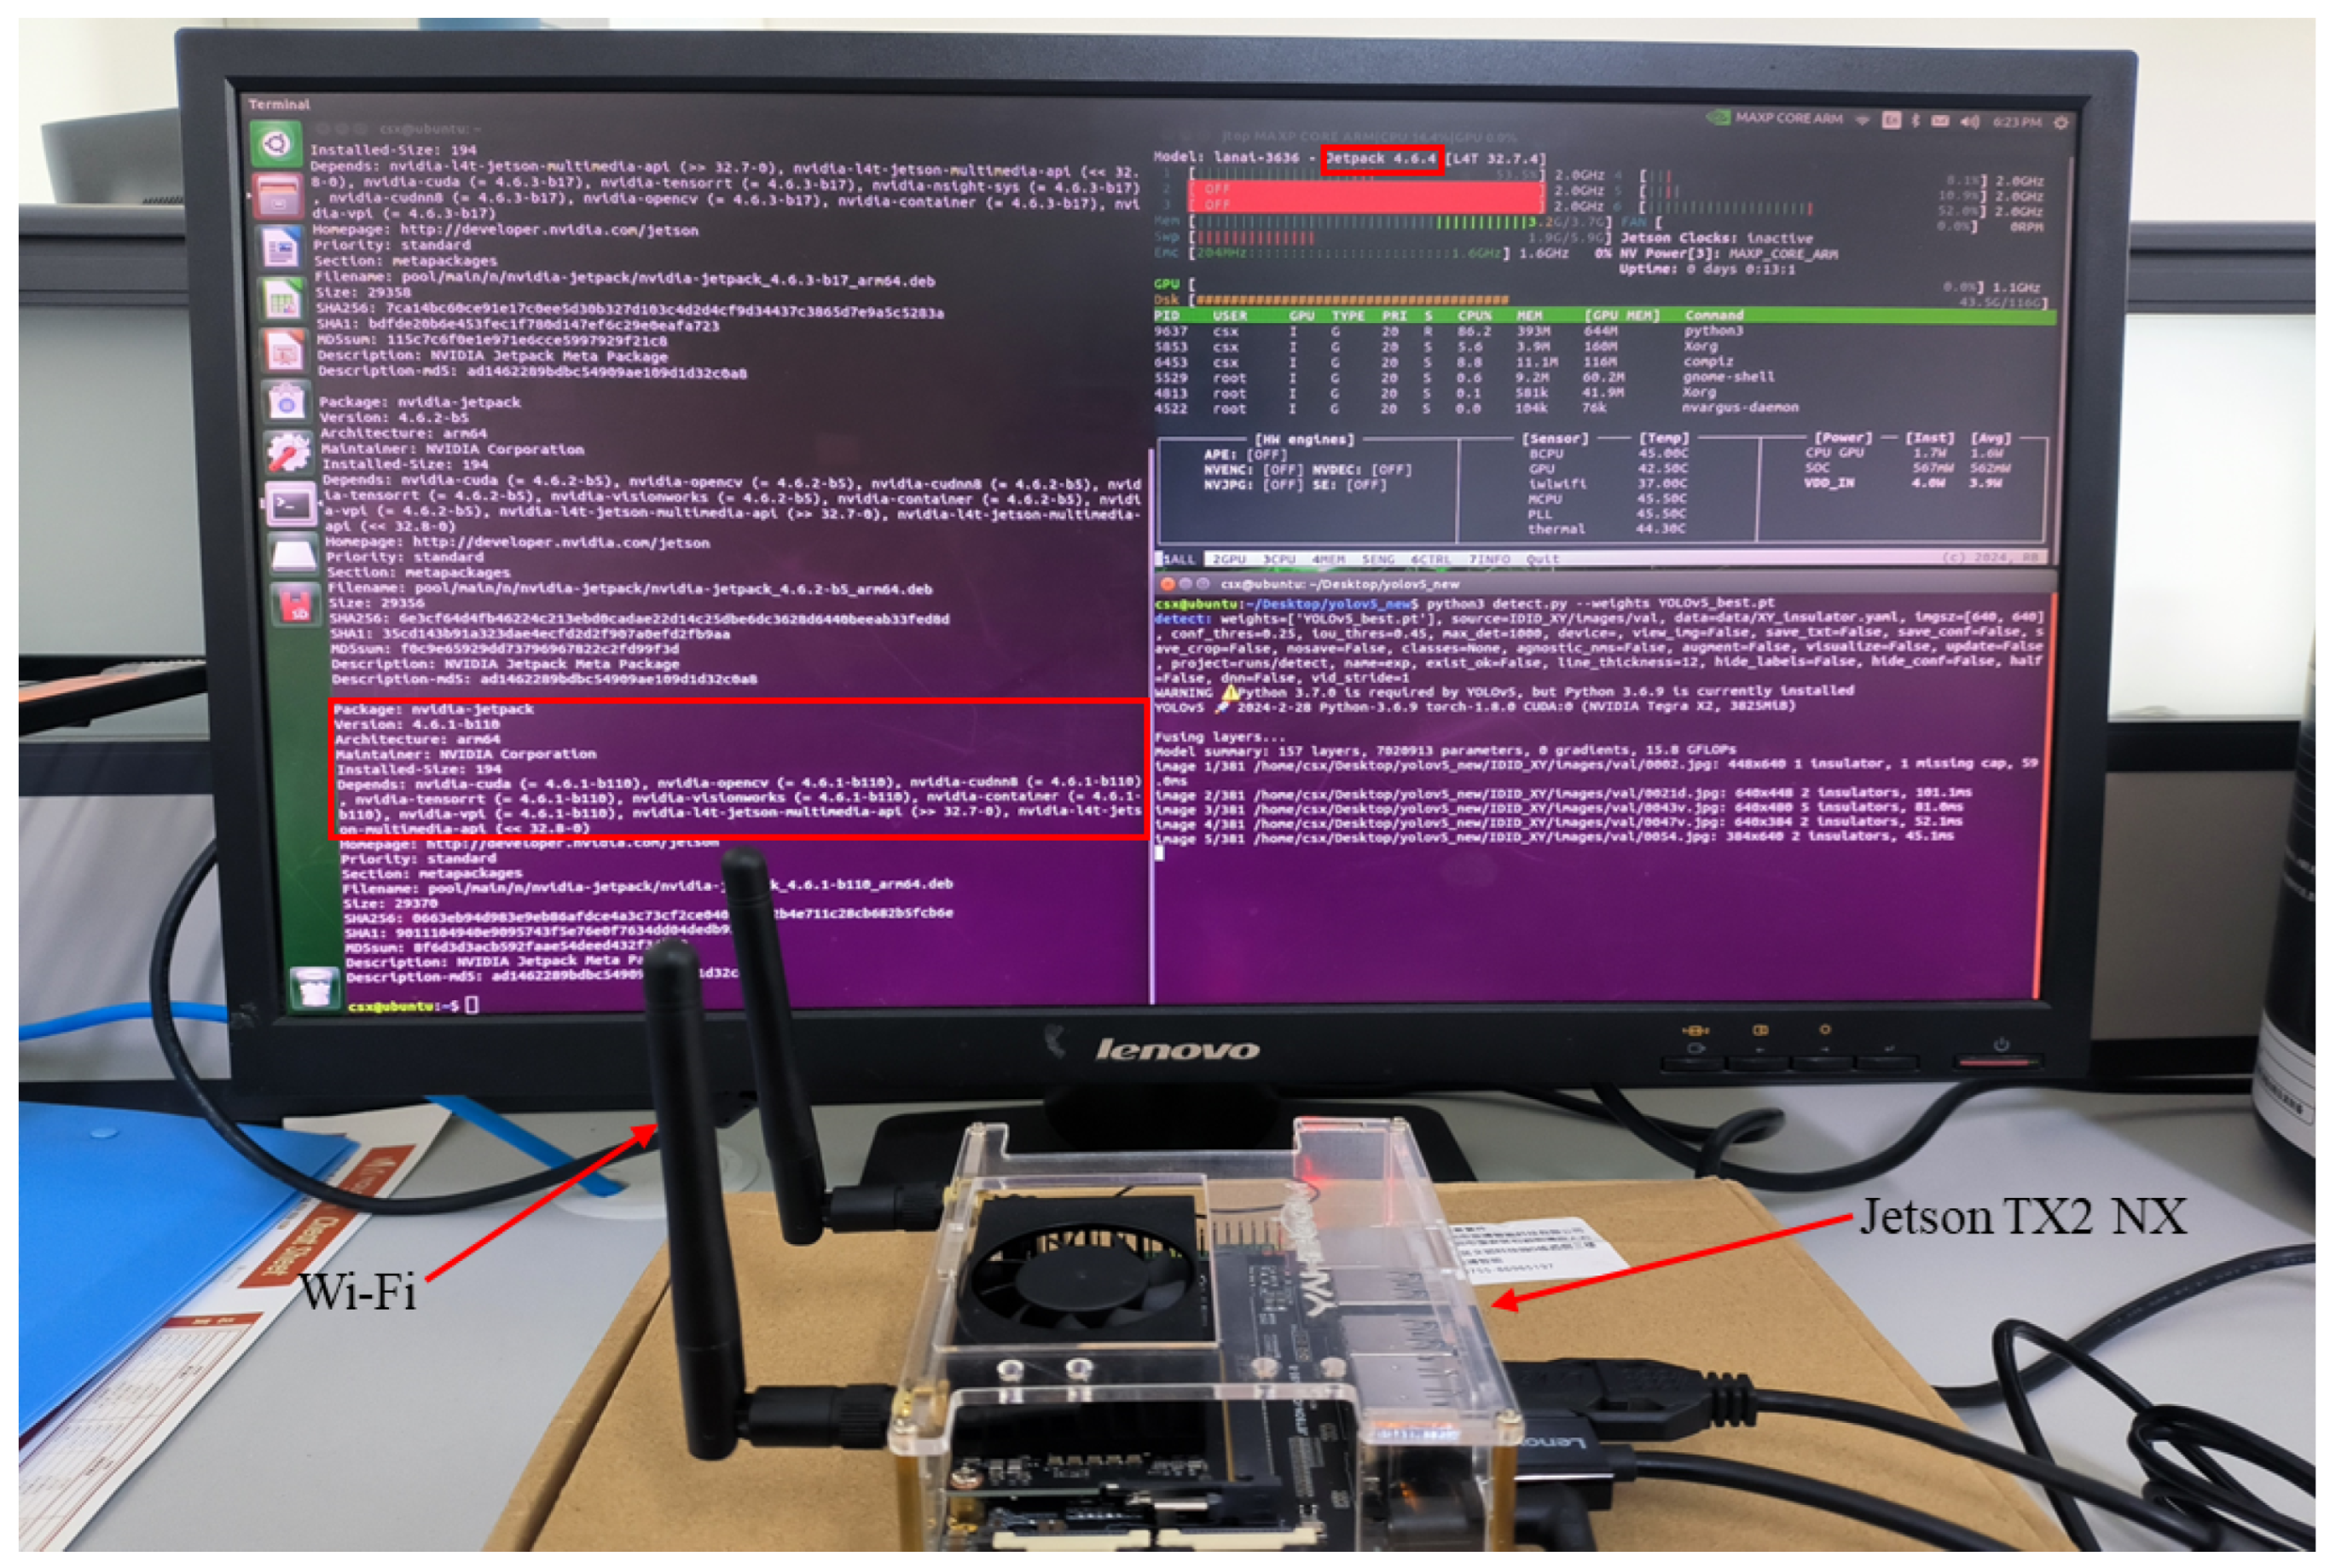
We use TensorRT to compress and accelerate the IDD-YOLO model and successfully deploy it on the embedded device Jetson TX2 NX to verify the model’s feasibility in practical application scenarios.
The remaining structure of this paper is as follows: Section 2 briefly reviews the literature related to insulator inspection. Section 3 details the detection model we propose and its related components. Section 4 first introduces the dataset we established and then describes the experimental comparisons conducted to validate the effectiveness of the model. Section 5 provides a detailed analysis of the advantages and disadvantages of the IDD-YOLO model, and it discusses possible directions for future research. Section 6 offers a comprehensive summary of this paper. The code and dataset can be obtained through the following link: https://github.com/LuYang-2023/Insulator-Defect-Detection-YOLO.git (accessed on 17 July 2024).

2. Related Work

The initial insulator defect detection algorithms employed methods based on traditional image processing to extract features of insulators. Wu et al. [7] proposed an insulator image segmentation algorithm that successfully segmented insulator images by maximizing the difference in semi-local texture distribution between the inside and outside areas, thereby enabling faster recognition and locating faults on the insulators. Han et al. [8] first preprocessed aerial images of insulators using properties such as slope and intercept, and then used the Deformable Part Model (DPM) to locate the position of the insulators, and finally employed a periodic local estimation method to analyze texture features to determine whether the insulators had defects. Oberweger et al. [9] initially detected insulators against complex backgrounds using local feature gradients and clustering methods, and then used the Local Outlier Factor (LOF) algorithm to assign defect scores to each insulator extracted by the automatic segmentation algorithm, and finally assessed whether the insulators had faults. Although the use of traditional image processing techniques has improved the efficiency of workers, this detection method requires manual design and is only suitable for specific situations. Its robustness is poor, making it difficult to meet the practical needs of insulator defect detection.
Over the past decade, with the continuous improvement of deep learning theories and ongoing innovations in object detection algorithms, using deep learning methods for insulator defect detection has become a mainstream trend.
Currently, object detection algorithms are mainly divided into two categories based on their detection stages. One category is the two-stage object detection algorithms, with notable representatives including R-CNN [10], Fast-RCNN [11], Faster-RCNN [12], and Mask R-CNN [13]. Wen et al. [14] proposed two insulator detection algorithms based on Faster R-CNN, namely, Exact R-CNN and CME-CNN, which eliminate the complex background of the generated mask images and improve detection accuracy. Lei et al. [15] proposed a convolutional neural network based on Faster R-CNN that transforms the classification problem into a detection problem, effectively detecting insulators and bird nests. Tan et al. [16] performed a pixel-level segmentation of insulators using Mask R-CNN and achieved high-accuracy insulator defect detection through multi-feature fusion and clustering analysis. Zhao et al. [17] optimized the Faster R-CNN model using the FPN architecture and made improvements in image segmentation. Ultimately, by introducing techniques of rotation and projection, they achieved efficient detection of insulator defects.
Another category is one-stage object detection algorithms, and in the field of insulator defect detection, the YOLO series algorithms [18,19,20,21,22,23,24,25,26] are currently widely used. Hao et al. [27] proposed a new backbone network, CSP-ResNeSt, based on the YOLOv4 detection model, which enhances the network’s feature extraction capability. Additionally, they introduced the Bi-FPN and SimAM attention mechanisms in the neck network, achieving efficient feature fusion. Qu et al. [28] successfully reduced model parameters by designing a lightweight feature pyramid network and a lightweight head network, allowing for deployment on edge devices and achieving real-time insulator defect detection. Zhang et al. [29], based on YOLOv5s, proposed BS-YOLOv5s, a novel insulator defect detection model, which combines a 3-D attention mechanism with a Bi-Slim-neck neck network, and constructed an insulator defect dataset WI, achieving a detection accuracy of 90.1% on this dataset. Chen et al. [30], based on the YOLOv5 model, introduced the Attention Feedback (AF) module to enhance the attention capability for discriminative features and proposed the Double Spatial Pyramid (DSP) module to utilize important features in the background image. Song et al. [31] replaced Concat with Adaptively Spatial Feature Fusion (ASFF) for feature fusion in the neck network of YOLOX, introduced the VariFocal Loss and Efficient Channel Attention (ECA) attention mechanism to improve detection accuracy, and used GhostNet to reduce model parameters, ultimately achieving an 85.7% insulator detection accuracy. Zhang et al. [32] optimized the synthetic fog algorithm to construct the SFID insulator defect dataset and established a benchmark detection model to address the issue of insufficient sample size. Bao et al. [33] utilized BiFPN for feature fusion and added the Coordinate Attention (CA) mechanism to further improve model accuracy, achieving an 89.1% accuracy in insulator defect detection. Zhang et al. [34], based on the YOLO architecture, introduced Ghost modules and the Convolutional Block Attention Module (CBAM) attention mechanism while adding a small object detection layer, thereby optimizing model performance to achieve an insulator defect detection accuracy of 99.4%. Sun et al. [35] proposed ID-Det, a novel insulator defect detection model, and introduced the Insulator Clipping Module (ICM), significantly enhancing model performance with a detection accuracy of 97.38%. Ding et al. [36] based their work on YOLOv5s, introducing GhostConv and the CA attention mechanism and incorporated EVCBlock into the neck network to enhance model performance. Luo et al. [37] designed an adaptive anchor box extraction algorithm to more effectively detect defective insulators. Huang et al. [38] proposed an algorithm that integrates knowledge distillation to streamline the insulator detection model. Li et al. [39] combined YOLOX with the Hybrid Attention Module HAM-CSP and R-BiFPN, improving the accuracy of insulator detection, and enhanced the model’s generalizability by using deep separable convolutions and a hybrid attention mechanism (DHConv). Li et al. [40] designed EGC, a lightweight convolution module, which reduced the model’s parameter count, and based on the EGC module, they constructed a lightweight backbone network and neck network, further alleviating the model’s burden, making it suitable for insulator defect detection on resource-constrained devices. Feng et al. [41] constructed the RSIn-Dataset for insulator defect data and made improvements based on YOLOv4, proposing the benchmark model YOLOv4++ and achieving an insulator detection accuracy of 94.24%.
Table 1 provides a comparative analysis of the insulator defect detection models in related works, highlighting their detection accuracy, advantages, and disadvantages.
Most two-stage detection models fail to meet the real-time detection needs in practical engineering and often occupy excessive memory during deployment. In contrast, one-stage detection models can support real-time detection, but their recognition accuracy still needs further improvement. Therefore, this paper proposes the IDD-YOLO detection model, aiming to balance detection accuracy and the requirements for deployment on embedded devices.

3. Methods

This section begins with an introduction to the design of the IDD-YOLO detection algorithm, followed by a detailed explanation of the proposed LCSA attention mechanism. It concludes with a discussion on the lightweight components, loss functions, and activation functions.

3.1. IDD-YOLO Object Detection Algorithm

To meet the demand for real-time detection in engineering applications, reduce memory consumption during model deployment, and suit UAV devices to alleviate the manual burden of power line inspection, this paper proposes a lightweight insulator defect detection model named IDD-YOLO.
The backbone network of IDD-YOLO adopts GhostNet [42] as its main architecture. GhostNet reduces the number of convolutional kernels to half of the original by introducing the GhostModule, thereby reducing the parameter count. Additionally, it also employs a smaller width and depth, further reducing the parameter count, making it more suitable for embedded deployment. However, the Squeeze-and-Excitation (SE) attention mechanism in GhostNet focuses only on channel information without considering spatial information, which affects the model’s accuracy. Therefore, we designed a hybrid attention mechanism, LCSA, and combined it with GhostNet to extract feature information more effectively. The Spatial Pyramid Pooling-Fast (SPPF) structure in the backbone network enhances the model’s perception capability and detection performance by introducing a feature fusion module. Specifically, the input feature map undergoes pooling operations of varying sizes, followed by a convolution operation that merges the pooled results of different scales. The final output is a fused feature map. The key characteristic of the SPPF structure is its ability to adaptively merge feature information of different scales, ensuring effective feature extraction. While maintaining multi-scale fusion, it reduces computational complexity and further expands the algorithm’s receptive field.
The neck network of IDD-YOLO adopts the PANet architecture [43]. This structure cleverly integrates multi-scale semantic information efficiently by introducing top–down and bottom–up pathways, enabling the model to effectively handle objects of different scales in images. To achieve model lightweighting, we introduce two lightweight modules, GSConv [44] and C3Ghost. These modules enable IDD-YOLO to excel in real-time detection tasks.
For the head network of IDD-YOLO, we adopt the head architecture of YOLO. This module classifies each detection box to determine if it contains the target object and performs regression to obtain its precise position and size. Finally, non-maximum suppression is employed to retain the most representative boxes in the output bounding boxes, optimizing the detection results.
The architectural diagram of the model is shown in Figure 1, while Figure 2 displays the structural diagram of the relevant components of the IDD-YOLO model, in which GAP represents global average pooling, and the CBM module consists of a two-dimensional convolution, a batch normalization layer, and a Mish activation function.

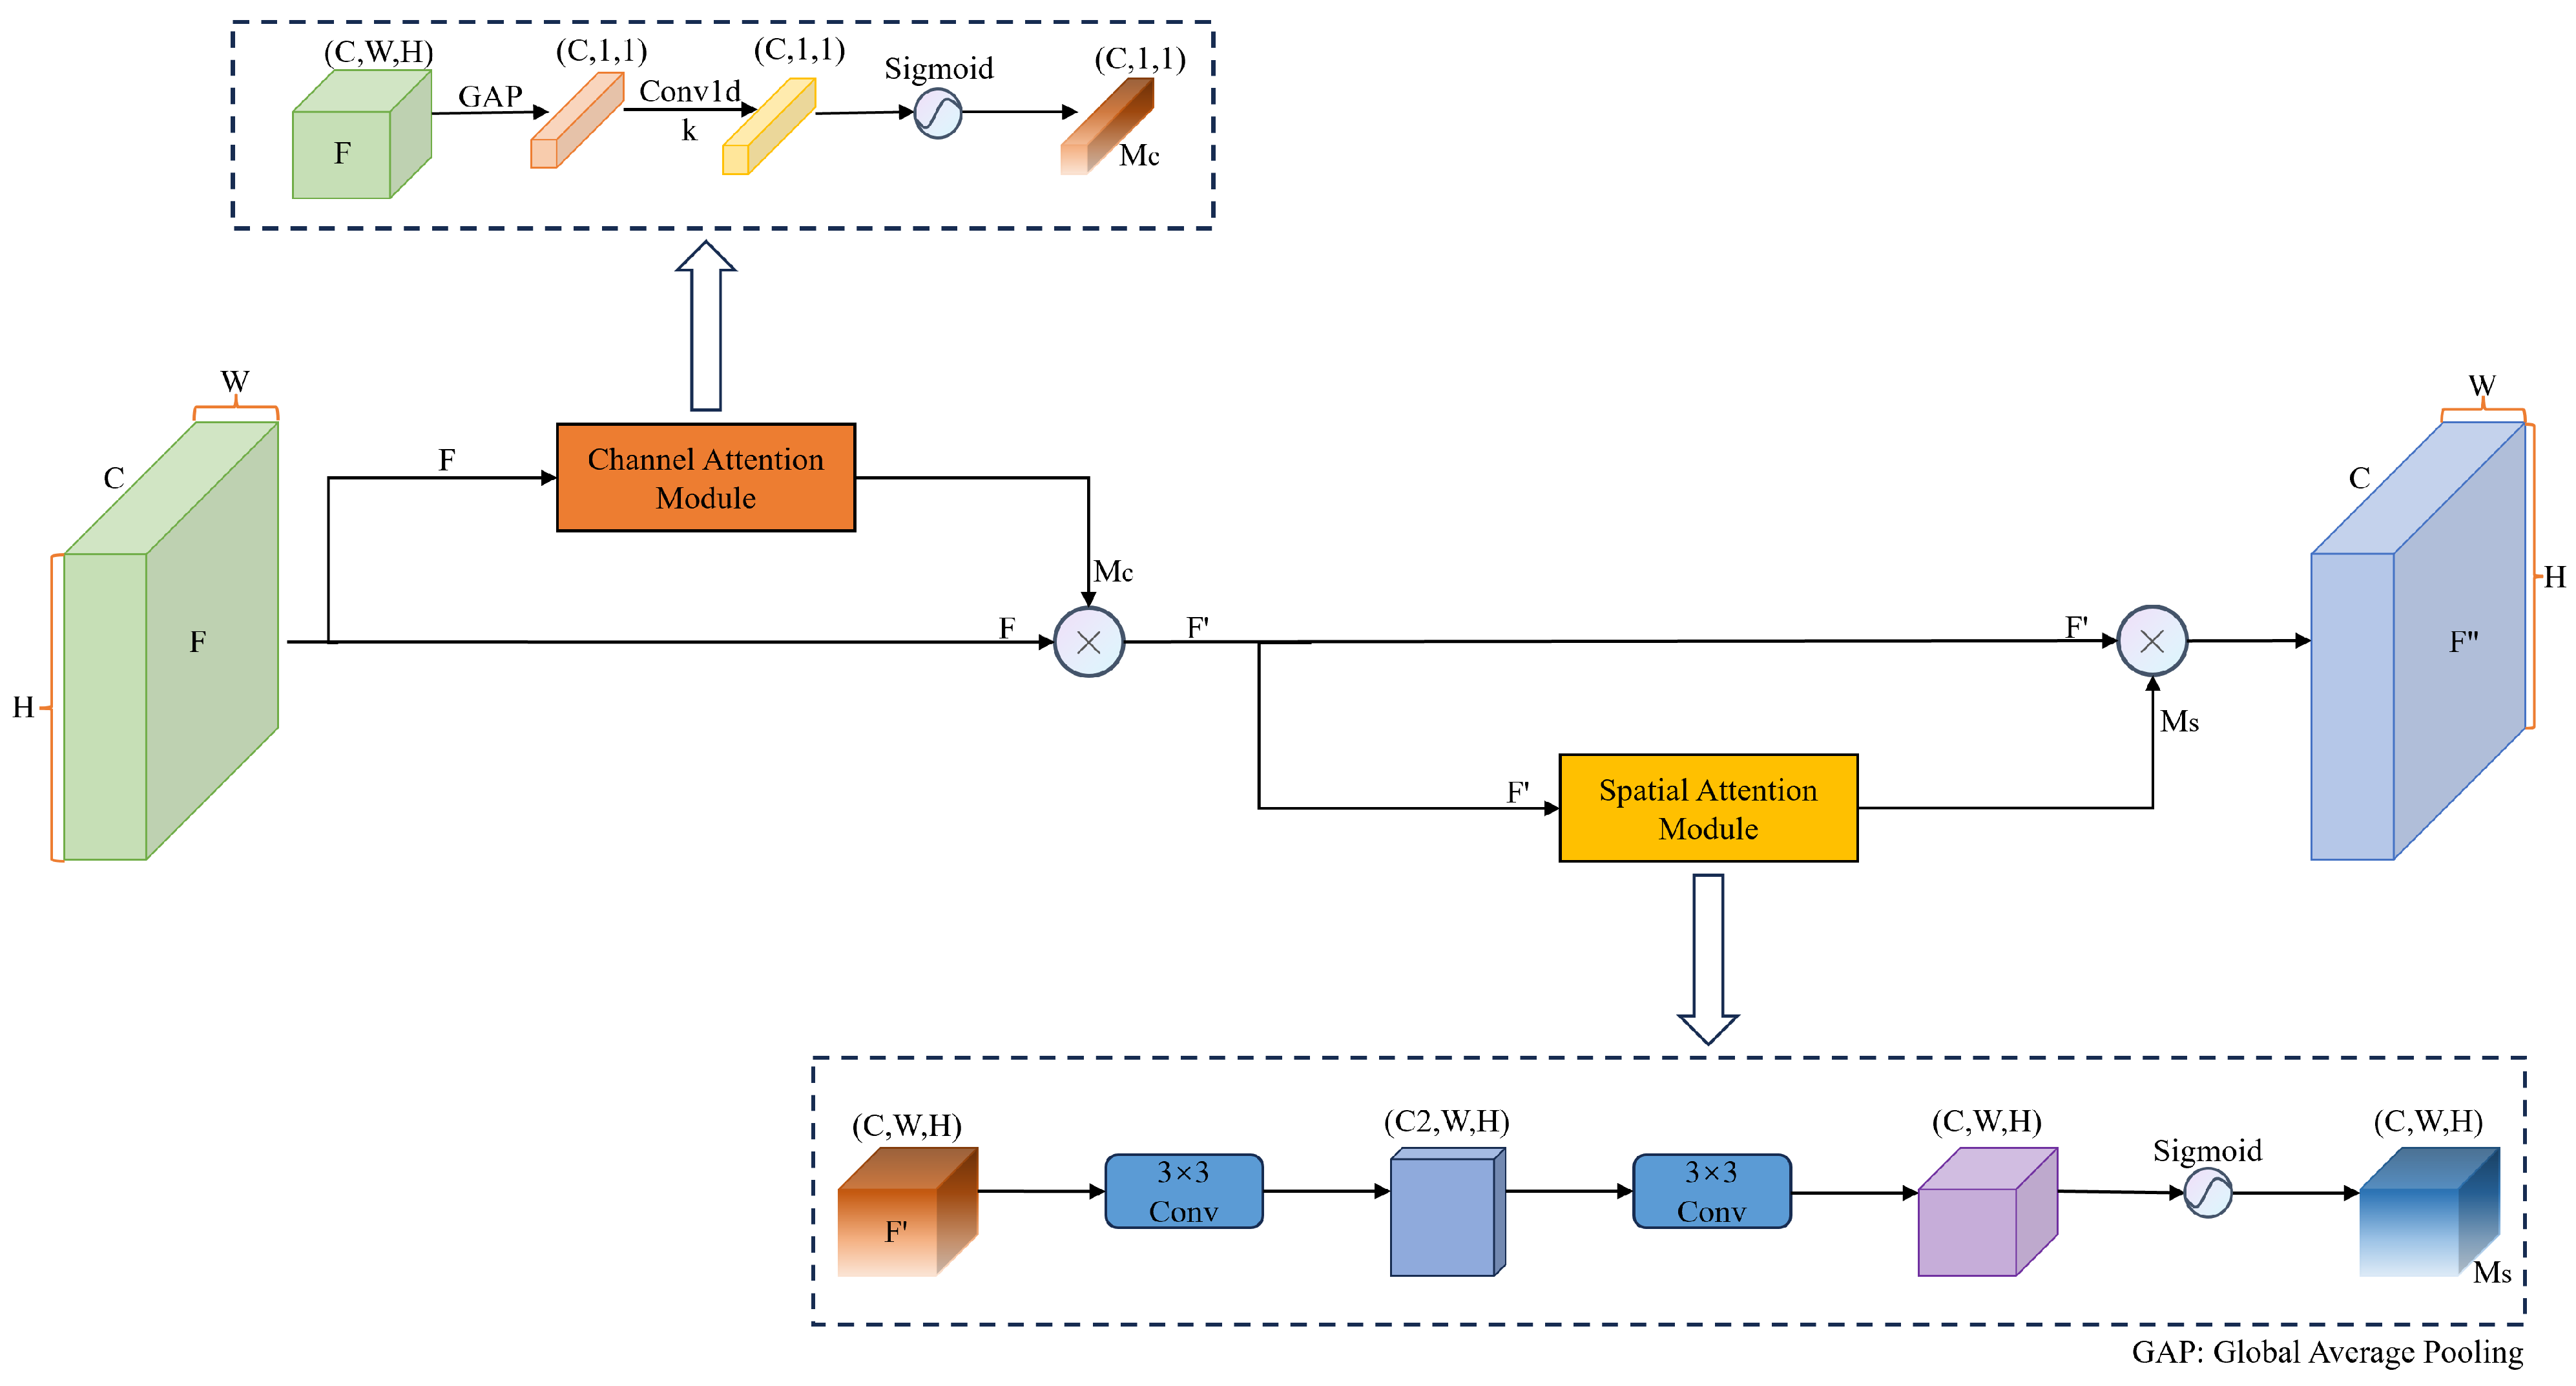
3.2. LCSA Attention Mechanism

Although hybrid attention mechanisms (such as CA [45], CBAM [46], etc.) consider both channel and spatial information, their large parameter size makes them unsuitable for lightweight detection models. Meanwhile, channel attention mechanisms (such as SE [47], ECA [48], etc.) have a smaller parameter size but focus only on channel information, overlooking spatial features, which leads to reduced model accuracy. In order to incorporate channel and spatial information without increasing model parameters, we adopt a serial strategy to integrate channel and spatial information. This not only prevents the accuracy decline caused by neglecting spatial information, but also reduces the model parameters by carefully selecting batch sizes and using small-scale convolution.
Figure 3 illustrates the fundamental principles of LCSA. First, global pooling is performed on the input feature map F to extract global information. Next, a one-dimensional convolution is used to achieve interaction between channels, and the results are mapped using the Sigmoid function to obtain the weights of each channel, M c . Finally, M c is multiplied by F to complete the channel attention process.
Mathematically, the process of extracting channel information using LCSA can be expressed as follows:
F = F M c M c = σ ( C o n v 1 d · ( G A P ( F ) ) ) F = F σ ( C o n v 1 d · ( G A P ( F ) ) )
where F represents the output after channel attention processing with LCSA. G A P denotes global average pooling, C o n v 1 d refers to one-dimensional convolution, and σ represents the Sigmoid activation function.
F processed through the channel attention mechanism first undergoes dimensionality reduction via the first two-dimensional convolution to decrease the number of output channels, thereby reducing computational complexity and model parameters. Next, a second two-dimensional convolution is used to achieve spatial information interaction, and the results are mapped using the Sigmoid function to generate spatial attention weights, M s . Finally, F is multiplied by M s to complete the spatial attention mechanism, resulting in the final output F .
Mathematically, the process by which LCSA acquires spatial information can be expressed as follows:
F = F M s M s = σ ( C o n v 2 d ( C o n v 2 d ( F ) ) ) F = F σ ( C o n v 2 d ( C o n v 2 d ( F ) ) )
where F represents the final output result, and C o n v 2 d denotes 2D convolution.
In summary, the mathematical expression of the LCSA attention mechanism is:
F = F σ ( C o n v 1 d · ( G A P ( F ) ) ) F = F σ ( C o n v 2 d ( C o n v 2 d ( F ) ) )

3.3. GSConv Module

The GSConv module [44] is a lightweight design that cleverly combines depth-wise separable convolution and regular convolution to reduce model complexity while ensuring detection accuracy. The structural diagram of the GSConv module is shown in Figure 4. Firstly, it undergoes ordinary convolution to reduce the input channel number from C 1 to half of the output channel number, C 2 . Subsequently, a deep separable convolution is applied to process the output feature map F 1 , yielding the feature map F 2 . F 1 is then concatenated with F 2 and subjected to shuffle operations [49,50] to enhance the model’s performance and generalization. Through this design, the GSConv module effectively simplifies the model structure while maintaining accuracy.

3.4. C3Ghost Module

C3 is a convolutional module specifically designed for extracting information of different scales and semantics. However, due to the significant redundancy in the C3 module, it is not suitable for lightweight models. Since the main parameters of the C3 module are concentrated in the BottleNeck, we choose to replace the original BottleNeck with a lightweight GhostBottleneck, forming the C3Ghost, which effectively reduces the model’s parameter count. The structural diagram of the C3Ghost module is shown in Figure 5.

3.5. EIOU Loss Function

Since insulator defects typically exhibit irregular shapes and are small targets, this has a certain impact on the model’s detection effectiveness. Therefore, we chose to utilize EIOU [51] for calculating bounding box losses to enhance the model’s accuracy. EIOU is an improvement on CIOU [52], achieving faster convergence and a higher regression accuracy by separately considering the influence factors of aspect ratios. The calculation formula for EIOU is as follows:
E I O U = I O U ( ρ 2 ( b , b g t ) c 2 + ρ 2 ( w , w g t ) c w 2 + ρ 2 ( h , h g t ) c h 2 )
In this formula, b, w, and h represent the predicted box’s center point, width, and height, respectively. b g t , h g t , and w g t represent the ground truth box’s center point, width, and height, respectively. ρ 2 ( b , b g t ) , ρ 2 ( w , w g t ) , and ρ 2 ( h , h g t ) denote the Euclidean distances between the predicted and ground truth boxes’ center points, widths, and heights, respectively. c, c w , and c h represent the diagonal distance, width, and height of the smallest enclosing box that contains both the predicted and ground truth boxes.
When EIOU is used as the loss function, the calculation formula is as follows:
L E I O U = 1 E I O U

3.6. Mish Activation Function

Activation functions, by introducing nonlinear elements, have significantly enhanced the expressive and learning capabilities of neural networks and have become a core component of neural network architecture. Compared to ReLU [53], the Mish activation function [54] is smoother, without sharp breakpoints. This smoothness helps optimize the flow of gradients during the training process. It is worth mentioning that, like ReLU, the Mish activation function also exhibits unbounded characteristics on the positive side, which helps in preventing the problem of vanishing gradients during training. Therefore, this study used Mish as the activation function under study. The expression for the Mish activation function is shown in Equation (6). Figure 6 presents a comparison of the ReLU and Mish activation functions, illustrating that the Mish function is smooth, is non-monotonic, is unbounded, and has a lower bound.
M i s h ( x ) = x t a n h ( l n ( 1 + e x ) )

4. Experiments

This section first introduces the creation process of the ID-2024 dataset, and then it elaborates on the evaluation metrics and experimental settings; it further describes comparative experiments conducted with mainstream attention mechanisms and lightweight detection models. Additionally, the optimization and acceleration of the proposed model were implemented, and the model was deployed on an edge computing platform to verify its detection performance in practical environments. Finally, ablation experiments were conducted and the results analyzed.

4.1. Dataset

Due to the harsh geographical environment where insulators are located, acquiring images of their defects is quite difficult. Currently, the sample size of open-source insulator defect datasets is limited, and the types of defects are singular, which does not meet the actual needs of insulator defect detection. Therefore, this study utilized a portable DJI Mini 2 SE model drone to capture images of insulator defects and combined these with related images collected online to establish a dataset. By processing these images through rotation, the dataset was effectively expanded. The actual image scenes collected are shown in Figure 7.
In order to simulate the light mist conditions that drones may encounter during inspection missions, we employed an atmospheric scattering model [55,56] for fog data augmentation. The mathematical expression of this model is as follows:
I ( x ) = J ( x ) t ( x ) + A ( 1 t ( x ) )
In the equations provided, I ( x ) represents the foggy image, J ( x ) represents the clear image, t ( x ) denotes the atmospheric transmittance, and A ( 1 t ( x ) ) indicates the atmospheric light intensity. The atmospheric transmittance t ( x ) is defined as follows:
t ( x ) = e β d ( x )
In the equation, β represents the atmospheric scattering coefficient, and d ( x ) denotes the scene depth.
Considering that a single fogging algorithm may not provide sufficient generalization for the dataset, we also employed Gaussian noise to generate fog layers overlaying the images, thus implementing a second type of fogging treatment. Ultimately, we successfully collected 4077 insulator images, completing the construction of the ID-2024 dataset. This dataset includes 3696 images in the training set, used for model training and parameter optimization; the validation set contains 381 images, mainly used to evaluate model performance; and the test set, provided by a power company in Jinghai District, Tianjin, consists of 150 images specifically used for the final testing of the model. Figure 8 presents some examples of insulator images, and the label information for ID-2024 is shown in Table 2.

4.2. Experimental Setup

We conducted experiments on an experimental platform equipped with an Intel(R) Core(TM) i9-10900K processor and an Nvidia Geforce RTX 3090 graphics card. The software environment included CUDA 11.8 and Python 3.8.5, with Pytorch chosen as the experimental framework. To ensure the fairness of the experimental comparisons, we used the same hyperparameter configuration and data augmentation for all experiments. Specifically, we employed the Adam optimizer for training, set the batch size to 16, initialized the learning rate to 0.001, set the number of epochs to 300, and used Mosaic data augmentation.

4.3. Evaluation Metrics

To measure model complexity, this study used Parameters and FLOPs as evaluation metrics for spatial and temporal complexity. To assess detection performance, the algorithm uses mAP as the evaluation standard. mAP is determined by Recall and Precision, serving as an intuitive metric for measuring the quality of the model’s algorithm across different categories. The expressions for Recall and Precision are as follows:
R e c a l l = T P T P + F N
P r e c i s i o n = T P T P + F P
In this formula, T P , F P , and F N , respectively, refer to the number of true positives, false positives, and false negatives identified by the model. The Precision–Recall curve is plotted with recall on the horizontal axis and the maximum precision value corresponding to each recall level on the vertical axis. The AP value is obtained by integrating the area under the curve. The mAP is calculated by summing and averaging the AP values.

4.4. Comparative Experiments with Mainstream Attention Mechanisms

Table 3 provides a detailed comparison of mAP, parameters, Recall, Precision, and FLOPs after replacing LCSA with mainstream attention mechanisms. To ensure a fair comparison, we conducted all experiments using the same hyperparameters and configurations. As shown in Table 3, compared to the CA attention mechanism, LCSA only shows slight disadvantages in the FLOPs and Precision metrics, while all other evaluation metrics improved. Compared to the CBAM attention mechanism, LCSA outperforms across multiple precision evaluation metrics while reducing the parameter count by approximately 0.07 M, and its FLOPs are nearly identical to those of CBAM. Although the parameter quantity and FLOPs of LCSA are slightly higher than those of the ECA and SE attention mechanisms, the [email protected], Recall, [email protected]:0.95, and Precision metrics are significantly better than those of the ECA and SE attention mechanisms. This indicates that LCSA effectively controls the parameter quantity while improving model accuracy, achieving a good balance.
Figure 9 shows the experimental results of replacing LCSA with mainstream attention mechanisms on the ID-2024 dataset. To ensure a fair comparison, we used the same hyperparameters and configurations for all experiments. It is evident from Figure 9 that our proposed LCSA attention mechanism achieves faster convergence and higher accuracy compared to commonly used attention mechanisms such as CA, CBAM, ECA, and SE.
Figure 10 and Figure 11 display heatmaps of insulators with missing caps and damage generated using Grad-CAM [57] under different attention mechanisms. By observing these heatmaps, it is evident that LCSA performs exceptionally well on small target defects and focuses more on key regions compared to other attention mechanisms.

4.5. Comparison Experiment with Mainstream Lightweight Object Detection Algorithms

We conducted a comprehensive comparison between IDD-YOLO and the most commonly used lightweight detection algorithms on the ID-2024 dataset. To ensure a fair comparison, the hyperparameters and experimental configurations of each model were almost identical. The experimental results are shown in Table 4.
Table 4 shows that our proposed IDD-YOLO model outperforms YOLOv5s, YOLOv6n, YOLOv8n, BC-YOLO, GC-YOLO, and I-YOLOv5 across all evaluation metrics. Although IDD-YOLO has a slightly lower [email protected]:0.95 and Precision compared to YOLOv7-tiny, it surpasses in [email protected] and Recall by 3.3% and 3%, respectively. Meanwhile, its FLOPs and parameter count are reduced by 61.36% and 52.65% compared to YOLOv7-tiny. Compared to YOLOv8s, IDD-YOLO only experiences a 1.0% decrease in [email protected]:0.95 while achieving increases of 0.6%, 3.3%, and 3.7% in [email protected], Recall, and Precision, respectively. More importantly, in terms of FLOPs and parameter count, IDD-YOLO shows a reduction of 82.04% and 74.37%, respectively, compared to YOLOv8s. These results demonstrate the outstanding performance of the IDD-YOLO model in detection and its suitability for deployment on embedded devices.
Figure 12 displays the comparative experimental results of IDD-YOLO with various object detection models. It is evident from the figure that IDD-YOLO outperforms other object detection models in terms of performance.
Figure 13 displays the visualization of the IDD-YOLO detection results. From the figure, we can clearly see that IDD-YOLO is capable of effectively detecting various types of defects in insulators.

4.6. Experimentation on the SFID Dataset

To validate the generalization performance of the model, this study conducted comparative experiments using the SFID insulator defect dataset to evaluate the detection effectiveness of IDD-YOLO. The SFID dataset comprises 13,722 images of insulators, including 10,975 in the training set and 2747 in the validation set. It features two categories: normal insulators and cap-missing insulators. Some of our experimental results are referenced from [32], and the specific detection results are shown in Table 5.
From Table 5, it can be observed that IDD-YOLO achieves a detection accuracy of 99.4% on the SFID dataset, which is the highest among the six target detection algorithms, demonstrating the generalization capability and effectiveness of IDD-YOLO.

4.7. Acceleration and Deployment on Edge Platforms

To verify the detection speed of the models in practical applications, we deployed the YOLO series detection models and the recently released insulator defect detection models on the embedded device Jetson TX2 NX, and we conducted a comprehensive comparison with IDD-YOLO. Figure 14 shows the hardware configuration of the Jetson TX2 NX, which features an NVIDIA Pascal GPU. The environment setup includes Python 3.6.9, PyTorch 1.8.0, and CUDA 10.2. The CPU is a Carmel ARM v8.2, and the operating system is Ubuntu 18.04. The specific experimental comparison results are shown in Table 6.
From Table 6, it can be observed that IDD-YOLO achieves a real-time detection frame rate of 20.83, which essentially meets the requirements of real-time drone inspection. More importantly, IDD-YOLO has the smallest model parameter count, only 2.85 M.

4.8. Ablation Study

To verify the effectiveness of our proposed G-LCSA backbone network and G-PANet neck network components, we conducted ablation experiments. The results are shown in Table 7.
From Table 7, it can be observed that using only G-LCSA as the backbone network and only G-PANet as the neck network both lead to an improvement in model accuracy and a reduction in parameter count, further confirming the effectiveness of the modules proposed in our study. However, the accuracy actually decreased when using only the EIOU and the Mish. This may be because the original backbone network is not suitable for EIOU and Mish. When we select G-LCSA as the backbone network and combine it with EIOU and Mish, compared to the scenario where EIOU and Mish are not used, all metrics show improvement under the condition of unchanged parameters. On the other hand, when we choose G-PANet as the neck network and employ EIOU and Mish, compared to the scenario where EIOU and Mish are not used, with the parameters held constant, only [email protected] increased by 1%, while other metrics experienced a decline. This also indirectly demonstrates that the choice of activation and loss functions needs to be aligned with the architecture of the network. When both G-LCSA and G-PANet were used as the backbone and neck networks simultaneously, the [email protected], Recall, and [email protected]:0.95 increased by 4.7%, 2.6%, and 1.4%, respectively, with a significant reduction in parameter count and FLOPs. However, the Precision decreased by 3.2%. Finally, when G-LCSA and G-PANet were employed and EIOU and Mish were incorporated, all detection accuracy evaluation metrics significantly improved. More importantly, the model’s parameter count was reduced by 59.38% compared to the original.

5. Discussion

The IDD-YOLO algorithm proposed in this paper demonstrates significant performance advantages for the task of insulator defect detection based on unmanned aerial vehicles. With a lightweight network structure and innovative attention mechanisms, IDD-YOLO not only achieves high accuracy on the self-built ID-2024 dataset but also exhibits excellent generalization capabilities on the SFID dataset. This achievement showcases that IDD-YOLO meets high standards in both processing speed and accuracy, particularly in applications on embedded devices, fulfilling the requirements of real-time detection.
However, despite its excellent performance in many aspects, the IDD-YOLO model also has certain limitations. The datasets currently used primarily focus on images under clear weather conditions and do not fully cover actual application scenarios under complex or adverse weather conditions, which may limit the model’s performance in a broader environment. Additionally, although the model has been designed to be lightweight, it still requires further optimization for use on devices with more limited resources to adapt to stricter computational and storage conditions. Furthermore, while we utilize drones as image collection tools, the specific details of directly deploying the model onto drones, including issues such as battery life, power consumption, and device weight, have not yet been thoroughly explored.
To overcome these limitations and promote the practical development of the model, future research will focus on several key areas: first, the expansion of the dataset to include defect types in complex environments to enhance the model’s robustness and adaptability. Second, continued optimization of the algorithm to reduce model complexity while maintaining or improving detection accuracy. Additionally, further optimization for deployment on drone-embedded systems will be pursued, including controlling power consumption, efficiently utilizing hardware resources, and balancing weight and battery life. Lastly, we plan to conduct extensive testing in other areas, such as target recognition in underwater exploration, defect detection in industrial production, and detection of vehicles and pedestrians in traffic monitoring, to verify the adaptability of the IDD-YOLO model to different tasks.

6. Conclusions

To address the challenges of low accuracy in insulator defect detection models and difficulties in deploying on UAV embedded terminals, this paper introduces IDD-YOLO, a lightweight detection algorithm. By incorporating the innovative LCSA attention mechanism and an optimized GhostNet backbone, IDD-YOLO significantly enhances detection precision and efficiency. The LCSA mechanism focuses on both spatial and channel information, overcoming the limitations of traditional SE mechanisms that only concentrate on channel information and maintaining model lightness due to its low parameter count. Furthermore, the use of GSConv and C3Ghost modules allows for IDD-YOLO to retain a high performance while reducing parameters, making it viable for resource-constrained environments. The integration of EIOU loss and Mish activation functions further optimizes the model, improving stability and reliability in complex settings.
This study also constructed a multi-class insulator defect dataset named ID-2024. The training results on this dataset demonstrated that IDD-YOLO outperforms the mainstream YOLO series models and other insulator defect detection models released in recent years. The study also tested the model’s generalization ability on the SFID dataset, confirming the generalizability of IDD-YOLO. To meet the demands of practical applications, IDD-YOLO was optimized and successfully deployed on the Jetson TX2 NX platform, achieving a detection rate of 20.83 frames per second, which meets the real-time requirements of unmanned aerial vehicle inspections in actual scenarios.

Author Contributions

Conceptualization, D.L. (Dahua Li); Data curation, X.Y.; Formal analysis, D.L. (Dong Li) and X.Y.; Funding acquisition, D.L. (Dahua Li) and Q.G.; Methodology, Y.L. and X.L.; Project administration, D.L. (Dong Li) and Q.G.; Resources, D.L. (Dahua Li) and D.L. (Dong Li); Software, Y.L. and X.Y.; Supervision, D.L. (Dahua Li), X.L., and Q.G.; Writing—original draft, Y.L.; Writing—review and editing, Y.L., D.L. (Dahua Li), and X.L. All authors have read and agreed to the published version of the manuscript.

Funding

This research was funded by the National Natural Science Foundation of China (Grant No. 61502340) and the Natural Science Foundation of Tianjin Municipality (Grant No. 18JCQNJC01000).

Data Availability Statement

Acknowledgments

The author sincerely appreciates the diligent collaboration of all members in the laboratory and the valuable suggestions provided by the anonymous reviewers for this paper.

Conflicts of Interest

The authors declare no conflicts of interest.

References

  1. Liu, J.; Hu, M.; Dong, J.; Lu, X. Summary of insulator defect detection based on deep learning. Electr. Power Syst. Res. 2023, 224, 109688. [Google Scholar] [CrossRef]
  2. Liu, Y.; Liu, D.; Huang, X.; Li, C. Insulator defect detection with deep learning: A survey. IET Gener. Transm. Distrib. 2023, 17, 3541–3558. [Google Scholar] [CrossRef]
  3. Ahmed, M.F.; Mohanta, J.; Sanyal, A. Inspection and identification of transmission line insulator breakdown based on deep learning using aerial images. Electr. Power Syst. Res. 2022, 211, 108199. [Google Scholar] [CrossRef]
  4. Yang, Z.; Xu, Z.; Wang, Y. Bidirection-Fusion-YOLOv3: An Improved Method for Insulator Defect Detection Using UAV Image. IEEE Trans. Instrum. Meas. 2022, 71, 1–8. [Google Scholar] [CrossRef]
  5. Wu, J.; Jing, R.; Bai, Y.; Tian, Z.; Chen, W.; Zhang, S.; Richard Yu, F.; Leung, V.C.M. Small Insulator Defects Detection Based on Multiscale Feature Interaction Transformer for UAV-Assisted Power IoVT. IEEE Internet Things J. 2024, 11, 23410–23427. [Google Scholar] [CrossRef]
  6. Panigrahy, S.; Karmakar, S. Real-Time Condition Monitoring of Transmission Line Insulators Using the YOLO Object Detection Model With a UAV. IEEE Trans. Instrum. Meas. 2024, 73, 1–9. [Google Scholar] [CrossRef]
  7. Wu, Q.; An, J. An active contour model based on texture distribution for extracting inhomogeneous insulators from aerial images. IEEE Trans. Geosci. Remote Sens. 2013, 52, 3613–3626. [Google Scholar] [CrossRef]
  8. Han, Y.; Liu, Z.; Lee, D.; Liu, W.; Chen, J.; Han, Z. Computer vision–based automatic rod-insulator defect detection in high-speed railway catenary system. Int. J. Adv. Robot. Syst. 2018, 15, 1729881418773943. [Google Scholar] [CrossRef]
  9. Oberweger, M.; Wendel, A.; Bischof, H. Visual recognition and fault detection for power line insulators. In Proceedings of the 19th Computer Vision Winter Workshop, Krtiny, Czech Republic, 3–5 February 2014; pp. 1–8. [Google Scholar]
  10. Girshick, R.; Donahue, J.; Darrell, T.; Malik, J. Rich Feature Hierarchies for Accurate Object Detection and Semantic Segmentation. In Proceedings of the 2014 IEEE Conference on Computer Vision and Pattern Recognition (CVPR), Columbus, OH, USA, 23–28 June 2014; pp. 580–587. [Google Scholar] [CrossRef]
  11. Girshick, R. Fast R-CNN. In Proceedings of the 2015 IEEE International Conference on Computer Vision (ICCV), Santiago, Chile, 7–13 December 2015; pp. 1440–1448. [Google Scholar] [CrossRef]
  12. Ren, S.; He, K.; Girshick, R.; Sun, J. Faster R-CNN: Towards real-time object detection with region proposal networks. IEEE Trans. Pattern Anal. Mach. Intell. 2016, 39, 1137–1149. [Google Scholar] [CrossRef]
  13. He, K.; Gkioxari, G.; Dollár, P.; Girshick, R. Mask R-CNN. In Proceedings of the 2017 IEEE International Conference on Computer Vision (ICCV), Venice, Italy, 22–29 October 2017; pp. 2980–2988. [Google Scholar] [CrossRef]
  14. Wen, Q.; Luo, Z.; Chen, R.; Yang, Y.; Li, G. Deep learning approaches on defect detection in high resolution aerial images of insulators. Sensors 2021, 21, 1033. [Google Scholar] [CrossRef]
  15. Lei, X.; Sui, Z. Intelligent fault detection of high voltage line based on the Faster R-CNN. Measurement 2019, 138, 379–385. [Google Scholar] [CrossRef]
  16. Tan, P.; Li, X.f.; Ding, J.; Cui, Z.s.; Ma, J.e.; Sun, Y.l.; Huang, B.q.; Fang, Y.t. Mask R-CNN and multifeature clustering model for catenary insulator recognition and defect detection. J. Zhejiang Univ. Sci. A 2022, 23, 745–756. [Google Scholar] [CrossRef]
  17. Zhao, W.; Xu, M.; Cheng, X.; Zhao, Z. An insulator in transmission lines recognition and fault detection model based on improved faster RCNN. IEEE Trans. Instrum. Meas. 2021, 70, 1–8. [Google Scholar] [CrossRef]
  18. Redmon, J.; Divvala, S.; Girshick, R.; Farhadi, A. You Only Look Once: Unified, Real-Time Object Detection. In Proceedings of the 2016 IEEE Conference on Computer Vision and Pattern Recognition (CVPR), Las Vegas, NV, USA, 27–30 June 2016; pp. 779–788. [Google Scholar] [CrossRef]
  19. Redmon, J.; Farhadi, A. YOLO9000: Better, Faster, Stronger. In Proceedings of the 2017 IEEE Conference on Computer Vision and Pattern Recognition (CVPR), Honolulu, HI, USA, 21–26 July 2017; pp. 6517–6525. [Google Scholar] [CrossRef]
  20. Redmon, J.; Farhadi, A. Yolov3: An incremental improvement. arXiv 2018, arXiv:1804.02767. [Google Scholar] [CrossRef]
  21. Bochkovskiy, A.; Wang, C.Y.; Liao, H.Y.M. Yolov4: Optimal speed and accuracy of object detection. arXiv 2020, arXiv:2004.10934. [Google Scholar] [CrossRef]
  22. Jocher, G. YOLOv5 by Ultralytics; Zenodo: Geneva, Switzerland, 2020. [Google Scholar] [CrossRef]
  23. Ge, Z.; Liu, S.; Wang, F.; Li, Z.; Sun, J. Yolox: Exceeding yolo series in 2021. arXiv 2021, arXiv:2107.08430. [Google Scholar] [CrossRef]
  24. Li, C.; Li, L.; Jiang, H.; Weng, K.; Geng, Y.; Li, L.; Ke, Z.; Li, Q.; Cheng, M.; Nie, W.; et al. YOLOv6: A single-stage object detection framework for industrial applications. arXiv 2022, arXiv:2209.02976. [Google Scholar] [CrossRef]
  25. Wang, C.Y.; Bochkovskiy, A.; Liao, H.Y.M. YOLOv7: Trainable Bag-of-Freebies Sets New State-of-the-Art for Real-Time Object Detectors. In Proceedings of the 2023 IEEE/CVF Conference on Computer Vision and Pattern Recognition (CVPR), Vancouver, BC, Canada, 17–24 June 2023; pp. 7464–7475. [Google Scholar] [CrossRef]
  26. Jocher, G.; Chaurasia, A.; Qiu, J. Ultralytics YOLO. 2023. Available online: https://github.com/ultralytics/ultralytics (accessed on 17 July 2024).
  27. Hao, K.; Chen, G.; Zhao, L.; Li, Z.; Liu, Y.; Wang, C. An insulator defect detection model in aerial images based on multiscale feature pyramid network. IEEE Trans. Instrum. Meas. 2022, 71, 1–12. [Google Scholar] [CrossRef]
  28. Qu, F.; Lin, Y.; Tian, L.; Du, Q.; Wu, H.; Liao, W. Lightweight Oriented Detector for Insulators in Drone Aerial Images. Drones 2024, 8, 294. [Google Scholar] [CrossRef]
  29. Zhang, Z.; Lv, G.; Zhao, G.; Zhai, Y.; Cheng, J. BS-YOLOv5s: Insulator Defect Detection with Attention Mechanism and Multi-Scale Fusion. In Proceedings of the 2023 IEEE International Conference on Image Processing (ICIP), Kuala Lumpur, Malaysia, 8–11 October 2023; pp. 2365–2369. [Google Scholar] [CrossRef]
  30. Chen, J.; Fu, Z.; Cheng, X.; Wang, F. An method for power lines insulator defect detection with attention feedback and double spatial pyramid. Electr. Power Syst. Res. 2023, 218, 109175. [Google Scholar] [CrossRef]
  31. Song, Z.; Huang, X.; Ji, C.; Zhang, Y. Deformable YOLOX: Detection and rust warning method of transmission line connection fittings based on image processing technology. IEEE Trans. Instrum. Meas. 2023, 72, 1–21. [Google Scholar] [CrossRef]
  32. Zhang, Z.D.; Zhang, B.; Lan, Z.C.; Liu, H.C.; Li, D.Y.; Pei, L.; Yu, W.X. FINet: An insulator dataset and detection benchmark based on synthetic fog and improved YOLOv5. IEEE Trans. Instrum. Meas. 2022, 71, 1–8. [Google Scholar] [CrossRef]
  33. Bao, W.; Du, X.; Wang, N.; Yuan, M.; Yang, X. A defect detection method based on BC-YOLO for transmission line components in UAV remote sensing images. Remote Sens. 2022, 14, 5176. [Google Scholar] [CrossRef]
  34. Zhang, T.; Zhang, Y.; Xin, M.; Liao, J.; Xie, Q. A light-weight network for small insulator and defect detection using UAV imaging based on improved YOLOv5. Sensors 2023, 23, 5249. [Google Scholar] [CrossRef] [PubMed]
  35. Sun, S.; Chen, C.; Yang, B.; Yan, Z.; Wang, Z.; He, Y.; Wu, S.; Li, L.; Fu, J. ID-Det: Insulator Burst Defect Detection from UAV Inspection Imagery of Power Transmission Facilities. Drones 2024, 8, 299. [Google Scholar] [CrossRef]
  36. Ding, L.; Rao, Z.Q.; Ding, B.; Li, S.J. Research on defect detection method of railway transmission line insulators based on GC-YOLO. IEEE Access 2023, 11, 102635–102642. [Google Scholar] [CrossRef]
  37. Luo, B.; Xiao, J.; Zhu, G.; Fang, X.; Wang, J. Occluded Insulator Detection System Based on YOLOX of Multi-Scale Feature Fusion. IEEE Trans. Power Deliv. 2024, 39, 1063–1074. [Google Scholar] [CrossRef]
  38. Huang, X.; Jia, M.; Tai, X.; Wang, W.; Hu, Q.; Liu, D.; Guo, P.; Tian, S.; Yan, D.; Han, H. Federated knowledge distillation for enhanced insulator defect detection in resource-constrained environments. IET Comput. Vis. 2024. [Google Scholar] [CrossRef]
  39. Li, Y.; Feng, D.; Zhang, Q.; Li, S. HRD-YOLOX based insulator identification and defect detection method for transmission lines. IEEE Access 2024, 12, 22649–22661. [Google Scholar] [CrossRef]
  40. Li, D.; Lu, Y.; Gao, Q.; Li, X.; Yu, X.; Song, Y. LiteYOLO-ID: A Lightweight Object Detection Network for Insulator Defect Detection. IEEE Trans. Instrum. Meas. 2024, 73, 1–12. [Google Scholar] [CrossRef]
  41. Shuang, F.; Han, S.; Li, Y.; Lu, T. RSIn-Dataset: An UAV-Based Insulator Detection Aerial Images Dataset and Benchmark. Drones 2023, 7, 125. [Google Scholar] [CrossRef]
  42. Han, K.; Wang, Y.; Tian, Q.; Guo, J.; Xu, C.; Xu, C. GhostNet: More Features from Cheap Operations. In Proceedings of the 2020 IEEE/CVF Conference on Computer Vision and Pattern Recognition (CVPR), Seattle, WA, USA, 13–19 June 2020; pp. 1577–1586. [Google Scholar] [CrossRef]
  43. Liu, S.; Qi, L.; Qin, H.; Shi, J.; Jia, J. Path Aggregation Network for Instance Segmentation. In Proceedings of the 2018 IEEE/CVF Conference on Computer Vision and Pattern Recognition, Salt Lake City, UT, USA, 18–23 June 2018; pp. 8759–8768. [Google Scholar] [CrossRef]
  44. Li, H.; Li, J.; Wei, H.; Liu, Z.; Zhan, Z.; Ren, Q. Slim-neck by GSConv: A better design paradigm of detector architectures for autonomous vehicles. arXiv 2022, arXiv:2206.02424. [Google Scholar] [CrossRef]
  45. Hou, Q.; Zhou, D.; Feng, J. Coordinate Attention for Efficient Mobile Network Design. In Proceedings of the 2021 IEEE/CVF Conference on Computer Vision and Pattern Recognition (CVPR), Nashville, TN, USA, 20–25 June 2021; pp. 13708–13717. [Google Scholar] [CrossRef]
  46. Woo, S.; Park, J.; Lee, J.Y.; Kweon, I.S. CBAM: Convolutional block attention module. In Proceedings of the 2018 European Conference on Computer Vision (ECCV), Munich, Germany, 8–14 September 2018; pp. 3–19. [Google Scholar] [CrossRef]
  47. Hu, J.; Shen, L.; Sun, G. Squeeze-and-Excitation Networks. In Proceedings of the 2018 IEEE/CVF Conference on Computer Vision and Pattern Recognition(CVPR), Salt Lake City, UT, USA, 18–23 June 2018; pp. 7132–7141. [Google Scholar] [CrossRef]
  48. Wang, Q.; Wu, B.; Zhu, P.; Li, P.; Zuo, W.; Hu, Q. ECA-Net: Efficient Channel Attention for Deep Convolutional Neural Networks. In Proceedings of the 2020 IEEE/CVF Conference on Computer Vision and Pattern Recognition (CVPR), Seattle, WA, USA, 13–19 June 2020; pp. 11531–11539. [Google Scholar] [CrossRef]
  49. Zhang, X.; Zhou, X.; Lin, M.; Sun, J. ShuffleNet: An Extremely Efficient Convolutional Neural Network for Mobile Devices. In Proceedings of the 2018 IEEE/CVF Conference on Computer Vision and Pattern Recognition, Salt Lake City, UT, USA, 18–23 June 2018; pp. 6848–6856. [Google Scholar] [CrossRef]
  50. Ma, N.; Zhang, X.; Zheng, H.T.; Sun, J. Shufflenet v2: Practical guidelines for efficient cnn architecture design. In Proceedings of the 2018 European Conference on Computer Vision (ECCV), Munich, Germany, 8–14 September 2018; pp. 116–131. [Google Scholar] [CrossRef]
  51. Zhang, Y.F.; Ren, W.; Zhang, Z.; Jia, Z.; Wang, L.; Tan, T. Focal and efficient IOU loss for accurate bounding box regression. Neurocomputing 2022, 506, 146–157. [Google Scholar] [CrossRef]
  52. Zheng, Z.; Wang, P.; Ren, D.; Liu, W.; Ye, R.; Hu, Q.; Zuo, W. Enhancing geometric factors in model learning and inference for object detection and instance segmentation. IEEE Trans. Cybern. 2021, 52, 8574–8586. [Google Scholar] [CrossRef] [PubMed]
  53. Glorot, X.; Bordes, A.; Bengio, Y. Deep sparse rectifier neural networks. In Proceedings of the Fourteenth International Conference on Artificial Intelligence and Statistics, JMLR Workshop and Conference Proceedings, Fort Lauderdale, FL, USA, 11–13 April 2011; pp. 315–323. [Google Scholar]
  54. Misra, D. Mish: A self regularized non-monotonic activation function. arXiv 2019, arXiv:1908.08681. [Google Scholar] [CrossRef]
  55. McCartney, E.J. Optics of the atmosphere: Scattering by molecules and particles. Phys. Bull. 1976, 28, 521. [Google Scholar] [CrossRef]
  56. Narasimhan, S.G.; Nayar, S.K. Vision and the atmosphere. Int. J. Comput. Vis. 2002, 48, 233–254. [Google Scholar] [CrossRef]
  57. Selvaraju, R.R.; Cogswell, M.; Das, A.; Vedantam, R.; Parikh, D.; Batra, D. Grad-CAM: Visual Explanations from Deep Networks via Gradient-Based Localization. In Proceedings of the 2017 IEEE International Conference on Computer Vision (ICCV), Venice, Italy, 22–29 October 2017; pp. 618–626. [Google Scholar] [CrossRef]
  58. Liu, Z.; Lin, Y.; Cao, Y.; Hu, H.; Wei, Y.; Zhang, Z.; Lin, S.; Guo, B. Swin transformer: Hierarchical vision transformer using shifted windows. In Proceedings of the 2021 IEEE/CVF International Conference on Computer Vision (ICCV), Montreal, QC, Canada, 10–17 October 2021; pp. 9992–10002. [Google Scholar] [CrossRef]
Figure 1. IDD-YOLO network architecture diagram. The orange box in the rightmost image shows the detection result.
Drones 08 00431 g001
Figure 2. IDD-YOLO basic module structure diagram.
Drones 08 00431 g002
Figure 3. Schematic diagram of LCSA’s attention mechanism.
Drones 08 00431 g003
Figure 4. Structural diagram of the GSConv module.
Drones 08 00431 g004
Figure 5. Structural diagram of the C3Ghost module.
Drones 08 00431 g005
Figure 6. Comparison of ReLU and Mish functions.
Drones 08 00431 g006
Figure 7. Real-life scene of insulator defects captured by drone.
Drones 08 00431 g007
Figure 8. Images of insulators under different conditions: (a) missing cap; (b) after standard fogging algorithm; (c) after atmospheric scattering model fogging; (d) with flashover; (e) normal; (f) broken.
Drones 08 00431 g008
Figure 9. Experimental results comparison between LCSA and mainstream attention mechanisms.
Drones 08 00431 g009
Figure 10. Heatmap of insulator with missing cap.
Drones 08 00431 g010
Figure 11. Heatmap of insulator with damage.
Drones 08 00431 g011
Figure 12. Experimental results comparing IDD-YOLO with mainstream lightweight detection models.
Drones 08 00431 g012
Figure 13. IDD-YOLO detection results. (a) Insulator flashover detection results. (b) Insulator damage detection results. (c) Detection results of normal insulators. (d) Detection results of insulators with missing caps.
Drones 08 00431 g013
Figure 14. Jetson TX2 NX experimental platform and actual detection output.
Drones 08 00431 g014
Table 1. Comparative performance analysis of insulator defect detection models.
ModelsDetection AccuracyAdvantagesDisadvantages
[7]Achieved a precision of 85.95% on a self-built insulator datasetStrong quantitative validationComplex implementation
[8]Achieved a recall rate of 98.97% on a self-built datasetHigh detection accuracySensitivity to initial conditions
[9]Achieved a maximum recall rate of 98% on a self-built datasetHigh performance metricsManual ground truth creation
[15]Achieved a 97.6% average precision (AP) on a self-built test set of 112 imagesEfficient use of pretrained modelsSlow inference speed
[16]Achieved 92.5% accuracy on a self-built datasetHigh model accuracyComplex real-world deployment, high computational resource demand
[17]Achieved a mean Average Precision (mAP) of 90.8% on a self-built datasetHigh detection accuracyRequires significant computational resources, risk of overfitting
[27]Achieved a mAP of 95.63% on the CPLMID datasetHigh accuracy and speedComplex model structure, difficult to deploy in practice
[28]Achieved an AP of 62.48% on a self-built datasetEfficient on edge devices, high detection speedHighly dependent on data quality, slightly lower detection accuracy
[29]Achieved a mAP of 90.1% on the WI datasetHigh model accuracyComplex real-world deployment
[30]Achieved a mAP of 97.1% on the UPID datasetHigh detection accuracyPoor real-time applicability
[31]Achieved a mAP of 85% on a self-built datasetGood robustnessComplex operations, high computational demands
[32]Achieved a 96.2% F1-score on the SFID datasetEnhanced dataset and open-source, provides benchmark modelsSlow real-time inference speed
[33]Achieved a mAP of 89.1% on the DVID datasetHigh detection accuracyDifficult real-world deployment
[34]Achieved a mAP of 99.4% on a self-built datasetHigh accuracy and recallComplexity and high computational demand
[35]Achieved a precision of 97.38% on the ID datasetFocus on practical applicationDeployment requires substantial computational resources
[36]Achieved a mAP of 94.2% on a self-built datasetHigh accuracy in detecting small targetsLong training and inference times
[37]Achieved a precision of 90.71% on a self-built datasetRobust algorithm performanceHigh computational load
[38]Achieved a mAP of 85.6% on a dataset collected onlineLightweight modelDependent on high-quality data
[39]Achieved a mAP of 91.34% on a self-built datasetStrong real-time detection capabilitiesHigh computational resource needs
[40]Achieved a mAP of 65.1% on the IDID-Plus datasetLightweight model, efficient on edge devicesRisk of overfitting
[41]Achieved a mAP of 94.24% on the RSIn-DatasetHigh detection accuracyDifficult real-world deployment
Table 2. Label information of the ID-2024 dataset.
ClassesNumber
Flashover5078
Broken1862
Insulator5445
Missing cap563
Table 3. Comparison results with mainstream attention mechanisms.
Models[email protected]Param. (M)R[email protected]:0.95PFLOPs (G)
+CA [45]64.3%2,841,77059.5%37.9%77.5%4.8
+CBAM [46]62.4%2,918,34761.9%35.3%74.2%5.0
+ECA [48]59%2,570,98857.5%33.7%71.5%4.5
+SE [47]61.9%2,582,19662.3%35.1%71.6%4.5
+LCSA66.2%2,851,87263.6%38.5%74.9%5.1
Bold numbers indicate the best results in each column.
Table 4. Comparison results with mainstream lightweight detection models.
Models[email protected]Param. (M)R[email protected]:0.95PFLOPs (G)
BC-YOLO [33]64.4%7,247,85861.4%37.3%73.1%16.5
I-YOLOv5 [34]61.4%3,803,68458.1%34.9%71.1%9.7
GC-YOLO [36]54.4%9,645,42053.2%31.8%63.7%29.0
YOLOv5s [22]62.1%7,020,91360.3%35.4%72.7%15.8
YOLOv6n [24]56.3%4,234,14053.9%34.7%70.2%11.8
YOLOv7t [25]65.9%6,023,10660.3%38.6%78.7%13.2
YOLOv8n [26]59.4%3,022,81258.7%37.3%73.7%8.1
YOLOv8s [26]62.5%11,127,13260.3%39.5%74.3%28.4
IDD-YOLO66.2%2,851,87263.6%38.5%74.9%5.1
Bold numbers indicate the best results in each column.
Table 5. Comparative experimental results on SFID dataset.
Model[email protected][email protected]:0.95
Mask R-CNN [13]98.3%82.0%
Faster R-CNN [11]98.4%80.1%
YOLOX [23]99.4%86.0%
Swin-Transformer [58]99.0%86.4%
YOLOv5s [22]99.3%87.0%
IDD-YOLO99.4%87.2%
Bold numbers indicate the best results in each column.
Table 6. Comparison results of edge platform Experiments.
ModelParam. (M)FPS
BC-YOLO [33]7,247,85813.53
I-YOLOv5 [34]3,803,68412.23
GC-YOLO [36]9,645,4206.73
YOLOv4-tiny [21]5,883,3567.28
YOLOv5s [22]7,020,91315.67
YOLOv8s [26]11,127,13216.82
IDD-YOLO2,851,87220.83
Bold numbers indicate the best results in each column.
Table 7. Ablation experiment results.
G-LCSAG-PANetEIOU&Mish[email protected]Param. (M)R[email protected]:0.95PFLOPs (G)
---62.1%7,020,91360.3%35.4%72.7%15.8
--63.6%4,255,12062.3%36.6%75.5%7.6
--64.6%5,617,66562.6%38%78.1%13.3
--60.5%7,020,91360.8%35.9%71.8%15.8
-64.7%2,851,87265%36.8%69.5%5.1
-65.2%4,255,12063.7%37%75.8%7.6
-65.6%5,617,66562.5%37.9%76.7%13.3
66.2%2,851,87263.6%38.5%74.9%5.1
Bold numbers indicate the best results in each column.
Disclaimer/Publisher’s Note: The statements, opinions and data contained in all publications are solely those of the individual author(s) and contributor(s) and not of MDPI and/or the editor(s). MDPI and/or the editor(s) disclaim responsibility for any injury to people or property resulting from any ideas, methods, instructions or products referred to in the content.

