
Research Progress on Power Visual Detection of Overhead Line Bolt Defects Based on UAV Images


Abstract
1. Introduction
2. Challenges in Detecting UAV Image-Based Bolting Defects on Overhead Lines
2.1. Optimization of Algorithms for Small-Sized Bolts Detection
- (1)
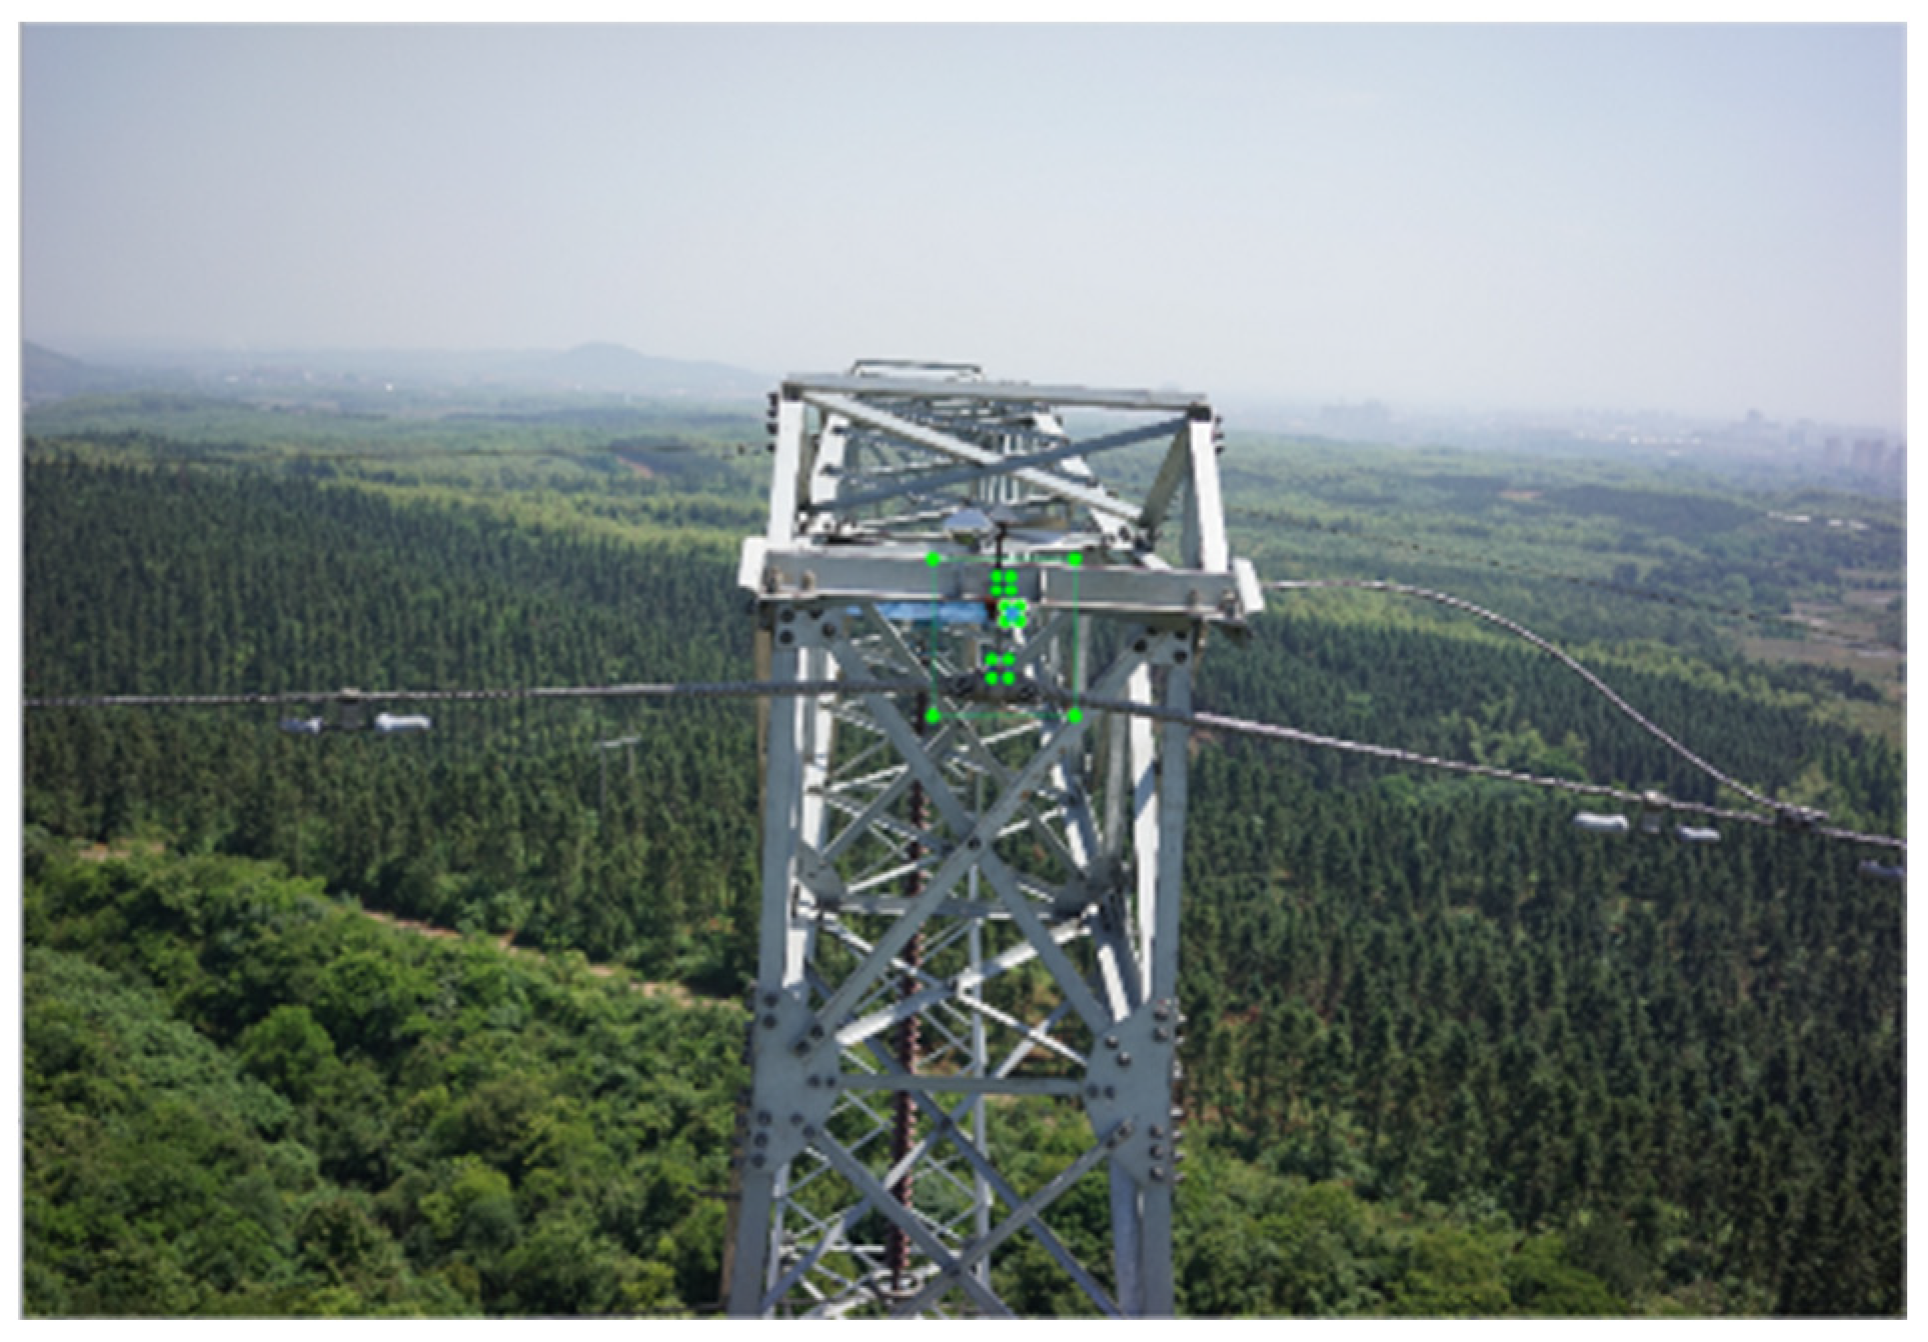
- Limited pixel information: With small targets occupying such a minimal portion of the image, the pixel information available for these targets is significantly reduced. This scarcity of visual data makes it difficult for the model to distinguish the target from the background noise, thereby hindering accurate detection.
- (2)
- Reduced feature visibility: Traditional object detection models depend on clear and distinguishable features to identify objects. In the case of small targets, these features become less visible, leading to a loss of critical information necessary for the model to accurately classify and detect the target.
- (3)
- Scale variability: Small targets often appear at varying scales within images, depending on the UAV’s flight altitude and distance from the target. This variability in scale adds complexity to the detection process, as the model must be robust enough to recognize targets across a range of sizes without missing any.
- (4)
- Blurring and artifacts: UAV images, especially those captured from high altitudes, may suffer from motion blur or artifacts due to camera vibrations or environmental conditions. These issues are particularly detrimental to small targets, making it even more challenging to extract meaningful features from the image.
2.1.1. Two-Stage Detection Scheme
2.1.2. Multi-Scale Feature Fusion Scheme
2.1.3. Attention Mechanism
2.2. Optimization of Algorithms for Dense and Occluded Bolt Detection
- (1)
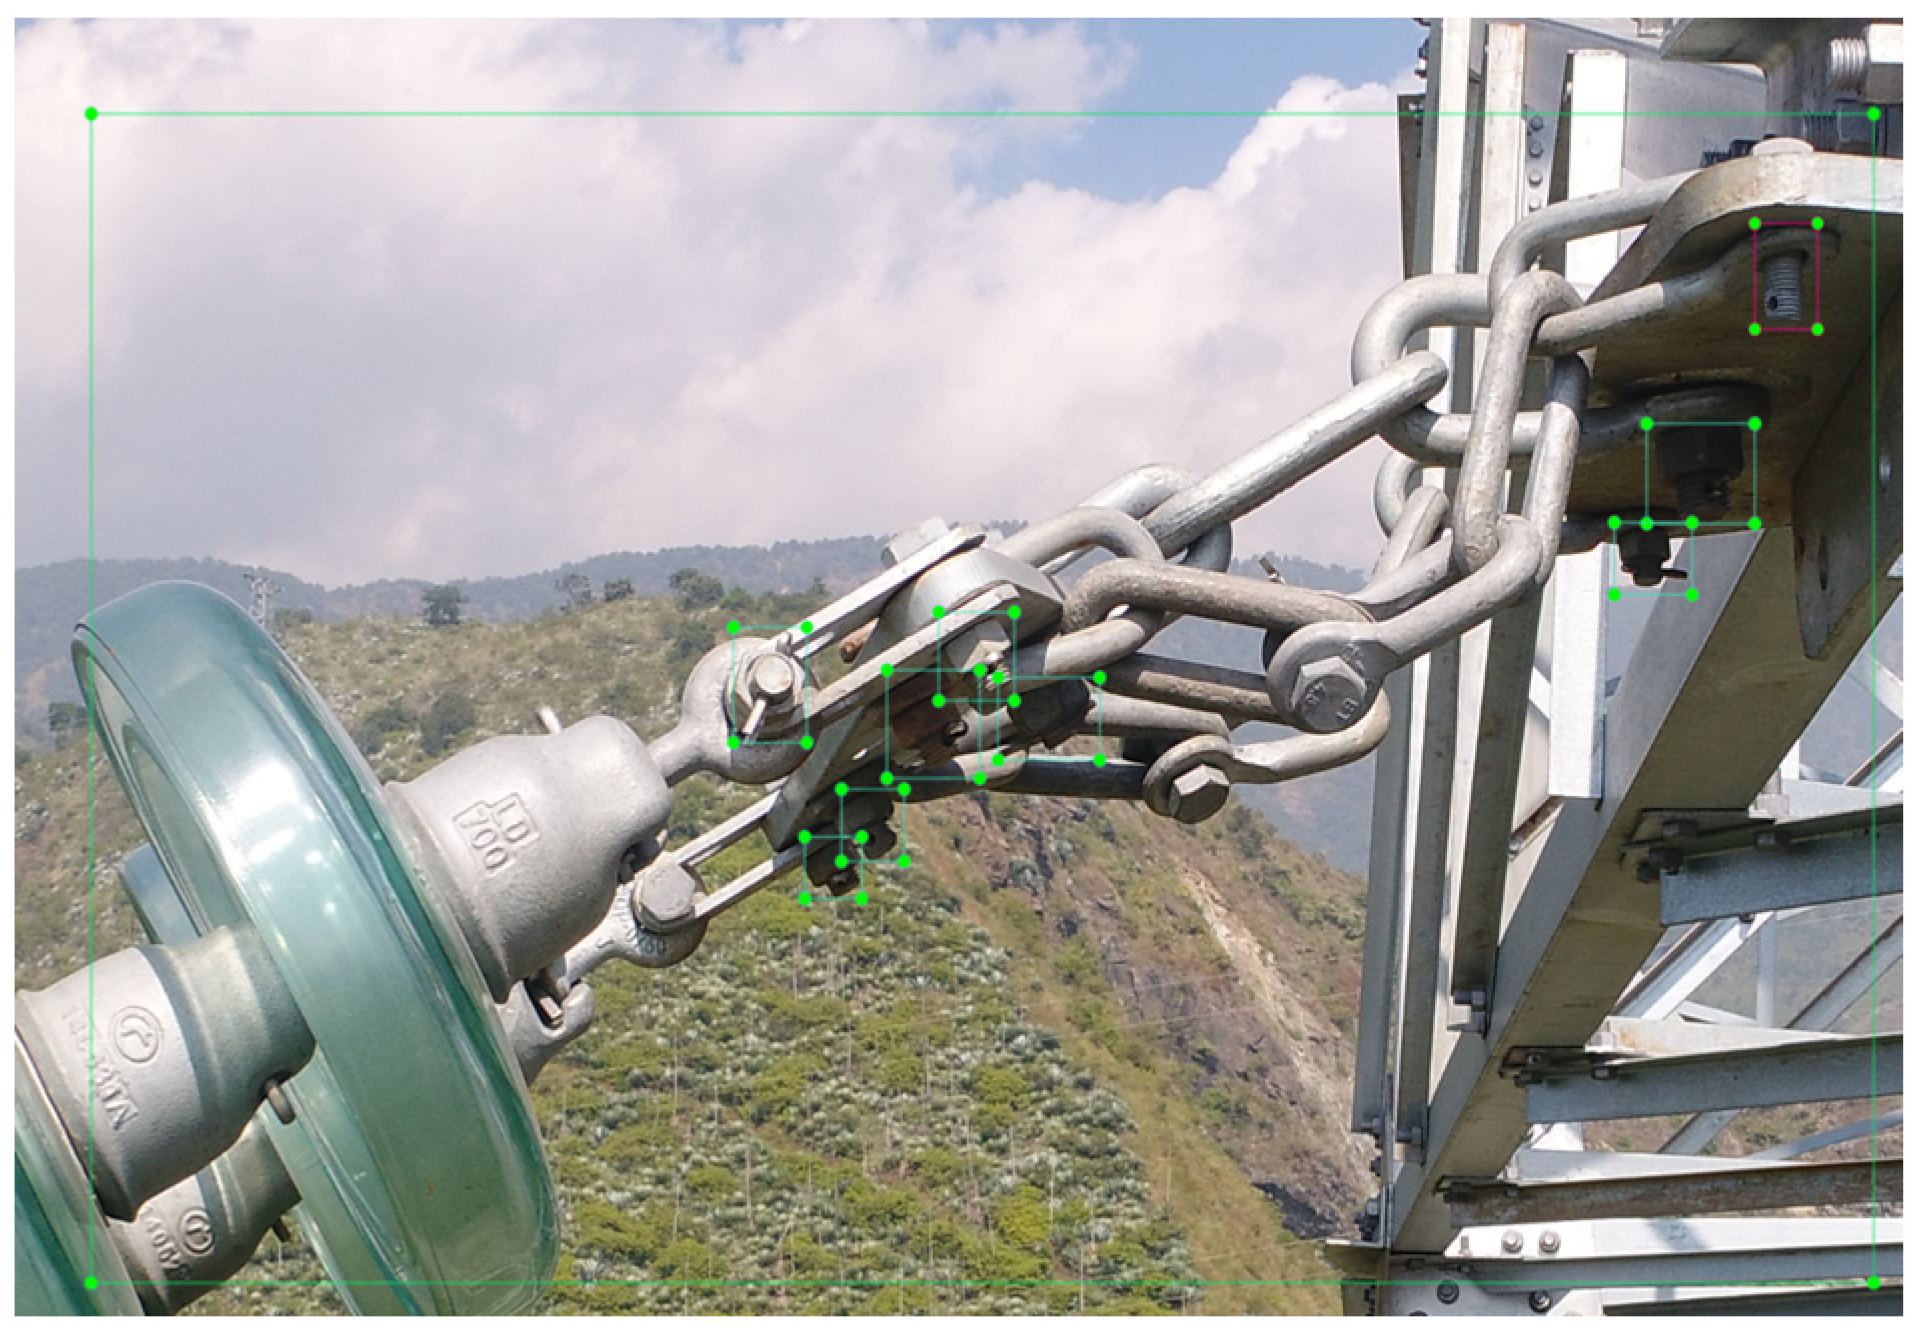
- Increased difficulty in feature extraction: When bolt components are densely arranged and partially obstructed by other equipment, key features may not be clearly captured, leading to missed important information and affecting detection accuracy.
- (2)
- Risk of feature confusion: In dense occlusion conditions, the edges and texture features of different targets may become confused, especially when multiple bolts overlap. The model may struggle to accurately distinguish each component’s boundaries, resulting in incorrect detection outcomes.
- (3)
- Information inference and completion: In a densely occluded environment, the model needs to infer and complete missing features from the occluded parts. However, with extremely limited available information, the difficulty of accurate inference and completion increases, potentially leading to erroneous inferences.
- (4)
- Decreased detection efficiency: Handling dense occlusion often requires more complex models and additional computational resources, which may decrease detection efficiency. This can negatively impact the real-time performance and effectiveness of inspection tasks in practical applications.
2.2.1. IoU Optimization
2.2.2. Contextual Information Utilization
2.2.3. Multi-Scale Feature Extraction
2.2.4. Using Generators and Discriminators
2.3. Optimization of Algorithms for Imbalanced Bolt Defect Datasets Target Detection
- (1)
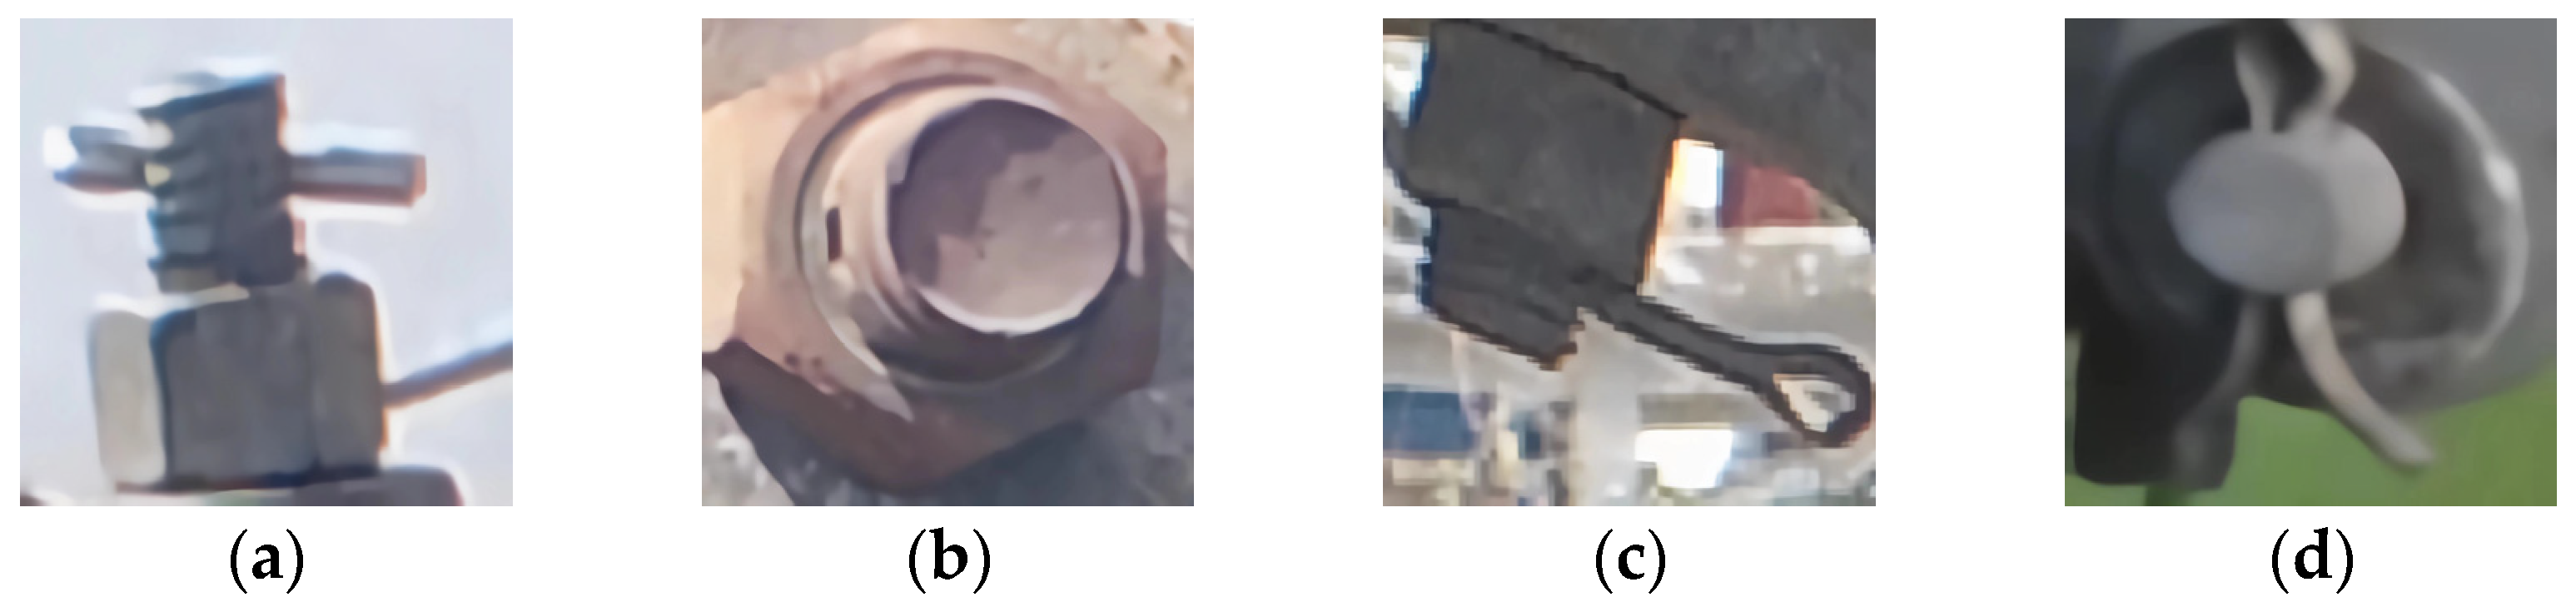
- Scarcity of defective samples: In bolt defect detection, the number of normal bolt samples usually far exceeds that of defective samples, allowing the model to learn the features of normal samples more thoroughly during training. However, the scarcity of defective samples leads to the poor learning of complex or specific defect features. For example, defects such as bolt loosening or missing nuts can result in missed or incorrect detections due to the limited number of defect samples, affecting the overall reliability of detection.
- (2)
- Bias in model training: With normal bolt samples dominating the dataset, the model tends to overfit these majority class samples during training and may underfit the minority defective samples. This bias leads to the misclassification of defective samples as normal during testing, especially when encountering new or unseen defects, causing a significant drop in detection accuracy and making it difficult to handle real-world complexities.
- (3)
- Diversity of defect types: Bolt defects can vary widely, each with distinct visual characteristics. In the presence of sample imbalance, the model may struggle to effectively learn and differentiate these diverse defect types. For instance, bolt loosening may manifest as slight angular deviations, while corrosion might differ in color or texture. With a limited number of defective samples, the model is prone to recognition errors or inaccurate classification when dealing with these complex and varied defects.
2.3.1. Class Weight Adjustment
2.3.2. Data Expansion
2.3.3. Few-Shot Learning
3. Comparison of Detection Characteristics of Mainstream Algorithms
3.1. Dataset Construction
3.2. Experimental Environment
3.3. Evaluation Indicators
3.4. Experimental Results and Analysis
- In terms of model size, the YOLO series offers several model options that share the same infrastructure, but balance detection accuracy and detection speed by adjusting the scaling factor of the network. Among them, YOLOv5n is the smallest model with only 3.7MB, which is ideal for deployment on mobile or embedded devices. As the model size increases, the number of parameters also increases, improving the detection accuracy. However, as the model size increases, the detection speed gradually slows down. Therefore, choosing the right model depends on the needs of the specific application scenario. While YOLOv5n has an advantage in terms of model size, its detection performance is relatively inferior to other YOLOv5 models. This is because reducing the width and depth of the network diminishes the network’s receptive field and decreases its ability to express specific features.
- In terms of the detection accuracy, YOLOv5m achieved the highest detection accuracy with an mAP of 69.42%, excelling in the pin-missing (xdqs) category with an AP of 74.04%. However, its performance in the pin-loosening (xdtc) category was lower, with an AP of 60.40%. Overall, all models exhibited poor detection performance for pin-loosening (xdtc) and nut-missing (qlm) defects. This is mainly due to the significantly fewer samples of these defects, making it difficult for models to fully learn their features, coupled with the subtle visual characteristics of these defects, which are easily missed. To address these limitations, we enhanced YOLOv8s by integrating two novel models. The YOLOv8s–SwinTransformer model replaces the SPPF module with the SwinTransformer–Tiny module, improving the model’s ability to capture features and detect long-range dependencies, which is crucial for identifying small and densely packed bolts. The YOLOv8s–Mamba model refines the C2f module with the SS2D (Selective Scan 2D) module, emphasizing important regions of the feature maps to reduce false positives and missed detections. Both models demonstrated improved detection accuracy, with YOLOv8s–Mamba achieving a 13.9% increase in the mAP with minimal computational overhead. These results highlight the advantages of these algorithms in handling complex image structures and long-range dependencies, making them particularly suitable for bolt defect detection tasks.
- The improved RT-DETR-l model significantly enhanced the detection accuracy across all categories, especially for small targets like pin-missing (xdqs) and nut-missing (qlm) defects, compared to the original DETR-R50 model. This improvement is mainly due to the introduction of rotatable position encoding and an enhanced attention mechanism in the RT-DETR model. The rotatable position encoding enhances the model’s flexibility in capturing spatial information of targets, making it no longer limited to fixed directions and scales, which is crucial for small targets with diverse directions and shapes. The improved attention mechanism ensures attention to important features through more efficient feature aggregation and selection strategies, increasing the sensitivity to small targets and overall detection robustness. These improvements make the RT-DETR model more stable in handling small targets, better capturing their details and features, thereby improving detection performance.
- Overall, the YOLO series outperforms traditional SSD and Faster R-CNN models in detection accuracy. However, within the YOLO series, YOLOv6 showed a lower detection accuracy for bolt defects, with mAP values not exceeding 30%. This issue primarily arises from the simplified feature layers in YOLOv6, leading to weaker performance in capturing features of targets at different scales, particularly for bolt defects requiring detailed features. While YOLOv6 performs well in handling large targets and tasks with simple backgrounds, its disadvantages become apparent in detection tasks requiring a high detail resolution. Therefore, despite the speed and efficiency advantages of YOLOv6 in some scenarios, its performance is lacking in bolt defect detection, which requires fine feature recognition. Despite improvements in YOLOv8, YOLOv9, and YOLOv10 on public datasets, their detection accuracy for bolt defects was lower than YOLOv5 and YOLOv7.
- SSD algorithm: Among the four algorithms, the SSD algorithm performed the worst. It mainly detected metal connections (lianjiechu), which occupy a large area of the image, but had weak detection capabilities for bolts and a high miss rate for metal connections. This is because the SSD algorithm utilizes a series of default boxes on multi-scale feature maps for object detection, which allows for relatively fast detection but suffers from limitations in detecting small targets due to its coarse default box settings. Additionally, the SSD algorithm also has a high miss rate in detecting metal connections due to insufficient representation capabilities for different scales and shapes of metal connections.
- Faster R-CNN algorithm: The Faster R-CNN algorithm performed slightly better than the SSD algorithm, with lower miss rates for metal connections (lianjiechu) and the ability to detect some bolts. However, it also misclassified the background as bolt components. The Faster R-CNN algorithm generates candidate boxes through the Region Proposal Network (RPN) and then extracts features for object detection via ROI Pooling. The broad coverage of candidate boxes generated by the RPN results in background areas being misclassified as targets.
- YOLO Series and RT-DETR-l algorithms: Compared with the SSD and Faster R-CNN algorithms, the YOLO series with RT-DETR-l shows a superior detection capability. The algorithms can effectively detect multiple types of bolt defects with relatively fewer misses at metal connections (lianjiechu) and shows stronger performance and robustness in small target detection tasks. The YOLO series employs a unified architecture that integrates the prediction of bounding boxes and class probabilities, allowing for real-time processing without compromising accuracy. For RT-DETR-l, the improved attention mechanism ensures that important features are highlighted through more efficient feature aggregation and selection strategies, enhancing the model’s sensitivity to small targets and overall detection robustness. Their superior detection capabilities, combined with efficient processing, make them highly suitable for bolt defect detection applications.
- Overall comparison and suitability: While the SSD and Faster R-CNN algorithms performed poorly in some aspects, they remain classic object detection algorithms suitable for specific scenarios and requirements. In contrast, the YOLO series and RT-DETR-l algorithms are more suitable for scenarios demanding high detection speed and accuracy, offering better robustness and performance advantages.
4. Future Development Trends
4.1. Unsupervised and Semi-Supervised Learning
4.2. Data Quality Enhancement
4.3. Model Compression and Optimization
4.4. Multi-Modal Power Vision Technology
4.5. Large Model Power Vision Technology
5. Conclusions
- Analysis of challenges and summary of improved algorithms: Three major challenges in detecting bolt defects on overhead lines using UAV patrol images were analyzed. These challenges include missed detections due to the small-sized bolts, misdetections caused by dense and occluded bolts, and underfitting due to imbalanced bolt defect datasets. Improved algorithms for target detection tailored to these specific scenarios were summarized to enhance detection results.
- Comparison of the detection characteristics of mainstream algorithms: By constructing a comprehensive dataset, the performance of various mainstream algorithms for overhead line bolt defect detection was meticulously compared and analyzed. The experimental results indicated that the YOLO and RT-DETR algorithms excel in both detection speed and accuracy, making them ideal for real-time detection tasks. In contrast, the SSD and Faster R-CNN algorithms show relatively poor performance in detecting small objects, with higher rates of missed and false detections, although they retain certain advantages in detecting larger objects. These analyses offer insights for further optimization and the selection of appropriate algorithms.
- Outlook of future research directions: The paper also presented an outlook on future research directions for power vision technology in overhead line bolt defect detection. These directions encompass unsupervised and semi-supervised learning, data quality enhancement, model compression and optimization, multi-modal power vision technology, and large model power vision technology. These avenues are anticipated to open new research pathways, improving the efficiency and accuracy of overhead line bolt defect detection.
Author Contributions
Funding
Conflicts of Interest
References
- Liu, C.; Wu, Y.; Liu, J. Research progress of vision-based rust defect detection methods for metal fittings in transmission lines. Chin. J. Sci. Instrum. 2024, 45, 286–305. [Google Scholar] [CrossRef]
- Zhao, Z.; Li, Y.; Zhen, Z.; Zhai, Y.; Zhang, K.; Zhao, W. Typical fittings detection method with Faster R-CNN combining KL divergence and shape constraints. High Volt. Eng. 2020, 46, 3018–3026. [Google Scholar] [CrossRef]
- Zhai, Y.; Yang, X.; Wang, Q.; Zhao, Z.; Zhao, W. Hybrid knowledge R-CNN for transmission line multifitting detection. IEEE Trans. Instrum. Meas. 2021, 70, 1–12. [Google Scholar] [CrossRef]
- Zhai, X.; Li, X.; Zhai, Y. Defect detection of overhead transmission wires based on deep learning. Power Syst. Technol. 2023, 47, 1022–1031. [Google Scholar] [CrossRef]
- Chen, C.; Peng, X.; Song, S.; Wang, K.; Qian, J.; Yang, B. Safety distance diagnosis of large scale transmission line corridor inspection based on LiDAR point cloud collected with UAV. Power Syst. Technol. 2017, 41, 2723–2730. [Google Scholar] [CrossRef]
- Sui, Y.; Ning, P.; Niu, P.; Wang, C.; Zhao, D.; Zhang, W.; Han, S.; Liang, L.; Xue, G.; Cui, Y. Review on mounted UAV for transmission line inspection. Power Syst. Technol. 2021, 45, 3636–3648. [Google Scholar] [CrossRef]
- Shao, G.; Liu, Z.; Fu, J.; Tan, J.; Chen, Y.; Zhou, L. Research progress in unmanned aerial vehicle inspection technology on overhead transmission lines. High Volt. Eng. 2020, 46, 14–22. [Google Scholar]
- Lin, G.; Wang, B.; Peng, H.; Wang, X.; Chen, S.; Zhang, L. Multi-target detection and location of transmission line inspection image based on improved Faster-RCNN. Electr. Power Autom. Equip. 2019, 39, 213–218. [Google Scholar] [CrossRef]
- Fu, J.; Tan, J.Y.; Zhou, L.; Cai, H.; Chen, B. Analysis of intelligent identification method for image defects of UAV inspection of transmission lines. High Volt. Eng. 2023, 49, 103–110. [Google Scholar] [CrossRef]
- Fan, S.; Yang, D.; Zou, D.; Yan, Y. Vision-based tracing, recognition and positioning strategy for bolt tightening live working robot on power transmission line. J. Electron. Meas. Instrum. 2017, 31, 1514–1523. [Google Scholar] [CrossRef]
- Huang, Z.; Zhang, X. Research on bolt defect detection technology of transmission tower. Ind. Control Comput. 2017, 30, 6. [Google Scholar]
- Feng, M.; Luo, W.; Yu, L.; Zhang, P.; Hao, X.; Fan, Q.; Peng, Q.; Zhang, T.; Cao, L. A bolt detection method for pictures captured from an unmanned aerial vehicle in power transmission line inspection. J. Electr. Power Sci. Technol. 2018, 33, 135–140. [Google Scholar]
- Pu, T.; Zhang, Z.; Tan, Y.; Mo, W.; Guo, J. Theoretical Primer and Directions of Electric Power Artificial Intelligence (Ⅱ): Self-directed Learning and Preliminary Application. Proc. CSEE. 2023, 43, 3705–3718. [Google Scholar] [CrossRef]
- Yan, S.; Zhang, W.; Li, H.; Wang, L. Research on fast fault diagnosis of transmission line based on artificial intelligence. Power Syst. Prot. Control. 2019, 47, 94–99. [Google Scholar] [CrossRef]
- Pu, T.; Qiao, J.; Han, X.; Zhang, G.; Wang, X. Research and application of artificial intelligence in operation and maintenance for power equipment. High Volt. Eng. 2020, 46, 369–383. [Google Scholar] [CrossRef]
- Ma, F.; Wang, B.; Dong, X.; Wang, H.; Luo, P.; Zhou, Y. Power vision edge intelligence: Power depth vision acceleration technology driven by edge computing. Power Syst. Technol. 2020, 44, 2020–2029. [Google Scholar] [CrossRef]
- Zhao, Z.; Jiang, Z.; Li, Y.; Qi, Y.; Zhai, Y.; Zhao, W.; Zhang, K. Overview of visual defect detection of transmission line components. J. Image Graph. 2021, 26, 2545–2560. [Google Scholar]
- Liu, C.; Wu, Y. Research progress of vision detection methods based on deep learning for transmission lines. Proc. CSEE. 2023, 43, 7423–7446. [Google Scholar] [CrossRef]
- Redmon, J.; Divvala, S.; Girshick, R.; Farhadi, A. You only look once: Unified, real-time object detection. In Proceedings of the 2016 IEEE Conference on Computer Vision and Pattern Recognition (CVPR), Caesars Palace, Las Vegas, NV, USA, 27–30 June 2016. [Google Scholar] [CrossRef]
- Jocher, G.; Stoken, A.; Borovec, J.; NanoCode; ChristopherSTAN; Liu, C.; Laughing; tkianai; Hogan, A.; lorenzomammana; et al. Ultralytics/YOLOv5: v3.1-Bug Fixes and Performance Improvements. Available online: https://github.biejieshi.com/ultralytics/yolov5/releases/tag/v3.1 (accessed on 15 May 2024).
- Wang, C.; Yeh, I.-H.; Liao, H.-Y.M. YOLOv9: Learning What You Want to Learn Using Programmable Gradient Information. Available online: https://arxiv.org/pdf/2402.13616.pdf (accessed on 29 May 2024).
- Liu, W.; Anguelov, D.; Erhan, D.; Szegedy, C.; Reed, S.; Fu, C.Y.; Berg, A.C. SSD: Single shot multibox detector. In Proceedings of the 2016 European Conference on Computer Vision (ECCV), Amsterdam, The Netherlands, 11–14 October 2016. [Google Scholar]
- Fu, C.; Liu, W.; Ranga, A.; Tyagi, A.; Berg, C. DSSD: Deconvolutional Single Shot Detector. Available online: https://arxiv.org/pdf/1701.06659.pdf (accessed on 15 May 2024).
- Lin, T.Y.; Dollár, P.; Girshick, R.; He, K.; Hariharan, B.; Belongie, S. Feature pyramid networks for object detection. In Proceedings of the 2017 IEEE Conference on Computer Vision and Pattern Recognition (CVPR), Honolulu, HI, USA, 21–26 July 2017. [Google Scholar]
- Carion, N.; Massa, F.; Synnaeve, G.; Usunier, N.; Kirillov, A.; Zagoruyko, S. End-to-end object detection with transformers. In Proceedings of the 2020 European Conference on Computer Vision (ECCV), Glasgow, Scotland, 23–28 August 2020. [Google Scholar]
- Zhu, X.; Su, W.; Lu, L.; Li, B.; Wang, X.; Dai, J. Deformable detr: Deformable Transformers for End-to-End Object Detection. Available online: https://arxiv.org/abs/2010.04159.pdf (accessed on 15 May 2024).
- Li, F.; Zhang, H.; Liu, S.; Guo, J.; Ni, L.M.; Zhang, L. Dn-detr: Accelerate detr training by introducing query denoising. In Proceedings of the 2022 IEEE Conference on Computer Vision and Pattern Recognition (CVPR), New Orleans, LA, USA, 18–24 June 2022. [Google Scholar] [CrossRef]
- Girshick, R.; Donahue, J.; Darrell, T.; Malik, J. Rich feature hierarchies for accurate object detection and semantic segmentation. In Proceedings of the 2014 IEEE Conference on Computer Vision and Pattern Recognition (CVPR), Columbus, OH, USA, 23–28 June 2014. [Google Scholar] [CrossRef]
- Ren, S.; He, K.; Girshick, R.; Sun, J. Faster R-CNN: Towards real-time object detection with region proposal networks. IEEE Trans. Pattern Anal. Mach. Intell. 2017, 39, 1137–1149. [Google Scholar] [CrossRef]
- Cai, Z.; Vasconcelos, N. Cascade R-CNN: Delving Into High Quality Object Detection. In Proceedings of the 2018 IEEE Conference on Computer Vision and Pattern Recognition (CVPR), Salt Lake City, UT, USA, 18–22 June 2018. [Google Scholar] [CrossRef]
- Chen, C.; Liu, M.Y.; Tuzel, O.; Xiao, J. RCNN for small object detection. In Proceedings of the 13th Asian Conference on Computer Vision, Taipei, China, 20–24 November 2016. [Google Scholar]
- Luo, P.; Wang, B.; Wang, H.; Ma, F.; Ma, H.; Wang, L. An Ultrasmall Bolt Defect Detection Method for Transmission Line Inspection. IEEE Trans. Instrum. Meas. 2023, 72, 5006512. [Google Scholar] [CrossRef]
- Bai, J.; Zhao, R.; Gu, F.; Wang, J. Multi-target detection and fault recognition image processing method. High Voltage Eng. 2019, 45, 3504–3511. [Google Scholar] [CrossRef]
- Gao, F.; Zhang, R.; Tang, J.; Liu, S.; Li, W.; Yu, J.; Chen, C.; Zheng, H. Pin-CasNet: Detecting pin status in transmission lines based on cascade network. Eng. Appl. Artif. Intell. 2024, 127, 107244. [Google Scholar] [CrossRef]
- Ni, Y.; Han, J.; Zou, X.; Hu, G.; Wang, W. Two-stage adaptive block transmission line bolt defect detection method. Comput. Eng. 2024, 1–11. [Google Scholar] [CrossRef]
- Yao, C.; Shen, J.; Tang, H.; Yao, J. Bolt fault detection of transmission line based on the cascading network. Electron. Des. Eng. 2024, 32, 26–31+36. [Google Scholar] [CrossRef]
- Qi, Y.; Huo, Y.; Liu, S.; Jin, Y. Optimized YOLOX Based Transmission Line Bolt Cascade Detection. In Proceedings of the 2022 IEEE International Conference on Systems, Man, and Cybernetics (SMC), Prague, Czech Republic, 9–12 October 2022. [Google Scholar] [CrossRef]
- Li, H.; Dong, Y.; Liu, X.; Wang, H.; Xu, L. Transmission line abnormal object detection method based on deep network of two-stage. Control Decis. 2022, 37, 1873–1882. [Google Scholar] [CrossRef]
- Li, R.; Zhang, Y.; Zhai, D.; Xu, D. Pin defect detection of transmission line based on improved SSD. High Voltage Eng. 2021, 47, 3795–3802. [Google Scholar] [CrossRef]
- Zhao, L.; Liu, C.; Zhang, Z.; Hong, Q. Research on adaptive detection technology for pin defects in transmission lines. J. Huazhong Univ. Sci. Technol. Nat. Sci. Ed. 2023, 51, 109–115,160. [Google Scholar] [CrossRef]
- Zhao, Z.; Qi, H.; Qi, Y.; Zhang, K.; Zhai, Y.; Zhao, W. Detection Method Based on Automatic Visual Shape Clustering for Pin-Missing Defect in Transmission Lines. IEEE Trans. Instrum. Meas. 2020, 69, 6080–6091. [Google Scholar] [CrossRef]
- Jiao, R.; Liu, Y.; He, H.; Ma, X.; Li, Z. A Deep Learning Model for Small-Size Defective Components Detection in Power Transmission Towers. IEEE Trans. Power Deliv. 2022, 37, 2551–2561. [Google Scholar] [CrossRef]
- Chen, Z.; Wang, L.; Li, B.; Xu, J.; Gao, H.; Zheng, Y. An Improved Faster R-CNN Transmission Line Bolt Defect Detection Method. In Proceedings of the 2022 World Automation Congress (WAC), San Antonio, TX, USA, 11–15 October 2022. [Google Scholar] [CrossRef]
- Xing, B.; Xu, C.; He, Y.; Long, H.; GKhongwar, J.A. Aerial Photography Transmission Line Defect Bolt Detection Method Based on Faster R-CNN. In Proceedings of the 2nd International Conference on Cognitive Based Information Processing and Applications (CIPA 2022), Changzhou, China, 22–23 September 2022. [Google Scholar] [CrossRef]
- Zhao, W.; Jia, M.; Zhai, Y.; Zhao, Z. Detection method for Pin-losing-bolts in transmission lines based on improved YOLOv5s. J. North China Electric Power Univ. Nat. Sci. Ed. 2024, 51, 92–100. [Google Scholar]
- Li, Y.; Liu, M.; Li, Z.; Jiang, X. CSSAdet: Real-Time End-to-End Small Object Detection for Power Transmission Line Inspection. IEEE Trans. Power Deliv. 2023, 38, 4432–4442. [Google Scholar] [CrossRef]
- Gong, Y.; Zhou, W.; Wang, K.; Wang, J.; Wang, R.; Deng, H.; Liu, G. Defect detection of small cotter pins in electric power transmission system from UAV images using deep learning techniques. Electr. Eng. 2023, 105, 1251–1266. [Google Scholar] [CrossRef]
- Zou, H.; Sun, J.; Ye, Z.; Yang, J.; Yang, C.; Li, F.; Xiong, L. A bolt defect detection method for transmission lines based on improved YOLOv5. Front. Energy Res. 2024, 12, 1269528. [Google Scholar] [CrossRef]
- Liu, L.; Zhao, J.; Chen, Z.; Zhao, B.; Ji, Y. A New Bolt Defect Identification Method Incorporating Attention Mechanism and Wide Residual Networks. Sensors 2022, 22, 7416. [Google Scholar] [CrossRef] [PubMed]
- Wang, C.; Shi, Z.; Meng, L.; Wang, J.; Wang, T.; Gao, Q.; Wang, E. Anti-occlusion target tracking algorithm of UAV based on multiple detection. Beijing Univ. Aeronaut. Astronaut. 2023, 49, 2442–2454. [Google Scholar] [CrossRef]
- Qi, Y.; Jiang, A.; Zhao, Z.; Lang, J.Y.; Nie, L.Q. Fittings detection method in patrol images of transmission line based on improved SSD. Electr. Meas. Instrum. 2019, 56, 7–12+43. [Google Scholar] [CrossRef]
- Zhai, Y.; Guo, C.; Wang, Q.; Zhao, K.; Bai, Y.; Zhang, J. Multi-fitting detection method for transmission lines based on implicit spatial knowledge fusion. J. Graph. 2023, 44, 918–927. [Google Scholar]
- Hao, S.; Ma, R.; Zhao, X.; An, B.; Zhang, X.; Ma, X. Fault detection of YOLOv3 transmission line based on convolutional block attention model. Power Syst. Technol. 2021, 45, 2979–2987. [Google Scholar] [CrossRef]
- Zhou, J.; Xuan, S.; Wang, T. Improved DDETR UAV target detection algorithm incorporating occlusion information. Comput. Eng. Appl. 2024, 60, 236–244. [Google Scholar]
- Zhai, Y.; Wang, Q.; Yang, X.; Zhao, Z.; Zhao, W. Multi-Fitting detection on transmission line based on cascade reasoning graph network. IEEE Trans. Power Deliv. 2022, 37, 4858–4868. [Google Scholar] [CrossRef]
- Zhang, K.; Lou, W.; Wang, J.; Zhou, R.; Guo, X.; Xiao, Y.; Shi, C.; Zhao, Z. PA-DETR: End-to-end visually indistinguishable bolt defects detection method based on transmission line knowledge reasoning. IEEE Trans. Instrum. Meas. 2023, 72, 5016914. [Google Scholar] [CrossRef]
- Zhao, Z.; Xiong, J.; Han, Y.; Miao, S. Transmission line bolts and their defects detection method based on position relationship. Front. Energy Res. 2023, 11, 1269087. [Google Scholar] [CrossRef]
- Liu, H.; Mo, W.; Tan, Y.; Liu, J.; Li, Y. Oriented object detector for transmission line equipment detection. Power Syst. Technol. 2021, 45, 4888–4895. [Google Scholar] [CrossRef]
- Liu, M.; Li, Z.; Li, Y. A Fast and Accurate Method of Power Line Intelligent Inspection Based on Edge Computing. IEEE Trans. Instrum. Meas. 2022, 71, 3506512. [Google Scholar] [CrossRef]
- Hao, S.; Yang, L.; Ma, X.; Ma, R.Z.; Wen, H. YOLOv5 transmission line fault detection based on attention mechanism and cross-scale feature fusion. Proc. CSEE 2023, 43, 2319–2331. [Google Scholar] [CrossRef]
- An, S.; Lin, S.K.; Qiao, J.; Li, C. Object detection via learning occluded features based on generative adversarial networks. Control Decis. 2021, 36, 1199–1205. [Google Scholar] [CrossRef]
- Zhao, Z.; Ma, D.; Ding, J.; Zhai, Y.; Zhao, W.; Zhang, K. Weakly supervised detection method for pin-missing bolt of transmission line based on SAW-PCL. J. Beijing Univ. Aeronaut. Astronaut. 2023, 1–10. [Google Scholar] [CrossRef]
- Wang, K.; Wang, J.; Liu, G.; Zhou, W.; Chen, J. Pin defect detection based on RetinaNet and category-balanced sampling methods. Electr. Power Eng. Technol. 2019, 38, 80–85. [Google Scholar]
- Jiao, R.; Fu, Z.; Liu, Y.; Zhang, Y.; Song, Y. A defective bolt detection model with Attention-Based RoI fusion and cascaded classification network. IEEE Trans. Instrum. Meas. 2023, 72, 2529311. [Google Scholar] [CrossRef]
- Wu, L.; Zhang, H.; Liu, J.; Zhao, C. Defect detection of transmission line bolt based on region attention mechanism and multi-scale feature fusion. Comput. Sci. 2023, 50, 438–444. [Google Scholar]
- Li, G.; Zhang, Y.; Wang, W.; Zhang, D. Defect detection method of transmission line bolts based on DETR and prior knowledge fusion. J. Graph. 2023, 44, 438–447. [Google Scholar]
- Fu, J.; Shao, G.; Wu, L.; Liu, L.; Ji, Z. Defect detection of line facility using hierarchical model with learning algorithm. High Voltage Eng. 2017, 43, 266–275. [Google Scholar] [CrossRef]
- Wang, K.; Wang, J.; Liu, G.; Zhou, W.; He, Z. RetinaNet algorithm based on auxiliary data for intelligent identification on pin defects. Guangdong Electric Power 2019, 32, 41–48. [Google Scholar]
- Hu, C.; Pei, S.; Liu, Y.; Yang, W.; Yang, R.; Zhang, X.; Liu, H. Real-time defect detection method for transmission line edge end based on LEE-YOLOv7. High Voltage Eng. 2023, 1–14. [Google Scholar] [CrossRef]
- Xu, H.; Yu, J.; Liang, C.; Zhang, X. Detection method for small metal defects of improved RPN transmission line based on GAN. Chin. J. Electron. Devices 2021, 44, 1409–1416. [Google Scholar]
- Hao, S.; Zhang, X.; Ma, X.; He, T.; An, B.; Li, J. Small target fault detection method for transmission lines based on PKAMNet. High Voltage Eng. 2023, 49, 3385–3394. [Google Scholar] [CrossRef]
- Zhao, W.; Jia, M.; Zhang, H. Small Target Paste Randomly Data Augmentation Method Based on a Pin-losing Bolt Data Set. In Proceedings of the 2021 IEEE 3rd International Conference on Power Data Science (ICPDS), Harbin, China, 26 December 2021. [Google Scholar] [CrossRef]
- Zhang, K.; Xiao, Y.; Wang, J.; Du, M.; Guo, X.; Zhou, R.; Shi, C.; Zhao, Z. DP-GAN: A Transmission Line Bolt Defects Generation Network Based on Dual Discriminator Architecture and Pseudo-Enhancement Strategy. IEEE Trans. Power Del. 2024, 39, 1622–1633. [Google Scholar] [CrossRef]
- Zhao, Z.; Jin, C.; Qi, Y.; Zhang, K.; Kong, Y. Image Classification of Transmission Line Bolt Defects Based on Dynamic Supervision Knowledge Distillation. High Voltage Eng. 2021, 47, 406–414. [Google Scholar] [CrossRef]
- Ma, P.; Fan, Y.F. Small Sample Smart Substation Power Equipment Component Detection Based on Deep Transfer Learning. Power Syst. Technol. 2020, 44, 1148–1159. [Google Scholar] [CrossRef]
- Zhao, W.; Xu, M. Bolt missing pins detection of transmission lines based on inter-level cross feature fusion. Image Graph. 2022, 27, 3222–3231. [Google Scholar]
- Yang, X.; Gao, L.; Zhao, X.; Peng, Y.; Liao, M. Detection bolts with missing pins of transmission lines based on improved YOLOv7-tiny algorithm. Hubei Minzu Univ. Nat. Sci. Ed. 2023, 41, 314–321. [Google Scholar] [CrossRef]
- Song, Z.; Huang, X.; Ji, C.; Zhang, F.; Zhang, Y. Transmission Line Connection Fittings and Corrosion Detection Method Based on Pcsa-Yolov7 Former. Electr. Power 2024, 57, 141–152. [Google Scholar]


| Method | Core Idea | Advantages | Disadvantages |
|---|---|---|---|
| Two-stage Detection Scheme [32,33,34,35,36,37] | Splits detection into two stages, refining each step | High accuracy, reduces false positives | Complex process, slower speed; errors may arise during trimming and repositioning |
| Multi-scale Feature Fusion Scheme [38,39,40,41,42,43,44] | Combines features from multiple scales | Effectively detects targets of varying sizes | Less effective for small bolts in complex backgrounds |
| Attention Mechanism [45,46,47,48,49] | Focuses on key features, suppresses irrelevant information | Improves detection in complex scenarios | Increased training and inference complexity, higher computational cost |
| Method | Core Idea | Advantages | Disadvantages |
|---|---|---|---|
| IoU Optimization [50,51,52,53] | Refines IoU handling during training and post-processing | Enhances detection of overlapping targets | Sensitive to confidence thresholds, may increase false positives |
| Contextual Information Utilization [54,55,56,57] | Leverages surrounding semantic context for better detection | Improves detection in occluded and complex environments | Requires complex models and additional computational resources |
| Multi-scale Feature Extraction [58,59,60] | Extracts features at different scales to handle varied target sizes | Improves detection of varied sizes and levels | Increased training and inference complexity |
| Generators and Discriminators [61] | Recover occluded areas, validate with discriminators | Enhances detection of occluded targets | Difficult training, high computational cost |
| Method | Core Idea | Advantages | Disadvantages |
|---|---|---|---|
| Adjusting class weights [62,63,64,65,66] | Modify class weights in the loss function | Mitigates class imbalance improves minority class detection | Requires careful tuning to avoid overfitting defect samples |
| Data expansion [67,68,69,70,71,72,73] | Use data augmentation to generate more samples | Increases training data, enhances robustness and generalization | Varies in sample quality, excessive augmentation may add noise |
| Few-shot learning methods [74,75] | Utilizes pre-trained models and domain knowledge | Effective in scenarios with limited data | Relies on the availability of high-quality pre-trained models |
| Objects | lianjiechu | Normal | xdqs | xdtc | qlm |
|---|---|---|---|---|---|
| Total/num | 7007 | 12995 | 1793 | 210 | 190 |
| Real Situation | Model Predictions | |
|---|---|---|
| Positive | Negative | |
| positive | TP(True Positive) | FN(False Negative) |
| negative | FP(False Positive) | TN(False Negative) |
| Model | lianjiechu (AP%) | normal (AP%) | xdqs (AP%) | xdtc (AP%) | qlm (AP%) | mAP% | Precision% | Recall% | Model Size (MB) | Params (M) | FLOPs (G) |
|---|---|---|---|---|---|---|---|---|---|---|---|
| SSD [76] | 36.45 | 0.33 | 0.03 | 0.18 | 0.03 | 7.40 | 21.11 | 5.01 | 16.33 | 26.29 | 62.7 |
| Faster R-CNN | 65.87 | 2.84 | 1.39 | 1.89 | 2.38 | 14.88 | 28.01 | 28.63 | 108.3 | 28.48 | 941.2 |
| DETR-R50 | 62.03 | 29.29 | 2.81 | 11.60 | 0.00 | 21.14 | 23.11 | 53.87 | 158.8 | 36.79 | 102.2 |
| RT-DETR-l | 81.50 | 67.11 | 70.54 | 57.22 | 64.21 | 68.14 | 81.70 | 65.50 | 63.43 | 31.99 | 103.5 |
| YOLOv5n | 75.62 | 47.27 | 45.63 | 24.73 | 40.01 | 46.65 | 71.89 | 41.47 | 3.7 | 1.87 | 4.5 |
| YOLOv5s | 79.60 | 58.87 | 61.51 | 56.17 | 48.23 | 60.88 | 83.33 | 54.99 | 13.8 | 7.03 | 15.8 |
| YOLOv5m | 80.85 | 65.29 | 74.04 | 60.40 | 66.52 | 69.42 | 83.52 | 63.18 | 40.3 | 21.17 | 48.9 |
| YOLOv5l | 82.24 | 66.54 | 73.50 | 61.38 | 61.09 | 68.95 | 83.34 | 64.65 | 88.6 | 46.53 | 109.0 |
| YOLOv5x | 81.09 | 66.96 | 73.60 | 60.09 | 61.76 | 68.70 | 86.30 | 63.63 | 165.1 | 86.71 | 205.5 |
| YOLOv6n | 63.20 | 28.10 | 13.30 | 5.40 | 7.00 | 23.40 | 43.10 | 30.90 | 9.9 | 4.71 | 11.4 |
| YOLOv6s | 67.30 | 31.80 | 16.20 | 11.30 | 8.60 | 27.00 | 33.80 | 31.90 | 38.7 | 18.48 | 45.3 |
| YOLOv6m | 67.60 | 31.90 | 14.60 | 10.40 | 10.70 | 27.00 | 34.30 | 32.80 | 72.5 | 34.94 | 85.8 |
| YOLOv7- Tiny [77] | 73.60 | 42.70 | 33.20 | 4.17 | 17.80 | 34.30 | 62.90 | 34.30 | 46.5 | 6.23 | 13.9 |
| YOLOv7 [78] | 84.00 | 69.30 | 66.40 | 23.80 | 70.70 | 62.80 | 54.80 | 67.80 | 71.4 | 37.62 | 106.5 |
| YOLOv7x | 83.50 | 68.00 | 64.60 | 37.40 | 65.60 | 63.90 | 71.40 | 62.00 | 541.5 | 71.34 | 190.6 |
| YOLOv8n | 75.60 | 39.60 | 30.10 | 37.00 | 10.30 | 38.50 | 54.90 | 38.45 | 6.0 | 3.22 | 8.7 |
| YOLOv8m | 82.00 | 55.70 | 54.00 | 54.50 | 37.50 | 56.80 | 67.40 | 55.40 | 49.6 | 25.88 | 78.9 |
| YOLOv8s | 77.80 | 51.30 | 44.80 | 44.00 | 25.10 | 48.60 | 63.34 | 45.23 | 21.5 | 11.23 | 28.6 |
| YOLOv8s-Mamba | 80.90 | 68.00 | 62.30 | 45.20 | 56.10 | 62.50 | 75.40 | 56.20 | 21.79 | 11.20 | 28.1 |
| YOLOv8s- SwinTransformer | 74.60 | 61.10 | 53.00 | 47.20 | 37.20 | 54.60 | 63.80 | 50.70 | 66.82 | 34.70 | 90.5 |
| YOLOv8l | 80.60 | 57.70 | 55.20 | 50.10 | 41.70 | 57.10 | 82.45 | 50.83 | 83.6 | 43.73 | 165.2 |
| YOLOv8x | 81.40 | 58.90 | 58.70 | 48.90 | 43.20 | 58.20 | 69.30 | 53.14 | 130.4 | 68.16 | 257.8 |
| YOLOv9c | 82.80 | 59.00 | 54.10 | 50.60 | 35.70 | 56.40 | 70.50 | 52.70 | 390.9 | 50.97 | 237.7 |
| YOLOv9e | 82.00 | 57.20 | 51.00 | 45.00 | 35.90 | 54.20 | 64.50 | 52.80 | 532.1 | 69.36 | 243.4 |
| YOLOv10s | 76.40 | 69.70 | 65.70 | 33.70 | 48.00 | 58.70 | 75.20 | 48.20 | 15.89 | 8.04 | 24.5 |
| YOLOv10m | 76.00 | 69.40 | 63.50 | 45.30 | 58.40 | 62.50 | 75.50 | 57.60 | 32.06 | 16.46 | 63.4 |
| Original image |  |  |
| SSD |  | 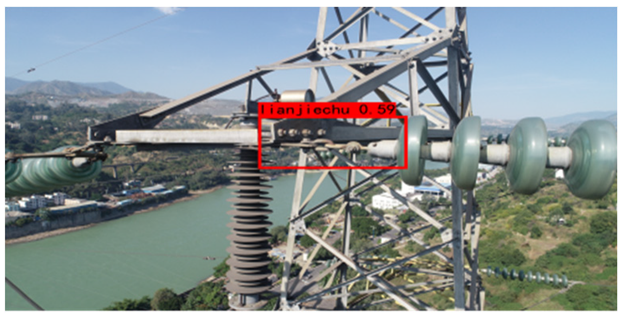 |
| Faster R-CNN | 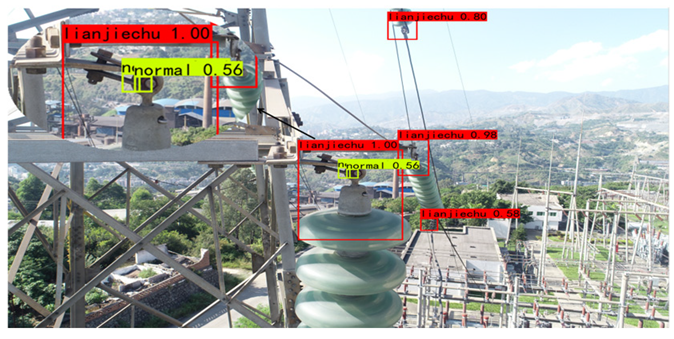 | 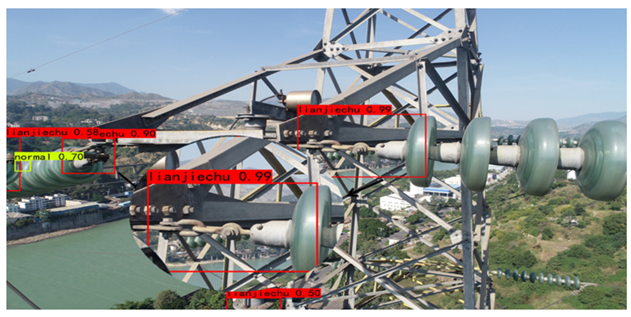 |
| YOLOv10m | 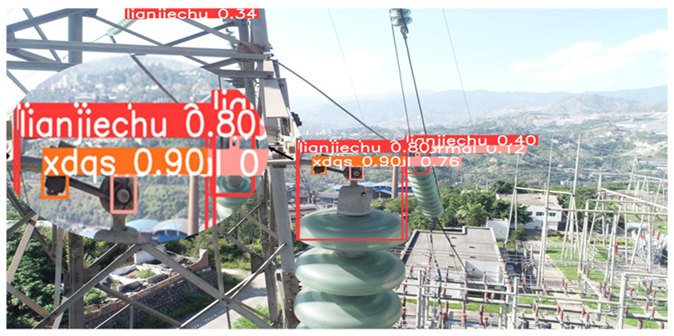 | 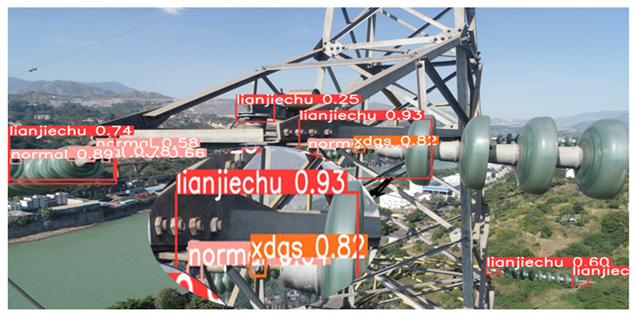 |
| YOLO–Mamba | 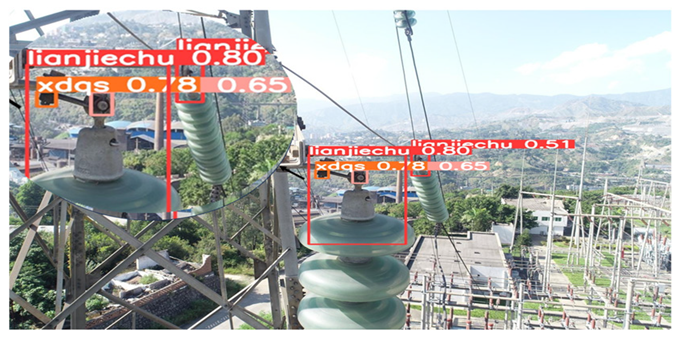 |  |
| YOLO-SwinTransformer | 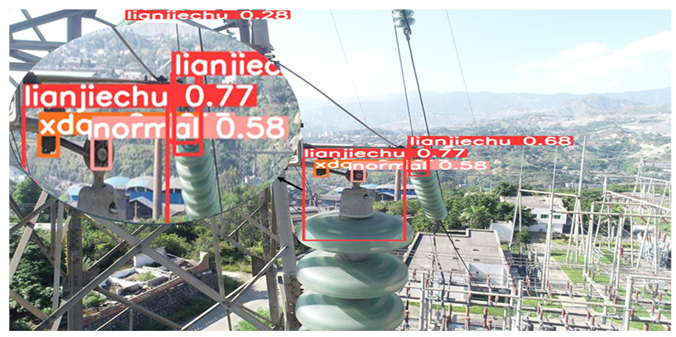 | 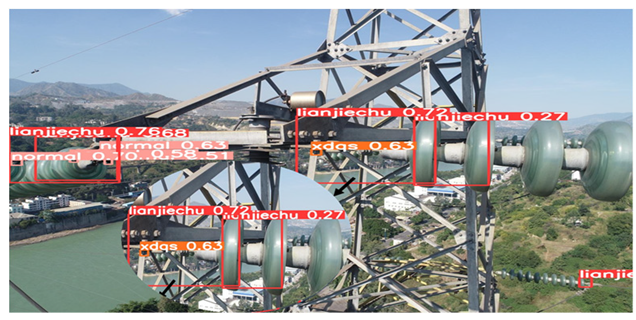 |
| RT-DETR-l | 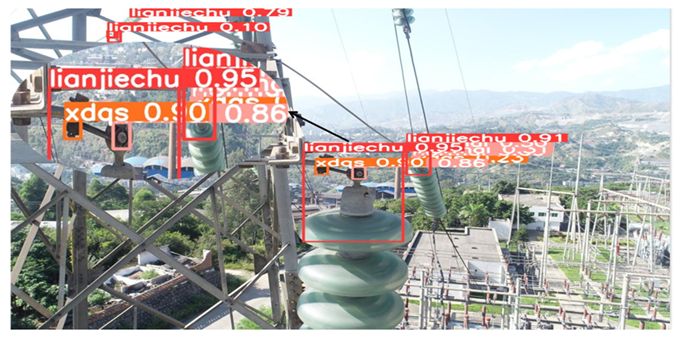 | 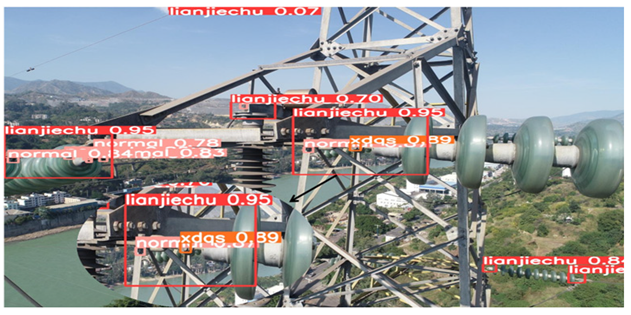 |
Disclaimer/Publisher’s Note: The statements, opinions and data contained in all publications are solely those of the individual author(s) and contributor(s) and not of MDPI and/or the editor(s). MDPI and/or the editor(s) disclaim responsibility for any injury to people or property resulting from any ideas, methods, instructions or products referred to in the content. |
© 2024 by the authors. Licensee MDPI, Basel, Switzerland. This article is an open access article distributed under the terms and conditions of the Creative Commons Attribution (CC BY) license (https://creativecommons.org/licenses/by/4.0/).
Share and Cite
Deng, X.; He, M.; Zheng, J.; Qin, L.; Liu, K. Research Progress on Power Visual Detection of Overhead Line Bolt Defects Based on UAV Images. Drones 2024, 8, 442. https://doi.org/10.3390/drones8090442
Deng X, He M, Zheng J, Qin L, Liu K. Research Progress on Power Visual Detection of Overhead Line Bolt Defects Based on UAV Images. Drones. 2024; 8(9):442. https://doi.org/10.3390/drones8090442
Chicago/Turabian StyleDeng, Xinlan, Min He, Jingwen Zheng, Liang Qin, and Kaipei Liu. 2024. "Research Progress on Power Visual Detection of Overhead Line Bolt Defects Based on UAV Images" Drones 8, no. 9: 442. https://doi.org/10.3390/drones8090442
APA StyleDeng, X., He, M., Zheng, J., Qin, L., & Liu, K. (2024). Research Progress on Power Visual Detection of Overhead Line Bolt Defects Based on UAV Images. Drones, 8(9), 442. https://doi.org/10.3390/drones8090442