
Temporal Monitoring of Simulated Burials in an Arid Environment Using RGB/Multispectral Sensor Unmanned Aerial Vehicles


Abstract
1. Introduction
2. Materials and Methods
2.1. Study Area
2.2. UAV Image Acquisition
2.3. UAV Platforms and Sensors
2.4. Image Processing
3. Results
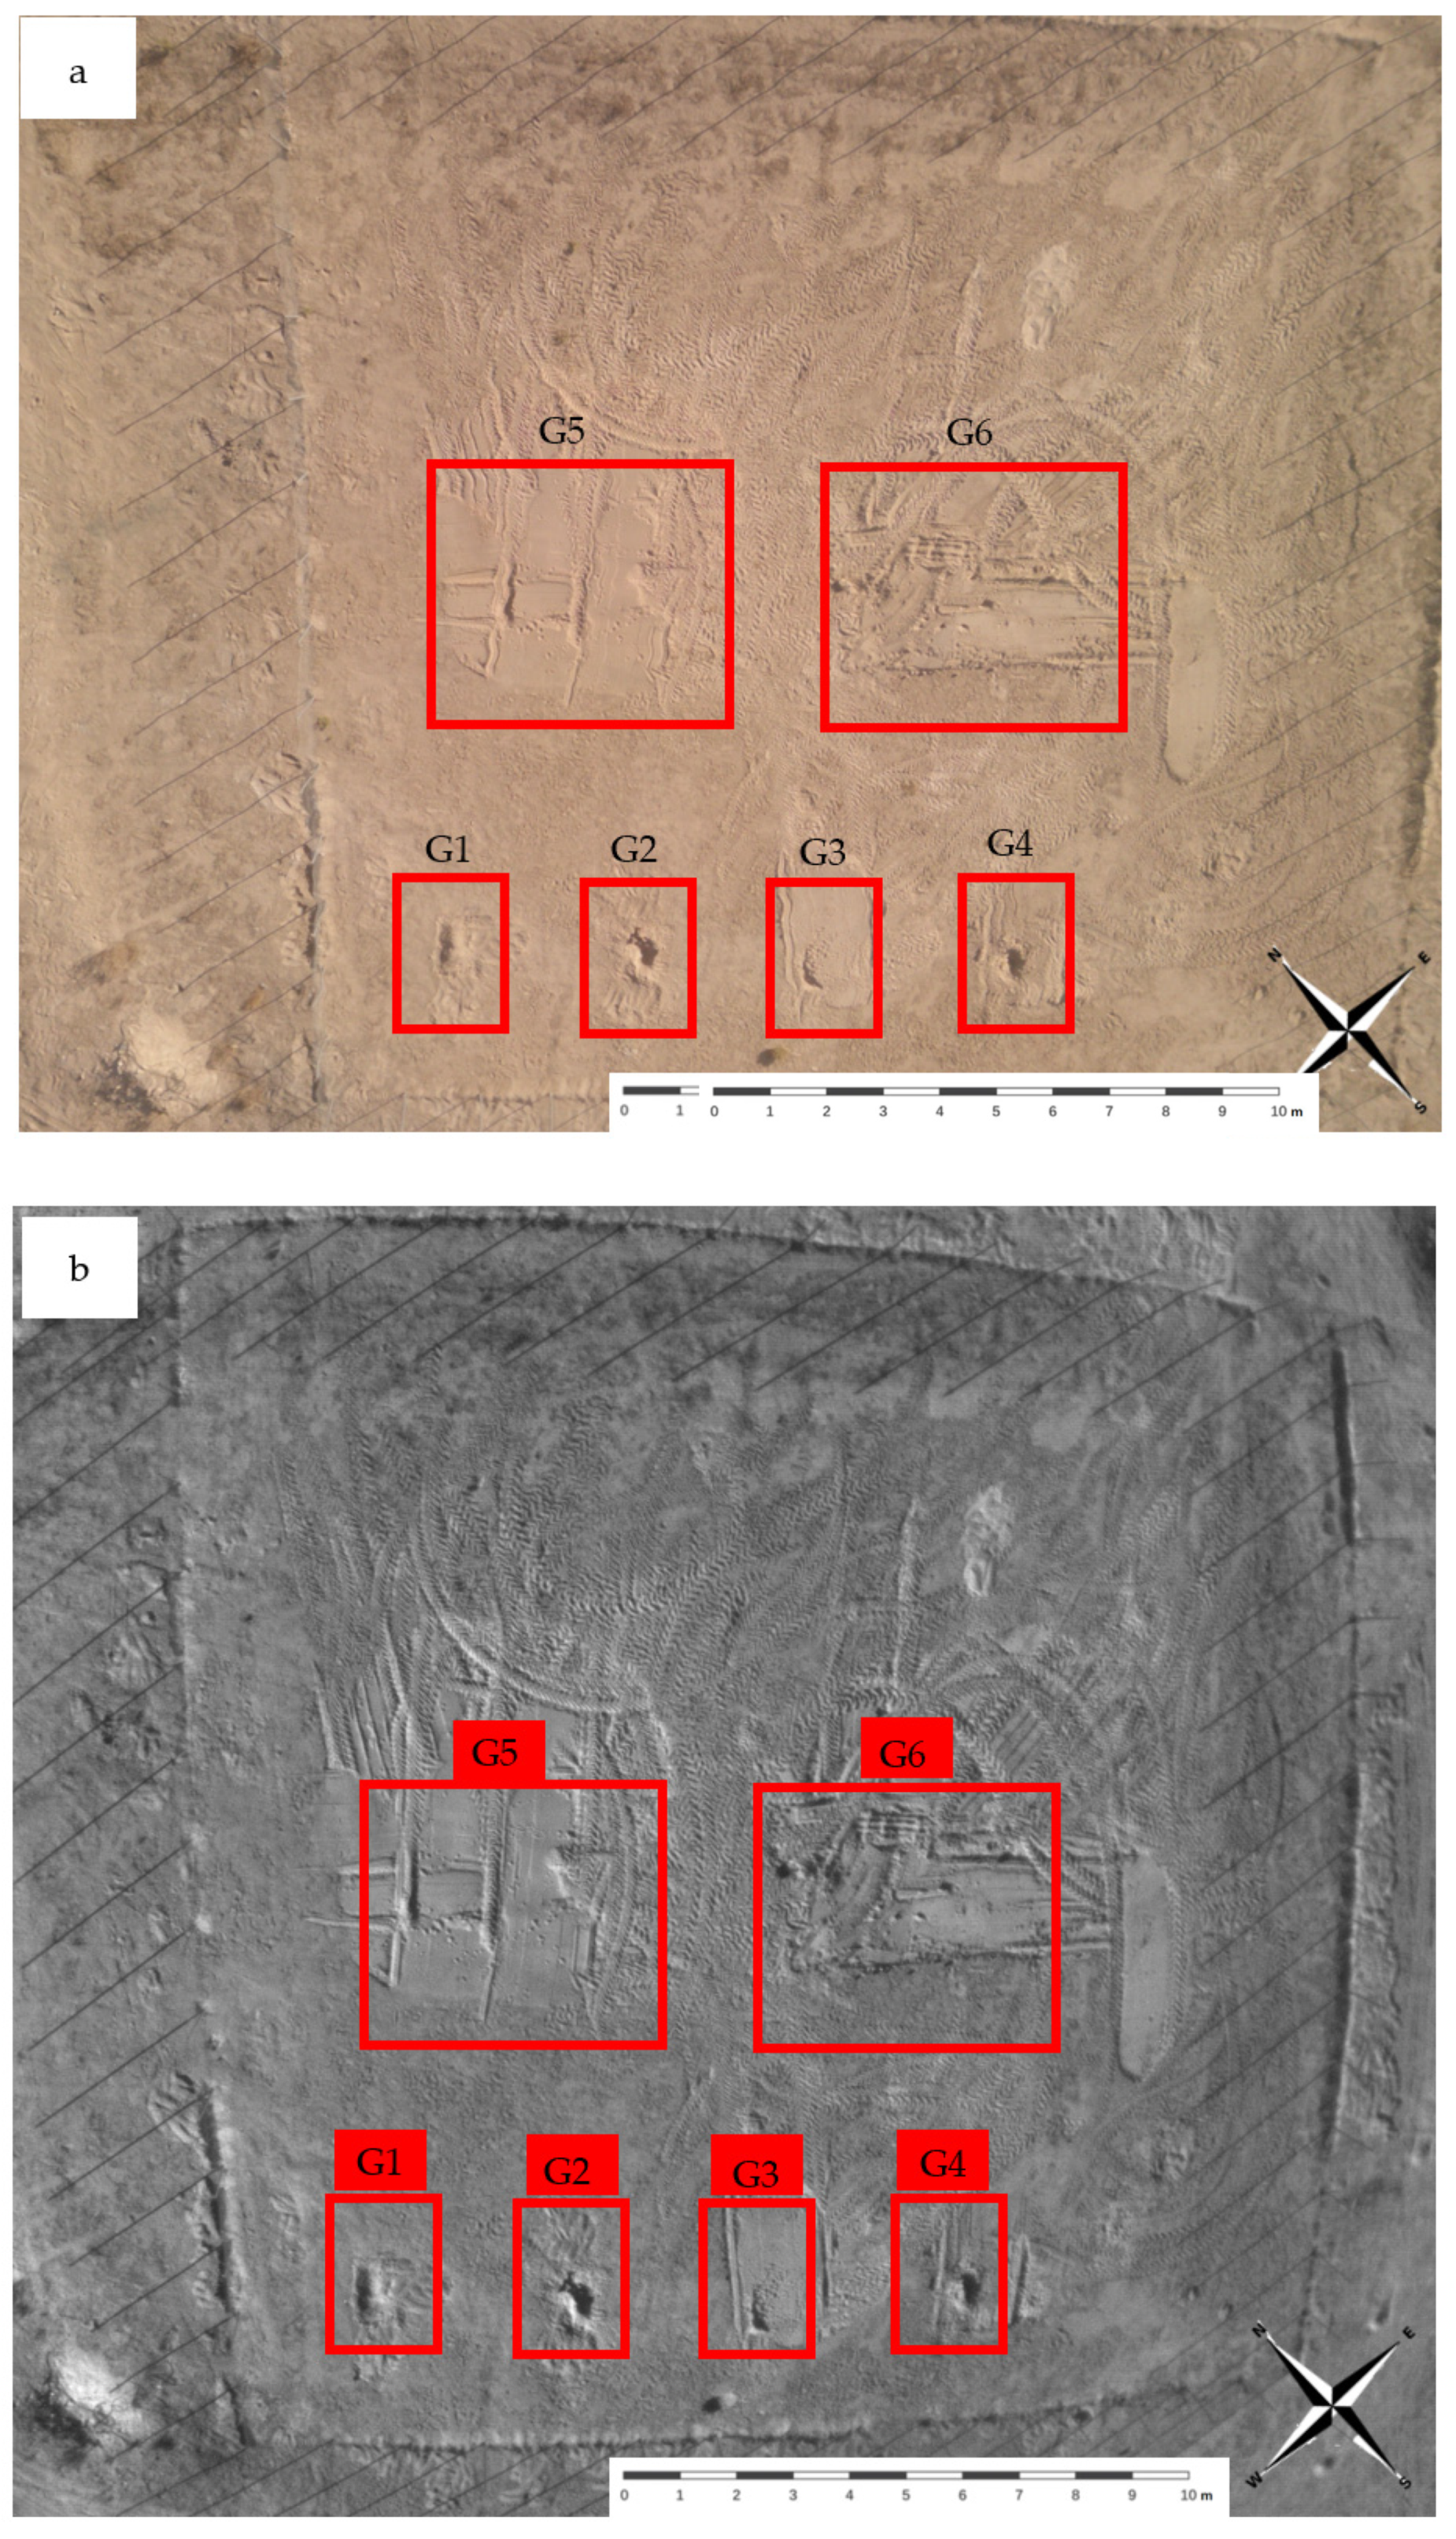
3.1. RGB Imaging
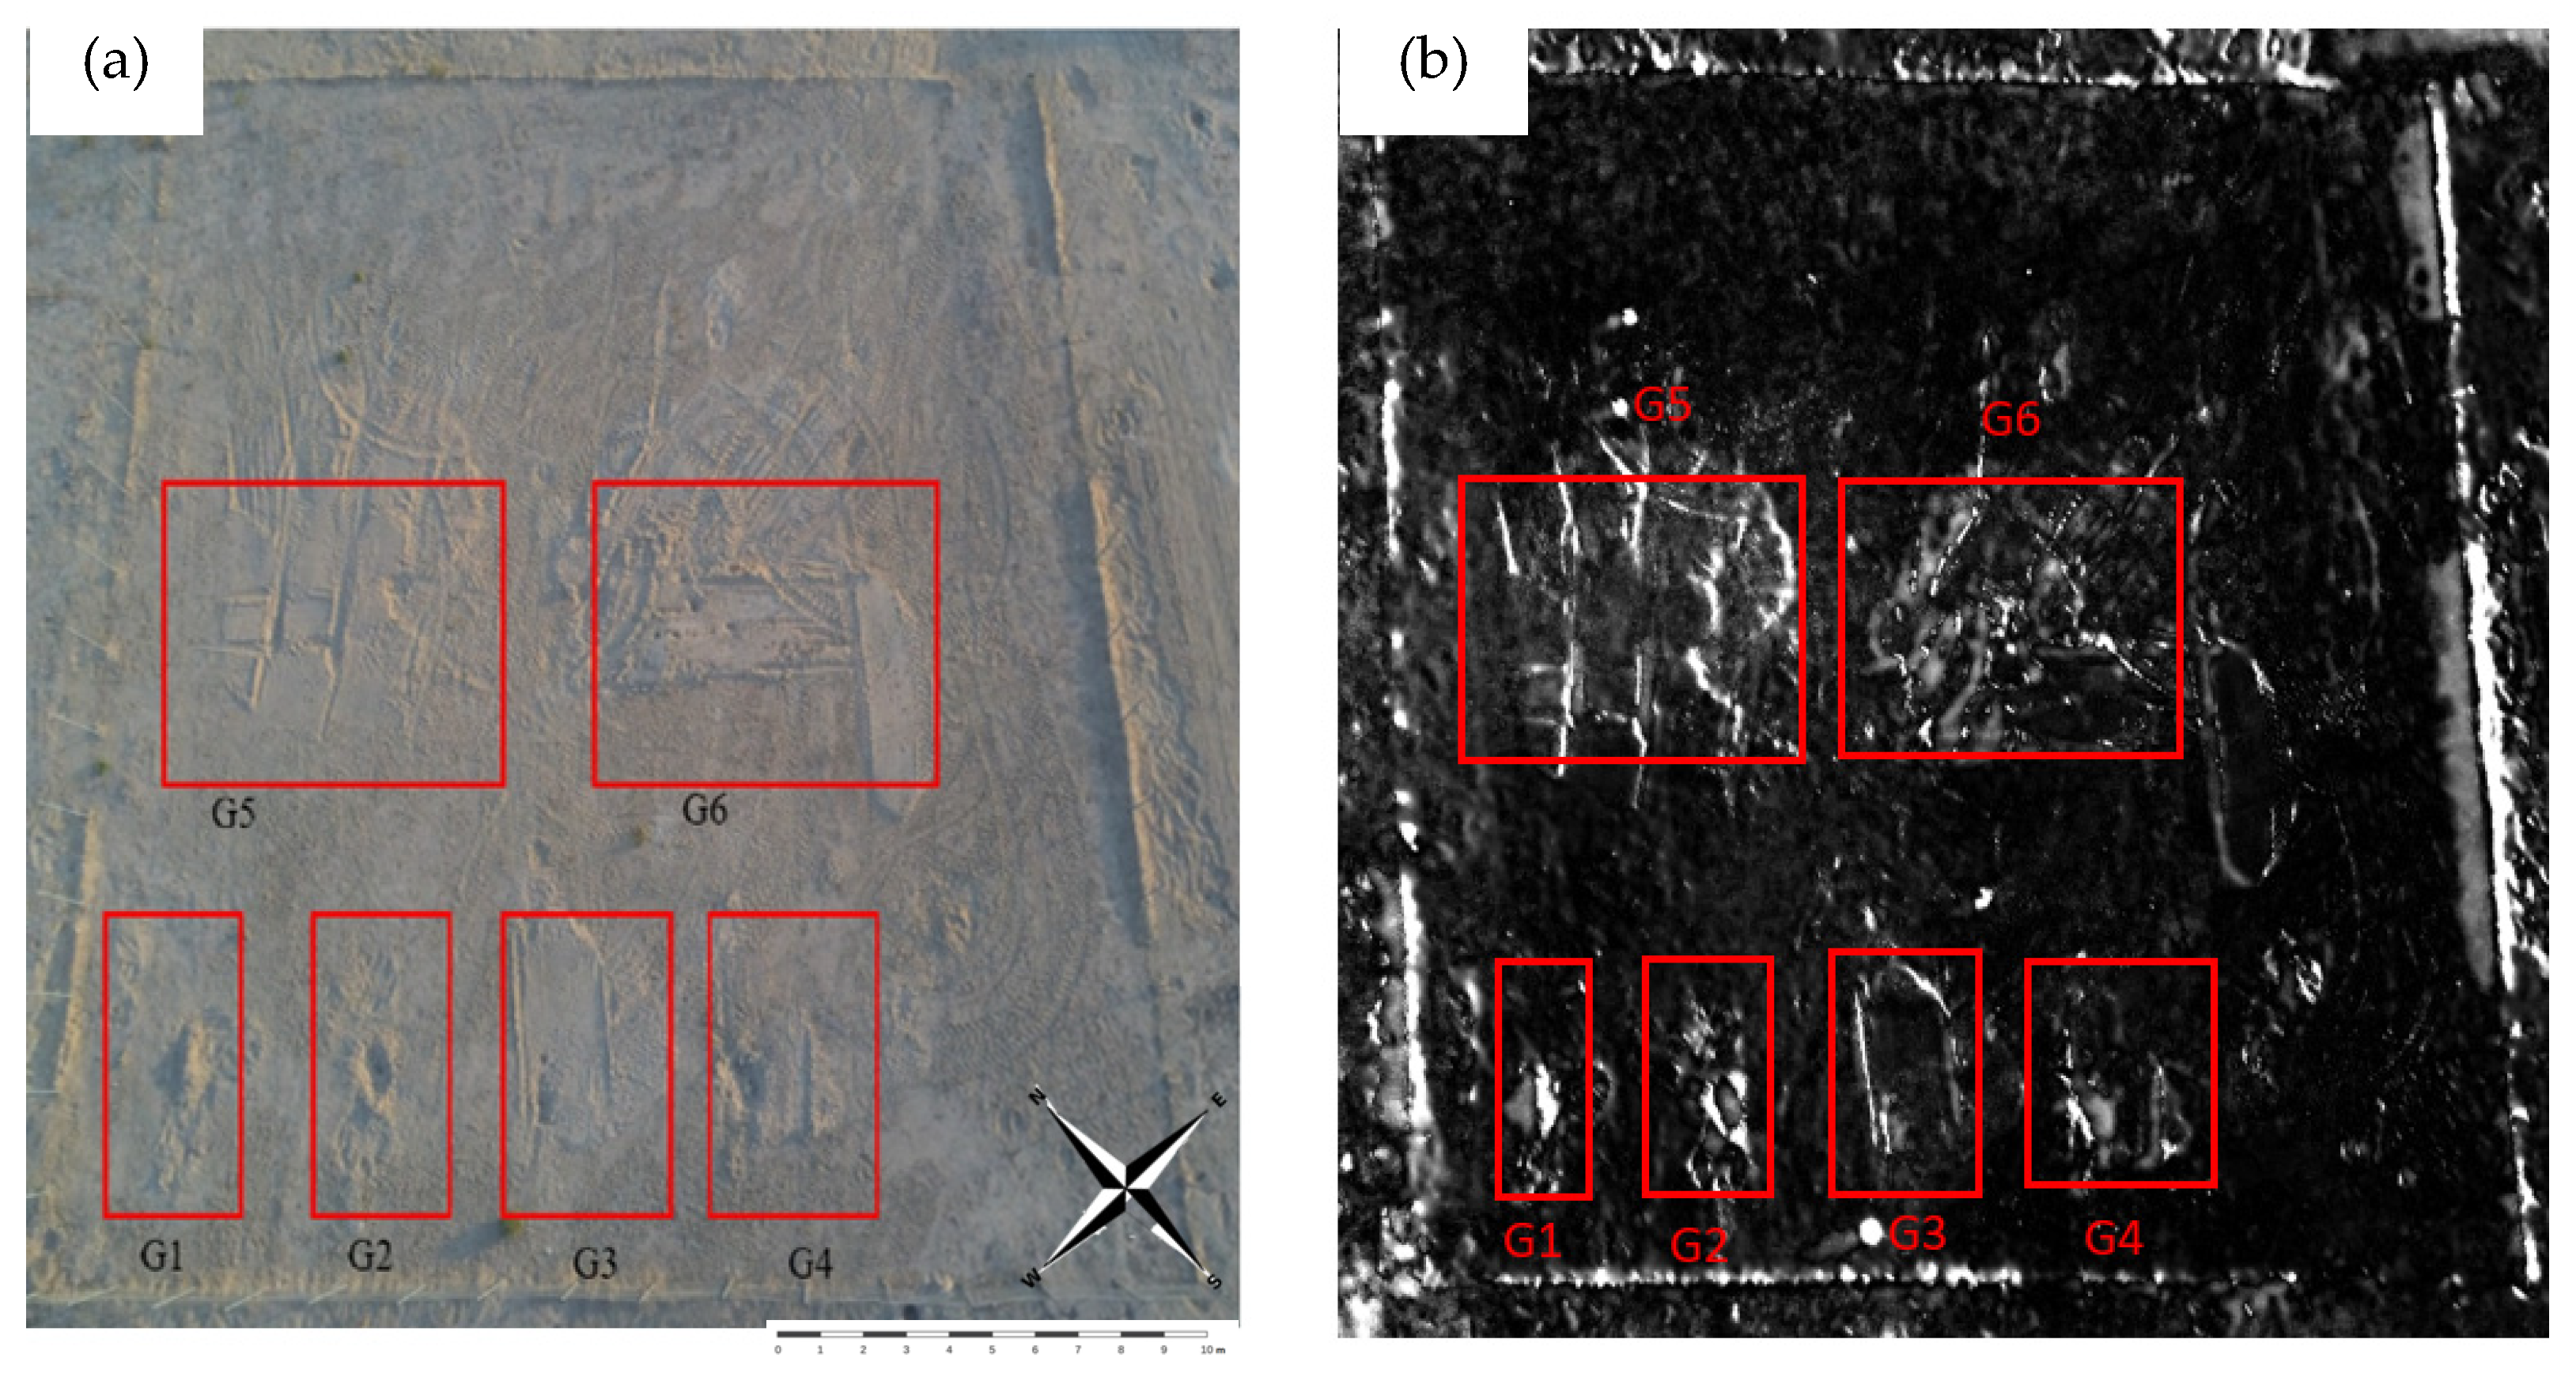
3.2. Multispectral Imaging
4. Discussion
4.1. RGB Sensor
4.1.1. nDSM
4.1.2. Anomaly Detection
4.2. MSI Sensor
4.2.1. Anomaly Detection
4.2.2. NDVI
4.3. Limitations
5. Conclusions
Author Contributions
Funding
Data Availability Statement
Acknowledgments
Conflicts of Interest
References
- Eliopoulos, C. Human rights violations in Ukraine: The need for forensic investigations. Lancet 2023, 402, 772–773. [Google Scholar] [CrossRef] [PubMed]
- Blau, S.; Sterenberg, J.; Weeden, P.; Urzedo, F.; Wright, R.; Watson, C. Exploring non-invasive approaches to assist in the detection of clandestine human burials: Developing a way forward. Forensic Sci. Res. 2018, 3, 304–326. [Google Scholar] [CrossRef] [PubMed] [PubMed Central]
- Abate, D.; Sturdy Colls, C.; Moyssi, N.; Karsili, D.; Faka, M.; Anilir, A.; Manolis, S. Optimizing search strategies in mass grave location through the combination of digital technologies. Forensic Sci. Int. 2019, 1, 95–107. [Google Scholar] [CrossRef] [PubMed] [PubMed Central]
- Rocke, B.; Ruffell, A. Detection of Single Burials Using Multispectral Drone Data: Three Case Studies. Forensic Sci. 2022, 2, 72–87. [Google Scholar] [CrossRef]
- Kalacska, M.E. The Application of Remote Sensing for Detecting Mass Graves: An Experimental Animal Case Study from Costa Rica. J. Forensic Sci. 2009, 54, 159–167. [Google Scholar] [CrossRef] [PubMed]
- Fernández-Álvarez, J.-P.; Rubio-Melendi, D.; Martínez-Velasco, A.; Pringle, J.K.; Aguilera, H.-D. Discovery of a mass grave from the Spanish Civil War using Ground Penetrating Radar and forensic archaeology. Forensic Sci. Int. 2016, 267, e10–e17. [Google Scholar] [CrossRef]
- Pollard, T.; Barton, P. The Use of First World War Aerial Photographs by Archaeologists: A Case Study from Fromelles, Northern France. In Archaeology from Historical Aerial and Satellite Archives; Hanson, W.S., Oltean, I.A., Eds.; Springer: New York, NY, USA, 2013; pp. 87–103. [Google Scholar]
- Parrott, E.; Panter, H.A.; Morrissey, J.; Bezombes, F. A Low Cost Approach to Disturbed Soil Detection Using Low Altitude Digital Imagery from an Unmanned Aerial Vehicle. Drones 2019, 3, 50. [Google Scholar] [CrossRef]
- Butters, O.; Krosch, M.N.; Roberts, M.; MacGregor, D. Application of forward-looking infrared (FLIR) imaging from an unmanned aerial platform in the search for decomposing remains. J. Forensic Sci. 2021, 66, 347–355. [Google Scholar] [CrossRef]
- Silván-Cárdenas, J.L.; Caccavari-Garza, A.; Quinto-Sánchez, M.E.; Madrigal-Gómez, J.M.; Coronado-Juárez, E.; Quiroz-Suarez, D. Assessing optical remote sensing for grave detection. Forensic Sci. Int. 2021, 329, 111064. [Google Scholar] [CrossRef]
- Corcoran, K.A.; Mundorff, A.Z.; White, D.A.; Emch, W.L. A novel application of terrestrial LIDAR to characterize elevation change at human grave surfaces in support of narrowing down possible unmarked grave locations. Forensic Sci. Int. 2018, 289, 320–328. [Google Scholar] [CrossRef]
- Silván-Cárdenas, J.L.; Corona-Romero, N.; Madrigal-Gómez, J.M.; Saavedra-Guerrero, A.; Cortés-Villafranco, T.; Coronado-Juárez, E. On the Detectability of Buried Remains with Hyperspectral Measurements. In Pattern Recognition; Lecture Notes in Computer Science; Springer: Cham, Switzerland, 2017; pp. 201–212. [Google Scholar]
- Alawadhi, A.; Eliopoulos, C.; Bezombes, F. The detection of clandestine graves in an arid environment using thermal imaging deployed from an unmanned aerial vehicle. J. Forensic Sci. 2023, 68, 1286–1291. [Google Scholar] [CrossRef] [PubMed]
- Almedeij, J. Modeling Rainfall Variability over Urban Areas: A Case Study for Kuwait. Sci. World 2012, 2012, 980738. [Google Scholar] [CrossRef]
- Schuldenrein, J.; Trimble, M.K.; Malin-Boyce, S.; Smith, M. Geoarchaeology, Forensics, and the Prosecution of Saddam Hussein: A Case Study from the Iraq War (2003–2011). Geoarchaeology 2017, 32, 130–156. [Google Scholar] [CrossRef]
- Al-Dossari, F. Almohima Alkubra: Masirat Albahth Aljinaee [The Grand Mission: The Criminal Investigation], 2nd ed.; Al Alfain: Hawally, Kuwait, 2018. [Google Scholar]
- Pringle, J.K.; Jervis, J.R.; Hansen, J.D.; Jones, G.M.; Cassidy, N.J.; Cassella, J.P. Geophysical Monitoring of Simulated Clandestine Graves Using Electrical and Ground-Penetrating Radar Methods: 0–3 Years After Burial. J. Forensic Sci. 2012, 57, 1467–1486. [Google Scholar] [CrossRef] [PubMed]
- Matuszewski, S.; Hall, M.J.R.; Moreau, G.; Schoenly, K.G.; Tarone, A.M.; Villet, M.H. Pigs vs. people: The use of pigs as analogues for humans in forensic entomology and taphonomy research. Int. J. Leg. Med. 2020, 134, 793–810. [Google Scholar] [CrossRef] [PubMed]
- DesMarais, A.M. Detection of Cadaveric Remains by Thermal Imaging Cameras. J. Forensic Identif. 2014, 64, 489–511. [Google Scholar]
- Teo, C.; Pawita, A.; Osman, K.; Ghani, A.A.; Hamzah, N.H. Post mortem changes in relation to different types of clothing. Malays. J. Pathol. 2013, 35, 77–85. [Google Scholar]
- Pix4D. Pix4Dcapture, 4.13.1 ed.; Pix4D: Lausanne, Switzerland, 2022. [Google Scholar]
- Pix4D. Pix4Dmapper Educational License, 4.6.4 ed.; Pix4D: Lausanne, Switzerland, 2022. [Google Scholar]
- Parrot. Parrot ANAFI Thermal; Parrot: Paris, France, 2020. [Google Scholar]
- Parrot. Parrot Bluegrass; Parrot: Paris, France, 2020. [Google Scholar]
- Booysen, R.; Gloaguen, R.; Lorenz, S.; Zimmermann, R.; Nex, P.A.M. Geological Remote Sensing. In Encyclopedia of Geology, 2nd ed.; Alderton, D., Elias, S.A., Eds.; Academic Press: Oxford, UK, 2021; pp. 301–314. [Google Scholar]
- Assmann, J.J.; Kerby, J.T.; Cunliffe, A.M.; Myers-Smith, I.H. Vegetation monitoring using multispectral sensors—Best practices and lessons learned from high latitudes. J. Unmanned Veh. Syst. 2018, 7, 54–75. [Google Scholar] [CrossRef]
- Aber, J.S.; Marzolff, I.; Ries, J.B. Chapter 3—Photogrammetry. In Small-Format Aerial Photography; Aber, J.S., Marzolff, I., Ries, J.B., Eds.; Elsevier: Amsterdam, The Netherlands, 2010; pp. 23–39. [Google Scholar]
- Exelis Visual Information Solutions, ENVI. 5.6 ed.; L3Harris Geospatial: Boulder, CO, USA, 2020.
- Reed, I.S.; Yu, X. Adaptive multiple-band CFAR detection of an optical pattern with unknown spectral distribution. IEEE Trans. Acoust. Speech Signal Process. 1990, 38, 1760–1770. [Google Scholar] [CrossRef]
- Chein, I.C.; Shao-Shan, C. Anomaly detection and classification for hyperspectral imagery. IEEE Trans. Geosci. Remote Sens. 2002, 40, 1314–1325. [Google Scholar] [CrossRef]
- ESRI. ArcGIS Desktop, 10.8.1.14362 ed.; ESRI: Redlands, CA, USA, 2002. [Google Scholar]
- Veerendra, T.M.; Latha, B.M.; Raghudathesh, G.P. Classification of Remotely Sensed Data using ENVI 4.7 Tool. Int. J. Res. Advent Technol. 2014, 2, 62–66. [Google Scholar]
- Sobotkova, A.; Ross, S.A. (Eds.) High-resolution, multi-spectral satellite imagery and extensive archaeological prospection: Case studies from Apulia, Italy and Kazanluk, Bulgaria. In Proceedings of the Third International Conference on Remote Sensing in Archaeology, Tiruchirappalli, India, 17–21 August 2009; Archaeopress: Haryana, India, 2010. [Google Scholar]
- Baluja, J.; Diago, M.P.; Balda, P.; Zorer, R.; Meggio, F.; Morales, F.; Tardaguila, J. Assessment of vineyard water status variability by thermal and multispectral imagery using an unmanned aerial vehicle (UAV). Irrig. Sci. 2012, 30, 511–522. [Google Scholar] [CrossRef]
- Casamitjana, M.; Torres-Madroñero, M.C.; Bernal-Riobo, J.; Varga, D. Soil Moisture Analysis by Means of Multispectral Images According to Land Use and Spatial Resolution on Andosols in the Colombian Andes. Appl. Sci. 2020, 10, 5540. [Google Scholar] [CrossRef]
- Korchagina, I.; Goleva, O.; Savchenko, Y.; Bozhikov, T. The use of geographic information systems for forest monitoring. J. Phys. Conf. Ser. 2020, 1515, 032077. [Google Scholar] [CrossRef]
- Barone, P.M.; Matsentidi, D.; Mollard, A.; Kulengowska, N.; Mistry, M. Mapping Decomposition: A Preliminary Study of Non-Destructive Detection of Simulated body Fluids in the Shallow Subsurface. Forensic Sci. 2022, 2, 620–634. [Google Scholar] [CrossRef]
- Dozal, L.; Silván-Cárdenas, J.; Moctezuma, D.; SSiordia, O.; Naredo, E. Evolutionary Approach for Detection of Buried Remains Using Hyperspectral Images. Photogramm. Eng. Remote Sens. 2018, 84, 435–450. [Google Scholar] [CrossRef]
- Leblanc, G.; Kalacska, M.; Soffer, R. Detection of single graves by airborne hyperspectral imaging. Forensic Sci. Int. 2014, 245, 17–23. [Google Scholar] [CrossRef] [PubMed]
- Molina, C.M.; Wisniewski, K.; Heaton, V.; Pringle Jamie, K.; Avila, E.F.; Herrera, L.A.; Guerrero, J.; Saumett, M.; Echeverry, R.; Duarte, M.; et al. Monitoring of simulated clandestine graves of dismembered victims using UAVs, electrical tomography, and GPR over one year to aid investigations of human rights violations in Colombia, South America. J. Forensic Sci. 2022, 67, 1060–1071. [Google Scholar] [CrossRef]
- Murray, B.; Anderson, D.; Wescott, D.; Moorhead, R.; Anderson, M. Survey and Insights into Unmanned Aerial-Vehicle-Based Detection and Documentation of Clandestine Graves and Human Remains. Hum. Biol. 2018, 90, 45–61. [Google Scholar] [CrossRef]
- Rocke, B.; Ruffell, A.; Donnelly, L. Drone aerial imagery for the simulation of a neonate burial based on the geoforensic search strategy (GSS). J. Forensic Sci. 2021, 66, 1506–1519. [Google Scholar] [CrossRef]
- Urbanová, P.; Jurda, M.; Vojtíšek, T.; Krajsa, J. Using drone-mounted cameras for on-site body documentation: 3D mapping and active survey. Forensic Sci. Int. 2017, 281, 52–62. [Google Scholar] [CrossRef]
- Evers, R. The application of low-altitude near-infrared aerial photography for detecting clandestine burials using a UAV and low-cost unmodified digital camera. Forensic Sci. Int. 2018, 289, 408. [Google Scholar] [CrossRef]
- Somma, R.; Cascio, M.; Silvestro, M.; Torre, E. A GIS-based Quantitative Approach for the Search of Clandestine Graves, Italy. J. Forensic Sci. 2018, 63, 882–898. [Google Scholar] [CrossRef] [PubMed]
- Pringle, J.K.; Ruffell, A.; Jervis, J.R.; Donnelly, L.; McKinley, J.; Hansen, J.; Morgan, R.; Pirrie, D.; Harrison, M. The use of geoscience methods for terrestrial forensic searches. Earth-Sci. Rev. 2012, 114, 108–123. [Google Scholar] [CrossRef]
- Sona, G.; Passoni, D.; Pinto, L.; Pagliari, D.; Masseroni, D.; Ortuani, B.; Facchi, A. UAV multispectral survey to map soil and crop for precision farming applications. Int. Arch. Photogramm. Remote Sens. Spat. Inf. Sci. 2016, XLI-B1, 1023–1029. [Google Scholar] [CrossRef]
- Mann, R.W.; Bass, W.M.; Meadows, L. Time since death and decomposition of the human body: Variables and observations in case and experimental field studies. J. Forensic Sci. 1990, 35, 103–111. [Google Scholar] [CrossRef] [PubMed]
- Watson, C.J.; Ueland, M.; Schotsmans, E.M.J.; Sterenberg, J.; Forbes, S.L.; Blau, S. Detecting grave sites from surface anomalies: A longitudinal study in an Australian woodland. J. Forensic Sci. 2021, 66, 479–490. [Google Scholar] [CrossRef]
- Dror, I.E.; Charlton, D.; Péron, A.E. Contextual information renders experts vulnerable to making erroneous identifications. Forensic Sci. Int. 2006, 156, 74–78. [Google Scholar] [CrossRef]


| Grave | Single/Mass Grave | Method of Digging | Depth (cm) | Grave Content | Control/ Experimental |
|---|---|---|---|---|---|
| G1 | Single | Hand dug | 30 | N/A | Control |
| G2 | Single | Hand dug | 40 | 1 sheep 2 shell cases 1 cotton sweater | Experimental |
| G3 | Single | Machine dug | 60 | N/A | Control |
| G4 | Single | Machine dug | 80 | 1 sheep 2 shell cases 1 cotton pants | Experimental |
| G5 | Mass | Machine dug | 150 | N/A | Control |
| G6 | Mass | Machine dug | 150 | 8 sheep 2 shell cases 1 denim jeans 2 cotton grey socks 1 cotton black dress 1 cotton white underwear | Experimental |
| Day Measured | Height Measured | Grave 1 | Grave 2 | Grave 3 | Grave 4 | Grave 5 | Grave 6 |
|---|---|---|---|---|---|---|---|
| Day of digging | On-ground | 12 | 12.5 | 3 | 0 | 6 | 17 |
| nDSM | 12.6 | 13.7 | 3.9 | 2.5 | 7.9 | 13.9 | |
| 1 day PB | On-ground | 12 | 6 | 0 | 0 | 6 | 7 |
| nDSM | 11.9 | 7 | 1 | 2.5 | 7 | 7 | |
| 3 days PB | On-ground | 10.8 | −8 | 0 | −9 | 6 | 5 |
| nDSM | 11.5 | 1 | 1 | 0 | 7 | 7 | |
| 1 week PB | On-ground | 8 | −10 | 0 | −9 | 4 | 5 |
| nDSM | 11 | 3 | 0 | 0 | 3.6 | 8.3 | |
| 2 weeks PB | On-ground | 8 | −10 | 0 | −11 | 4 | 5 |
| nDSM | 10 | 3 | 1 | 1 | 1 | 8.4 | |
| 3 weeks PB | On-ground | 8 | −8 | 0 | −10.5 | 4 | 4 |
| nDSM | 10 | 1 | 1 | 1 | 3 | 7 | |
| 1 month PB | On-ground | 8 | −10 | 0 | −11 | 4 | 4 |
| nDSM | 11 | 0.7 | 2.7 | 1 | 2.7 | 6.4 | |
| 2 months PB | On-ground | 8 | −10 | −1 | −12 | 4 | 3 |
| nDSM | 10 | 0.7 | 1.7 | 0.6 | 8 | 6.5 | |
| 3 months PB | On-ground | 7 | −10 | −2 | −12 | 3 | 3 |
| nDSM | 9.3 | 1.1 | 1.6 | 0.3 | 4 | 5.7 | |
| 6 months PB | On-ground | 5.5 | −6 | −5.5 | −10 | 0 | 4 |
| nDSM | 7.9 | 1.2 | 1.2 | 0.2 | 1.2 | 5.9 | |
| 7 months PB | On-ground | 5.5 | −6 | −6 | −8 | 0 | 3.2 |
| nDSM | 7.6 | 1.5 | 3.5 | 0.5 | 3.5 | 5.2 | |
| 9 months PB | On-ground | 5 | −3 | −5.5 | −9 | 0 | 3 |
| nDSM | 7.2 | 1.5 | 3.5 | 0.5 | 2.2 | 4.1 | |
| 10 months PB | On-ground | 3 | −2 | −2.5 | −5.5 | 0 | 2 |
| nDSM | 4.2 | 1.3 | 1.3 | 0.3 | 3.6 | 4.2 | |
| 11 months PB | On-ground | 3 | −1.5 | −2 | −4.5 | 0 | 2 |
| nDSM | 2.8 | 1.3 | 1.3 | 1.3 | 2.7 | 3.5 | |
| 12 months PB | On-ground | 2.5 | −1.5 | −1.5 | −4.5 | 0 | 2 |
| nDSM | 2 | 1.8 | 1.8 | 1.2 | 2.4 | 3.2 | |
| 15 months PB | On-ground | 2 | −1 | −1 | −2 | 0 | 1 |
| nDSM | 2.6 | 1.2 | 1.2 | 1.2 | 1.4 | 2.5 | |
| 18 months PB | On-ground | 1 | −1 | −1 | −1 | 0 | 1 |
| nDSM | 2.7 | 1.3 | 1.3 | 1.3 | 1.6 | 2.1 |
| Collection Date | Method of Detection | G1 | G2 | G3 | G4 | G5 | G6 |
|---|---|---|---|---|---|---|---|
| 1 day PB | RXD | ✓ | ✓ | ✓ | ✓ | ✓ | ✓ |
| 3 days PB | RXD | ✓ | ✓ | ✓ | ✓ | ✓ | ✓ |
| 7 days PB | RXD | ✓ | ✓ | ✓ | ✓ | ✓ | ✓ |
| 14 days PB | RXD | ✓ | ✓ | ✓ | ✓ | ✓ | ✓ |
| 21 days PB | RXD | ✓ | ✓ | ✓ | ✓ | ✓ | ✓ |
| 1 month PB | RXD | ✓ | ✓ | ✓ | ✓ | ✓ | ✓ |
| 2 months PB | RXD | ✓ | ✓ | ✓ | ✓ | ✓ | ✓ |
| 3 months PB | UTD | ✓ | ✓ | ✓ | ✓ | ✓ | |
| 6 months PB | UTD | ✓ | ✓ | ✓ | ✓ | ||
| 7 months PB | UTD | ✓ | ✓ | ✓ | ✓ | ✓ | ✓ |
| 9 months PB | UTD | ✓ | ✓ | ✓ | |||
| 10 months PB | UTD | ✓ | ✓ | ✓ | ✓ | ✓ | ✓ |
| 11 months PB | UTD | ✓ | ✓ | ✓ | ✓ | ✓ | ✓ |
| 12 months PB | UTD | ✓ | ✓ | ✓ | ✓ | ✓ | ✓ |
| 15 months PB | RXD | ✓ | ✓ | ✓ | ✓ | ||
| 18 months PB | RXD | ✓ | ✓ | ✓ | ✓ | ✓ | ✓ |
| Collection Date | Bands Detection Level | |||
|---|---|---|---|---|
| High | Low | |||
| 1 day PB | Red-Edge | NIR | Red | Green |
| 3 days PB | Red-Edge | NIR | Red | Green |
| 7 days PB | Red-Edge | NIR | Red | Green |
| 14 days PB | NIR | Red | Red-Edge | Green |
| 21 days PB | NIR | Red-Edge | Red | Green |
| 1 month PB | NIR | Red | Red-Edge | Green |
| 2 months PB | NIR | Red | Red-Edge | Green |
| 3 months PB | NIR | Red | Red-Edge | Green |
| 6 months PB | NIR | Red-Edge | Red | Green |
| 7 months PB | NIR | Red-Edge | Red | Green |
| 9 months PB | NIR | Red-Edge | Red | Green |
| 10 months PB | Red-Edge | NIR | Red | Green |
| 11 months PB | NIR | Red-Edge | Red | Green |
| 12 months PB | Red-Edge | NIR | Red | Green |
| 15 months PB | NIR | Red-Edge | Red | Green |
| 18 months PB | NIR | Red-Edge | Red | Green |
| Collection Date | Method of Detection | G1 | G2 | G3 | G4 | G5 | G6 |
|---|---|---|---|---|---|---|---|
| 1 day PB | UTD | ✓ | ✓ | ✓ | ✓ | ✓ | ✓ |
| 3 days PB | UTD | ✓ | ✓ | ✓ | ✓ | ✓ | ✓ |
| 7 days PB | UTD | ✓ | ✓ | ✓ | ✓ | ✓ | ✓ |
| 14 days PB | RXD-UTD | ✓ | ✓ | ✓ | ✓ | ✓ | ✓ |
| 21 days PB | RXD-UTD | ✓ | ✓ | ✓ | ✓ | ✓ | ✓ |
| 1 month PB | RXD-UTD | ✓ | ✓ | ✓ | ✓ | ✓ | ✓ |
| 2 months PB | RXD-UTD | ✓ | ✓ | ✓ | ✓ | ✓ | |
| 3 months PB | RXD-UTD | ✓ | ✓ | ✓ | |||
| 6 months PB | RXD | ✓ | ✓ | ✓ | ✓ | ✓ | ✓ |
| 7 months PB | RXD | ✓ | ✓ | ✓ | ✓ | ✓ | ✓ |
| 9 months PB | RXD-UTD | ✓ | ✓ | ✓ | ✓ | ✓ | |
| 10 months PB | UTD | ||||||
| 11 months PB | RXD-UTD | ✓ | ✓ | ✓ | ✓ | ✓ | |
| 12 months PB | RXD-UTD | ✓ | ✓ | ✓ | ✓ | ✓ | ✓ |
| 15 months PB | UTD | ✓ | ✓ | ✓ | ✓ |
| Collection Date | Highest Value | Lowest Value | G1 | G2 | G3 | G4 | G5 | G6 |
|---|---|---|---|---|---|---|---|---|
| 3 days PB | 0.19 | 0.03 | 0.04 | 0.04 | 0.08 | 0.07 | 0.1 | 0.15 |
| 7 days PB | 0.17 | 0.03 | 0.04 | 0.04 | 0.09 | 0.08 | 0.15 | 0.16 |
| 14 days PB | 0.12 | 0.02 | 0.03 | 0.04 | 0.07 | 0.09 | 0.15 | 0.17 |
| 21 days PB | 0.12 | 0.02 | 0.02 | 0.02 | 0.03 | 0.04 | 0.09 | 0.12 |
| 1 month PB | 0.14 | 0.04 | 0.02 | 0.02 | 0.03 | 0.04 | 0.1 | 0.13 |
| 2 months PB | 0.2 | 0.06 | 0.06 | 0.07 | 0.07 | 0.08 | 0.19 | 0.2 |
| 3 months PB | 0.17 | 0.06 | 0.07 | 0.07 | 0.09 | 0.08 | 0.16 | 0.17 |
| 6 months PB | 0.49 | 0.2 | 0.25 | 0.27 | 0.31 | 0.32 | 0.42 | 0.48 |
| 7 months PB | 0.56 | 0.3 | 0.23 | 0.24 | 0.29 | 0.31 | 0.4 | 0.56 |
| 9 months PB | 0.43 | 0.2 | 0.2 | 0.2 | 0.25 | 0.27 | 0.38 | 0.42 |
| 10 months PB | 0.35 | 0.12 | 0.14 | 0.13 | 0.2 | 0.22 | 0.31 | 0.34 |
| 11 months PB | 0.32 | 0.08 | 0.09 | 0.08 | 0.19 | 0.21 | 0.25 | 0.3 |
| 12 months PB | 0.21 | 0.05 | 0.07 | 0.08 | 0.12 | 0.14 | 0.21 | 0.21 |
| 15 months PB | 0.18 | 0.04 | 0.06 | 0.06 | 0.09 | 0.07 | 0.15 | 0.16 |
| 18 months PB | 0.35 | 0.07 | 0.07 | 0.07 | 0.09 | 0.08 | 0.17 | 0.18 |
Disclaimer/Publisher’s Note: The statements, opinions and data contained in all publications are solely those of the individual author(s) and contributor(s) and not of MDPI and/or the editor(s). MDPI and/or the editor(s) disclaim responsibility for any injury to people or property resulting from any ideas, methods, instructions or products referred to in the content. |
© 2024 by the authors. Licensee MDPI, Basel, Switzerland. This article is an open access article distributed under the terms and conditions of the Creative Commons Attribution (CC BY) license (https://creativecommons.org/licenses/by/4.0/).
Share and Cite
Alawadhi, A.; Eliopoulos, C.; Bezombes, F. Temporal Monitoring of Simulated Burials in an Arid Environment Using RGB/Multispectral Sensor Unmanned Aerial Vehicles. Drones 2024, 8, 444. https://doi.org/10.3390/drones8090444
Alawadhi A, Eliopoulos C, Bezombes F. Temporal Monitoring of Simulated Burials in an Arid Environment Using RGB/Multispectral Sensor Unmanned Aerial Vehicles. Drones. 2024; 8(9):444. https://doi.org/10.3390/drones8090444
Chicago/Turabian StyleAlawadhi, Abdullah, Constantine Eliopoulos, and Frederic Bezombes. 2024. "Temporal Monitoring of Simulated Burials in an Arid Environment Using RGB/Multispectral Sensor Unmanned Aerial Vehicles" Drones 8, no. 9: 444. https://doi.org/10.3390/drones8090444
APA StyleAlawadhi, A., Eliopoulos, C., & Bezombes, F. (2024). Temporal Monitoring of Simulated Burials in an Arid Environment Using RGB/Multispectral Sensor Unmanned Aerial Vehicles. Drones, 8(9), 444. https://doi.org/10.3390/drones8090444