
Estimating Methane Emissions in Rice Paddies at the Parcel Level Using Drone-Based Time Series Vegetation Indices

 ,
,  , , , , and
Abstract
:1. Introduction
2. Materials and Methods
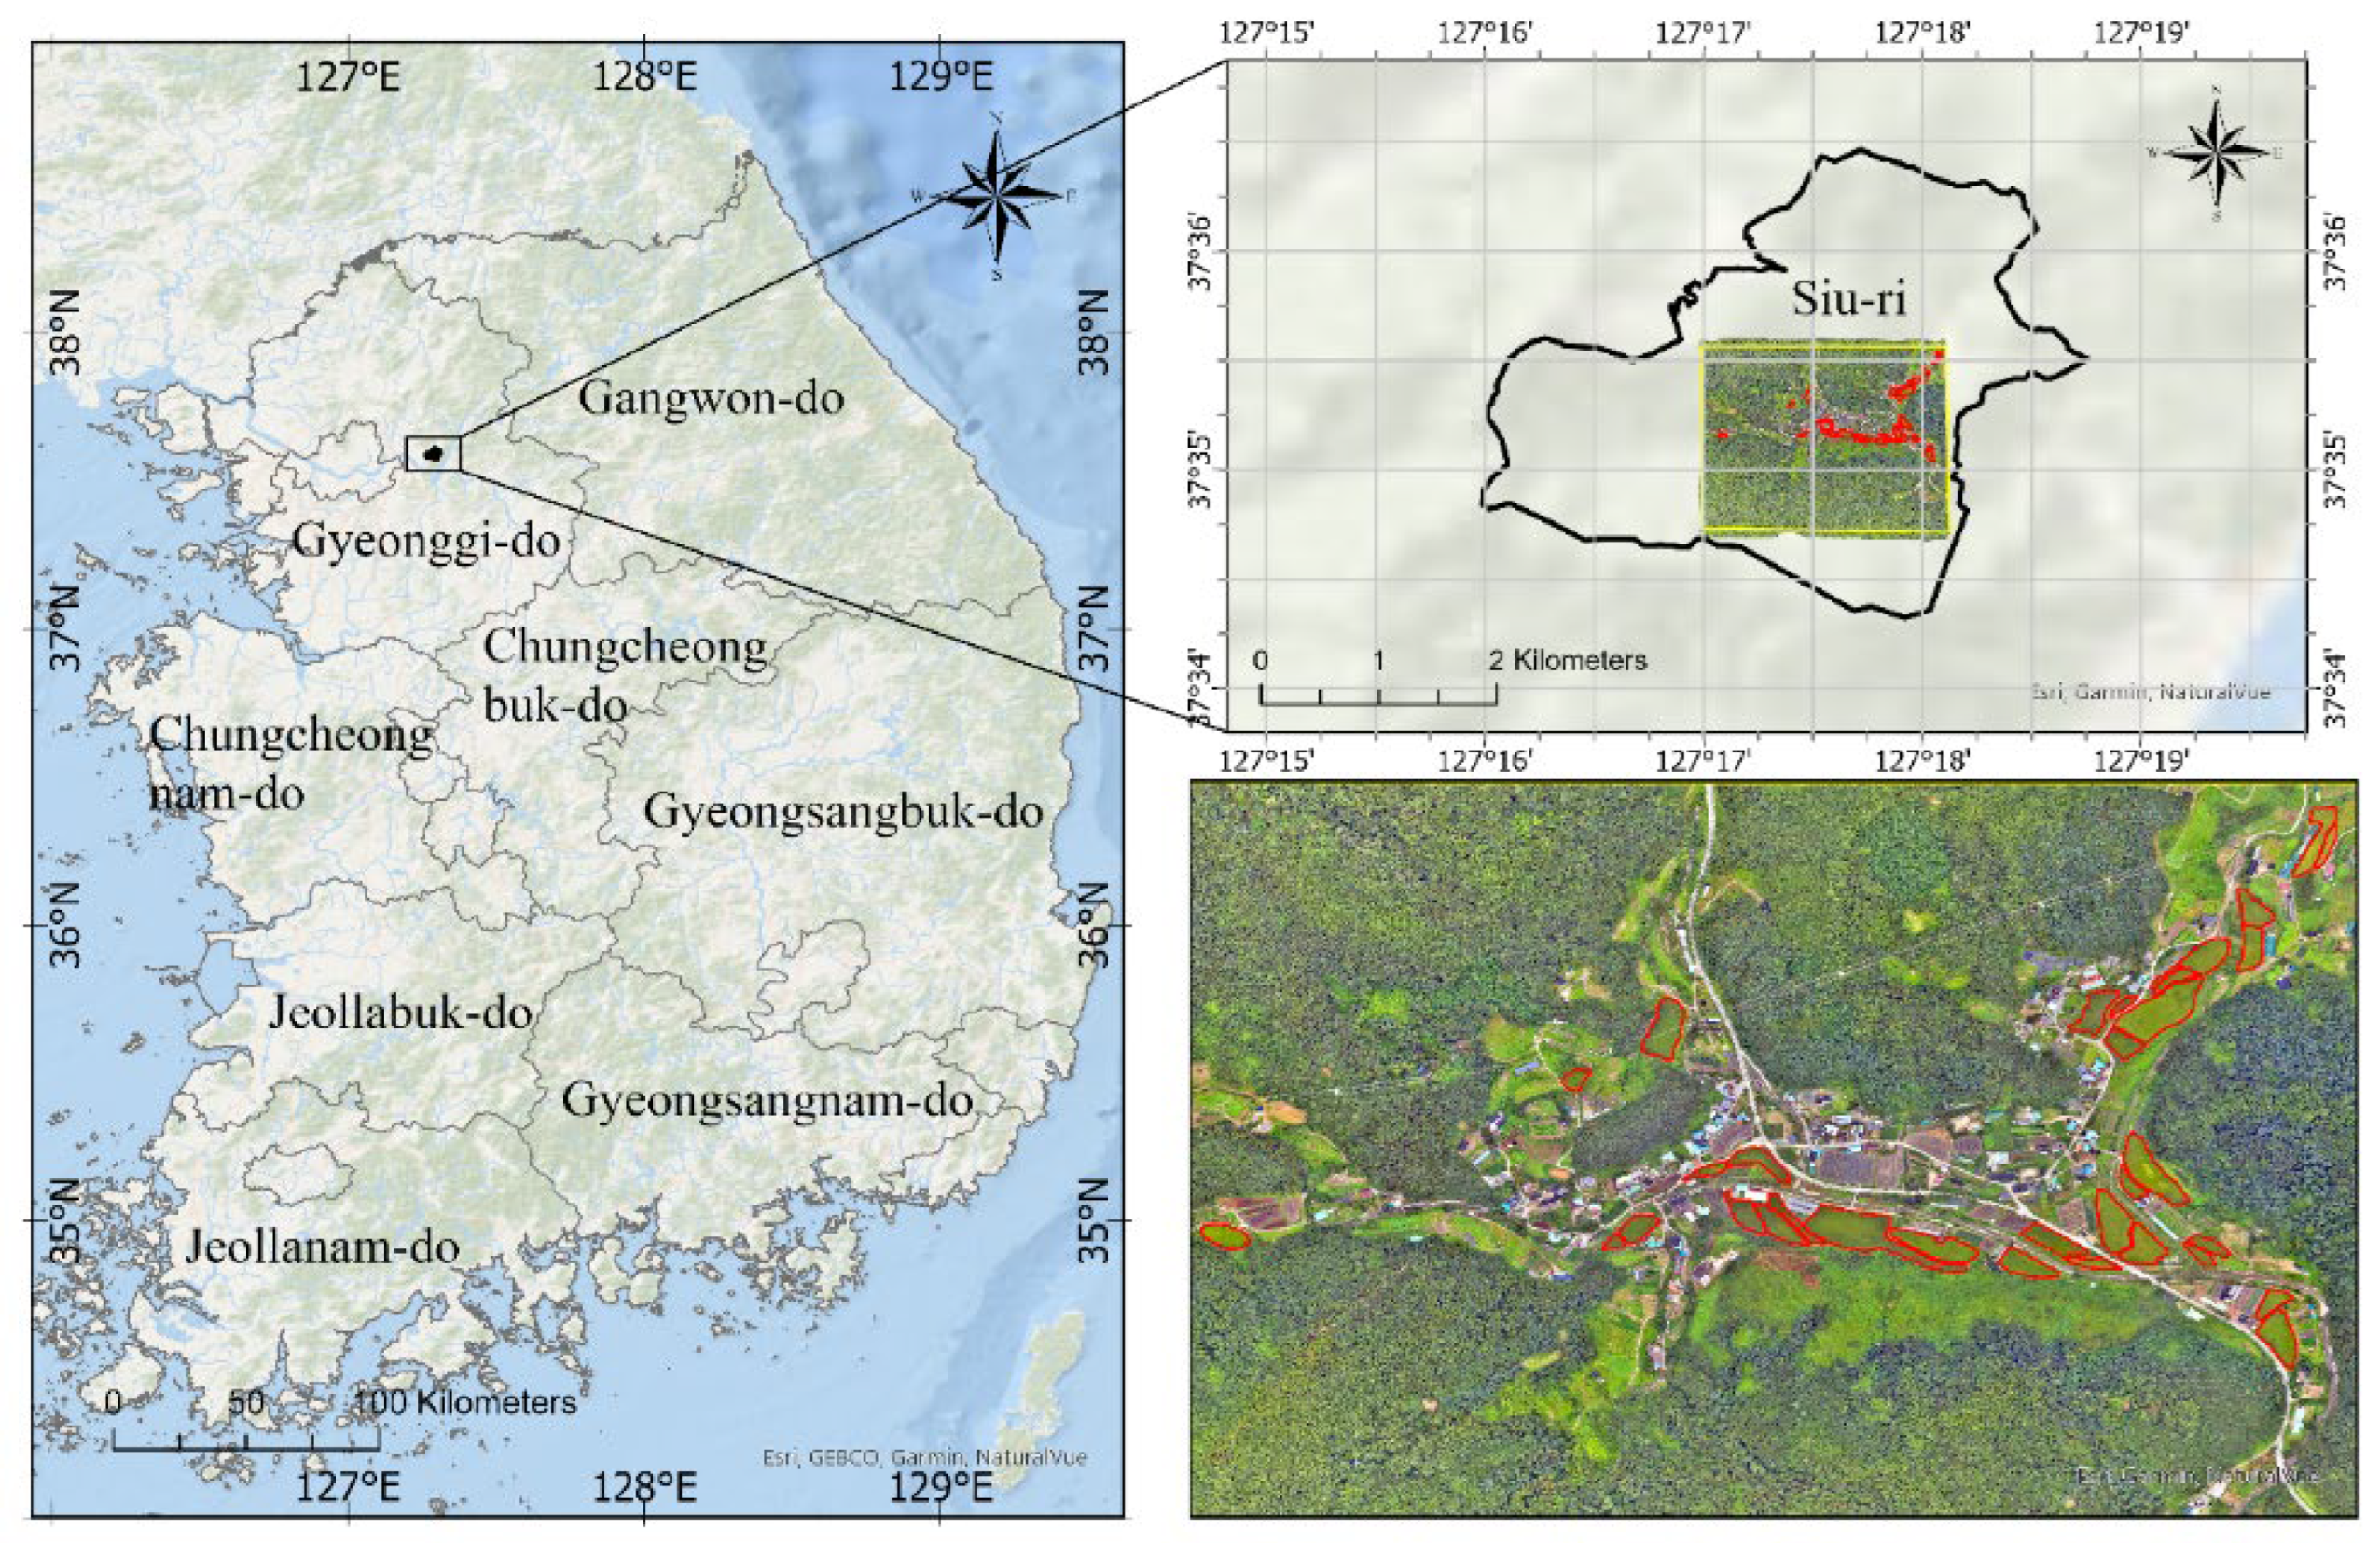
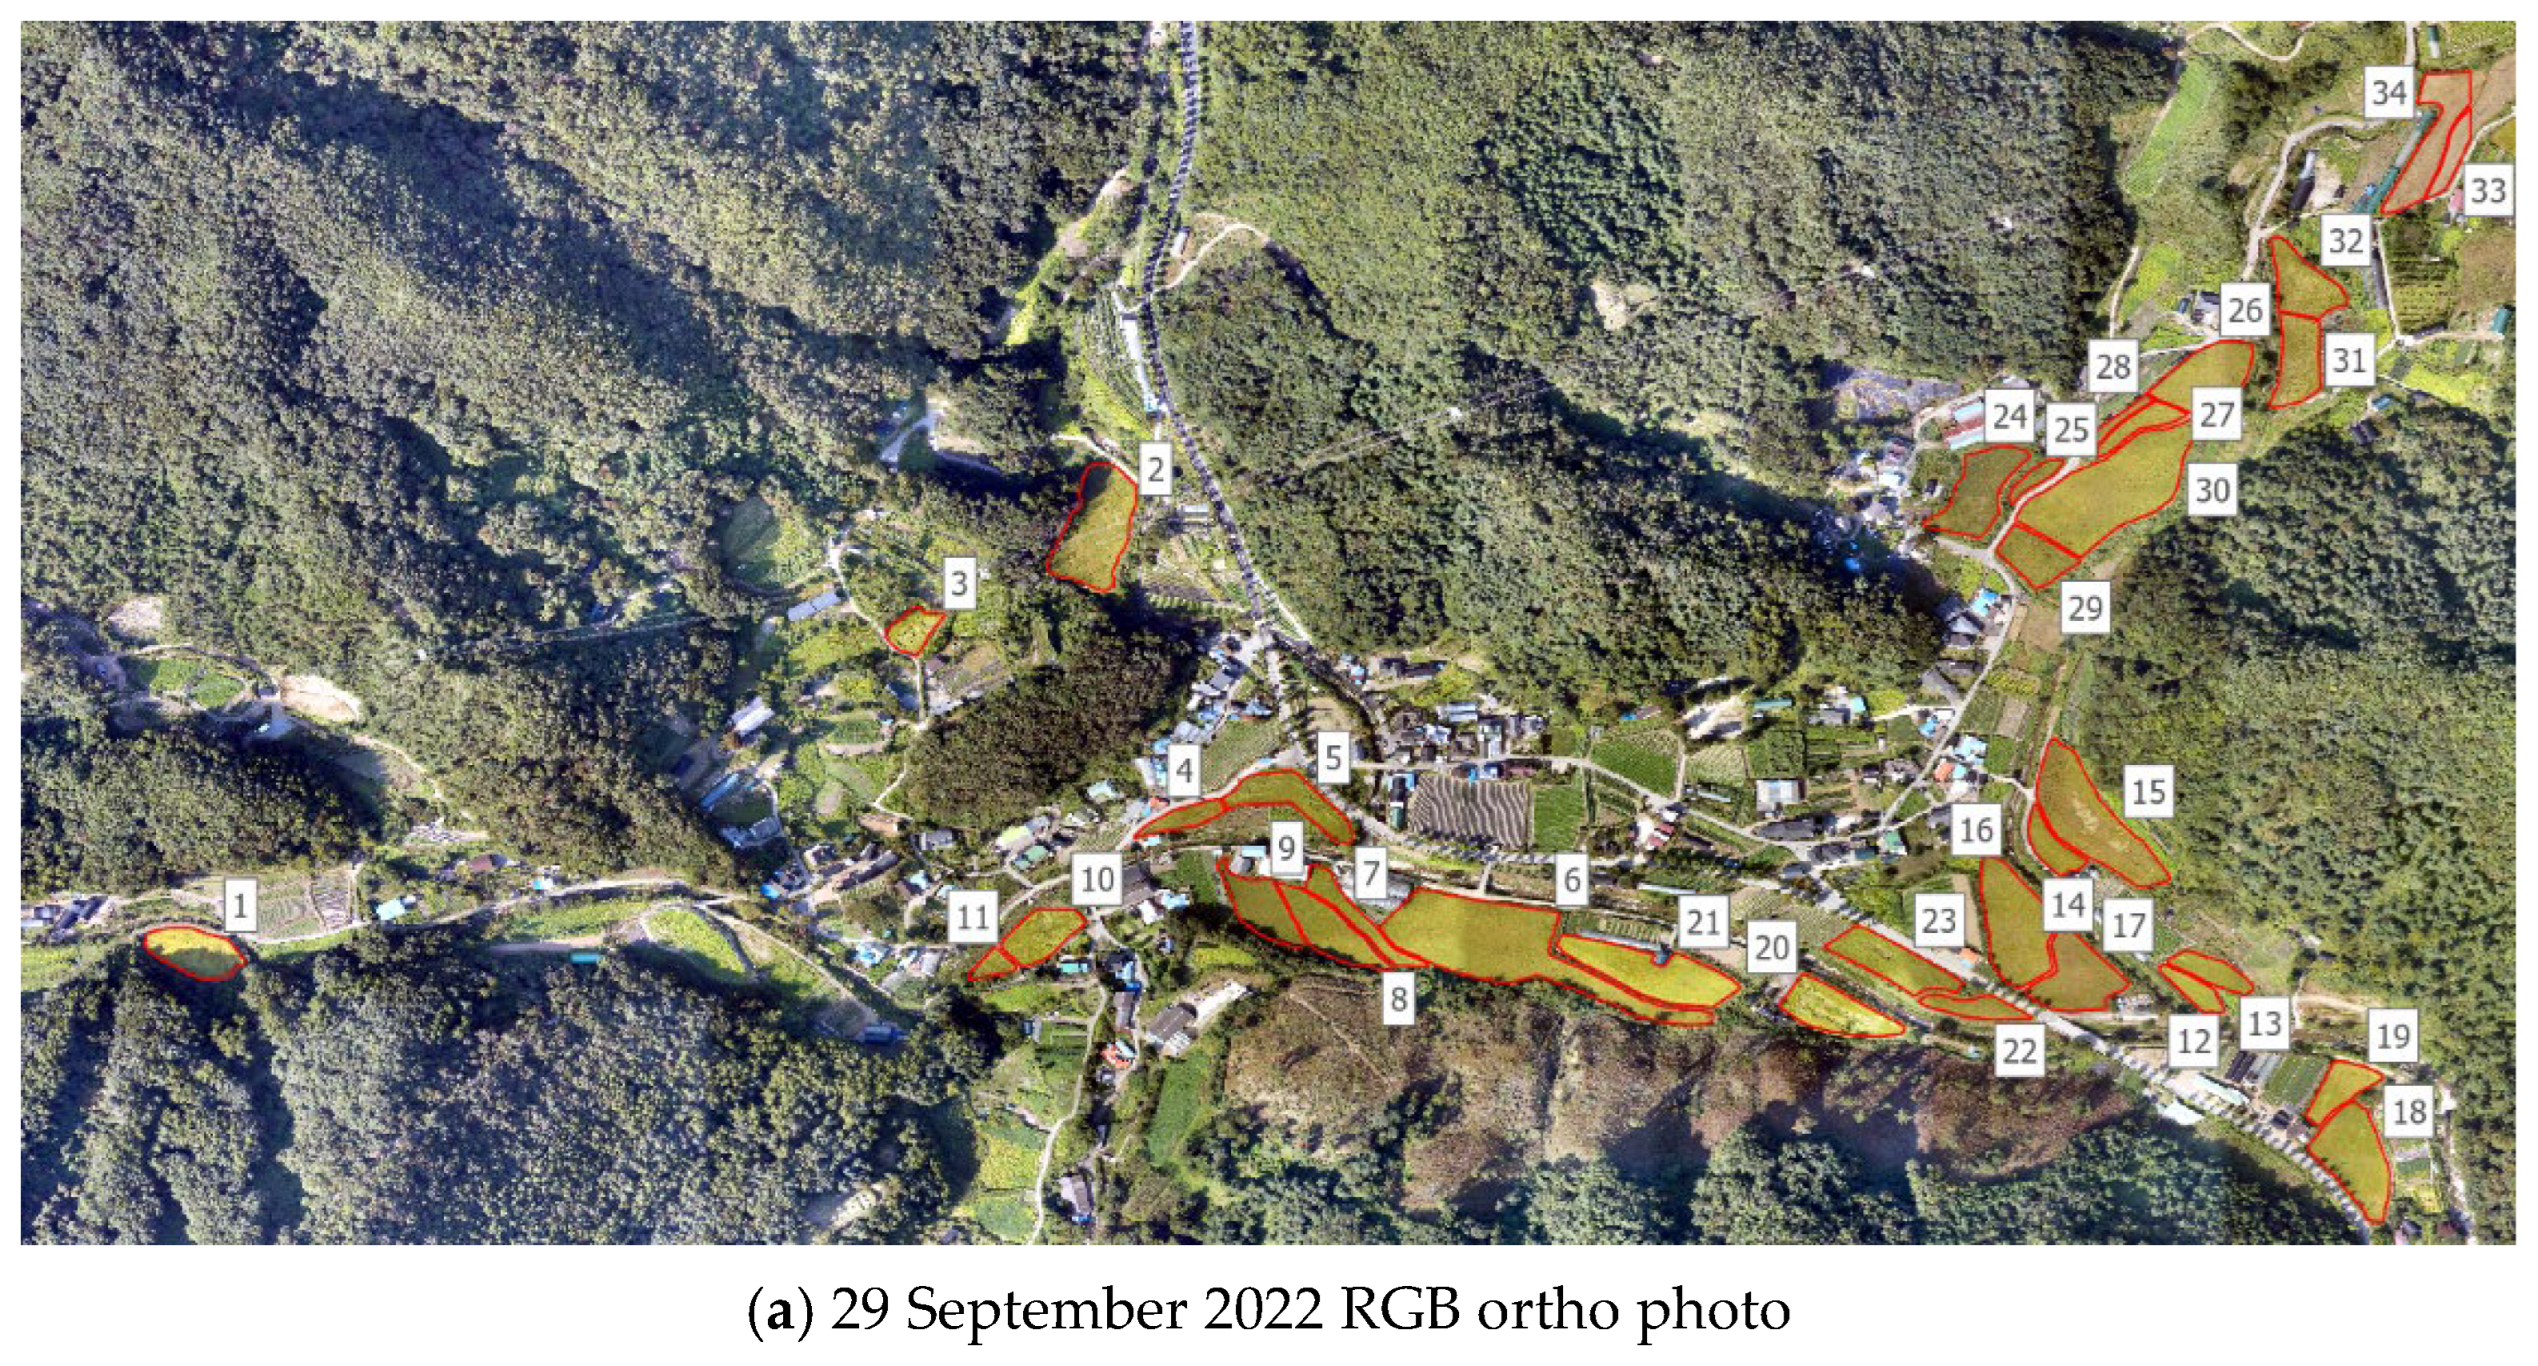
2.1. Study Area
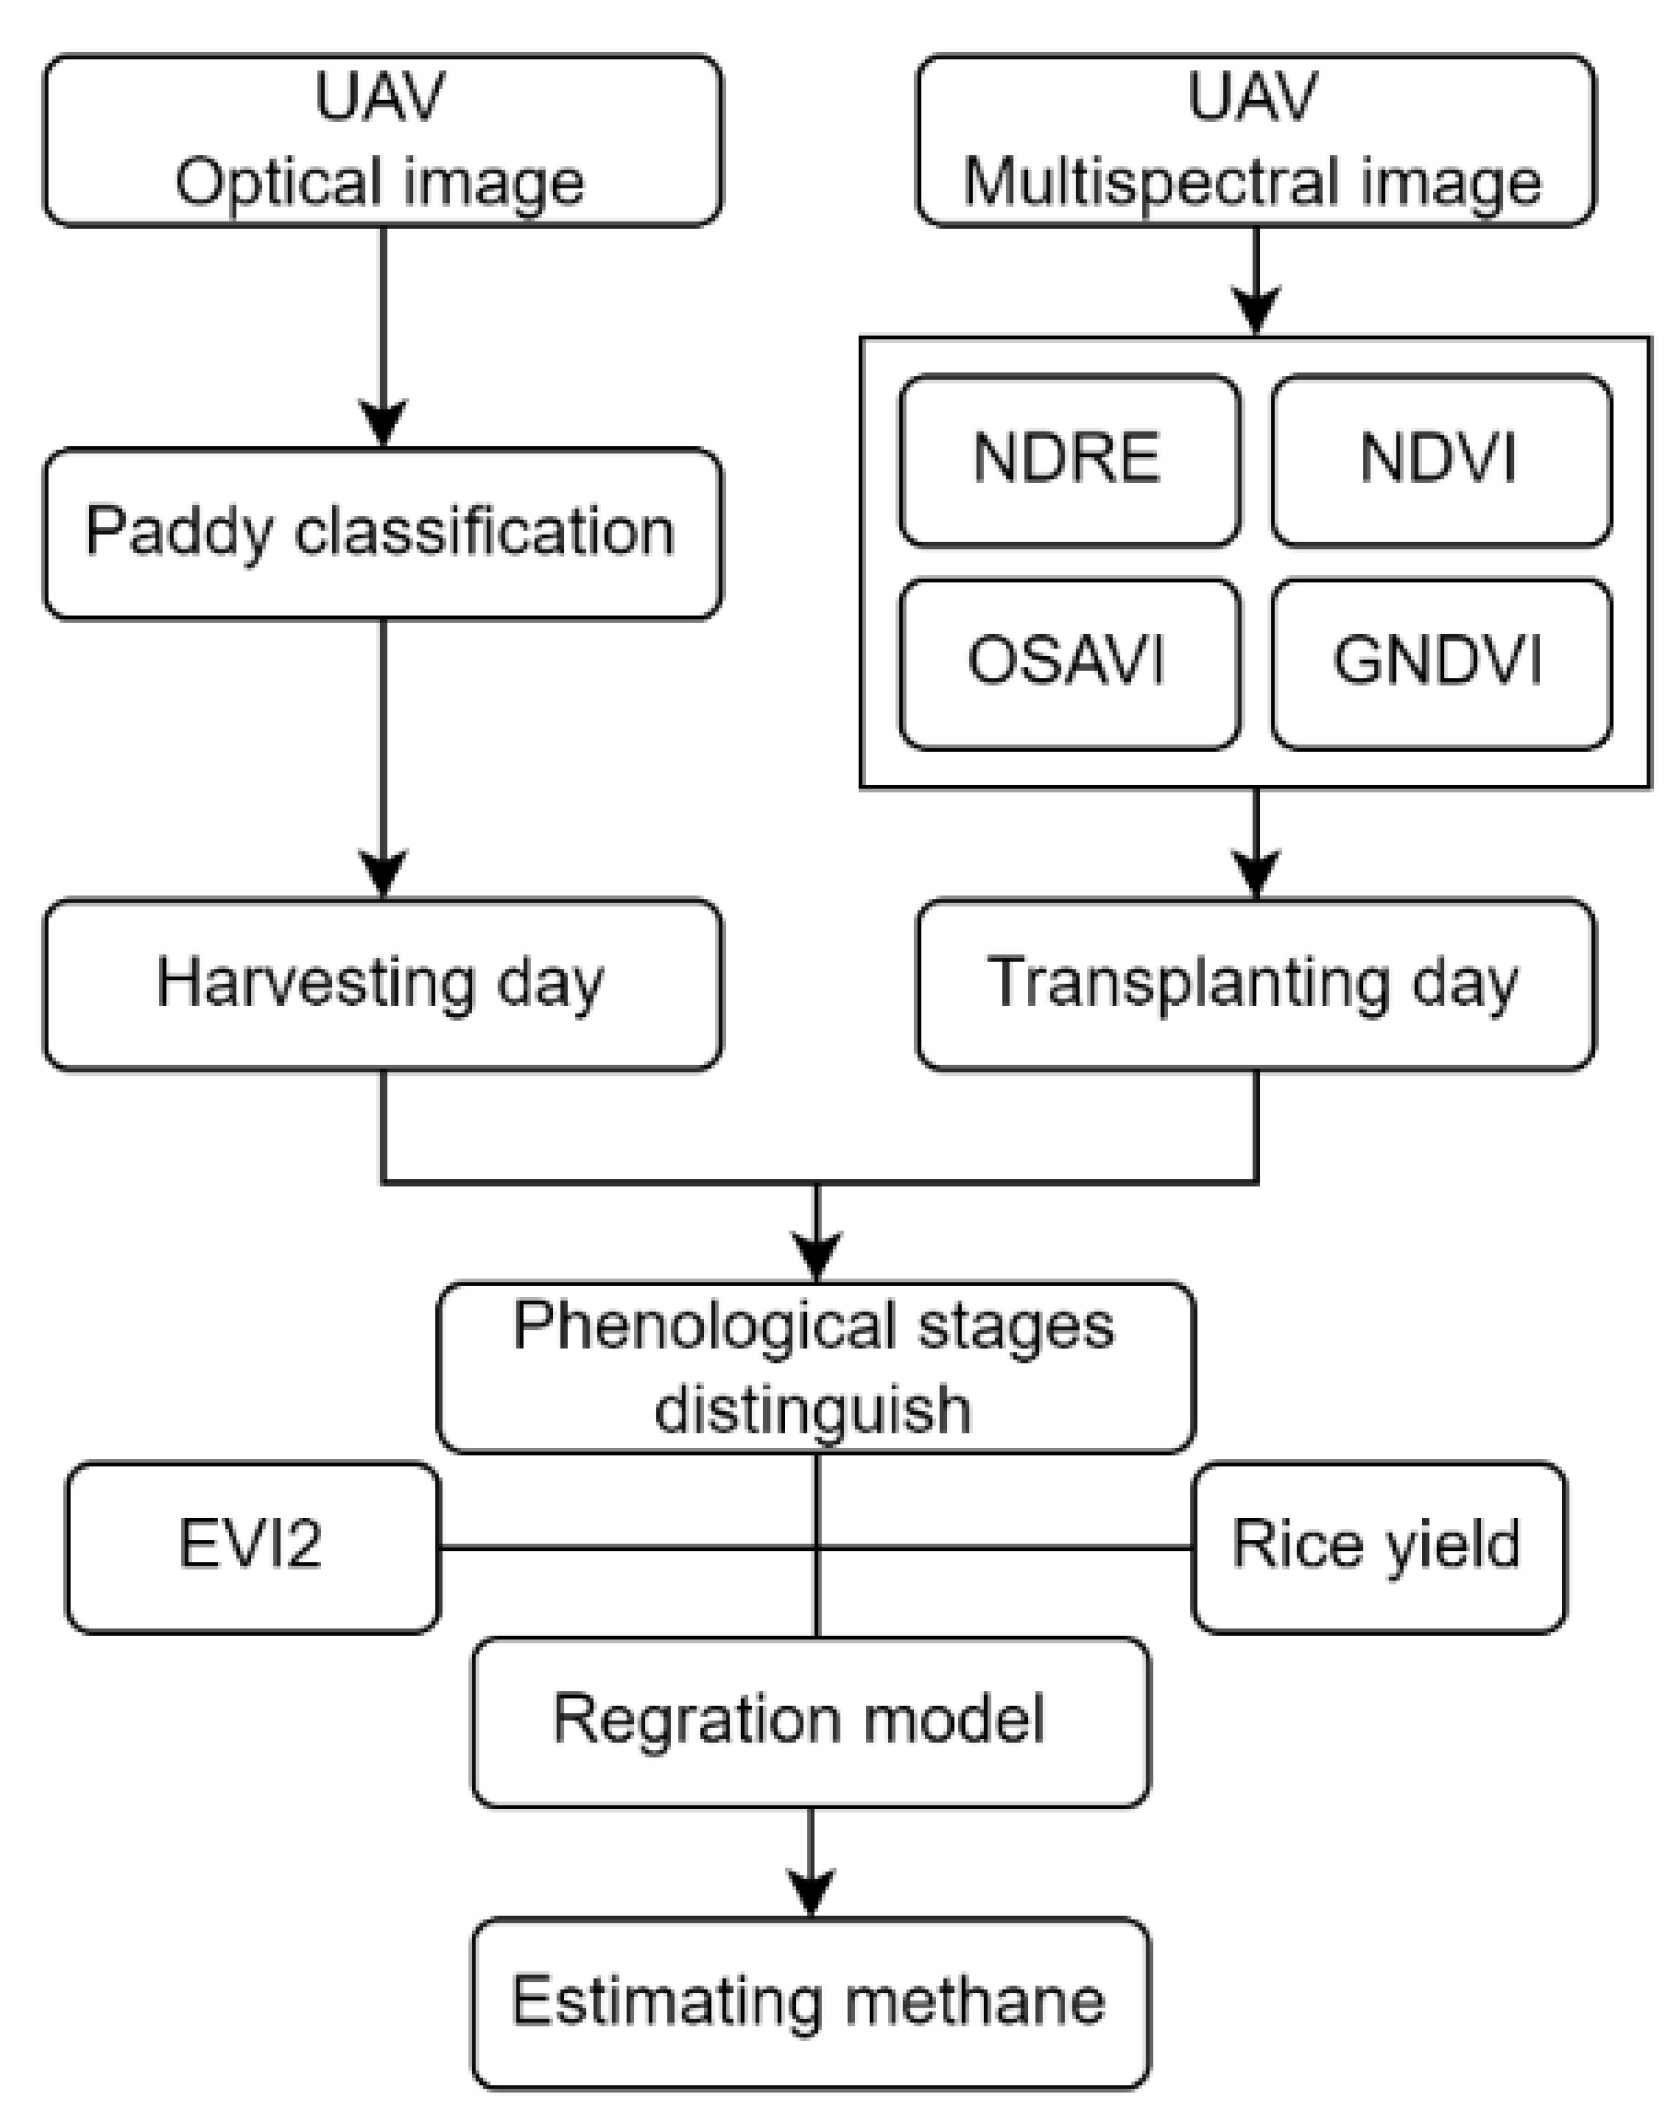
2.2. Methods
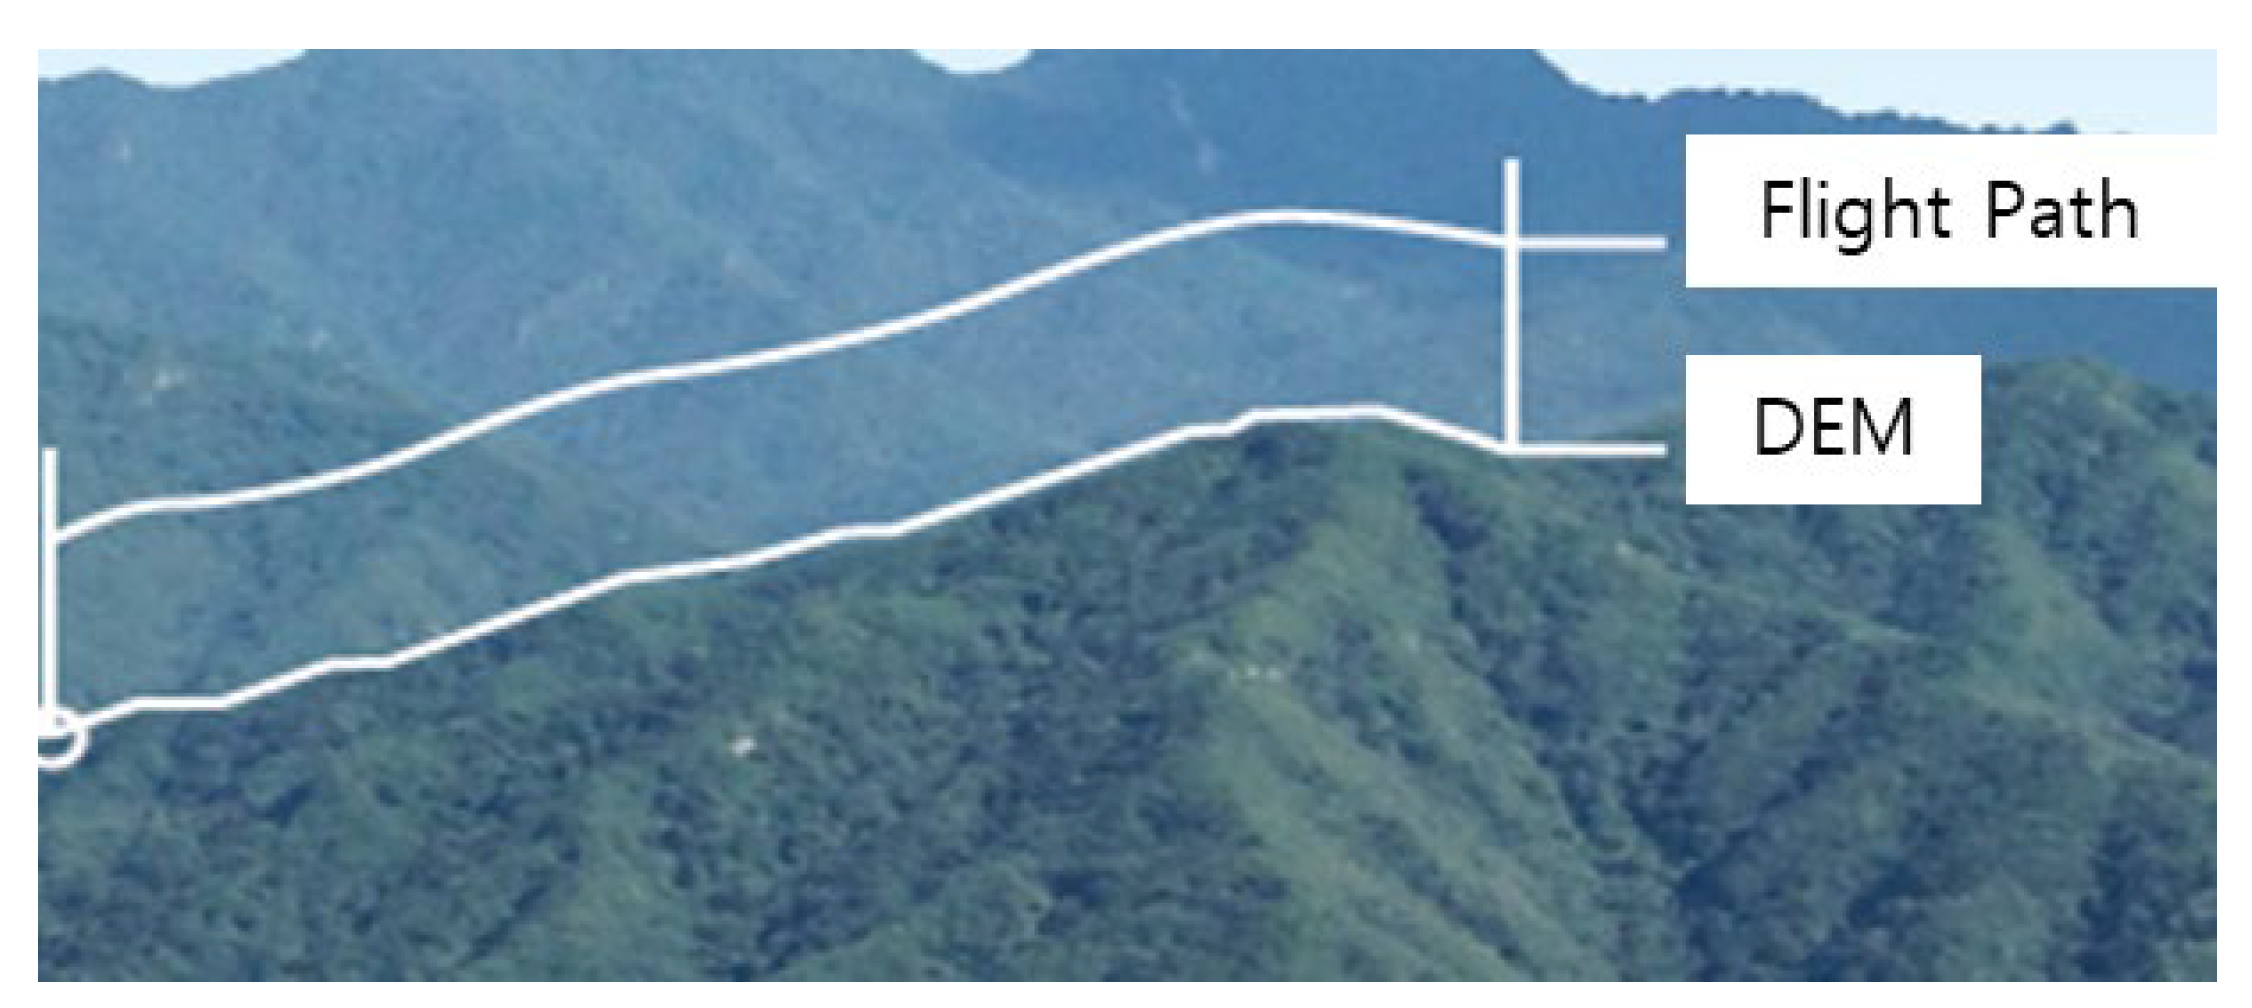
2.2.1. Drone Photography and Image Acquisition
2.2.2. Classification of Paddy Fields and Determination of Local Rice Growing Periods
2.3. Collection of Rice Growth Information
2.4. Application of Regression Models for Calculating Cumulative Methane Emissions per Unit Area
3. Results
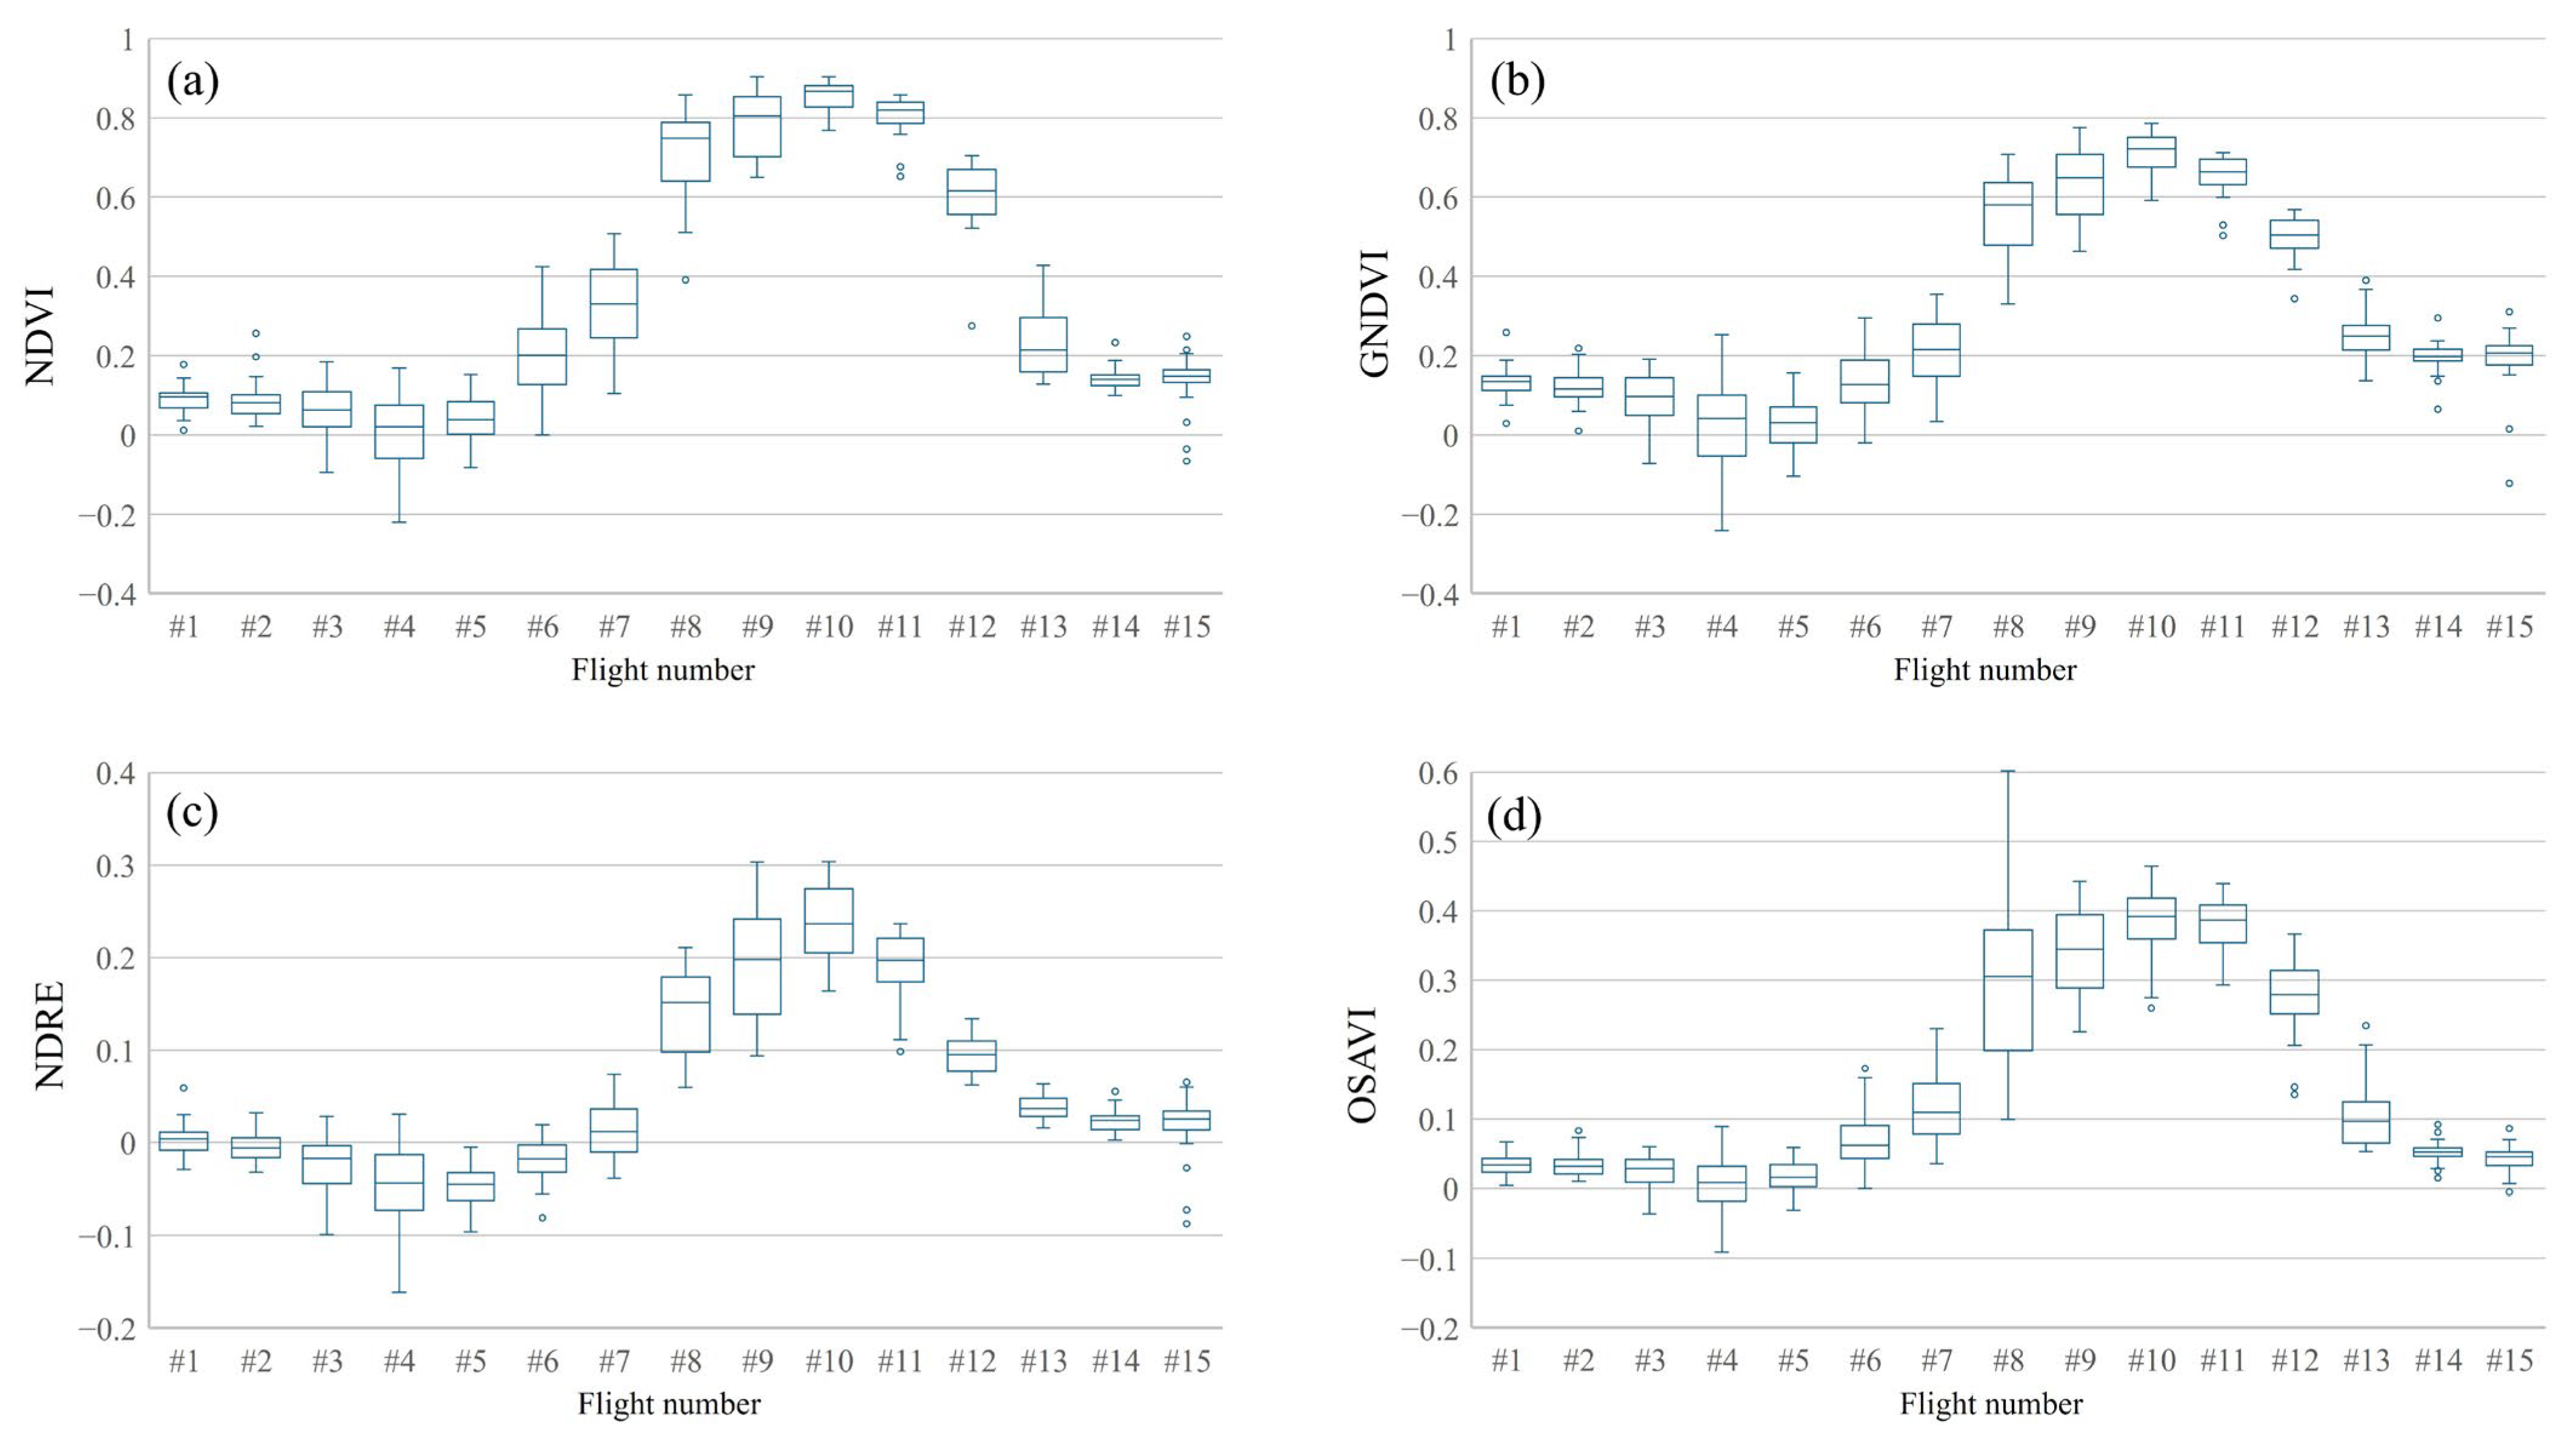
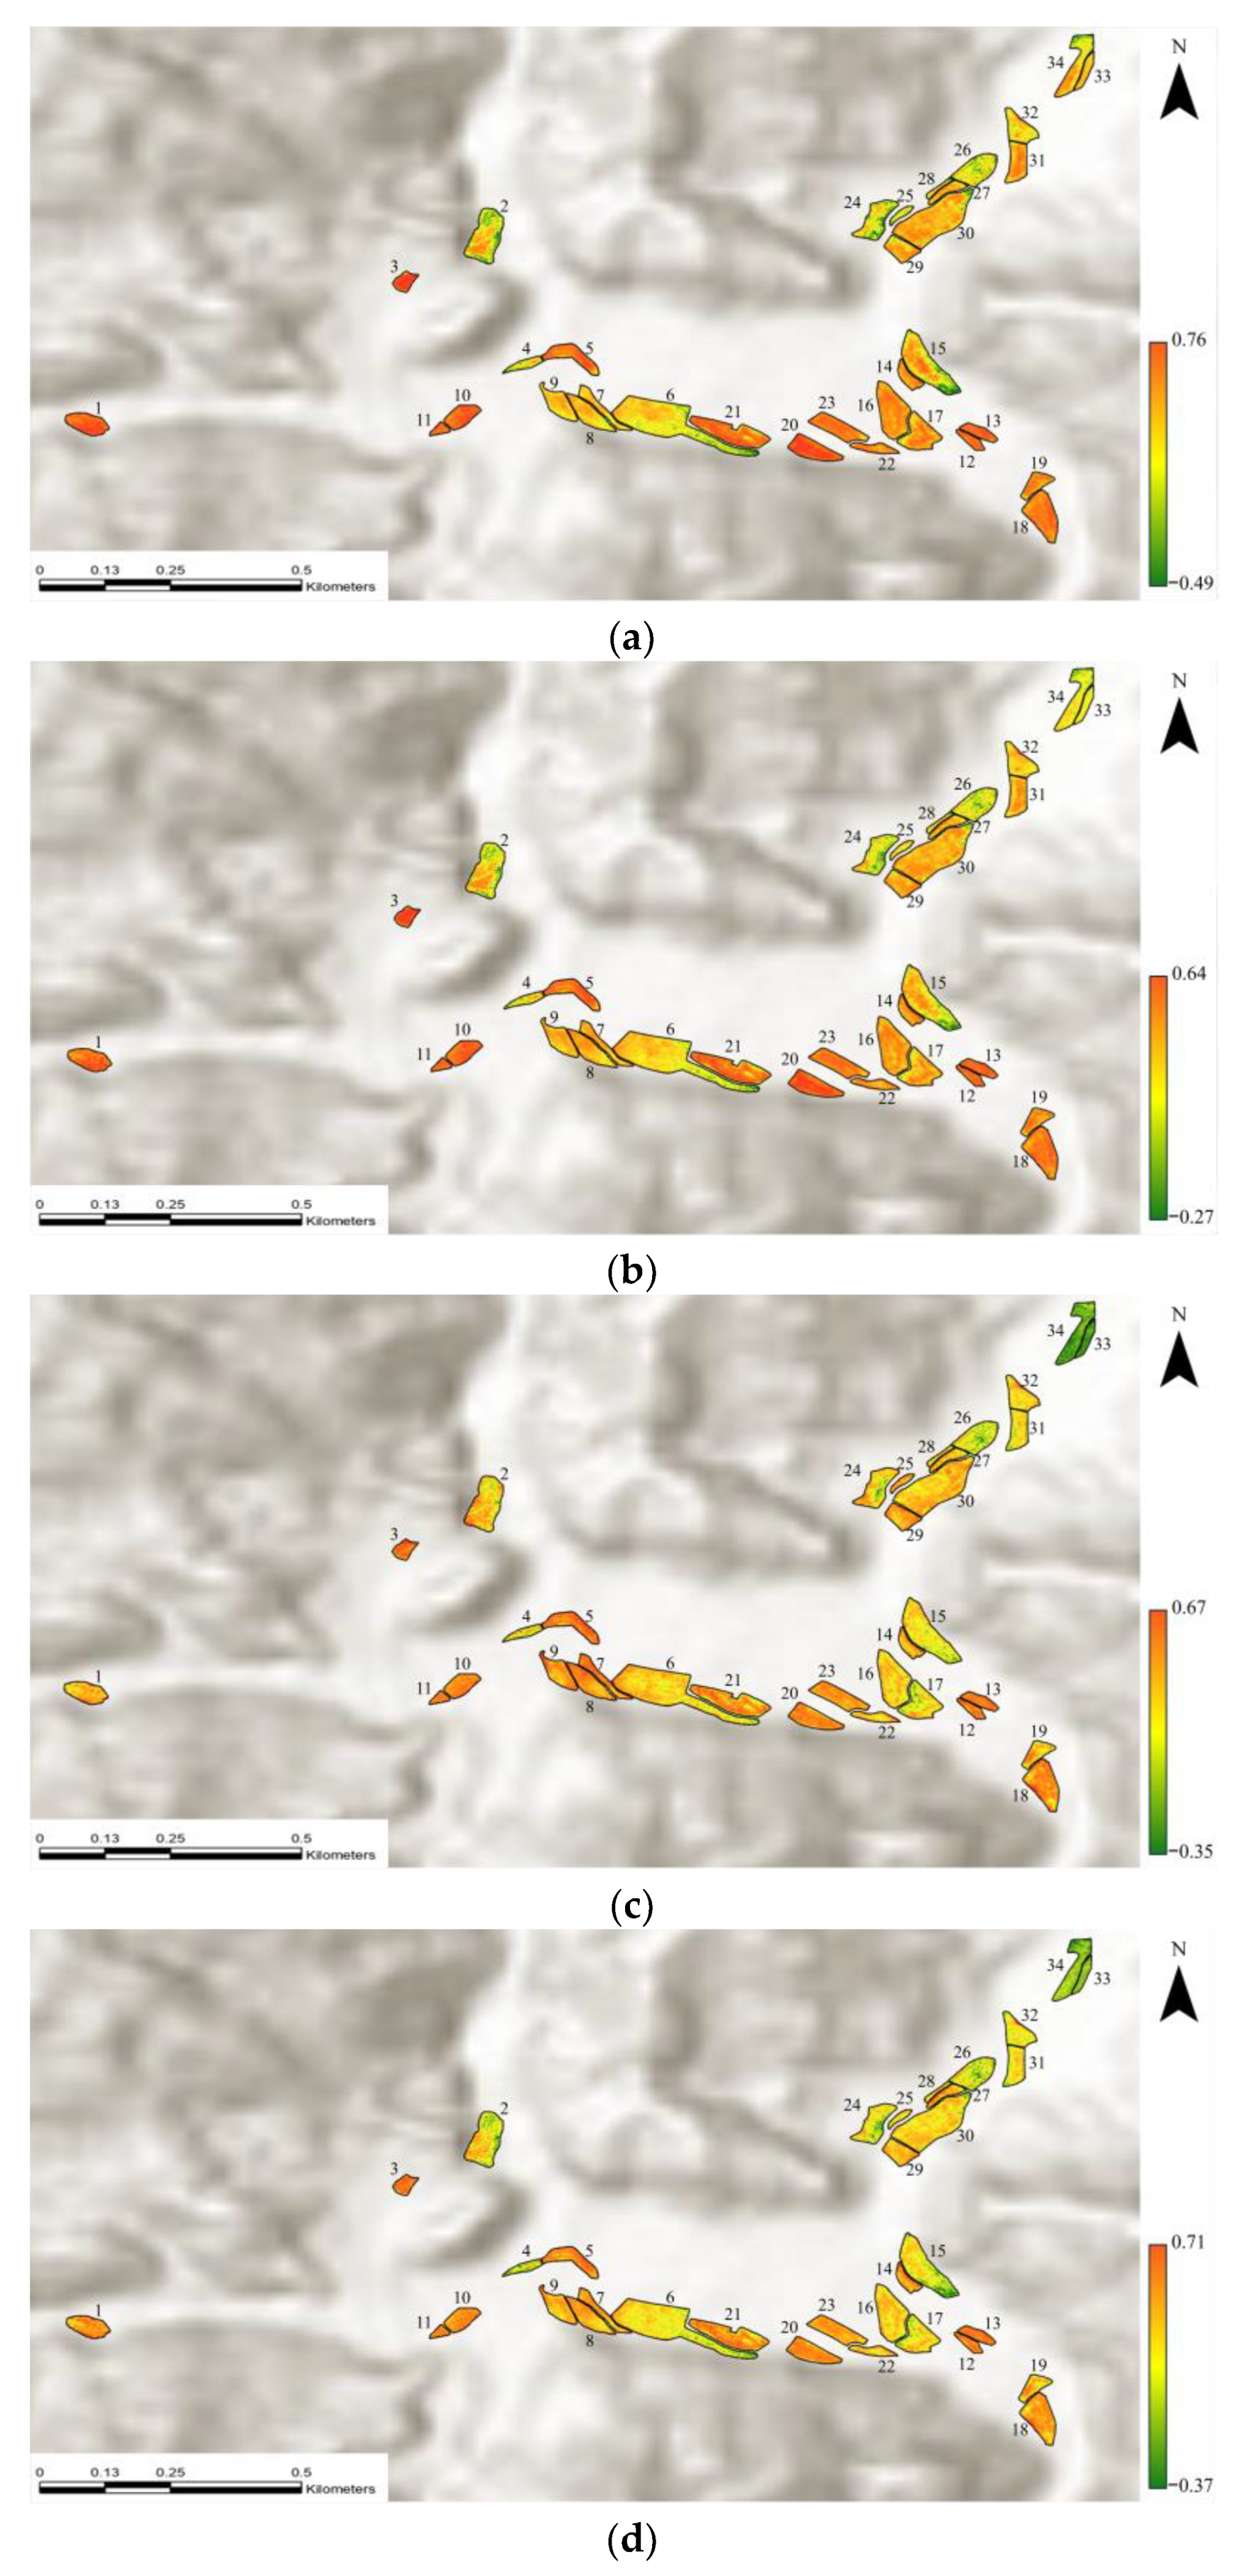
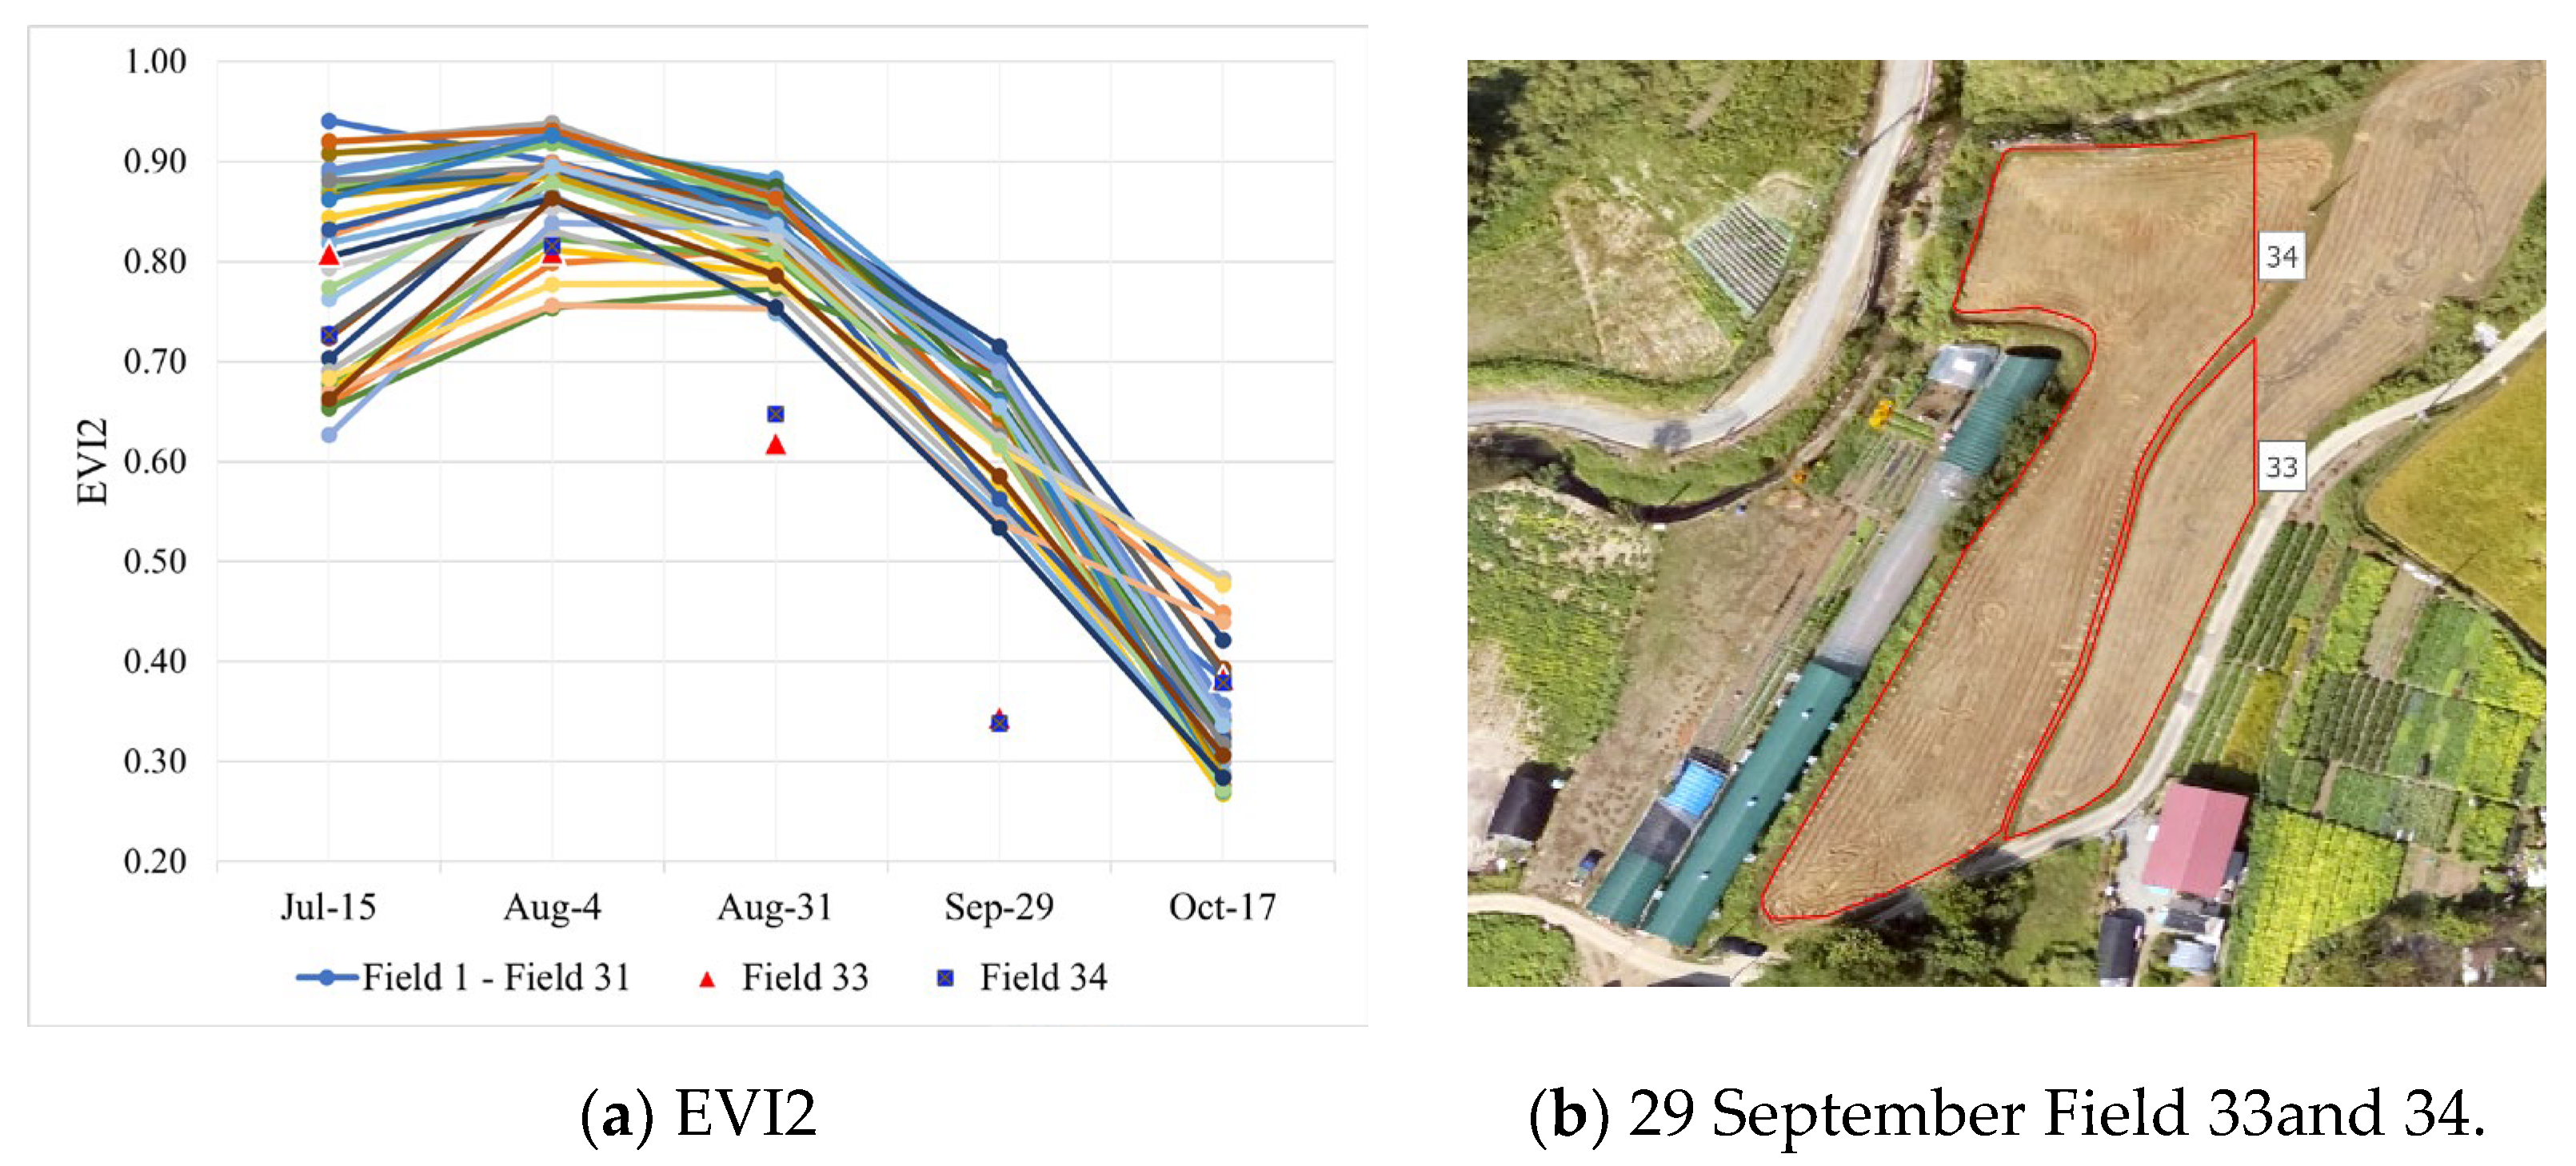
3.1. Transplanting and Harvesting Season Detection
3.2. Estimating Cumulative Methane Emissions within Individual Paddy Fields
3.2.1. Methane Emission Model Calculation Results
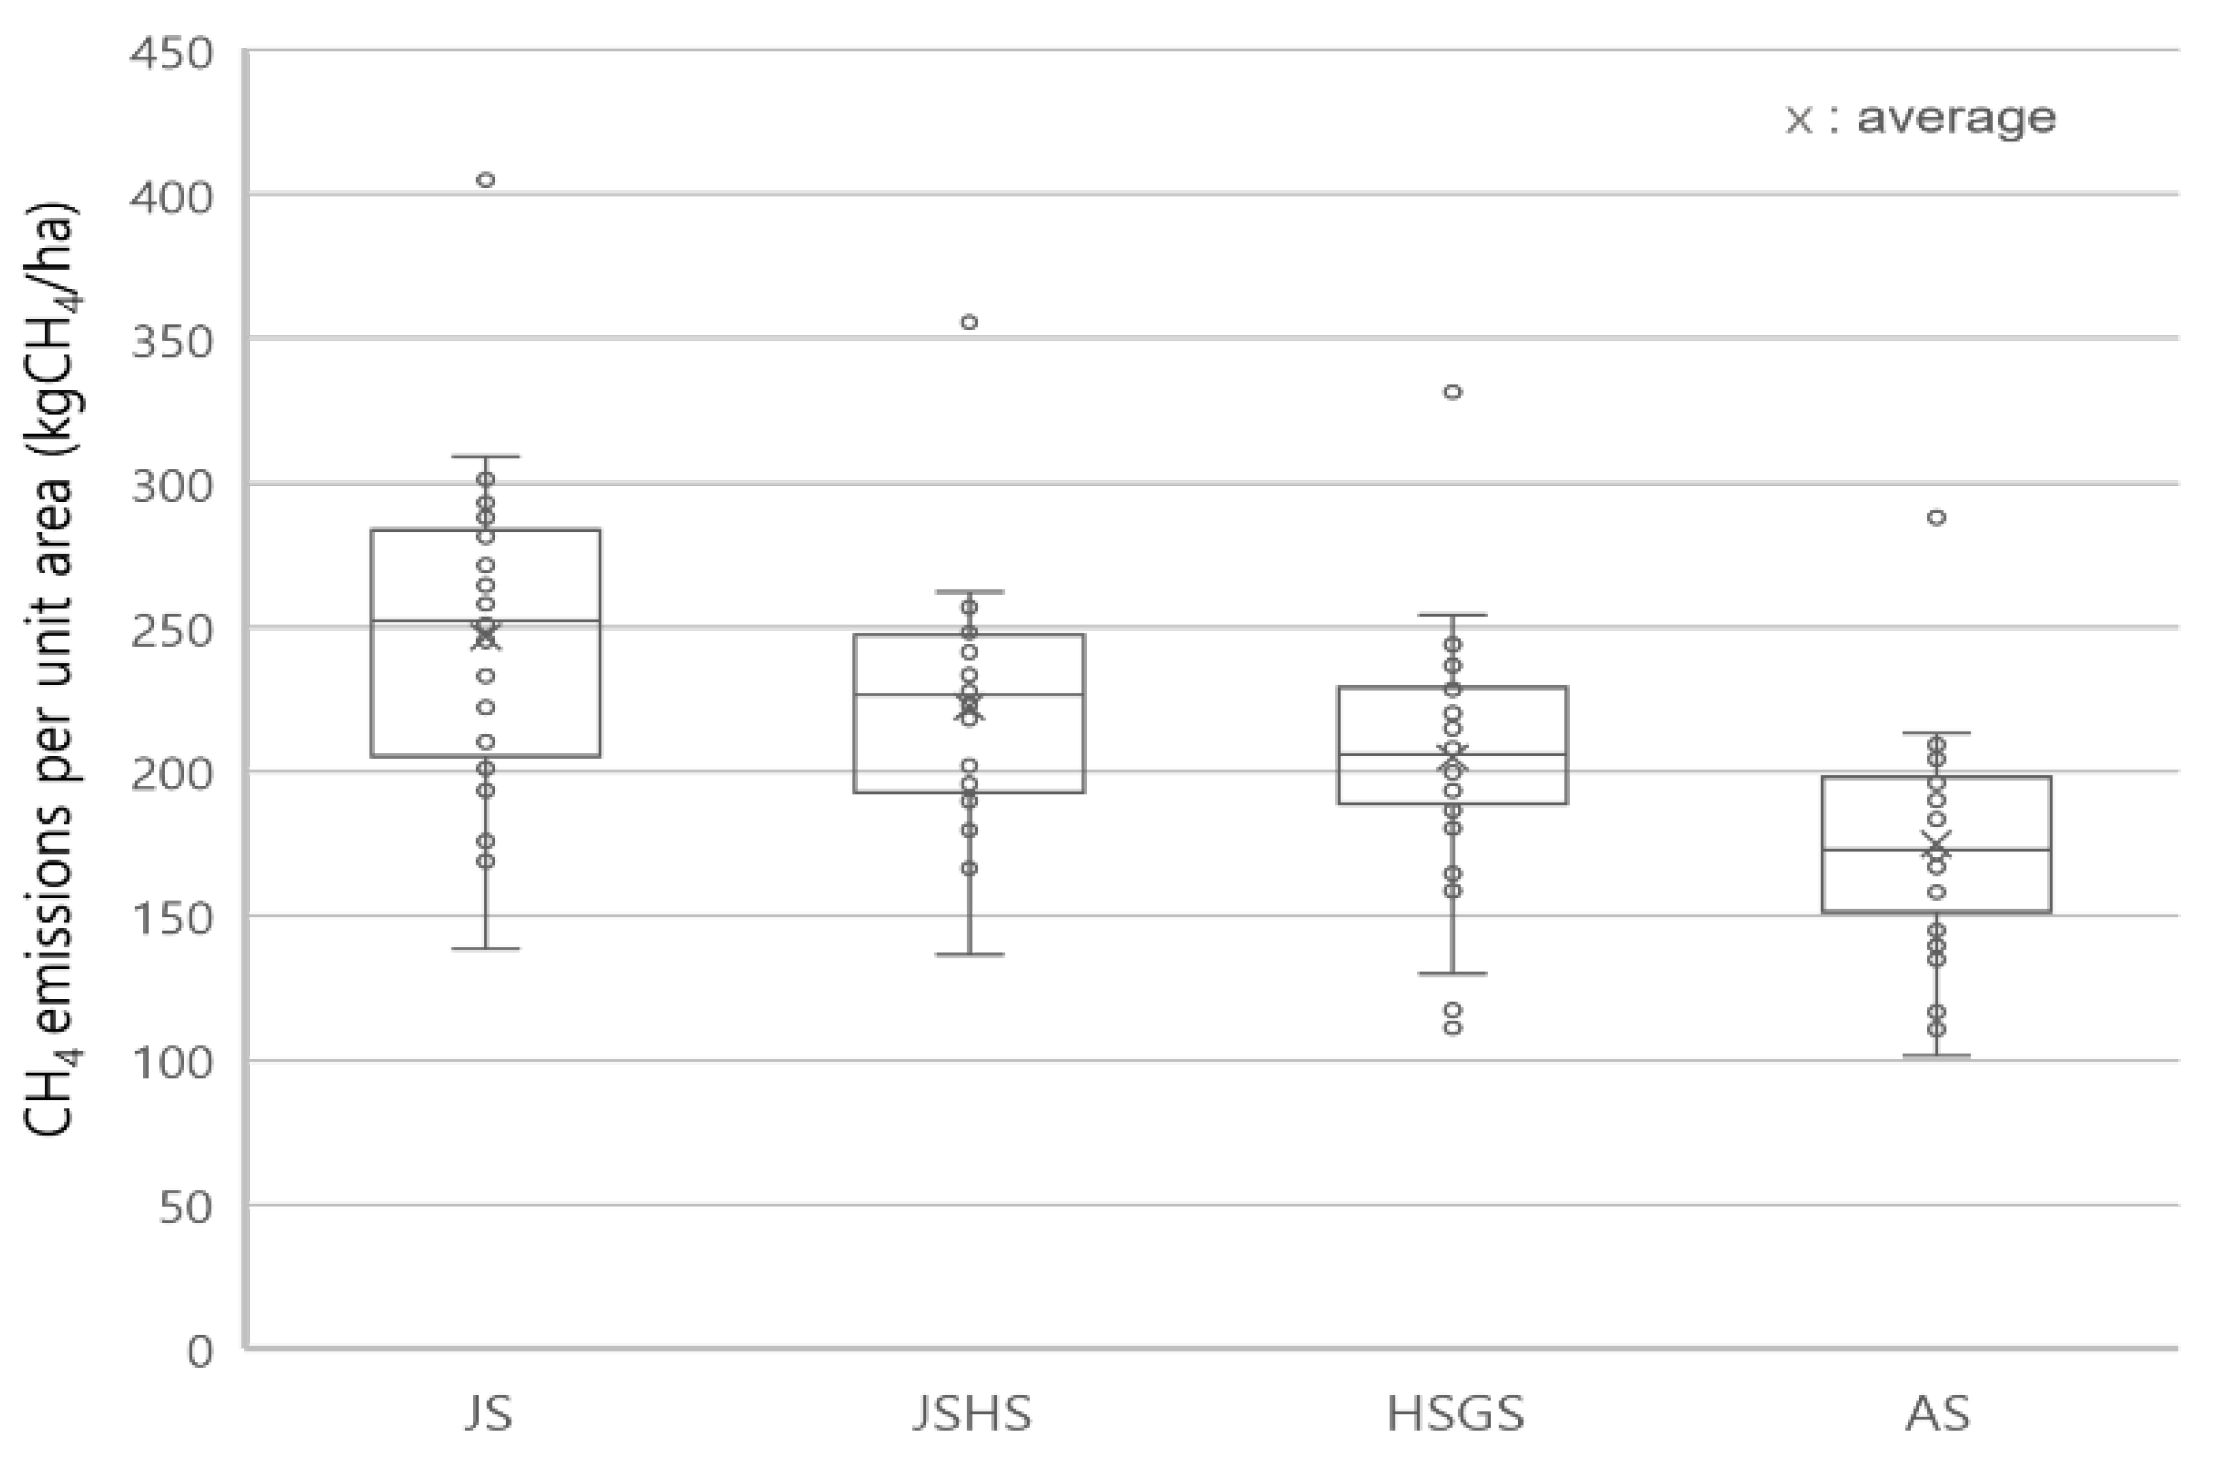
3.2.2. Methane Emissions Calculation per Unit Area
3.2.3. Comparison of Field-Measured Methane Flux Result
3.2.4. Comparison of Methane Emission Calculation Results with Prior Research
4. Discussion
4.1. Result of Discussion
4.2. Limitation and Future Study
4.3. Implication
5. Conclusions
Author Contributions
Funding
Data Availability Statement
Conflicts of Interest
References
- Saunois, M.; Stavert, A.R.; Poulter, B.; Bousquet, P.; Canadell, J.G.; Jackson, R.B.; Raymond, P.A.; Dlugokencky, E.J.; Houweling, S.; Patra, P.K.; et al. The Global Methane Budget 2000–2017. Earth Syst. Sci. Data 2020, 12, 1561–1623. [Google Scholar] [CrossRef]
- Intergovernmental Panel on Climate Change (IPCC). Climate Change 2021: The Physical Science Basis; IPCC: Geneva, Switzerland, 2021. [Google Scholar]
- Greenhouse Gas Inventory and Research Center (GIR). National Greenhouse Gas Inventory Report 2021; Greenhouse Gas Inventory and Research Center: Sejong, Republic of Korea, 2021. [Google Scholar]
- European Commission and United States of America. The Participants in the Global Methane Pledge; European Commission and United States of America: Paris, France, 2021. [Google Scholar]
- Greenhouse Gas Inventory and Research Center (GIR). National Greenhouse Gas Inventory Report 2019; Greenhouse Gas Inventory and Research Center: Sejong, Republic of Korea, 2019. [Google Scholar]
- Gwon, H.S.; Choi, E.J.; Lee, S.I.; Lee, H.S.; Lee, J.M.; Kang, S.S. Research Review of Methane Emissions from Korean Rice Paddies. J. Clim. Chang. Res. 2022, 13, 117–134. [Google Scholar] [CrossRef]
- Jin, J.-H.; Jeong, H.-C.; Lee, S.-I.; Lee, H.-S.; Park, H.-R.; Yu, Y.-S.; Lee, J.-M.; Lee, Y.-H.; Gwon, H.-S. Life Cycle Assessment of Greenhouse Gas Emission of Rice Cultivation under Minimum Tillage in the Gimje, South Korea. Korean J. Soil Sci. Fertil. 2023, 56, 300–312. [Google Scholar] [CrossRef]
- Park, J.; Jang, S.; Kim, H.; Hong, R.; Song, I. Application of Drone Images to Investigate Biomass Management Practices and Estimation of CH4 Emissions from Paddy Fields. J. Korean Soc. Agric. Eng. 2020, 62, 39–49. [Google Scholar] [CrossRef]
- Gwon, H.S.; Khan, M.I.; Yoon, Y.E.; Lee, Y.B.; Kim, P.J.; Hwang, H.Y. Unexpected Higher Decomposition of Soil Organic Matter during Cold Fallow Season in Temperate Rice Paddy. Soil Tillage Res. 2019, 192, 250–257. [Google Scholar] [CrossRef]
- Nikolaisen, M.; Cornulier, T.; Hillier, J.; Smith, P.; Albanito, F.; Nayak, D. Methane Emissions from Rice Paddies Globally: A Quantitative Statistical Review of Controlling Variables and Modelling of Emission Factors. J. Clean. Prod. 2023, 409, 137245. [Google Scholar] [CrossRef]
- Zhang, W.; Sun, W.; Li, T. Uncertainties in the National Inventory of Methane Emissions from Rice Cultivation: Field Measurements and Modeling Approaches. Biogeosciences 2017, 14, 163–176. [Google Scholar] [CrossRef]
- Ouyang, Z.; Jackson, R.B.; McNicol, G.; Fluet-Chouinard, E.; Runkle, B.R.K.; Papale, D.; Knox, S.H.; Cooley, S.; Delwiche, K.B.; Feron, S.; et al. Paddy Rice Methane Emissions across Monsoon Asia. Remote Sens. Environ. 2023, 284, 113335. [Google Scholar] [CrossRef]
- Qi, Z.; Guan, S.; Zhang, Z.; Du, S.; Li, S.; Xu, D. Effect and Mechanism of Root Characteristics of Different Rice Varieties on Methane Emissions. Agronomy 2024, 14, 595. [Google Scholar] [CrossRef]
- Na, S.; Hong, S.; Ahn, H.; Park, C.; So, K.; Lee, K. Detrending Crop Yield Data for Improving MODIS NDVI and Meteorological Data Based Rice Yield Estimation Model. Korean J. Remote Sens. 2021, 37, 199–209. [Google Scholar]
- Kim, Y.; Hong, S. Estimation of Rice Grain Protein Contents Using Ground Optical Remote Sensors. Korean J. Remote Sens. 2008, 24, 551–558. [Google Scholar]
- Lee, K.; Hong, S.-Y.; Kim, S.-G.; Park, C.-W.; Ahn, H.-Y.; Na, S.; So, K.-H. Estimation of Rice Cultivation Area by Threshold Method Using Sentinel-1 Imagery in South Korea. Korean J. Soil Sci. Fertil. 2020, 53, 345–354. [Google Scholar] [CrossRef]
- Ryu, J.; Ahn, H.; Na, S.; Lee, B.; Lee, K. Evaluation of NDVI Retrieved from Sentinel-2 and Landsat-8 Satellites Using Drone Imagery under Rice Disease. Korean J. Remote Sens. 2022, 38, 1231–1244. [Google Scholar] [CrossRef]
- Ahn, H.; Ryu, J.; Na, S.; Lee, B.; Kim, M.; Lee, K. Comparative Analysis of Pre-Processing Method for Standardization of Multi-Spectral Drone Images. Korean J. Remote Sens. 2022, 38, 1219–1230. [Google Scholar]
- Guo, Y.; Xiao, Y.; Hao, F.; Zhang, X.; Chen, J.; de Beurs, K.; He, Y.; Fu, Y.H. Comparison of Different Machine Learning Algorithms for Predicting Maize Grain Yield Using UAV-Based Hyperspectral Images. Int. J. Appl. Earth Obs. Geoinf. 2023, 124, 103528. [Google Scholar] [CrossRef]
- Guo, Y.; Chen, S.; Li, X.; Cunha, M.; Jayavelu, S.; Cammarano, D.; Fu, Y.H. Machine Learning-Based Approaches for Predicting SPAD Values of Maize Using Multi-Spectral Images. Remote Sens. 2022, 14, 1337. [Google Scholar] [CrossRef]
- Sun, Z.; Wang, X.; Wang, Z.; Yang, L.; Xie, Y.; Huang, Y. UAVs as Remote Sensing Platforms in Plant Ecology: Review of Applications and Challenges. J. Plant Ecol. 2021, 14, 1003–1023. [Google Scholar] [CrossRef]
- Greenhouse Gas Inventory and Research Center (GIR). Climate Change and Carbon Neutrality; Greenhouse Gas Inventory and Research Center: Sejong, Republic of Korea, 2023. [Google Scholar]
- Choi, E.; Kim, G.; Lee, S.; Lee, J.; Yoon, J.; Gwon, H. Estimation of Greenhouse Gases Emission from the Crop Cultivation Session of Agricultural Sector According to 2019 Refinement to the 2006 IPCC Guidelines. J. Clim. Chang. Res. 2020, 11, 703–712. [Google Scholar] [CrossRef]
- Shi, Y.; Lou, Y.; Zhang, Z.; Ma, L.; Ojara, M.A. Estimation of Methane Emissions Based on Crop Yield and Remote Sensing Data in a Paddy Field. Greenh. Gases Sci. Technol. 2020, 10, 196–207. [Google Scholar] [CrossRef]
- Ge, W.; Li, X.; Jing, L.; Han, J.; Wang, F. Monitoring Canopy-Scale Autumn Leaf Phenology at Fine-Scale Using Unmanned Aerial Vehicle (UAV) Photography. Agric. For. Meteorol. 2023, 332, 109372. [Google Scholar] [CrossRef]
- Jakob, S.; Zimmermann, R.; Gloaguen, R. The Need for Accurate Geometric and Radiometric Corrections of Drone-Borne Hyperspectral Data for Mineral Exploration: MEPHySTo-A Toolbox for Pre-Processing Drone-Borne Hyperspectral Data. Remote Sens. 2017, 9, 88. [Google Scholar] [CrossRef]
- Jeon, E.I.; Kim, K.; Cho, S.; Kim, S. A Comparative Study of Absolute Radiometric Correction Methods for Drone-Borne Hyperspectral Imagery. Korean J. Remote Sens. 2019, 35, 203–215. [Google Scholar] [CrossRef]
- Deng, L.; Mao, Z.; Li, X.; Hu, Z.; Duan, F.; Yan, Y. UAV-Based Multispectral Remote Sensing for Precision Agriculture: A Comparison between Different Cameras. ISPRS J. Photogramm. Remote Sens. 2018, 146, 124–136. [Google Scholar] [CrossRef]
- Cao, S.; Danielson, B.; Clare, S.; Koenig, S.; Campos-Vargas, C.; Sanchez-Azofeifa, A. Radiometric Calibration Assessments for UAS-Borne Multispectral Cameras: Laboratory and Field Protocols. ISPRS J. Photogramm. Remote Sens. 2019, 149, 132–145. [Google Scholar] [CrossRef]
- Fawcett, D.; Panigada, C.; Tagliabue, G.; Boschetti, M.; Celesti, M.; Evdokimov, A.; Biriukova, K.; Colombo, R.; Miglietta, F.; Rascher, U.; et al. Multi-Scale Evaluation of Drone-Based Multispectral Surface Reflectance and Vegetation Indices in Operational Conditions. Remote Sens. 2020, 12, 514. [Google Scholar] [CrossRef]
- Chungcheongnam-do Agricultural Technology Institute. Manual for Growing “Samgwangbyeo”; Chungcheongnam-do Agricultural Technology Institute: Cheonan-si, Republic of Korea, 2012. [Google Scholar]
- Hu, X.; Huang, Y.; Sun, W.; Yu, L. Shifts in Cultivar and Planting Date Have Regulated Rice Growth Duration under Climate Warming in China since the Early 1980s. Agric. For. Meteorol. 2017, 247, 34–41. [Google Scholar] [CrossRef]
- Ryu, J.H.; Jeong, H.; Cho, J. Performances of Vegetation Indices on Paddy Rice at Elevated Air Temperature, Heat Stress, and Herbicide Damage. Remote Sens. 2020, 12, 2654. [Google Scholar] [CrossRef]
- Zhang, K.; Ge, X.; Shen, P.; Li, W.; Liu, X.; Cao, Q.; Zhu, Y.; Cao, W.; Tian, Y. Predicting Rice Grain Yield Based on Dynamic Changes in Vegetation Indexes during Early to Mid-Growth Stages. Remote Sens. 2019, 11, 387. [Google Scholar] [CrossRef]
- Roy, D.P.; Wulder, M.A.; Loveland, T.R.; Woodcock, C.E.; Allen, R.G.; Anderson, M.C.; Helder, D.; Irons, J.R.; Johnson, D.M.; Kennedy, R.; et al. Landsat-8: Science and Product Vision for Terrestrial Global Change Research. Remote Sens. Environ. 2014, 145, 154–172. [Google Scholar] [CrossRef]
- Omari, K.; Abuelgasim, A.; Alhebsi, K. Aerosol Optical Depth Retrieval over the City of Abu Dhabi, United Arab Emirates (UAE) Using Landsat-8 OLI Images. Atmos. Pollut. Res. 2019, 10, 1075–1083. [Google Scholar] [CrossRef]
- Yan, K.; Gao, S.; Chi, H.; Qi, J.; Song, W.; Tong, Y.; Mu, X.; Yan, G. Evaluation of the Vegetation-Index-Based Dimidiate Pixel Model for Fractional Vegetation Cover Estimation. IEEE Trans. Geosci. Remote Sens. 2022, 60, 1–14. [Google Scholar] [CrossRef]
- Jiang, Z.; Huete, A.R.; Didan, K.; Miura, T. Development of a Two-Band Enhanced Vegetation Index without a Blue Band. Remote Sens. Environ. 2008, 112, 3833–3845. [Google Scholar] [CrossRef]
- Zhen, Z.; Yunsheng, L.; Rui, L.; Li, M.; Jun, L.; Amina, L. The Potential of Vegetation Indices: Estimating Methane Emissions in Paddy Fields under Nighttime Warming and Water Saving Conditions. Greenh. Gases Sci. Technol. 2020, 10, 545–556. [Google Scholar] [CrossRef]
- Hayashida, S.; Ono, A.; Yoshizaki, S.; Frankenberg, C.; Takeuchi, W.; Yan, X. Methane Concentrations over Monsoon Asia as Observed by SCIAMACHY: Signals of Methane Emission from Rice Cultivation. Remote Sens. Environ. 2013, 139, 246–256. [Google Scholar] [CrossRef]
- Schijtz, H.; Seiler, W.; Conrad, R. Processes Involved in Formation and Emission of Methane in Rice Paddies. Biogeochemistry 1989, 7, 33–53. [Google Scholar]
- Alberto, M.C.R.; Wassmann, R.; Buresh, R.J.; Quilty, J.R.; Correa, T.Q.; Sandro, J.M.; Centeno, C.A.R. Measuring Methane Flux from Irrigated Rice Fields by Eddy Covariance Method Using Open-Path Gas Analyzer. Field Crops Res. 2014, 160, 12–21. [Google Scholar] [CrossRef]
- Li, D.; Liu, M.; Cheng, Y.; Wang, D.; Qin, J.; Jiao, J.; Li, H.; Hu, F. Methane Emissions from Double-Rice Cropping System under Conventional and No Tillage in Southeast China. Soil Tillage Res. 2011, 113, 77–81. [Google Scholar] [CrossRef]
- Inubushi, K.; Muramatsu, Y.; Umebayashi, M. Influence of Percolation on Methane Emission from Flooded Paddy Soil. Jpn. J. Soil Sci. Plant Nutr. 1992, 63, 184–189. [Google Scholar] [CrossRef]
- Meijide, A.; Manca, G.; Goded, I.; Magliulo, V.; Di Tommasi, P.; Seufert, G.; Cescatti, A. Seasonal Trends and Environmental Controls of Methane Emissions in a Rice Paddy Field in Northern Italy. Biogeosciences 2011, 8, 3809–3821. [Google Scholar] [CrossRef]
- Hwang, W.; Park, M.; Cho, K.; Hyun, S. Drainage Practice of Rice Paddies as a Sustainable Agronomic Management for Mitigating the Emission of Two Carbon-Based Greenhouse Gases (CO2 and CH4): Field Pilot Study in South Korea. Sustainability 2024, 16, 2802. [Google Scholar] [CrossRef]
- Hwang, W.; Kim, C.; Cho, K.; Hyun, S. Characteristics of Greenhouse Gas Emissions from Rice Paddy Fields in South Korea under Climate Change Scenario RCP-8.5 Using the DNDC Model. Pedosphere 2021, 31, 332–341. [Google Scholar] [CrossRef]
- Fumoto, T.; Kobayashi, K.; Li, C.; Yagi, K.; Hasegawa, T. Revising a Process-Based Biogeochemistry Model (DNDC) to Simulate Methane Emission from Rice Paddy Fields under Various Residue Management and Fertilizer Regimes. Glob. Chang. Biol. 2008, 14, 382–402. [Google Scholar] [CrossRef]
- Min, H.; Kim, M.; Kim, J.; Hwang, W. DNDC Modeling for Greenhouse Gases Emission in Rice Paddy of South Korea and the Effect of Flooding Management Change and RCP 8.5 Scenario. Ecol. Resilient Infrastruct. 2018, 5, 189–198. [Google Scholar] [CrossRef]
- Shin, M.H.; Jang, J.R.; Won, C.H.; Jung, Y.H.; Lee, S.I.; Lim, K.; Choi, J.D. Simulation of GHG Emission from Paddy Field Using DNDC Model. J. Korean Soc. Agric. Eng. 2014, 56, 47–57. [Google Scholar] [CrossRef]
- Kim, G.-Y.; Jeong, H.-C.; Ju, O.-J.; Kim, H.-K.; Park, J.-H.; Gwon, H.-S.; Kim, P.-J. Establishment of Baseline Emission Factor of Methane in Korean Rice Paddy Soil. Korean J. Environ. Agric. 2013, 32, 359–365. [Google Scholar] [CrossRef]
- Choi, S.W.; Kim, J.; Kang, M.S.; Kang, N.G. Estimation and Mapping of Methane Emissions from Rice Paddies in Korea: Analysis of Regional Differences and Characteristics. Korean J. Agric. For. Meteorol. 2018, 20, 88–100. [Google Scholar] [CrossRef]
- Jang, S.J.; Park, J.S.; Hong, R.G.; Hong, J.P.; Kwon, C.L.; Song, I.H. Estimation of Paddy CH4 Emissions through Drone-Image-Based Identification of Paddy Rice Straw Application & Winter Crop Cultivation. J. Korean Soc. Rural Plan. 2021, 27, 21–33. [Google Scholar] [CrossRef]
- Zhang, G.; Xiao, X.; Dong, J.; Kou, W.; Jin, C.; Qin, Y.; Zhou, Y.; Wang, J.; Menarguez, M.A.; Biradar, C. Mapping Paddy Rice Planting Areas through Time Series Analysis of MODIS Land Surface Temperature and Vegetation Index Data. ISPRS J. Photogramm. Remote Sens. 2015, 106, 157–171. [Google Scholar] [CrossRef]
- Qiu, B.; Li, W.; Tang, Z.; Chen, C.; Qi, W. Mapping Paddy Rice Areas Based on Vegetation Phenology and Surface Moisture Conditions. Ecol. Indic. 2015, 56, 79–86. [Google Scholar] [CrossRef]
- Yeom, J.M.; Jeong, S.; Deo, R.C.; Ko, J. Mapping Rice Area and Yield in Northeastern Asia by Incorporating a Crop Model with Dense Vegetation Index Profiles from a Geostationary Satellite. GIScience Remote Sens. 2021, 58, 1–27. [Google Scholar] [CrossRef]
- Lee, K.; Park, C.-W.; So, K.-H.; Na, S. Selection of Optimal Vegetation Indices and Regression Model for Estimation of Rice Growth Using UAV Aerial Images. Korean J. Soil Sci. Fertil. 2017, 50, 409–421. [Google Scholar] [CrossRef]
- Li, B.; Peng, S.; Shen, R.; Yang, Z.L.; Yan, X.; Li, X.; Li, R.; Li, C.; Zhang, G. Development of a New Index for Automated Mapping of Ratoon Rice Areas Using Time-Series Normalized Difference Vegetation Index Imagery. Pedosphere 2022, 32, 576–587. [Google Scholar] [CrossRef]
- Miyata, A.; Leuning, R.; Denmead, O.T.; Kim, J.; Harazono, Y. Carbon Dioxide and Methane Fluxes from an Intermittently Flooded Paddy Field; Elsevier: Amsterdam, The Netherlands, 2000; Volume 102. [Google Scholar]
- Singh, S.; Kashyap, A.K.; Singh, J.S. Methane Flux in Relation to Growth and Phenology of a High Yielding Rice Variety as Affected by Fertilization; Springer: Berlin/Heidelberg, Germany, 1998; Volume 201. [Google Scholar]
- Buendia, C.; Kranjc, K.; Fukuda, J.; Osako, N.S.; Shermanau, Y.; Federici, P. 2019 Refinement to the 2006 IPCC Guidelines for National Greenhouse Gas Inventories Volume 1 General Guidance and Reporting Task Force on National Greenhouse Gas Inventories; IPCC: Geneva, Switzerland, 2019. [Google Scholar]
- Yang, S.S.; Chang, H.L. Diurnal Variation of Methane Emission from Paddy Fields at Different Growth Stages of Rice Cultivation in Taiwan. Agric. Ecosyst. Environ. 1999, 76, 75–84. [Google Scholar] [CrossRef]
- Neue, H.-U. Methane Emission from Rice Fields. Bioscience 1993, 43, 466–474. [Google Scholar] [CrossRef]
- Yan, X.; Yagi, K.; Akiyama, H.; Akimoto, H. Statistical Analysis of the Major Variables Controlling Methane Emission from Rice Fields. Glob. Chang. Biol. 2005, 11, 1131–1141. [Google Scholar] [CrossRef]
- Wang, Z.; Gu, D.; Beebout, S.S.; Zhang, H.; Liu, L.; Yang, J.; Zhang, J. Effect of Irrigation Regime on Grain Yield, Water Productivity, and Methane Emissions in Dry Direct-Seeded Rice Grown in Raised Beds with Wheat Straw Incorporation. Crop J. 2018, 6, 495–508. [Google Scholar] [CrossRef]
- Kwun, S.K.; Shin, Y.K.; Eom, K. Estimation of Methane Emission from Rice Cultivation in Korea. J. Environ. Sci. Health—Part A Toxic/Hazard. Subst. Environ. Eng. 2003, 38, 2549–2563. [Google Scholar] [CrossRef]
- Guo, Y.; Fu, Y.H.; Chen, S.; Robin Bryant, C.; Li, X.; Senthilnath, J.; Sun, H.; Wang, S.; Wu, Z.; de Beurs, K. Integrating Spectral and Textural Information for Identifying the Tasseling Date of Summer Maize Using UAV Based RGB Images. Int. J. Appl. Earth Obs. Geoinf. 2021, 102, 102435. [Google Scholar] [CrossRef]


| Drone & Sensor | P4 Multispectral |
|---|---|
| Spectral Bands | Blue: 450 nm ± 16 nm, Green: 560 nm ± 16 nm, Red: 650 nm ± 16 nm, Red Edge: 730 nm ± 16 nm, Near-Infrared: 840 nm ± 26 nm |
| FOV | 62.7° |
| GSD | (* H/18.9) cm/pixel |
| ** Hover Accuracy Range | Vertical: ±0.5 m, Horizontal: ±1.5 m |
| No. | Date | Weather | Time | Altitude (m) | |
|---|---|---|---|---|---|
| Start | End | ||||
| 1 | 6 April 2022 | Sunny | 14:27 | 16:30 | 210 |
| 2 | 18 April 2022 | Sunny | 14:08 | 17:13 | 210 |
| 3 | 4 May 2022 | Sunny | 14:22 | 16:51 | 210 |
| 4 | 17 May 2022 | Sunny | 12:43 | 15:05 | 210 |
| 5 | 27 May 2022 | Partly Cloudy | 12:13 | 14:36 | 210 |
| 6 | 8 June 2022 | Partly Cloudy | 13:42 | 16:04 | 210 |
| 7 | 16 June 2022 | Cloudy | 13:31 | 16:26 | 210 |
| 8 | 1 July 2022 | Partly Cloudy | 12:52 | 15:03 | 210 |
| 9 | 15 July 2022 | Sunny | 13:40 | 16:06 | 210 |
| 10 | 4 August 2022 | Partly Cloudy | 12:55 | 16:58 | 210 |
| 11 | 31 August 2022 | Cloudy | 12:02 | 13:50 | 210 |
| 12 | 29 September 2022 | Sunny | 14:07 | 16:11 | 210 |
| 13 | 17 October 2022 | Sunny | 13:42 | 16:14 | 210 |
| 14 | 2 November 2022 | Sunny | 12:58 | 14:57 | 210 |
| 15 | 16 November 2022 | Sunny | 13:57 | 15:49 | 210 |
| Category | Properties |
|---|---|
| Cultivars | Samgwangbyeo (Mid-late Maturation) |
| Growing regions | Plans of the central region, south-mid region |
| Growing period | About 130 days |
| Transplanting date | The latter half of May (27 May–5 June) |
| Heading date | The middle of August (Around 16 August) |
| Harvesting season | The early part of October (Around 10 October) |
| Category | Properties |
|---|---|
| Experimental site | Nanjing University, Nanjing, Jiangsu Province, Eastern China (32°12′ N, 118°43′ E) |
| Climate status | Average annual precipitation: 1000 mm Average annual temperature: 15.6 °C |
| Cultivars | Nanjing 46 |
| Growing season | 133 d (Transplant: 17 June 2017/Harvest: 28 October 2017) |
| Model | X2 | Equation | R2 |
|---|---|---|---|
| 1 | EVI-JS | 0.89 | |
| 2 | EVI-JS-HS | 0.80 | |
| 3 | EVI-HS-GS | 0.83 | |
| 4 | EVI-AS | 0.88 |
| Transplanting Day | JS | HS | GS | MS | |
|---|---|---|---|---|---|
| Nanjing 46 | 7 May | 14 July– 20 August | 21 August– 3 September | 4 September– 6 October | 7 October– 28 October |
| Samgwang-byeo | 31 May | 15 July– 5 August | About 16 August | 17 August– 5 October | About 10 October |
| Drone EVI2 | 31 May | 15 July– 4 August | 15 August | 31 August– 29 September | 17 October |
| EVI2-JS | EVI2-JS-HS | EVI2-HS-GS | EVI2-AS | |
|---|---|---|---|---|
| Maximum | 309 | 262 | 254 | 213 |
| Average | 247 | 223 | 205 | 175 |
| Minimum | 138 | 136 | 129 | 101 |
| Upper quartile | 284 | 247 | 229 | 198 |
| Median | 252 | 227 | 206 | 173 |
| Lower quartile | 205 | 192 | 189 | 152 |
| Confidence intervals 95% | ±17.68 | ±12.94 | ±13.61 | ±11.95 |
| Statistical Method | EVI2-JS | EVI2-JS-HS | EVI2-HS-GS | EVI2-AS | |
|---|---|---|---|---|---|
| Shapiro–Wilk test | W | 0.952 | 0.917 | 0.936 | 0.95 |
| p-value | 0.141 | 0.013 | 0.047 | 0.124 | |
| Independent Samples t-test | T-statistic | 5.75 | - | - | −3.08 |
| p-value | 2.50 × 10⁻⁷ | - | - | 0.003 | |
| Mann–Whitney U test | U-statistic | - | 850 | 714 | - |
| p-value | - | 0.00037 | 0.076 | - | |
| Name | Data Year | CH4 Emissions per ha (kg CH4 ha−1) | Region | Location |
|---|---|---|---|---|
| Model EVI2-JS | 2022 | 138–309 | Gyeonggi-do | Namyangju (Siu) |
| DNDC model | 2022 | 327–329 | Gyeonggi-do | |
| NIR * [3] | 2020 | 215 | National | - |
| Kim et al. [51] | 2010–2012 | 270–334 | Gyeonggi-do | Hwaseong |
| Choi et al. [52] | 2010 | 490–560 | Gyeonggi-do | Uijeongbu, Uiwang, Icheon, Yeoju, Yangju, Yongin, Gimpo, Osan, Gwacheon |
| Jang et al. [53] | 2018, 2019 | 195–300 | Gyeonggi-do | Anseong, Yeoju, Yongin, Icheon, Pyeongtaek, Hwaseong |
| Hwang et al. [46] | 2019 | 14, 95, 194 | Gyeonggi-do | Namyangju (Wabu) |
Disclaimer/Publisher’s Note: The statements, opinions and data contained in all publications are solely those of the individual author(s) and contributor(s) and not of MDPI and/or the editor(s). MDPI and/or the editor(s) disclaim responsibility for any injury to people or property resulting from any ideas, methods, instructions or products referred to in the content. |
© 2024 by the authors. Licensee MDPI, Basel, Switzerland. This article is an open access article distributed under the terms and conditions of the Creative Commons Attribution (CC BY) license (https://creativecommons.org/licenses/by/4.0/).
Share and Cite
Song, Y.; Song, C.; Choi, S.-E.; Kim, J.; Kim, M.; Hwang, W.; Roh, M.; Lee, S.; Lee, W.-K. Estimating Methane Emissions in Rice Paddies at the Parcel Level Using Drone-Based Time Series Vegetation Indices. Drones 2024, 8, 459. https://doi.org/10.3390/drones8090459
Song Y, Song C, Choi S-E, Kim J, Kim M, Hwang W, Roh M, Lee S, Lee W-K. Estimating Methane Emissions in Rice Paddies at the Parcel Level Using Drone-Based Time Series Vegetation Indices. Drones. 2024; 8(9):459. https://doi.org/10.3390/drones8090459
Chicago/Turabian StyleSong, Yongho, Cholho Song, Sol-E Choi, Joon Kim, Moonil Kim, Wonjae Hwang, Minwoo Roh, Sujong Lee, and Woo-Kyun Lee. 2024. "Estimating Methane Emissions in Rice Paddies at the Parcel Level Using Drone-Based Time Series Vegetation Indices" Drones 8, no. 9: 459. https://doi.org/10.3390/drones8090459