Article

R-LVIO: Resilient LiDAR-Visual-Inertial Odometry for UAVs in GNSS-denied Environment

Department of Control Science and Engineering, Harbin Institute of Technology, Harbin 150001, China
*
Author to whom correspondence should be addressed.
Drones 2024, 8(9), 487; https://doi.org/10.3390/drones8090487
Submission received: 17 August 2024 / Revised: 8 September 2024 / Accepted: 12 September 2024 / Published: 14 September 2024

Abstract

:
In low-altitude, GNSS-denied scenarios, Unmanned aerial vehicles (UAVs) rely on sensor fusion for self-localization. This article presents a resilient multi-sensor fusion localization system that integrates light detection and ranging (LiDAR), cameras, and inertial measurement units (IMUs) to achieve state estimation for UAVs. To address challenging environments, especially unstructured ones, IMU predictions are used to compensate for pose estimation in the visual and LiDAR components. Specifically, the accuracy of IMU predictions is enhanced by increasing the correction frequency of IMU bias through data integration from the LiDAR and visual modules. To reduce the impact of random errors and measurement noise in LiDAR points on visual depth measurement, cross-validation of visual feature depth is performed using reprojection error to eliminate outliers. Additionally, a structure monitor is introduced to switch operation modes in hybrid point cloud registration, ensuring accurate state estimation in both structured and unstructured environments. In unstructured scenes, a geometric primitive capable of representing irregular planes is employed for point-to-surface registration, along with a novel pose-solving method to estimate the UAV’s pose. Both private and public datasets collected by UAVs validate the proposed system, proving that it outperforms state-of-the-art algorithms by at least 12.6%.

1. Introduction

Unmanned aerial vehicle (UAV) navigation and localization systems must be stable and accurate to complete various tasks. UAVs generally adopt the global navigation satellite system (GNSS) as the core navigation technology. However, the open frequency bands of GNSS satellite signals make them susceptible to interference, which can result in UAVs failing to complete their planned missions or even return to base [1,2,3,4]. Multi-sensor fusion-based localization techniques are essential for UAVs to achieve state estimation in low-altitude, GNSS-denied scenarios. In multi-sensor fusion frameworks, UAVs are typically equipped with light detection and ranging (LiDAR), cameras, and inertial measurement units (IMUs) to collect multi-source information, achieving 6-degree-of-freedom (DoF) state estimation [5,6].
In recent years, numerous UAV sensor fusion frameworks based on LiDAR, cameras, and IMUs have been presented to achieve superior estimation accuracy in artificial environments, such as streets, campuses, and factories [7,8]. In these frameworks, LiDAR is usually used as the core sensor due to its high-fidelity measurements and wide-range sensing capabilities [9,10]. However, in unstructured environments like corridors, deserts, and stadiums, the lack of LiDAR return points leads to insufficient constraints for pose estimation. The challenges encountered in unstructured environments include the following. (1) Irregular planes are difficult to represent accurately. Ground points in unstructured scenes make up a relatively large portion of the LiDAR point cloud. The ground points can be fitted to similar planes due to minimal height differences. However, using planes as primitives results in the loss of the ground’s uneven geometric properties. (2) Vertical constraints are inadequate for UAV height measurement. Unstructured scenes have too few LiDAR return points in the vertical direction, making the LiDAR module insensitive to altitude changes.
To tackle the problems in unstructured scenarios, we propose the following measures. (1) Select appropriate geometric primitives to represent irregular surfaces and adjust the point cloud alignment model. (2) Use short-term prediction of the IMU vertical direction instead of using the LiDAR module for height measurement. (3) Employ the IMU module as the core of the system to output the final state, thereby mitigating the risk of failure in the LiDAR or visual modules. This paper proposes a multi-sensor fusion-based odometry and mapping framework that relies on the complementary advantages of LiDAR, cameras, and IMUs, achieving low-drift and high robustness state estimation. The main contributions of the proposed system are as follows:
  • Improve the accuracy of short-term IMU predictions by increasing the frequency of corrections from the LiDAR and visual modules. LiDAR pose frequency is boosted by sweep segmentation to synchronize the LiDAR input time with the camera sampling time.
  • Devise an outliers rejection strategy of depth association between the camera image and LiDAR points to select accurate depth points by evaluating the reprojection error of visual feature points in a sliding window.
  • Design a structure monitor to distinguish structured scenes and unstructured scenes by analyzing the vertical landmarks. The environmental structuring is quantified to switch the operating modes of the LiDAR module.
  • Propose a novel point-to-surface model to register irregular surfaces in unstructured scenes, achieving three horizontal DoF state estimation. The vertical 3-DoF state is predicted by IMU relative measurement.
The paper is structured as follows. The related work of sensor fusion localization and point cloud registration is presented in Section 2. The problem statement is presented in Section 3. The details of the proposed system are illustrated in Section 4. Experimental results on public and private datasets are provided in Section 5. Conclusions and future work are given in Section 6. The notations are listed in Table 1.

2. Related Works

2.1. Sensor Fusion Localization System

Recently, significant efforts have been made in the field of sensor fusion localization. Nguyen proposes VIRAL-fusion [11], which combines an IMU, an ultra wideband ranging sensor, and multiple on-board visual-inertial and LiDAR-ranging subsystems to implement an optimization-based comprehensive state estimator on UAVs. This estimator effectively mitigates the problem of pose position drift and robustness in low-texture environments. LIC-fusion2 [12] introduces a novel sliding-window planar feature tracking technique based on online spatio-temporal calibration for efficient processing of 3D LiDAR point clouds. A novel outlier rejection criterion is proposed in planar feature tracking to initialize feature points belonging to the same plane for high-quality data correlation. Shao [13] proposes a integrated LiDAR-visual-inertial framework that conducts coupling optimization in a factor graph manner, enabling a refined system state. Lin [14] proposes a novel multi-sensor fusion framework, called R3LIVE, that leverages the measurement strengths of LIDAR, inertial, and visual sensors to enable real-time reconstruction of accurate, dense, 3D, RGB-colored maps of the surrounding environment. Zheng [15] proposes a fast LiDAR-inertial-visual odometry system based on two tightly coupled direct subsystems: a VIO subsystem and a LIO subsystem. The LIO subsystem registers new sweep points onto an incrementally constructed point cloud map. The points on the map are also appended with image patches, which are then used in the VIO subsystem to align the new image by minimizing photometric errors. The system combines the advantages of sparse direct image alignment and raw point direct alignment to achieve accurate and reliable attitude estimation with low computational cost.
The aforementioned systems enable accurate state estimation in structured environments. However, in unstructured scenes, the LiDAR module with a point-to-plane model cannot build a consistent surrounding map, and the overall system perhaps fails due to LiDAR pose drift or map divergence. To tackle this problem, some researchers have utilized the property of multi-sensor fusion, which involves discarding the output of the LiDAR module and using other sensors’ poses as the system state. Zhang [16] introduces LiDAR-visual-IMU odometry, which starts with IMU preintegration measurement and ends with refined poses in a visual-inertial subsystem and LiDAR-inertial subsystem. Although the system fails to greatly improve the state accuracy compared with the LiDAR subsystem, the robustness is enhanced due to the coupling of the visual subsystem as a complement to the state estimation. Wisth [17] proposes VILENS, a factor graph-based odometry system for legged robots. By tightly fusing LiDAR, cameras, IMUs, and leg odometry together, reliable operation is achieved despite the fact that individual sensors can produce degraded estimates. To minimize legged odometry drift, the system extends the robot’s state using a linear velocity deviation term, which is estimated online by preintegrating measurement with the visual, LiDAR, and IMU factors. The system exhibits excellent localization performance and strong robustness in unstructured environments. Based on the above study, we propose a method to compensate for LiDAR drift by combining short-term IMU predictions with the pre-drift LiDAR pose for state estimation. The proposed system achieves synchronization between LiDAR and camera by segmenting the LiDAR sweep, which improves the accuracy of short-term IMU predictions by boosting the correction frequencies. In addition, the undegraded LiDAR module is also used to constrain the pose estimation of the visual module to improve the localization accuracy of the visual sub-module. In the case of LiDAR failure, the visual-inertial module is employed to generate the final state.

2.2. Point Cloud Registration

The majority of existing work accomplishes point cloud alignment by sweep matching, which involves using iterative closest point (ICP) and normal distribution transform (NDT) algorithms to solve sweep-to-sweep or sweep-to-map transformations [18,19,20]. Point-to-point, point-to-edge, point-to-plane, and point-to-probability model techniques are among the geometric primitives that are employed in it. By fully considering the sparsity and scene complexity of LiDAR point clouds, Cui [21] provides a linear keypoint representation for 3D LiDAR point clouds, which minimizes keypoint-to-keypoint distance to efficiently perform sweep-to-sweep alignment. Zhang [22] distinguishes plane and edge points by calculating the local smoothness, and then minimizes the point-to-plane distance and point-to-edge distance to achieve accurate point cloud alignment. On this foundation, Guo [23] extracts edge and plane features by the principal component analysis (PCA) method, which is employed in two-stage alignment to achieve, without loss of real-time performance, improved odometry accuracy and consistent mapping.
Regularized planes are commonly used as geometric primitives for matching in the above methods. However, uneven surfaces are widely found in unstructured and undeveloped environments. Still, utilizing a planar model for point cloud matching will produce large random errors. Choi [24] presents a fast and generalized feature-based LiDAR odometry method using local quadratic surface approximation and point-to-surface alignment. Unlike most matching methods based on point-to-plane distances, the method approximates the local geometry of the LiDAR scan as a quadratic surface to minimize performance degradation due to the inconsistency of feature classes with the local geometry of the map. Chen [25] presents a lightweight front-end LiDAR odometry solution that uses a point-to-point probabilistic model in a generalized ICP-based direct point cloud matching method to yield accurate state estimation in unstructured subterranean environments. Combining these two approaches, this paper approximates an uneven surface as a Gaussian surface, which is formulated as a Gaussian probability function consisting of neighboring points. The point-to-Gaussian surface distance is employed to point cloud matching, achieving low-drift LiDAR odometry in unstructured scenes.

3. Problem Statement

The state variables are represented by the following in the proposed system:
X n = x i i T n = R i , p i , v i , b w i , b a i i T n .
where X n represents the set of all states. R i , p i , and v i denote the orientation, the translation, and the motion velocity of the UAV at moment t i , respectively. b w i and b a i are the IMU biases.
The camera observations at time t i are represented as C i , which include the extracted feature point, z i c , from the images. The measurement data from the LiDAR are represented as L i , which include the salient points, z i l , to be matched. IMU measurements between adjacent camera sampling moments t i and t j are represented as I i j . The UAV state is estimated by minimizing the sum of squared observation residuals, as follows:
X n = arg min X n l n P X n | Z n = arg min X n r 0 2 + ( i , j ) T n r I i j 2 + i T n c C i r z i c 2 + i T n l L i r z i l 2 .
where r 0 is the prior error. r I i j , r z i c , r z i l represent the residuals of the associated measurements. Residuals are functions of the state variables and observations, quantifying the mismatch between the observations and the estimated values under the current state and prior constraints.

4. Proposed Method

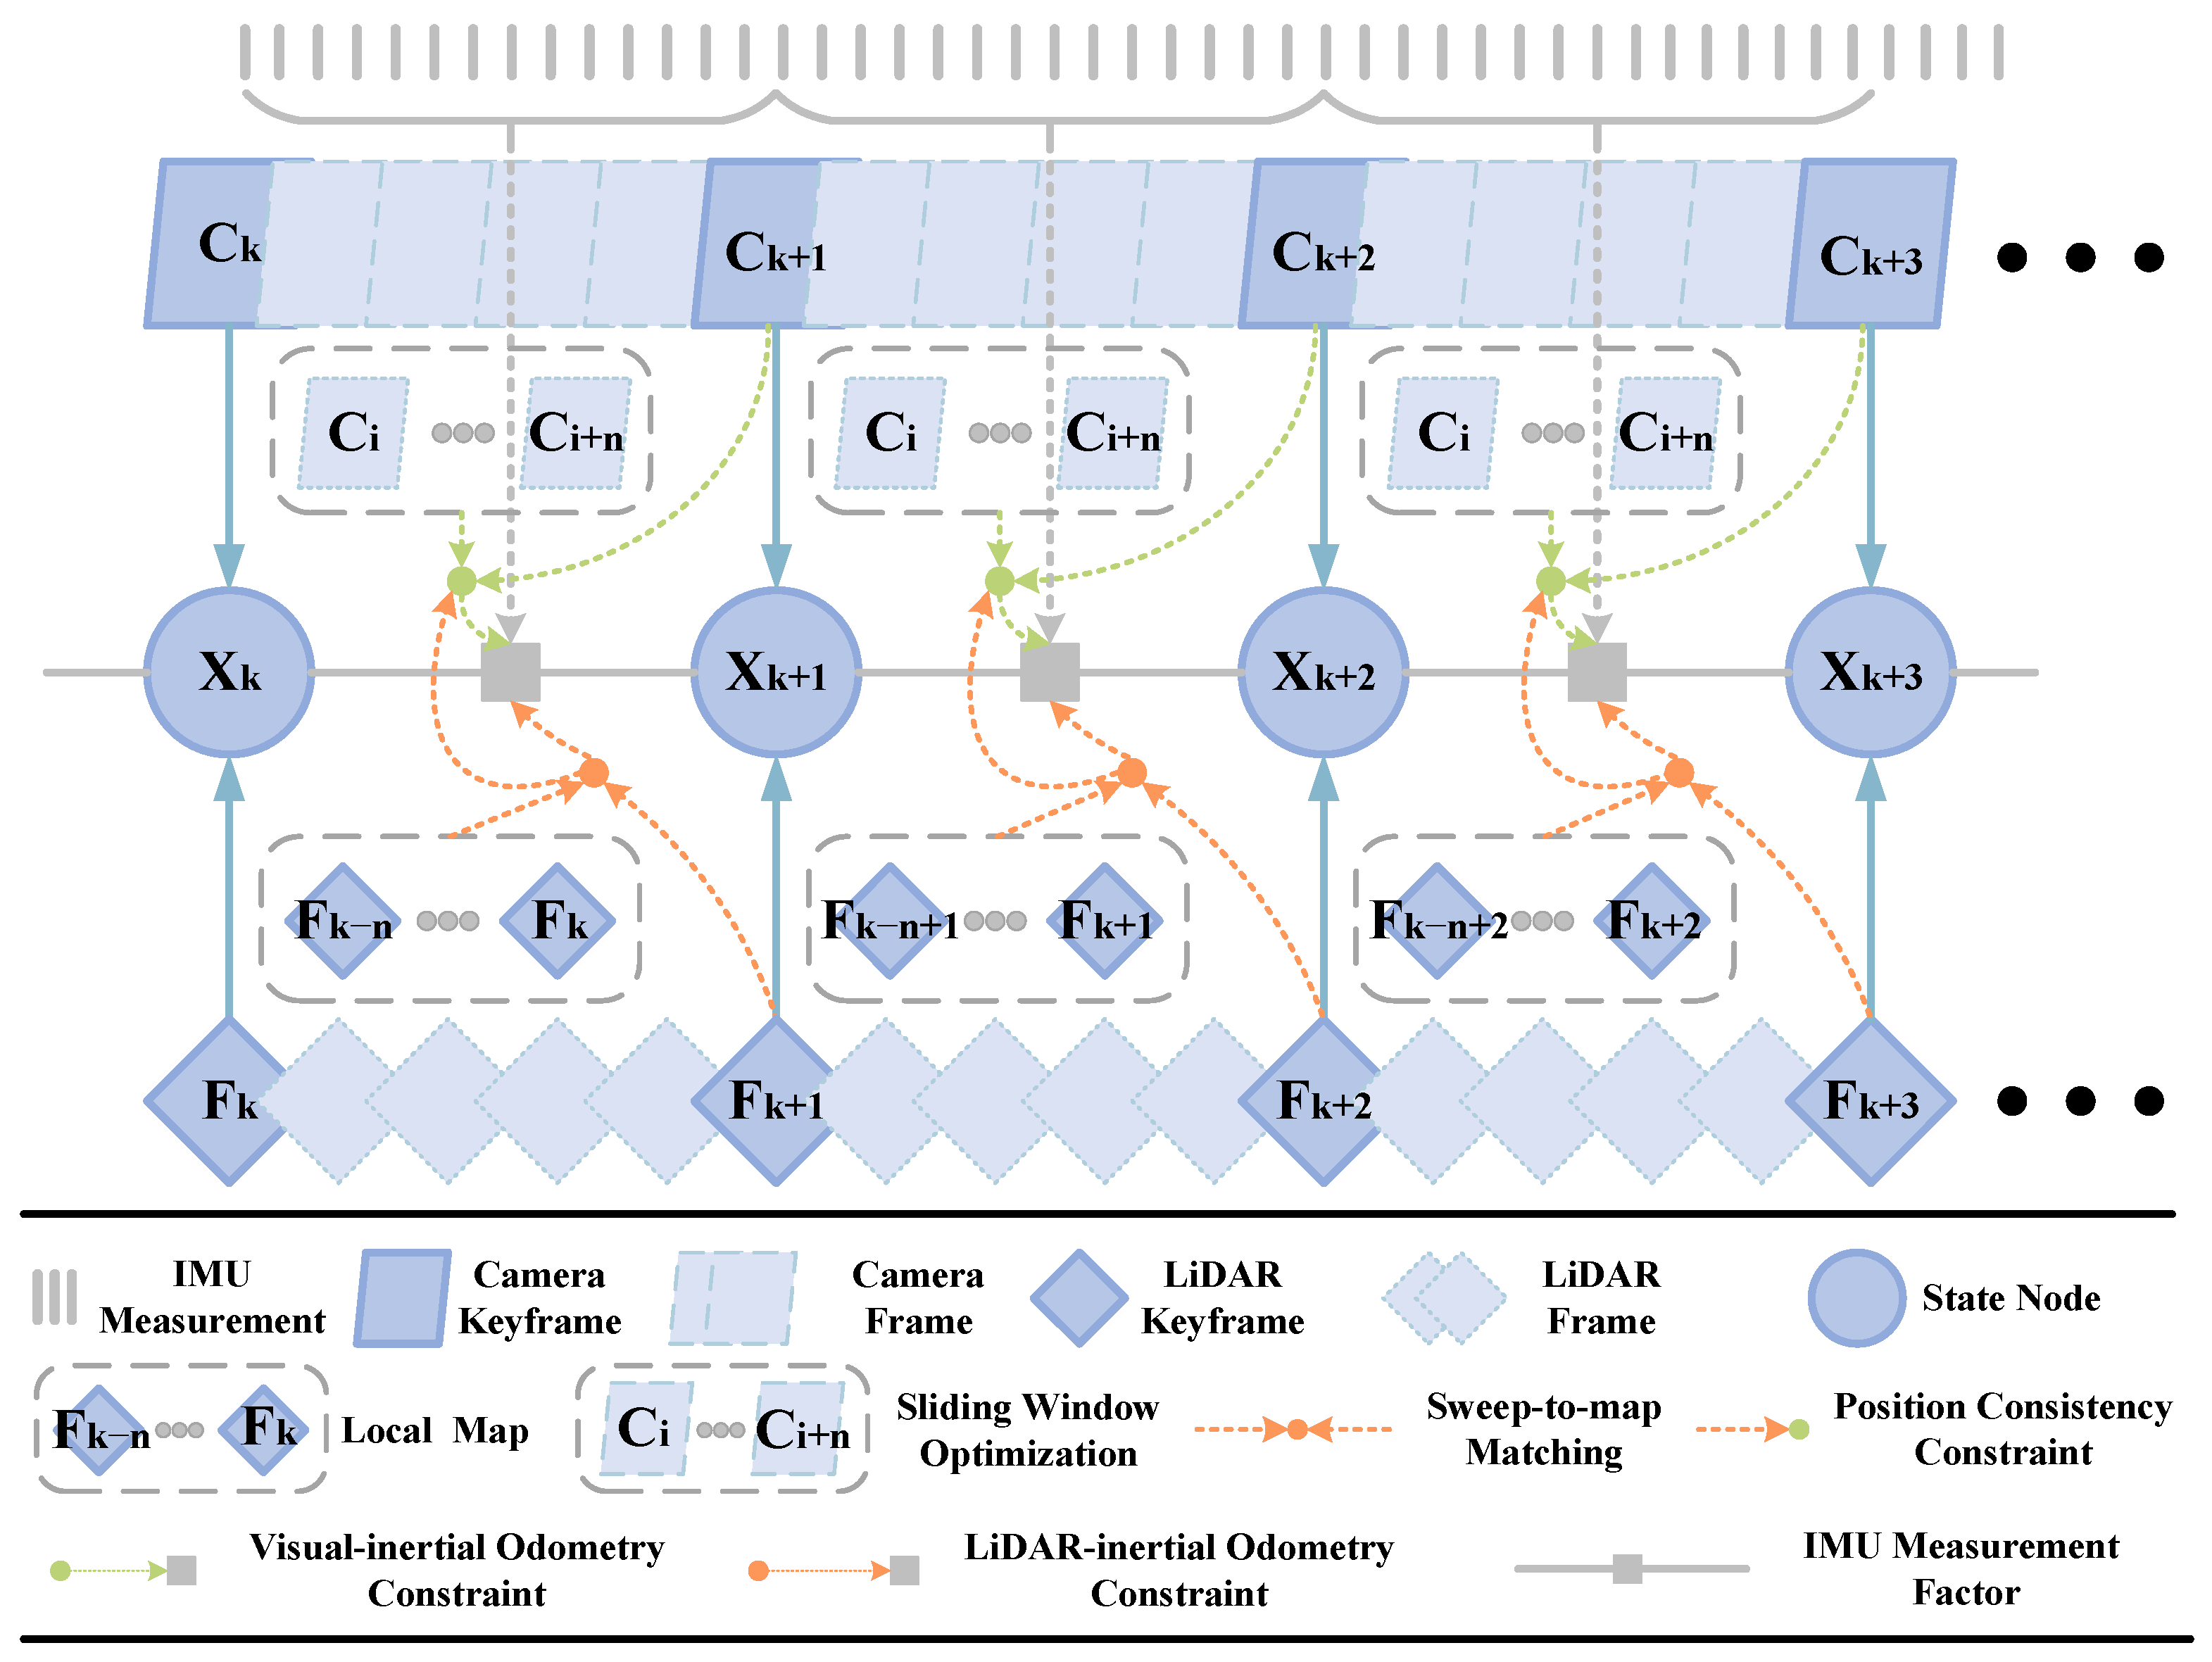
4.1. System Overview

The goal of our proposed system is to estimate the UAV state and construct the surrounding map. The intrinsic parameters of these sensors are assumed to be known. The extrinsic parameters between the three sensors have been calibrated to share a common coordinate system, with the IMU frame designated as the primary coordinate system. The camera and LiDAR frames are considered sub-coordinate systems. The definitions of these coordinate systems are illustrated in Figure 1. According to the figure, C, L, and B represent the coordinate systems of the camera, LiDAR, and IMU, respectively.
An overview of our system is illustrated in Figure 2. The IMU and visual modules provide prior poses and constraints to the LiDAR module, which is the main component of the system that uses motion estimation from coarse to fine. Initially, the camera input frequency reconstructs a LiDAR sweep to guarantee synchronized transmission between various sensors. Then, using cross-validation to assess the projection errors of visual feature-associated LiDAR points under various perspectives, the depth of visual features with large approximation errors and measurement noise is eliminated by outliers rejection. By utilizing temporal synchronization, the vision module receives the LiDAR pose from the previous instant, which helps to provide a position consistency constraint that enhances the accuracy of the camera pose estimation. To reduce the drift of the feature-based LiDAR module in scenes with fewer features, a direct point cloud registration method with IMU-constrained point-to-Gaussian surface error is proposed to be incorporated into the pose estimation.

4.2. Imu Module with High Frequency Correction

In this module, the LiDAR point cloud and camera image are synchronized to implement the transmission between the LiDAR module and the visual module. IMU measurements between two consecutive frames are integrated to align with the LiDAR point cloud and camera image.

4.2.1. Time Synchronization Based on Sweep Segmentation

Temporal interpolation techniques are used in most existing research on sensor time synchronization and are effective for matching data between sensors with noticeably differing frequencies [26]. However, when using sensors with resembling input frequencies (e.g., LiDAR and camera), errors can arise because of the large gaps between their sample periods.
To solve the problem of information lag caused by different sampling rates among sensors, a LiDAR sweep reconstruction algorithm controlled by camera input frequency is adopted to avoid ambiguous transmission between the LiDAR module and the visual module. Specifically, image acquisition time serves as the starting point for reconstructing the LiDAR sweep, which is motivated by the continuous sampling nature of LiDAR. This synchronization allows for simultaneous processing of camera images and LiDAR sweeps, avoiding interpolation or approximation operations during LiDAR and visual information fusion. This not only facilitates the transfer of enhanced depth and backward propagated poses from LiDAR to the camera but also provides higher frequency corrections to the IMU bias to improve the accuracy of IMU short-term predictions.

4.2.2. IMU Kinetic Model

Let the timestamps of two consecutive frames, F i and F j , be denoted as t i , t j . The measurements of the accelerometer and gyroscope during the time interval are described as:
a ^ k B = a k B g + b a k + n a , w ^ k B = w k B + b w k + n w .
where measurements between clock times t i and t j are denoted by the k = 1 , 2 , , n index. Motion measurements include gravity, g , motivation, a k B , and angular velocity, w k B . These measurements are interfered with biases b a k , b w k and measurement noise n a , n w .
In this work, a discrete-time IMU preintegration method is employed to obtain the relative motion within the time interval t i , t j [27]. The preintegrated measurements for orientation, Δ R ¯ i j , translation, Δ p ¯ i j , and velocity, Δ v ¯ i j , in the IMU frame are given by:
Δ R ¯ i j = R i R j k = i j 1 exp w ^ k b w i δ t , Δ v ¯ i j = R i v k v i g δ t k = i j 1 Δ R i k a ^ k b a i δ t , Δ p ¯ i j = R i p j p i v i δ t 1 2 g δ t 2 k = i j 1 Δ v i k δ t + 1 2 Δ R i k a ^ k b a i δ t 2 .
where δ t is the time interval between adjacent IMU measurements. The preintegration error in the IMU frame r I i j = r Δ R i j , r Δ v i j , r Δ p i j is naturally converted from (6):
r Δ R i j = log Δ R ¯ ( b w i ) R i R j , r Δ v i j = R i ( v j v i g Δ t i j ) Δ v ¯ i j ( b w i , b a i ) , r Δ p i j = R i ( p j p i v i Δ t i j 1 2 g Δ t i j 2 ) Δ p ¯ i j ( b w i , b a i ) .
The relative states of the other sensors are predicted by the IMU preintegration measurements within the time interval between consecutive frames. Superscript O represents the target sensor frame including the LiDAR frame and camera frame. Then, the prediction state can be expressed as follows:
Δ R i j O = R i O R j B Δ R ¯ i j B Δ v i j O = R i O v j O v i O g δ t R B O Δ v ¯ i j B Δ p i j O = R i O p j O p i O v i O δ t 1 2 g δ t 2 R B O Δ p ¯ i j B
where R B O is the rotation matrix in the external parameter between the target frame and the IMU frame. The solved relative states are leveraged to the feature tracking process in the visual module and the distortion elimination process in the LiDAR module.
IMU odometry error is triggered by slowly varying random drift in the accelerometer bias, b a i , and gyroscope bias, b w i . IMU measurement biases are jointly corrected using the LiDAR and visual poses. Additionally, the system state is optimized using multiple IMU measurement residuals, which are equivalent to the errors E i j C , E i j L between the IMU measurements and poses from the visual and LiDAR modules. The state estimation problem in Equation (2) is converted to minimize the IMU measurement residuals, as follows:
X n = arg min X n ( i , j ) T n ( E i j C ) Ω i j C E i j C + ( E i j L ) Ω i j L E i j L + E m .
where Ω i j is the uncertainty matrix of LiDAR and visual poses, which can be calculated based on the sensor measurement noise. E m is the marginalized prior, consisting of states and observations before the oldest state in the sliding window. The factor graph is shown in Figure 3.

4.3. Visual Module with Position Consistency Constraint

The visual-inertial module is implemented based on the LiDAR module assistance. In this module, the point reprojection method is designed to remove outliers of depth points. The position from LiDAR back-propagation is incorporated into visual-inertial optimization, achieving a refined camera pose.

4.3.1. Depth Association by Outliers Rejection

By utilizing external parameters between LiDAR and camera, the multiple LiDAR sweeps are projected on the image plane to generate depth map. Each feature depth is associated with three adjacent points on a unit sphere frame. The depth value is typically solved by spherical interpolation [28]. However, points with large incident angles of LiDAR will produce deviation. Therefore, the relative poses in the sliding window are leveraged to cross-cut evaluate the projection errors of depth points under different perspectives. In detail, the 3D landmark of the visual features z i c and z j c with depths d i and d j in frames F i and F j can be defined as P C . The reprojection residual error related to P C between frames F i and F j in the sliding window can be written as:
r C ( z i c ) = e i r p ( P C , x i ) = b 1 b 2 ( P C π c ( z j c ) ) , z j c = R B C ( R W B j ( R B k W ( R C B d i π c 1 ( z i c ) + t C B ) + t B k W ) + t W B j ) t B C
where π c 1 ( · ) is the back projection function. R B C and t B C are the rotation matrix and translation vector of the transformation between camera frame and IMU frame. R B W and t B W represent poses in the world frame. b 1 and b 2 are two orthogonal bases that span the tangent plane of z j c .
The depth of projected points from different perspectives is used to quantify the depth association:
τ i = exp ( β · e i r p ( P C , x i ) ) .
where the corresponding projection points are considered outliers if τ is greater than the preset threshold. β is a decay coefficient that has been manipulated. The average depth value of the interior projected points is calculated as the final depth value. In addition, the visual features will be removed if the number of depth measurements is below a certain threshold. The final features with modified depth are further utilized to update the visual map.

4.3.2. Motion Estimation Assisted by LiDAR Odometry Back-propagation

The aims of the visual module are improving the robustness of the overall system and providing an initial guess for the LiDAR module. In our work, the LiDAR point clouds and visual images are synchronized and consistent. To improve the localization accuracy of the visual odometry, the position consistency constraint is proposed by incorporating backward propagated poses from the LiDAR module into the sliding window optimization. The definition of the above constraint is as follows:
C p o ( T k C ) = [ T k 1 L T L C ( T k 1 C ) 1 T k C ] : t ( T k C ) : t 2
where C p o ( T k C ) ensures that the location of the camera and the transformed LiDAR, using the external parameters T L C , are consistent at the k-th keyframe. T k 1 L and T k 1 C are the 6-DoF poses of LiDAR and the camera frame at the k 1 -th keyframe, respectively. ( ) : t represents the translation vector of the transformation matrix.
For each newly acquired camera keyframe, motion estimation is implemented by jointly adjusting the camera poses T C = ( T 1 C , , T n C ) and the 3D observations, C . This process is formulated by minimizing the sum of the feature observation residual error, r C ( z k c ) , IMU preintegration error, r I , and constraint, C p o , as follows:
( T k C ) * = arg min T k C r I + + c C k r C ( z k c ) 2 + C p o
The IMU states and visual features of the regular frames and removed keyframes are marginalized as prior to constrain the sliding window optimization [29]. In addition, if the LiDAR module fails completely, the visual pose is output as the final state to ensure robustness.

4.4. Adaptive LiDAR Module with Hybrid Registration Mode

Existing feature-based LiDAR-inertial odometry may fail to work in geometrically uninformative environments, pushing optimization toward divergence along weakly constrained directions. In this paper, the LiDAR module adopts a hybrid registration method, which utilizes a feature-based approach to obtain the rough pose in high-level structured scenes and performs the point-to-surface matching algorithm under IMU constraints in unstructured scenes, achieving accurate and robust pose estimation.

4.4.1. Structure Monitor Based on Vertical Landmarks

After receiving a new sweep, the firstly performed feature extraction is employed to divide the original point cloud into edge points, F n e , and plane points, F n p , according to the smoothness of the local surface [30]. The set of total features is denoted as F n at the n-th frame. The smoothness, S ( p i ) , of the LiDAR point p i is calculated as follows:
S ( p i ) = 1 B i j B i , j i ( r j r i ) , r b < r i r m .
where r i represents the range of the point p i . r b and r m are the blind distance and the maximum distance of the return points, respectively. B i is the set of consecutive points of p i from the same scan. B i is the number of points in B i .
The edge points are extracted if S ( p i ) greater than preset threshold, S t h . Then, all edge points of the current sweep are projected onto the horizontal plane, which is divided into N s regions. The direction from the LiDAR origin to the edge points is used to allocate the edge points on the horizontal plane. Assume the positions of the edge features in the horizontal plane follow a Gaussian distribution. In each region, the 2D positions will be used as samples for local kernel density estimation, iteratively moving in the direction of increasing density. As a result, the sample points will eventually converge at the local maximum density, and the points that converge to the same local maximum are considered members of the same cluster. The final clustering result is the set of points in the region with the highest density of edge points. Figure 4 illustrates the aforementioned aggregation process. The  N s -dimensional vector is obtained by forming the results of all regions:
U n = η 1 V 1 , η 2 V 2 , , η N s V N s .
where η i is the normalized factor: η i = N i / N t a t a l . N i represents the number of points in the i-th sector in the horizontal plane. N t a t a l is the number of all points in the horizontal plane. If  N i < N t h , η i is set to zero, where N t h is the preset threshold of points number in one sector. The weighted distance vector of the i-th sector can be calculated by:
V i = k = 1 N i exp ( d k h σ 2 ) .
where N i is the number of points in the i-th sector in the horizontal plane. d k h is the horizontal range of the k-th point in the i-th sector. σ is the attenuation factor for adjusting distance weights.
The environmental structure, C n , is then quantified by the dispersion of the N s -dimensional vector. A greater degree of dispersion indicates a higher level of environmental structuring. The details are illustrated by:
C n = v a r ( U n ) = 1 N s i = 1 N s ( η i V i 1 N s j = 1 N s η j V j ) .
The threshold C t h , used in this method to distinguish between environmental structures, can be empirically set to 5. The quantitative environmental structuring is used to adjust the LiDAR module’s operating mode.

4.4.2. Hybrid Point Cloud Alignment

The sparsity of LiDAR sweeps may lead to imprecise vertical constraints, especially in open and unstructured environments, failing to estimate the altitude variables r o l l , p i t c h , and z in point cloud alignment. To tackle these problems, we propose a hybrid point cloud alignment strategy that performs two modes according to the output of the structure monitor. In structured scenes, the point-to-feature model with distance weight is minimized to solve the LiDAR pose. In unstructured scenes, a novel point-to-surface model is generated to register the non-planar surface, achieving refined pose estimation. The point cloud alignment strategy is shown in Algorithm 1.
Algorithm 1 Hybrid Point Cloud Registration
1:
  Input:  F k , C k , T k 1 L , M k 1 l , Δ R ( k 1 , k ) L , Δ p ( k 1 , k ) L
2:
  Output:  T k L
3:
  While  F k  do
4:
         T ˇ k L InitialGuess T k 1 L , T k 1 C , Δ R ( k 1 , k ) L , Δ p ( k 1 , k ) L
5:
        if  C k > C t h  then
6:
           S F k Point 2 FeatureDistance F k , M k 1 l
7:
           r p f WeightedRegistrationError S F k , w ( M k 1 l )
8:
           T k L LiDARPose . minimize r p f
9:
        else
10:
           r p g Point 2 GaussianError F k , M k 1 l
11:
           λ ( F k ( T ˇ k L ) ) ResidualErrorTransform r p g
12:
           T k L LiDARPose . minimize ( λ ( F k ( T ˇ k L ) ) )
13:
      end if
14:
      return  T k L
15:
end
If C n > C t h , the n-th sweep is considered structured. In this case, the j-th feature, f j L , in F n is transformed from the m-th map point, P m G , in the global frame by the pose T n L , where T n L = ( R n L , t n L ) . The feature in the global frame is defined by:
P m G = R n L f j L + t n L .
According to the widely used ICP method [31,32], the rigid transformation, T , between the prior map, M l , and the feature cloud, F n , at the n-th frame can be solved by minimizing the feature registration error, r p f ( P m G ) , including the weighted point-to-feature distance S F i ( f j , P m G ) :
r L ( z i l ) = r p f = f j L F i w ( P m G ) · S F i ( f j L , P m G ) f j L F i w ( P m G ) , S F i ( f j L , P m G ) = n m f j L P m G + l m f j L P m G .
where w ( P m G ) = e P m G c 2 / σ 2 is the weight, which declines as distance is gained. The parameter σ is chosen to exclude features that are more than 3 σ distances from the feature center, c, on the local map. S F i ( f m L , P m L ) is the distance function, where n m and l m represent dominant vectors of the corresponding feature.
Typically, point cloud alignment with point-to-feature error yields consistent matching results. However, in unstructured environments, edge points are insufficient to provide adequate constraints, and the numerous surfaces cannot be accurately represented by regular planes. The point-to-Gaussian distance is modeled to provide a more generalized representation with Gaussian mean and uncertainty. Figure 5 shows these two models in different scenes.
Let the neighbor region of P m G include a set of LiDAR points q i ( i = 1 , , M ) . P m G has an uncertainty, Σ P m G , due to LiDAR measurement noise and position estimation errors. The uncertainty model of an irregular surface is illustrated in Figure 5b. The Gaussian mean of P m G is set to its 3D position. The uncertainty is the inverse of the covariance, W , which is calculated from the neighbor points and is expressed as W = 1 / M i = 1 M ( q i P m G ) ( q i P m G ) . The cost function of the point-to-Gaussian surface is described as follows:
( T n L ) * = arg min T n L r p g ( M l , F n , T n L ) = arg min T n L j = 1 ( e W 1 e ) j
where the Mahalanobis distance between the target frame point and the corresponding Gaussian surface point is minimized rather than the Euclidean distance.
The inverse matrix of covariance W 1 is composed of an eigenvector matrix, N , and a diagonal matrix, Λ , formed by eigenvalues. So, we can calculate the point-to-surface error by the decomposed W 1 :
r p g ( M l , F n , T n L ) = j = 1 ( e j N Λ N e j ) = j = 1 e j [ v 1 , v 2 , v 3 ] diag ( λ 1 , λ 2 , λ 3 ) [ v 1 , v 2 , v 3 ] e j = j = 1 λ 1 ( e j v 1 v 1 e j ) + λ 2 ( e j v 2 v 2 e j ) + λ 3 ( e j v 3 v 3 e j ) .
where λ 1 , λ 2 , λ 3 are descending eigenvalues of W 1 , and v 1 , v 2 , v 3 are the corresponding eigenvectors. Then, the standard least squares definition of the point-to-surface cost function can be obtained:
r p g ( M l , F n , T n L ) = k = 1 i = 1 λ k ( f ˜ j ( T ˇ n L ) ) = k = 1 j = 1 λ k v k ( R ˇ n L f j L + t ˇ n L P m G ) 2 2
where R ˇ n L and t ˇ n L are the rotation and translation part of the initial transformation, T ˇ n L . The initial pose, T ˇ n L , can be jointly calculated by the previous pose, T n 1 L , and the prediction state Δ R ( n 1 , n ) L , Δ p ( n 1 , n ) L from IMU. f ˜ j is the transformed point from F n by T ˇ n L . Further, the second-order Taylor expansion of the eigenvalue matrix λ k ( f ˜ j ( T ˇ n L ) ) is denoted by:
λ k ( f ˜ j ( T ˇ n L ) ) λ k f ˜ j + J ( f ˜ j ) δ f + 1 2 δ f ˜ H ( f ˜ j ) δ f
where J ( f ˜ j ) and H ( f ˜ j ) are the Jacobian matrix and the Hessian matrix of λ k ( f ˜ j ( T ˇ ) ) , respectively.
Additionally, due to the insufficient vertical constraints in unstructured scenes, the point-to-surface model is modified for 3-DoF state estimation, that is, only the three horizontal DoF poses will be estimated. In this case, projecting the corresponding pose T n L of f ˜ j on the tangent plane, we have:
T n L = T ˇ n δ T = R ( γ n ) exp ( δ γ n ) , t n | x , y + δ t R γ n = cos γ n sin γ n 0 sin γ n cos γ n 0 0 0 1 I + 0 1 0 1 0 0 0 0 0 γ n f ˜ j = R ( γ n ) exp ( δ γ n ) f j L + t n | x , y + δ t
By differentiating the projected point f ˜ j with respect to pose T ^ n L , we can obtain:
λ ( T ˇ n L δ T ) λ T ˇ n L + J A J ˜ δ T + 1 2 δ T A H A H ˜ δ T A = δ f ˜ j δ T = ( f j L ) 0 1 0 1 0 0 0 0 0 γ n ( f j L ) I
The objective function of point cloud registration can be formulated by:
( H ˜ ( T n L ) + μ I ) δ T * = J ˜ ( T n L ) .
where μ is employed to adjust the iterative process. Finally, we minimize the cost function to refine pose T n L by repeatedly calculating its second-order derivative using the Levenberg–Marquardt (LM) approach.

5. Experimental Results

The full system’s tests are conducted on an Intel Core i7-10700K CPU with 16 GB RAM. In this section, the accuracy and robustness of the proposed system are evaluated in off-line mode, and the runtime evaluation demonstrates that the proposed system can operate in real time. The UAV localization accuracy is tested between the proposed algorithm and the advanced algorithms in highly structured scenes. In robust testing, trajectory comparisons for structurally weaker scenes with two advanced LiDAR-visual-IMU odometry methods is performed. A public dataset and a private dataset are employed as test sets. The NTU-VIRAL dataset is collected by equipping the UAV with sensors such as 3D rotating LiDARs, global shutter cameras, IMUs, and ultra wideband ranging units [33]. This dataset records multiple sequences under several challenging indoor and outdoor conditions. In this experiment, nine outdoor sequences from NTU-VIRAL are used for localization accuracy evaluation. In addition, we acquire a campus sequence of the low-altitude environment for testing location accuracy, and construct a high-precision 3D map. Three structurally different outdoor scenes are captured using LiDAR, a pinhole camera, and IMU: grove, beach, and desert. The platform and the private dataset are shown in Figure 6.

5.1. Structure Monitor Evaluation

In this section, a vertical observation-based structural monitor is employed to quantify the structure of different scenarios. The sequences from both public and private datasets are quantified separately, as shown in Table 2. A data sequence is defined, structured if its quantitative result exceeds 5; otherwise, it is regarded as unstructured. As shown in Table 2, the quantitative results indicate that all sequences in the public dataset and the campus sequence in the private dataset were collected in structured environments, whereas the grove, beach, and desert sequences reflect unstructured environments. The quantitative results of the unstructured scenes are show in Figure 7. In the structured environments, localization accuracy is the primary concern, while, in unstructured scenes, the focus shifts to ensuring stable system operation.

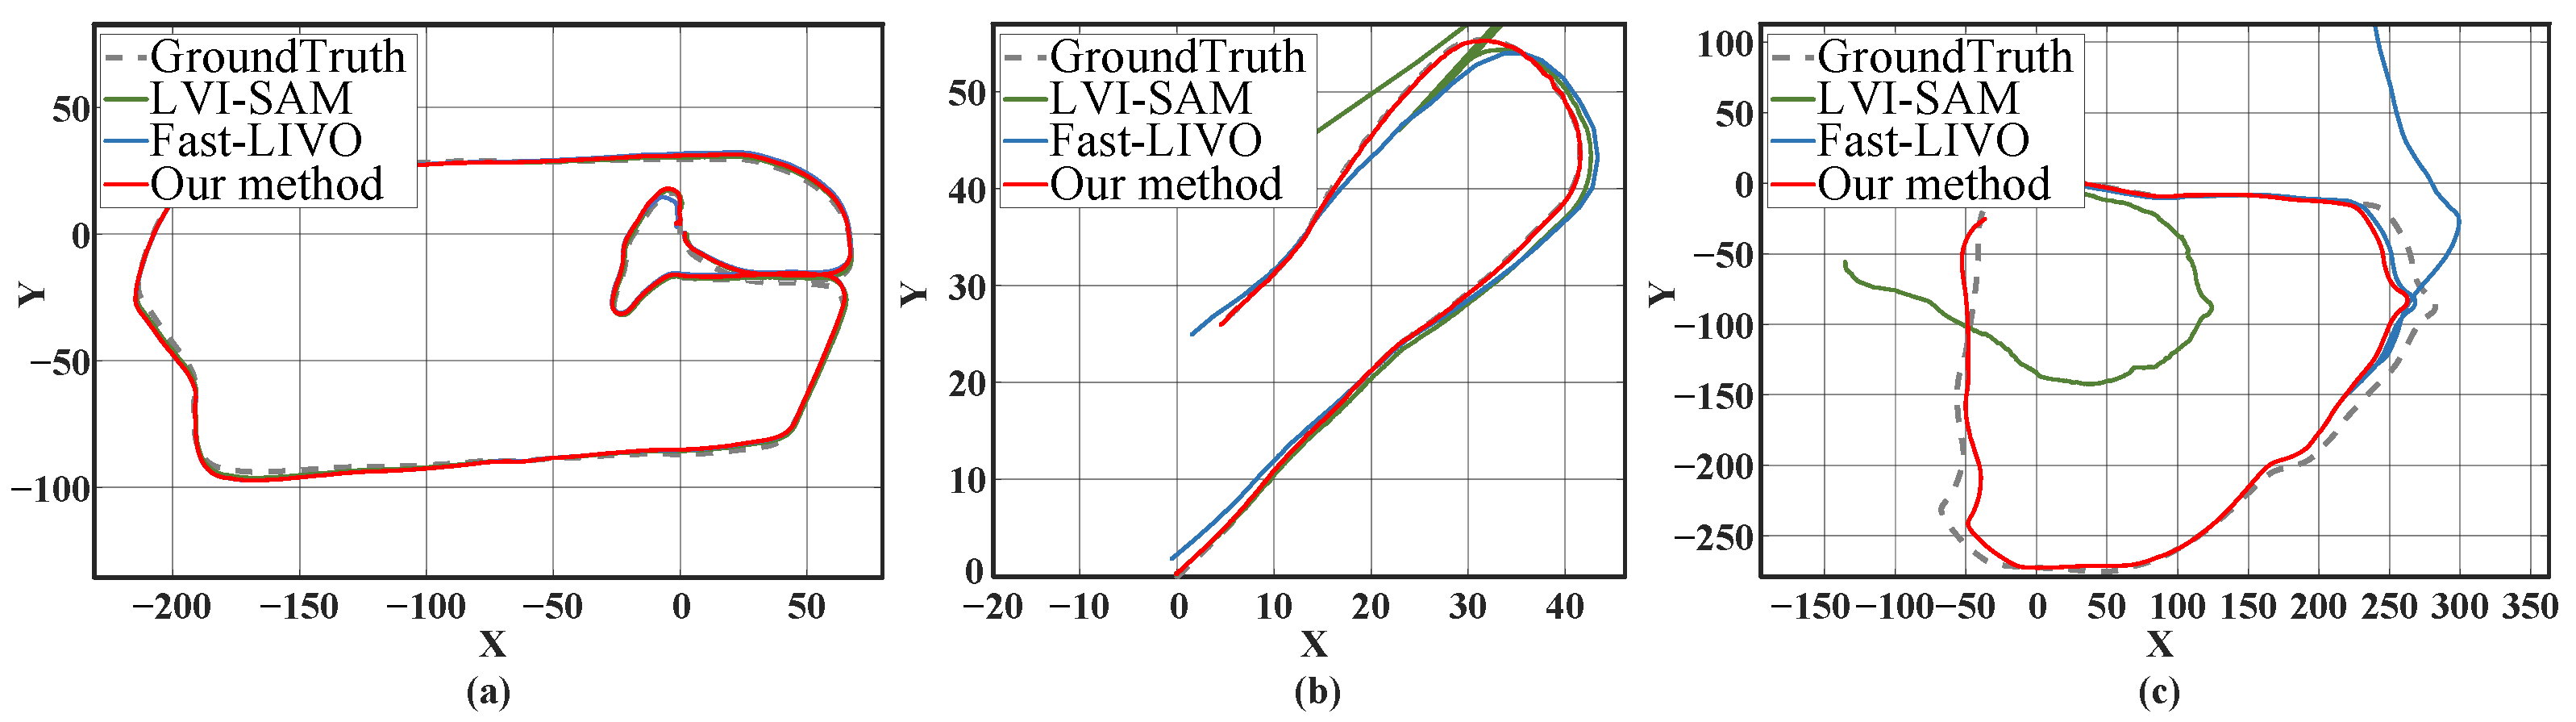
5.2. System Localization Accuracy Evaluation

The evaluation results of localization accuracy are shown in Table 3. The localization error is dictated by the root mean square error (RMSE) of translation estimation. As shown in Table 2, the proposed method has higher localization accuracy than state-of-the-art LiDAR-visual-IMU odometry in structured scenes such as rtp, sbs, and tnp data sequences. In the NTU-VIRAL public dataset, the proposed system can maintain near-optimal localization performance in most data sequence tests. However, its performance in the rtp data sequence is slightly inferior to that of the LiDAR-IMU system. This is because strong lighting variations interfere with the visual module’s localization accuracy, thus increasing the translation error. Additionally, the LiDAR module is not affected by sensor degradation in the rtp data sequence. Therefore, LiDAR-inertial odometry can obtain better location results than LiDAR-visual-inertial odometry with optical noise interference. Unlike other tightly coupled sensor fusion localization schemes such as FAST-LIVO and mVIL-Fusion [34], the proposed system uses the output of the visual module only as the initial value for the next pose estimation stage, making it less dependent on the visual module. Even if the visual module fails, the proposed system can still deliver accurate positioning. The real-time mapping results of rtp, sbs, and tnp are shown in Figure 8; the proposed system provides structured point clouds and signs without distortion to exhibit low-drift localization performance. The 3D point cloud map of the campus sequence in the private dataset is shown in Figure 9, where static objects can all be recognized clearly. In addition, Figure 10 illustrates the positioning error of the proposed system in the publicly available NTU-VIRAL dataset, with a focus on annotating the minimum error, average error, and maximum error between the proposed system and the ground truth trajectories. Overall, in testing with the public dataset, our proposed system reduced localization errors by 25.1%, 29.5%, 15.7%, 50.0%, and 55.8% compared with LIO-SAM, LVI-SAM, FAST-LIO2, FAST-LIVO, and mVIL Fusion, respectively, after excluding the failure and mismatch of each system.

5.3. System Robustness Evaluation

In this section, hierarchical unstructured scenarios are employed to test the localization accuracy of the proposed system. The localization error is shown in Table 2. The difficulty of grove, beach, and desert sequences increases progressively. The grove scene is the most structured, with minimal brightness variation, making the environment relatively easier. However, due to the grove sequence covering a distance of 983.5 m , the cumulative error is relatively large. The beach scene covers only 137.3 m and, like the r t p sequence in the public dataset, has strong visual interference. Due to its low level of structuring, the positioning error is larger compared with the r t p sequence. The total distance of the desert sequence is 988.3 m , with minimal changes in luminosity. However, the degree of structuring is extremely low, and there is almost no vertical observation. As a result, pose estimation can only rely on ground point clouds, leading to the complete failure of feature-based LiDAR odometry methods. Despite this, our method with point-to-surface registration can still maintain high accuracy in this scenario, ensuring that system localization does not fail. Figure 11 shows the positioning trajectory of the proposed system compared with FAST-LIVO and LVI-SAM in unstructured scenarios. Compared with these two state-of-the-art methods, the proposed system is closer to the ground truth and has relatively smaller positioning errors.

5.4. Runtime Evaluation

The runtime of the proposed method is evaluated in the grove sequence. As shown in Table 4, the time consumption of the proposed system is divided into the visual module, LiDAR module, and IMU module. The visual module includes the extraction and matching of visual features, feature management, and data alignment, as well as image-based pose solving. The LiDAR module includes preprocessing, feature extraction, structure monitor, and hybrid point cloud tracking. The IMU module has an IMU measurement preintegration section and factor graph optimization section. These three modules run in parallel mode. According to the results in Table 3, the average running time of the vision module, LiDAR module, and IMU module is 48.1 ms , 39.17 ms , and 0.425 ms , respectively, which is lower than the acquisition time of the camera and LiDAR. Overall, the experimental results demonstrate that the proposed system can operate in real time.

6. Conclusions

This article presents a sensor fusion system coupling LiDAR, cameras, and IMUs to reduce trajectory error and ensure robust operation of UAVs. The visual module is supported by LiDAR measurements and pose to estimate feature depth and visual pose. The estimated feature depth is validated by calculating the reprojection error using corresponding 3D observations within a sliding window in the visual module, which helps to remove outliers. Additionally, the LiDAR pose is back-propagated to constrain visual pose estimation, achieving an enhanced camera pose of the UAV. The LiDAR module employs a structure monitor to switch matching modes in various environments. In unstructured environments, we use Gaussian probability-based uncertainty to model irregular surfaces. This uncertainty is then decoupled into eigenvalues and eigenvectors, and a pose estimation objective function is constructed to achieve accurate localization. Finally, the IMU measurement errors with the LiDAR and visual modules are used to construct the odometry factor, which is incorporated into the factor graph optimization to complete the state solution of the UAV. Experimental results with UAVs demonstrate that the proposed system outperforms state-of-the-art algorithms by averagely reducing localization errors by at least 15.7%. In unstructured scenarios, the algorithm proposed in this paper leads the other control algorithms by at least 12.6%, effectively improving the localization accuracy of UAVs in unstructured environments. The system runs about 48.525 ms per frame, which meets the task requirements for real-time work. In future research, we will explore a sensor fusion architecture on UAVs that integrates satellite navigation and full-domain place recognition for long-term localization, aiming to maintain system accuracy and robustness.

Author Contributions

Conceptualization, B.Z. and X.S.; methodology, B.Z.; software, Y.W.; validation, B.Z., X.S. and G.S.; formal analysis, W.Y.; investigation, X.S.; resources, B.Z.; data curation, Y.W.; writing—original draft preparation, B.Z.; writing—review and editing, X.S.; visualization, Y.W.; supervision, W.Y.; project administration, G.S.; funding acquisition, G.S. All authors have read and agreed to the published version of the manuscript.

Funding

This work was supported in part by the National Natural Science Foundation of China (U23A20346, 62033005, 62173107, and 62106062), in part by the Key Project of Natural Science Foundation of Heilongjiang Province (No. ZD2021F001), and in part by the Postdoctoral Fellowship Program of China Postdoctoral Science Foundation under Grant GZC20233462.

Data Availability Statement

Data are contained within the article.

Conflicts of Interest

The authors declare no conflicts of interest.

References

  1. Liu, Y.; Bai, J.; Wang, G.; Wu, X.; Sun, F.; Guo, Z.; Geng, H. UAV Localization in Low-Altitude GNSS-Denied Environments Based on POI and Store Signage Text Matching in UAV Images. Drones 2023, 7, 451. [Google Scholar] [CrossRef]
  2. Wang, R.; Deng, Z. Rapid Initialization Method of Unmanned Aerial Vehicle Swarm Based on VIO-UWB in Satellite Denial Environment. Drones 2024, 8, 451. [Google Scholar] [CrossRef]
  3. Fu, J.; Yao, W.; Sun, G.; Ma, Z.; Dong, B.; Ding, J.; Wu, L. Multi-robot Cooperative Path Optimization Approach for Multi-objective Coverage in a Congestion Risk Environment. IEEE Trans. Syst. Man Cybern. Syst. 2024, 54, 1816–1827. [Google Scholar] [CrossRef]
  4. Shao, X.; Sun, G.; Yao, W.; Liu, J.; Wu, L. Adaptive Sliding Mode Control for Quadrotor UAVs with Input Saturation. IEEE-ASME T MECH. 2022, 27, 1498–1509. [Google Scholar] [CrossRef]
  5. Qin, T.; Li, P.; Shen, S. VINS-mono: A Robust and Versatile Monocular Visual-inertial State Estimator. IEEE Trans. Robot. 2018, 34, 1004–1020. [Google Scholar] [CrossRef]
  6. Qin, C.; Ye, H.; Pranata, C.E.; Han, J.; Zhang, S.; Liu, M. LINS: A LiDAR-inertial State Estimator for Robust and Efficient Navigation. In Proceedings of the 2020 IEEE International Conference on Robotics and Automation, Paris, France, 31 May–31 August 2020; pp. 8899–8906. [Google Scholar]
  7. Shu, C.; Luo, Y. Multi-Modal Feature Constraint Based Tightly Coupled Monocular Visual-LiDAR Odometry and Mapping. IEEE Trans. Intell. Veh. 2023, 8, 3384–3393. [Google Scholar] [CrossRef]
  8. Xie, J.; He, X.; Mao, J.; Zhang, L.; Hu, X. C2VIR-SLAM: Centralized Collaborative Visual-Inertial-Range Simultaneous Localization and Mapping. Drones 2022, 6, 312. [Google Scholar] [CrossRef]
  9. Xu, W.; Zhang, F. FAST-LIO: A Fast, Robust LiDAR-inertial Odometry Package by Tightly-coupled Iterated Kalman Filter. IEEE Robot. Autom. Lett. 2021, 6, 3317–3324. [Google Scholar] [CrossRef]
  10. Shan, T.; Englot, B.; Meyers, D.; Wang, W.; Ratti, C.; Rus, D. LIO-SAM: Tightly-coupled Lidar Inertial Odometry via Smoothing and Mapping. In Proceedings of the 2020 IEEE/RSJ International Conference on Intelligent Robots and Systems, Las Vegas, NV, USA, 25–29 October 2020; pp. 5135–5142. [Google Scholar]
  11. Nguyen, T.M.; Cao, M.; Yuan, S.; Lyu, Y.; Nguyen, T.H.; Xie, L. VIRAL-Fusion: A Visual-Inertial-Ranging-Lidar Sensor Fusion Approach. IEEE Trans. Robot. 2022, 38, 958–977. [Google Scholar] [CrossRef]
  12. Zuo, X.; Yang, Y.; Geneva, P.; Lv, J.; Liu, Y.; Huang, G.; Pollefeys, M. LIC-Fusion 2.0: LiDAR-Inertial-Camera Odometry with Sliding-Window Plane-Feature Tracking. In Proceedings of the 2020 IEEE/RSJ International Conference on Intelligent Robots and Systems, Las Vegas, NV, USA, 25–29 October 2020; pp. 5112–5119. [Google Scholar]
  13. Shan, T.; Englot, B.; Ratti, C.; Rus, D. LVI-SAM: Tightly-coupled Lidar-Visual-Inertial Odometry via Smoothing and Mapping. In Proceedings of the 2021 IEEE International Conference on Robotics and Automation, Xi’an, China, 30 May–5 June 2021; pp. 5692–5698. [Google Scholar]
  14. Lin, J.; Zhang, F. R3LIVE: A Robust, Real-time, RGB-colored, LiDAR-Inertial-Visual tightly-coupled state Estimation and mapping package. In Proceedings of the 2022 International Conference on Robotics and Automation, Philadelphia, PA, USA, 23–27 May 2022; pp. 10672–10678. [Google Scholar]
  15. Zheng, C.; Zhu, Q.; Xu, W.; Liu, X.; Guo, Q.; Zhang, F. FAST-LIVO: Fast and Tightly-coupled Sparse-Direct LiDAR-Inertial-Visual Odometry. In Proceedings of the 2022 IEEE/RSJ International Conference on Intelligent Robots and Systems, Kyoto, Japan, 23–27 October 2022; pp. 4003–4009. [Google Scholar]
  16. Zhang, J.; Singh, S. Laser-visual-inertial Odometry and Mapping with High Robustness and Low Drift. J. Field Robot. 2018, 35, 1242–1264. [Google Scholar] [CrossRef]
  17. Wisth, D.; Camurri, M.; Fallon, M. VILENS: Visual, Inertial, Lidar, and Leg Odometry for All-Terrain Legged Robots. IEEE Trans. Robot. 2023, 39, 309–326. [Google Scholar] [CrossRef]
  18. Yuan, Z.; Wang, Q.; Cheng, K.; Hao, T.; Yang, X. SDV-LOAM: Semi-Direct Visual–LiDAR Odometry and Mapping. IEEE Trans. Pattern Anal. Mach. Intell. 2023, 45, 11203–11220. [Google Scholar] [CrossRef] [PubMed]
  19. Shan, T.; Englot, B. LeGO-LOAM: Lightweight and Ground-Optimized Lidar Odometry and Mapping on Variable Terrain. In Proceedings of the 2018 IEEE/RSJ International Conference on Intelligent Robots and Systems, Madrid, Spain, 1–5 October 2018; pp. 4758–4765. [Google Scholar]
  20. Chen, S.; Ma, H.; Jiang, C.; Zhou, B.; Xue, W.; Xiao, Z.; Li, Q. NDT-LOAM: A Real-Time Lidar Odometry and Mapping With Weighted NDT and LFA. IEEE Sensors J. 2022, 22, 3660–3671. [Google Scholar] [CrossRef]
  21. Cui, Y.; Zhang, Y.; Dong, J.; Sun, H.; Chen, X.; Zhu, F. LinK3D: Linear Keypoints Representation for 3D LiDAR Point Cloud. IEEE Robot. Autom. Lett. 2024, 9, 2128–2135. [Google Scholar] [CrossRef]
  22. Zhang, J.; Singh, S. LOAM: Lidar Odometry and Mapping in Real-time. In Proceedings of the 2014 Robotics: Science and Systems, Berkeley, CA, USA, 12–16 July 2014. [Google Scholar]
  23. Guo, S.; Rong, Z.; Wang, S.; Wu, Y. A LiDAR SLAM with PCA-based feature extraction and two-stage matching. IEEE Trans. Instrum. Meas. 2022, 71, 1–11. [Google Scholar] [CrossRef]
  24. Choi, S.; Chae, W.H.; Jeung, Y.; Kim, S.; Cho, K.; Kim, T.W. Fast and Versatile Feature-Based LiDAR Odometry via Efficient Local Quadratic Surface Approximation. IEEE Robot. Autom. Lett. 2023, 8, 640–647. [Google Scholar] [CrossRef]
  25. Chen, K.; Lopez, B.T.; Agha, M.; Ali, A.; Mehta, A. Direct LiDAR Odometry: Fast Localization with Dense Point Clouds. IEEE Robot. Autom. Lett. 2022, 7, 2000–2007. [Google Scholar] [CrossRef]
  26. Chen, G.; Hong, L. Research on Environment Perception System of Quadruped Robots Based on LiDAR and Vision. Drones 2023, 7, 329. [Google Scholar] [CrossRef]
  27. Forster, C.; Carlone, L.; Dellaert, F.; Scaramuzza, D. On-Manifold Preintegration for Real-Time Visual-inertial Odometry. IEEE Trans. Robot. 2017, 33, 1–21. [Google Scholar] [CrossRef]
  28. Zuo, X.; Geneva, P.; Lee, W.; Liu, Y.; Huang, G. LIC-Fusion: LiDAR-Inertial-Camera Odometry. In Proceedings of the 2019 IEEE/RSJ International Conference on Intelligent Robots and Systems, Macau, China, 4–8 November 2018; pp. 5848–5854. [Google Scholar]
  29. Campos, C.; Elvira, R.; Rodriguez, G.J.J.; Montiel, M.M.J.; Tardos, J.D. ORB-SLAM3: An Accurate Open-source Library for Visual, Visual¨Cinertial, and Multimap SLAM. IEEE Trans. Robot. 2021, 37, 1874–1890. [Google Scholar] [CrossRef]
  30. Xu, M.; Lin, S.; Wang, J.; Chen, Z. A LiDAR SLAM System With Geometry Feature Group-Based Stable Feature Selection and Three-Stage Loop Closure Optimization. IEEE Trans. Instrum. Meas. 2023, 72, 1–10, Erratum in IEEE Trans. Instrum. Meas. 2023, 7, 524. [Google Scholar] [CrossRef]
  31. Zhou, R.; Sun, H.; Ma, K.; Tang, J.; Chen, S.; Fu, L.; Liu, Q. Improving Estimation of Tree Parameters by Fusing ALS and TLS Point Cloud Data Based on Canopy Gap Shape Feature Points. Drones 2023, 7, 524. [Google Scholar] [CrossRef]
  32. Baah, G.A.; Savin, I.Y.; Vernyuk, Y.I. Pollution from Highways Detection Using Winter UAV Data. Drones 2023, 7, 178. [Google Scholar] [CrossRef]
  33. Nguyen, T.M.; Yuan, S.; Cao, M.; Lyu, Y.; Nguyen, T.H.; Xie, L. NTU VIRAL: A visual-inertial-ranging-lidar dataset, from an aerial vehicle viewpoint. Int. J. Robot. Res. 2022, 41, 270–280. [Google Scholar] [CrossRef]
  34. Wang, Y.; Ma, H. mVIL-Fusion: Monocular Visual-Inertial-LiDAR Simultaneous Localization and Mapping in Challenging Environments. IEEE Robot. Autom. Lett. 2023, 8, 504–511. [Google Scholar] [CrossRef]
Figure 1. The schematic diagram of coordinate transformation. T C B and T L B represent the external parameter from camera and LiDAR to IMU. T B W represents the transformation from the body frame to the world frame.
Drones 08 00487 g001
Figure 2. Pipeline of the proposed system. The proposed system is divided into the IMU module, the visual-inertial module, and the LiDAR-inertial module. Modules with red borders are highlighted in this paper. In detail, the LiDAR-inertial module provides depth measurements for visual features by aggregating recent multi-frame sweeps. Moreover, the motion estimation of the visual-inertial module is constrained by the back-propagated pose from the LiDAR-inertial module at the previous moment. The visual-inertial module provides the initial guess for the LiDAR-inertial module’s point cloud matching. The camera pose and LiDAR pose are fed into the IMU module and form the measurement residuals with IMU preintegration, followed by minimizing the measurement residuals in the factor graph optimization to estimate the final state.
Drones 08 00487 g002
Figure 3. Factor graph of the system. The IMU module is constrained by LiDAR and visual modules, and ultimately outputs a refined system state.
Drones 08 00487 g003
Figure 4. The illustration of edge points aggregation. Different colored edge dots indicate different ranges. Vertical observations are projected onto the segmented horizontal plane for clustering.
Drones 08 00487 g004
Figure 5. The model of the aligned point. (a) is the point-to-plane model that is employed in structured scenes. (b) is the point-to-surface model with uncertainty for aligning irregular ground points.
Drones 08 00487 g005
Figure 6. The platform is used for research and collection of the private dataset. The UAV in (a) is equipped with a GPS mobile station, LIDAR, on-board computer and pinhole camera. The world frame is defined as the first IMU frame. Satellite photographs (be) show four scenes. The orange curves represent the ground truth of these sequences as determined by the GNSS/IMU positioning system.
Drones 08 00487 g006
Figure 7. The qualitative structures of the private dataset are shown. (ac) are grove sequence, beach sequence, and desert sequence, respectively. Cubes are salient edge points. The QS stands for quantitative structure.
Drones 08 00487 g007
Figure 8. Point cloud maps of NTU dataset are shown. (ac) are rtp sequences, sbs sequences, and tnp sequences, respectively.
Drones 08 00487 g008
Figure 9. 3D bird’s-eye view map of the campus sequence. The quantitative structure of the three locations is emphasized as (ac). Figure (d,e) show point cloud maps from a bird’s-eye perspective, presenting the consistent map without point cloud divergence.
Drones 08 00487 g009
Figure 10. Localization accuracy experiments are performed on the NTU-VIRAL dataset. The trajectories’ errors are compared with the ground truths, which are provided by the public dataset. Subfigures (ai) represent the trajectory results for the rtp sequence, the sbs sequence, and the tnp sequence, respectively. The “reference” in the subfigure is the ground truth of the UAV trajectory. The heat map color of the estimated trajectories indicate the error level.
Drones 08 00487 g010
Figure 11. Trajectory comparisons on the private dataset. Subfigures (ac) are indicate the comparisons on the grove, beach, and desert sequences. As the degree of non-structuring increases, the robustness of LVI-SAM and FAST-LIVO decreases. The proposed system can still maintain high localization accuracy.
Drones 08 00487 g011
Table 1. List of used notations with their descriptions.
NotationsDescriptions
t i , t j Input time of camera image and LiDAR sweep
X Set of all states up to moment t n T n
x i State at time t i
R i , p i and v i Rotation matrix, position vector, and linear velocity at time t i
C i , L i Observations of camera and LiDAR at time t i
I i j Set of IMU measurements between moments t i and t j
r 0 , r I i j , r z i c , r z i l Residuals of prior, IMU preintegration, and visual and LiDAR feature
a ^ k B , w ^ k B Measurements value of accelerometer and gyroscope at time t k
a k B , w k B Acceleration and angular velocity of platform motion
g gravity
b a k , b w k , b a , b w Biases and noise of accelerometer and gyroscope
Δ R ¯ i j , Δ p ¯ i j , Δ v ¯ i j Preintegrated measurements for orientation, translation, and velocity
r Δ R i j , r Δ v i j , r Δ p i j Preintegration error
Δ R i j O , Δ p i j O , Δ v i j O Prediction states from IMU
E i j C , E i j L IMU measurement errors with VIO and LIO
Ω i j C , Ω i j L Uncertain matrix of LiDAR and camera poses
E m Error of marginalized prior
e i r p Reprojection residual error of the visual feature z i c
C p o Constraint from the back-propagated LiDAR pose
T C Set of camera poses
S ( p i ) Smoothness of the LiDAR point p i
r i The range of the point p i .
F n e , F n p Edge and plane points of n-th sweep
F n All feature points of n-th sweep
U n Clustering results of n-th sweep
V i The weighted distance vector of the i-th sector
C n Environmental structuring of n-th sweep
T ˇ k L Initial LiDAR pose from prediction state
S F k Weighted point-to-feature distance
r p f Feature registration error
r p g Point-to-Gaussian surface error
W , N , Λ Covariance matrix, eigenvector matrix, and diagonal matrix
T n L LiDAR pose at time t n
R ( γ n ) Rotation matrix on y a w angle
J ˜ , H ˜ Jacobian matrix and Hessian matrix by differentiating the projected point f ˜ j to the pose T ^ n L
Table 2. Quantitative structuring on public and private datasets.
Datartp1rtp2rtp3sbs1sbs2sbs3tnp1tnp2tnp3CampGroveBeachDesert
Result5.215.535.396.035.865.156.846.675.516.304.132.260.04
Table 3. Localization error on public and private datasets (UNIT: Meter).
DataLIO-SAMLVI-SAMFAST-LIO2FAST-LIVOmVIL-FusionOurs
rtp1 0.242 ̲ 1 X 2 0 . 148 3 0.6740.9540.265
rtp20.177X0.1950.8610.6730.201
rtp30.3850.2040.1950.2830.4260.141
sbs10.2140.2150.2230.3510.2130.114
sbs20.2080.2080.2130.2320.2250.200
sbs30.179X0.2100.2100.1930.175
tnp10.1930.1340.1460.2020.2690.214
tnp20.1920.1800.1690.1240.2290.168
tnp30.1760.4790.1810.1650.2230.109
campus0.4661.6410.4570.395 - 4 0.312
grove5.2376.3185.0475.215-4.880
beach0.4536.4491.1712.159-0.241
desertXXXX-10.87
1 underlined numbers are the sub-optimal results. 2 X means that the system failed to complete the full localization. 3 Bolded numbers are the best ones. 4 - means that the system is not applicable.
Table 4. Time consumption on each component (UNIT: MILLISECOND).
ComponentMedianMeanStd
Visual module Feature tracking 17.1117.265.16
Feature management17.2218.314.39
Pose estimation13.1912.535.33
LiDAR modulePreprocessing9.4911.613.92
Feature extraction1.151.291.72
Structure monitor0.151.563.67
Hybrid point registration22.5524.7117.43
IMU modulePreintegration0.1430.1510.360
Factor graph optimization0.2800.2740.311
Disclaimer/Publisher’s Note: The statements, opinions and data contained in all publications are solely those of the individual author(s) and contributor(s) and not of MDPI and/or the editor(s). MDPI and/or the editor(s) disclaim responsibility for any injury to people or property resulting from any ideas, methods, instructions or products referred to in the content.

