Article

Single Tree Semantic Segmentation from UAV Images Based on Improved U-Net Network

1
College of Forestry, Beijing Forestry University, Beijing 100083, China
2
Beijing Key Laboratory of Precision Forestry, Beijing Forestry University, Beijing 100083, China
3
National Engineering Research, Center for Geoinformatics, Aerospace Information Research Institute, Chinese Academy of Sciences, Beijing 100101, China
4
Beijing Yupont Electric Power Technology Co., Ltd.; Beijing 100011, China
*
Authors to whom correspondence should be addressed.
Drones 2025, 9(4), 237; https://doi.org/10.3390/drones9040237
Submission received: 7 February 2025 / Revised: 21 March 2025 / Accepted: 21 March 2025 / Published: 24 March 2025

Abstract

:
Single tree detection is essential in forest resource surveys. Efficient, accurate, and rapid extraction of individual trees facilitates the timely acquisition of forest resource information. Traditional tree surveys rely on manual field measurements, which are limited in coverage, costly, and time-consuming. To address these issues, this study utilizes multispectral imagery captured by unmanned aerial vehicles (UAVs) as the data foundation and applies deep learning methods for tree species segmentation in the study area. An enhanced ECA-Unet model, derived from the U-net architecture, integrates a channel attention mechanism in the Decoder to augment the model’s accuracy and precision in small-scale UAV-based tree segmentation, attaining an overall accuracy of 85.87%. The performance of the suggested model was compared with that of conventional semantic segmentation models within the same study region. Compared with the original U-net model, the model in this study improved the mAP and Accuracy by 2.1% and 1.23%, respectively, in terms of tree species segmentation accuracy. Compared with the traditional semi-automatic forest crown segmentation method, the model in this paper can output forest single tree segmentation results more quickly and effectively. The findings indicate that the proposed technique yields optimal segmentation accuracy and performance for individual trees within the dataset, facilitating the rapid and exact differentiation of trees in wooded settings utilizing limited sample data.

1. Introduction

Single tree, as a fundamental unit constituting a forest, is an indispensable key factor in forest resource surveys [1]. Traditional tree surveys primarily rely on field measurements conducted by forest resource monitoring technicians to gather relevant information. However, field surveys can only be conducted in areas accessible to the surveyors, resulting in insufficient data collection in inaccessible regions. Furthermore, manual techniques frequently exhibit low efficiency, elevated costs, and challenges in large-scale measurements. In recent years, remote sensing technologies (e.g., UAV and digital aerial photography), characterized by extensive coverage and high temporal resolution, have become an effective tool for forest inventory. They enable large-scale forest resource assessments and detailed structural/morphological data collection on individual trees [2]. Depending on the data source, the main methods for calculating the number of trees in a large area based on remotely sensed data are methods based on high-resolution optical images [3] and methods based on LiDAR data [4] and their generated Canopy Height Model (CHM) [5]. Contemporary techniques for individual tree detection encompass local maximum filtering algorithms [6], picture binarization, template matching, and multi-scale analysis [7].
Investigations into conventional individual tree detection originated in the 1980s. Over time, techniques for identifying individual trees have advanced, including remote sensing data, including aerial imagery, elevation models, and LiDAR normalized point clouds, alongside algorithms such as image analysis and point cloud clustering to tackle tree detection and crown segmentation challenges. Point cloud classification is also developing towards machine learning and deep learning [8]. Previous research utilized LiDAR data to assess forest resources, contrasting three methodologies: individual tree segmentation and conventional forest inventory for plots within the study area [9]. Yan et al. [10] introduced an adaptive mean-shift segmentation technique utilizing UAV LiDAR data to delineate the crowns of water pine and poplar trees, attaining detection accuracies of 95% and 80% in two distinct study plots, respectively. Koch et al. [11] employed a local maximum filter to detect tree canopies, followed by edge detection using a pouring algorithm and search vectors originating from treetops. Weinmann et al. [12] extracted geometric features from street tree point clouds, defined distinct feature sets, optimized feature selection through correlation-based methods and fast correlation filtering algorithms, and ultimately classified 3D point cloud data into “tree points” and “other points” using a Random Forest classifier. Their semantic segmentation approach achieved 90.77% accuracy in individual tree separation.
Deep learning has become an important branch of machine learning, with image classification tasks emerging as a major research and application direction in the field of deep learning [13]. In the field of remote sensing, deep learning is widely applied for object recognition and detection in imagery. Deep learning outperforms traditional machine learning methods, such as random forests and support vector machines, in identifying the fundamental structural characteristics of objects [14]. By constructing multi-layer networks, deep learning enables computers to automatically learn and uncover complex relationships hidden within data, extracting higher-dimensional and more abstract information, thus enhancing the representation capability of features [15]. Ferreira [16] introduced a novel model that executes morphological operations on score maps of palm species derived from fully convolutional neural network models. This method mitigates the prevalent boundary blurring effect associated with semantic segmentation networks, enhancing accuracy relative to conventional tile-based semantic segmentation, and effectively captures the spatial distribution of palm trees in tropical forests. Furthermore, the integration of deep learning with high-resolution UAV imagery facilitates image processing. Semantic segmentation models based on deep learning can accurately and efficiently identify target tree species, eliminate background noise, and exhibit strong adaptability to variations in brightness and noise [17]. Nazemi et al. [18] employed a 3D-CNN methodology to categorize pine, spruce, and birch trees in forests, integrating RGB and hyperspectral data while contrasting the outcomes with those of an MLP classifier. The utilization of UAV visible light imagery for forest resource evaluations has increased in prevalence with the incorporation of machine learning methods. Weinstein [19] et al. introduced a semi-supervised deep learning network approach for the detection and identification of tree canopies in RGB images. The research demonstrated that the deep learning model effectively utilized unsupervised boundaries derived from LiDAR to create an initial RGB image detection model, attaining recall and precision rates of 69% and 60% in the test area. Li [20] et al. employed U-Net to segment the crown of Populus euphratica using UAV imagery and subsequently utilized a labeled watershed method for secondary segmentation of the crown coverage area, thereby accomplishing individual tree crown recognition and enumeration. All of the above studies have demonstrated that convolutional neural network (CNN) models are proficient in identifying trees.
The utilization of multispectral UAV data has further enhanced data support for forest tree segmentation. To improve zonal delineation rationality in vineyards, Ferro et al. [21] analyzed multispectral imagery by comparing Mask R-CNN, U-Net, OBIA, and unsupervised classification methods for canopy pixel identification. Their study demonstrated the superior performance of deep learning models like Mask R-CNN and U-Net in terms of Overall Accuracy (OA), F1-score, and Intersection over Union (IoU). Osco et al. [22] conducted semantic segmentation of citrus trees using multispectral imagery, evaluating five networks: FCN, U-Net, SegNet, Dynamic Dilated Convolutional Network (DDCN), and DeepLabV3+. Results showed comparable segmentation accuracy across models, with FCN and U-Net achieving the highest F1-scores (94.00%). This confirms that multispectral UAV imagery combined with deep neural networks enables precise vegetation mapping.
Current research on tree species classification predominantly focuses on identifying single-species stands or individual tree types, such as apple trees, Populus euphratica, or grapevine canopies, while studies on complex mixed-species forests remain limited. Spectral reflectance varies from tree to tree, and data from multiple spectra can provide more features than a single spectrum [23]. This study, therefore, employs multispectral UAV remote sensing imagery to achieve semantic segmentation of multiple tree species within an integrated region. In our experiments, we first extracted individual tree crowns, then labeled tree species categories and their canopies to create a dataset. Through parameter learning in an enhanced ECA-Unet network model, we trained optimal feature sets for individual trees in the study area, ultimately outputting semantic segmentation information. Comparative evaluations with other models confirmed the superior accuracy of our proposed methodology.

2. Materials and Methods

2.1. Materials

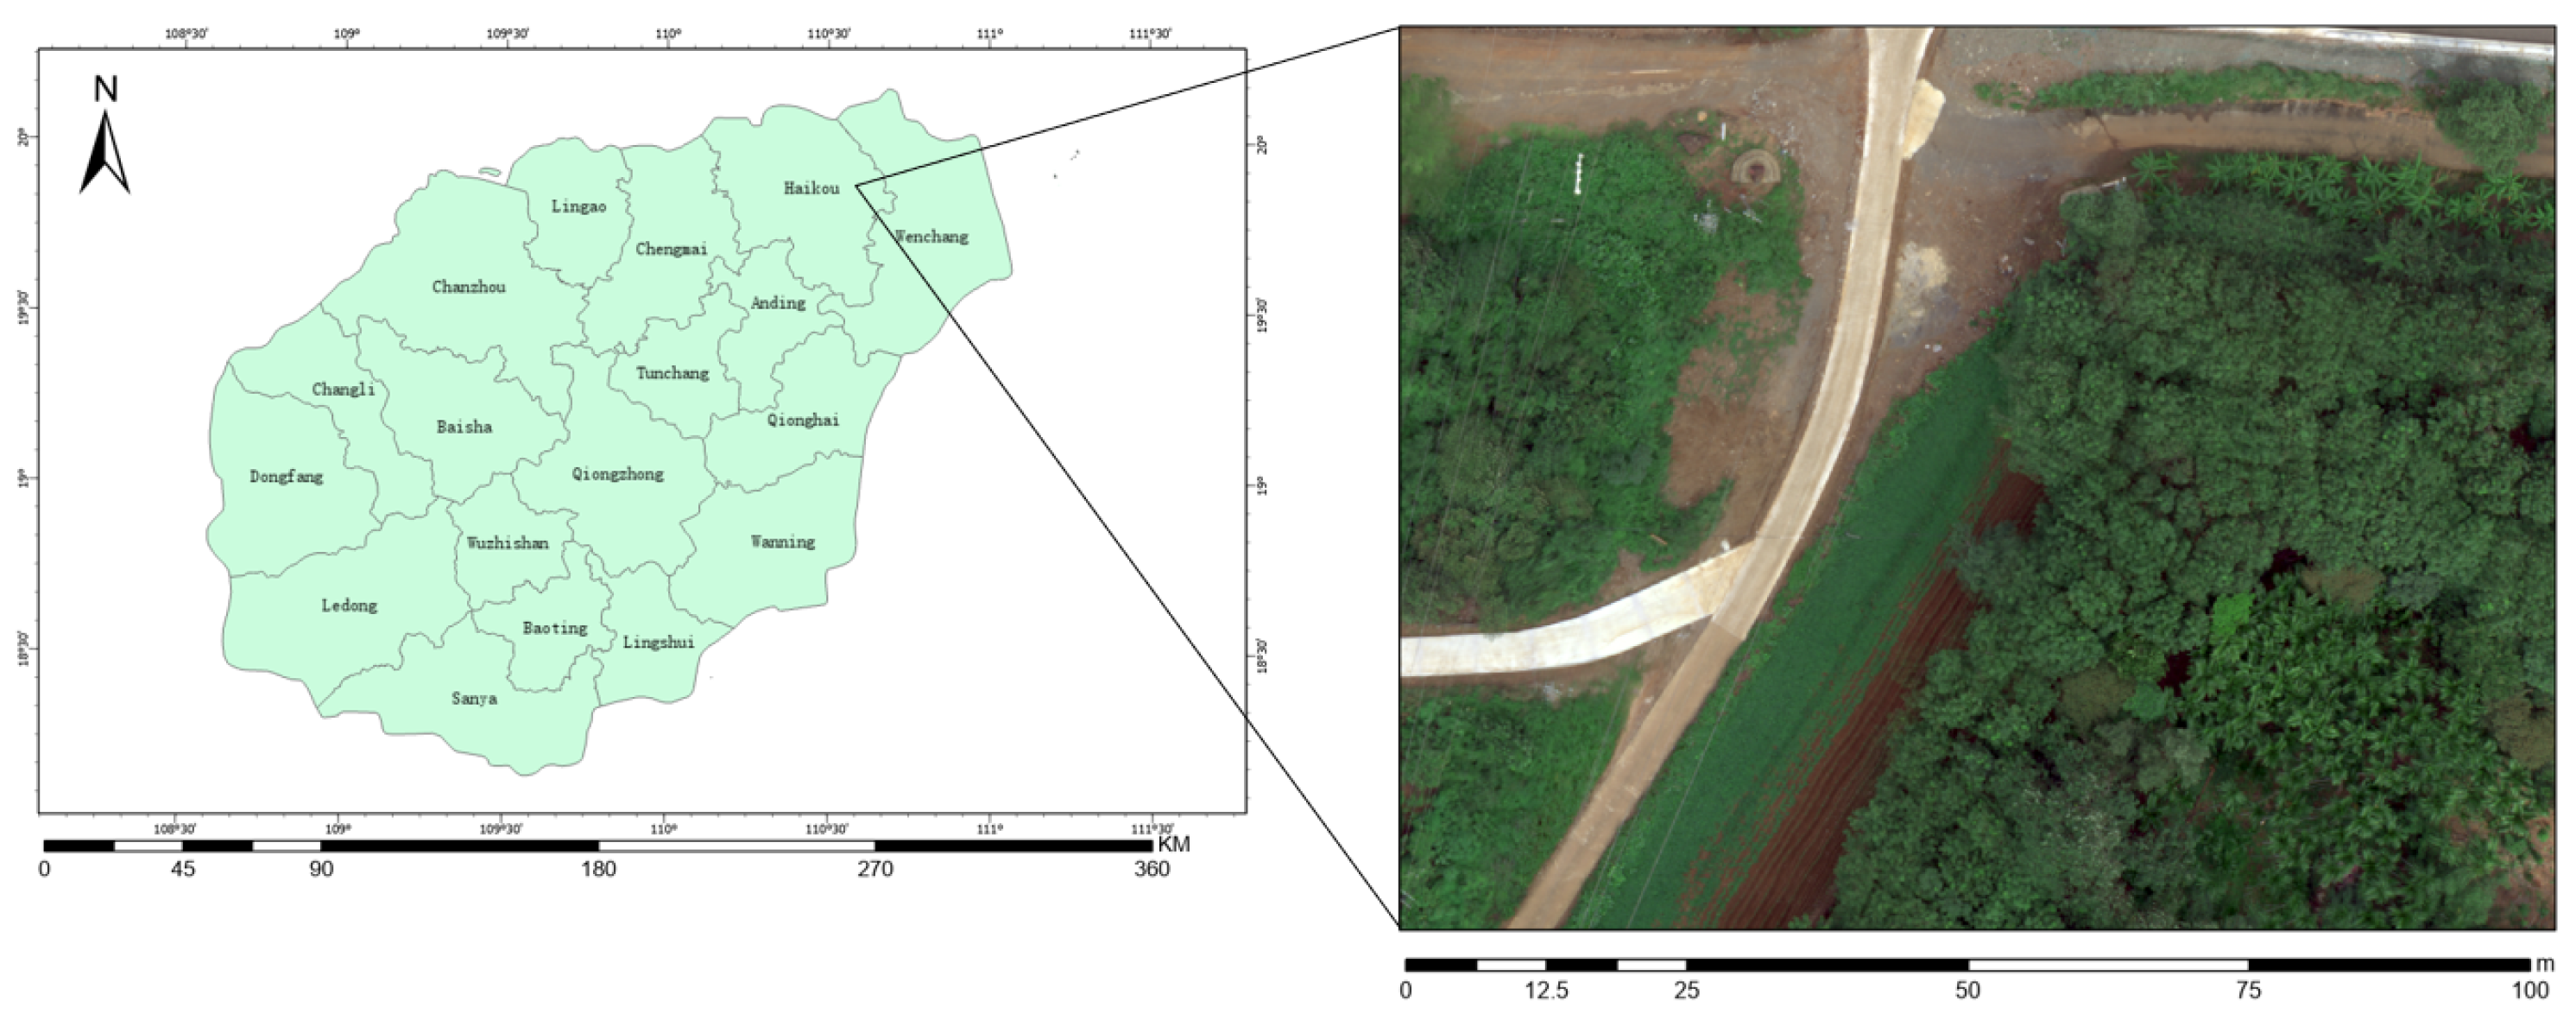
2.1.1. Research Area

The research site is positioned in Haikou City, Hainan Province, along the power transmission corridor from Haikou to Longjiang, with elevations varying from 0 to 60 m, and is located in the tropical monsoon zone. The primary plant species consist of coconut trees (Cocos nucifera L.), areca trees (Areca catechu L.), rubber trees (Hevea brasiliensis), jackfruit trees (Artocarpus heterophyllus Lam.), banyan trees (Ficus microcarpa L. f.), eucalyptus trees (Eucalyptus spp.), bamboo forests (Bambusoideae), and pine trees (Pinaceae), among others. Figure 1 shows the study area’s geographical location and true-color imagery. The study area chosen for this research, as indicated below, includes nine tree species: eucalyptus, areca trees, jackfruit, neem, banyan, rubber, coconut, bamboo, and mixed wood. The region measures around 5.73 hectares. The region is distinguished by a diverse range of tree species, including evergreen broadleaf trees, shrubs, and towering trees, with some overlap. The diversity of tree species in the study area and the high degree of forest depression are suitable as experimental samples for this study, so these data were used for feature extraction for deep learning.

2.1.2. Data Source

The data of this study were collected in June 2022, and were obtained from the aerial scanning of an M300 UAV equipped with a Changguang Yuchen MS600 Pro UAV-mounted multispectral camera, which contains six 1.2 M pixel multispectral channels, and the sensor band parameters are shown in Table 1 below. On the day of data collection, the weather conditions were good and suitable for the UAV to carry out aerial photography operations. The UAV flew at an altitude of 120 m, with a flight speed of about 11 m/s, and with an overlap degree of about 45% in the side direction and 65% in the heading direction. The resulting aerial remote sensing image contains six bands, and the resulting image pixel size is 0.02 m.

2.2. Methods

This research utilized multispectral remote sensing imagery captured using UAV-mounted low-altitude aerial photography. The study area features dense broadleaf woods with substantial crown diameters and a significant degree of canopy closure. This research examines the distribution and composition of tree species in the studied area. To address the time-consuming and labor-intensive challenges of conventional individual tree species segmentation approaches, UAV visible light imagery was cropped and annotated using LabelMe software. An enhanced ECA-Unet semantic segmentation model was utilized to delineate the crown areas following data augmentation. The segmentation outcomes were juxtaposed with those derived from the U-net, PSPNet, and DeepLabV3+ models under identical conditions to assess the precision of crown area extraction.
The following steps were taken in this study to perform single tree segmentation:
  • Step 1: A dataset was constructed using original tagged UAV images.
  • Step 2: The LabelMe software was utilized to segment and annotate the crowns of various tree species within the study area.
  • Step 3: The ECA-Unet model was employed to extract features and train the data in order to achieve the optimal parameter set.
  • Step 4: After comparing the accuracy evaluation indexes obtained according to the training results, the best parameter set was selected and input to recognize and obtain the monoki segmentation results.
  • Step 5: Accuracy was verified, and comparison with alternative deep learning models was performed.

2.2.1. Construction of Original Data Set
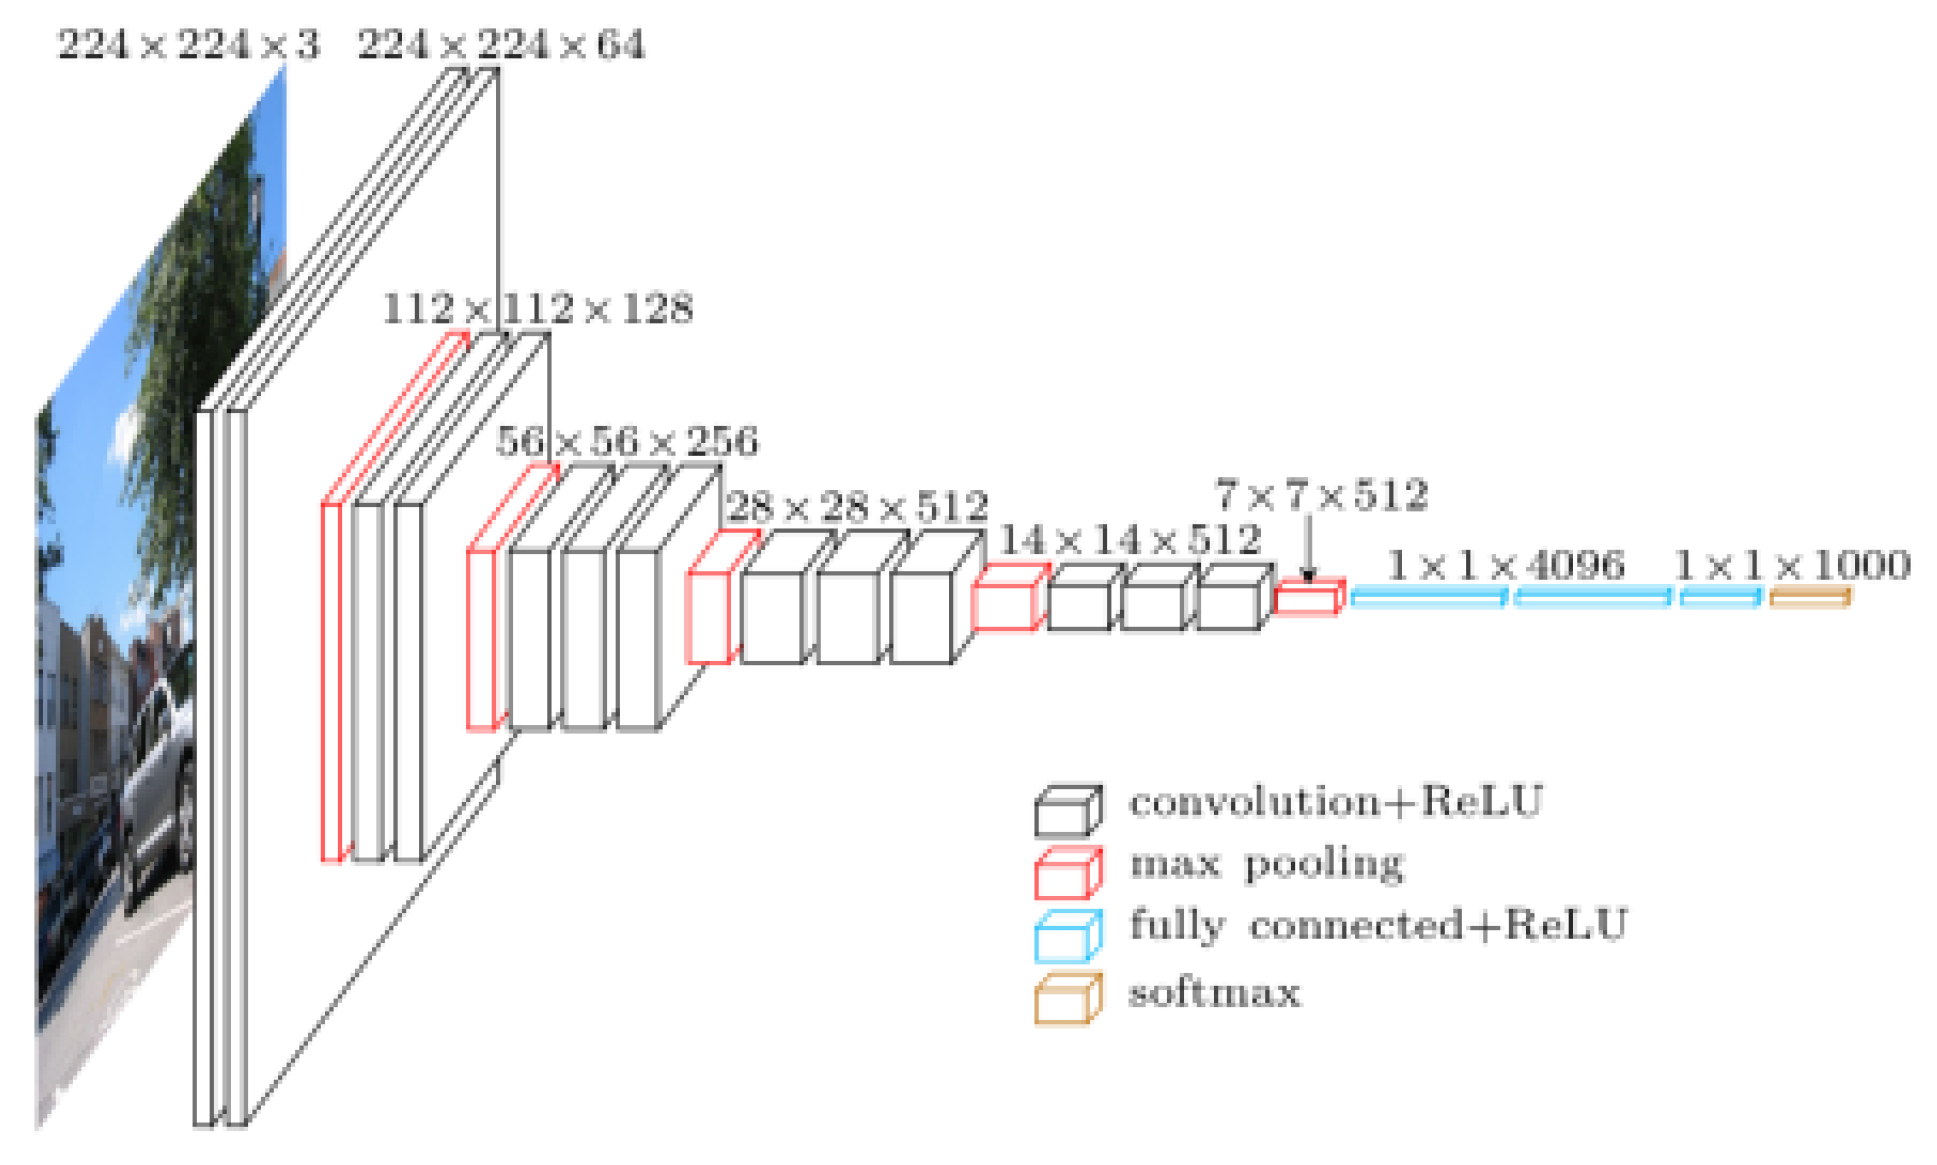
A significant amount of labeled sample data may occasionally be required for deep learning models to train in feature extraction [24]. The three fundamental phases for dataset development are visual interpretation, data annotation, and data segmentation. The research region is densely covered and features a diverse range of vegetation species. First, the remote sensing images collected by the UAV are segmented, and the dataset is created using the LabelMe annotation tool. Manual labeling is performed by connecting the outer contour of the tree crowns point by point until a closed region is formed. The final result is saved as a JSON format file.
Vector labels are drawn along the contours of each individual tree crown, with attributes assigned to represent different tree species. For ease of record-keeping and subsequent dataset creation, tree species are labeled numerically from 1 to 6, as shown in Table 2.
To speed up the processing of remote sensing photos during model training and to allow the network model to extract different tree features more effectively, this study divided two UAV-captured remote sensing images into five hundred and eighty-nine 512 × 512 pixel images, meticulously labeling each according to their respective locations. Figure 2 illustrates the samples labeled using the LabelMe tool. Table 3 presents a detailed description of the data samples.

2.2.2. U-Net

In deep learning models, the pooling layers of convolutional neural networks (CNNs) progressively reduce image resolution through multiple convolutions, resulting in the loss of feature space information, which makes it difficult to precisely delineate the boundaries of objects in remote sensing images. In view of this, Long et al. [25] from Berkeley improved the classical CNN model using the fully convolutional network (FCN) model by deconvolutionally processing the feature maps of the last convolutional layer of the CNN, which mainly uses the number of channels of the feature maps to be adjusted to the number of categories using a 1 × 1 convolution to restore the size of their feature maps to an output layer with the same resolution as the original image [26]. This approach preserves the spatial location information and achieves pixel-level classification of the image by applying softmax function to each pixel to calculate the category probability before output. Before obtaining the final feature map, FCN undergoes multiple pooling operations, which result in the loss of many image details. The segmentation results are often overly smooth, failing to restore the original image details, and thus are unable to accurately extract the object boundaries [27]. To address the limitations of FCN, the U-Net model (Figure 3 below) extends and expands upon the FCN end-to-end approach. It uses the same Encoder–Decoder structure with shortcut connections. The left side employs convolution to extract contextual information, while the right side uses upsampling to locate semantic information and restore it to the original image resolution. This helps the Decoder better recover object details and preserves as much of the original spatial information as possible, maximizing the retention of original features in the training set, such as object boundary features, texture features, and shape features. In deep learning, upsampling does have some limitations. Deep features after many pooling, essentially based on the “speculation” of low-resolution features, cannot recover the details of the original image that are not encoded in the feature map; the resolution is greatly reduced to lose a large number of high-frequency details [28]. In order to solve the loss of details in the upsampling process, compared with FCN, U-Net adopts the superposition of jump connections to alleviate this problem, and splices the low-level semantic information with the deep-level semantic information to improve the segmentation accuracy.

2.2.3. Efficient Channel Attention Mechanism

Attention mechanisms have been extensively employed across several domains of deep learning in recent years [29]. In image processing, speech recognition, or natural language processing, it aids in filtering extraneous or superfluous information, allowing us to concentrate on pertinent stimuli, activities, or objectives. This mechanism can be changed by autoregulation or by the influence of the external environment.
The channel attention mechanism has significant promise in enhancing the performance of deep convolutional neural networks (CNNs). It primarily identifies the correlation among characteristics. Each channel of the feature map is considered a feature detector; hence, the channel feature emphasizes the “what” of the pertinent information in the picture. Contemporary research primarily focuses on creating more intricate attention modules to enhance performance, which therefore escalates the model’s complexity. To resolve the conflict between performance and complexity, Wang et al. [30] introduced an efficient channel attention (ECA) module (shown in Figure 4 below). This module introduces a limited number of options yet can yield considerable speed improvements.

2.2.4. Operation of the ECA Network

The core idea of ECA-Net is to introduce channel attention after the convolutional layer to dynamically tune the response of different channels.The first step is to convolve the input features and after the output of the convolutional layer, the global average pooling is used to downscale the feature map. After global average pooling (GAP), ECA replaces the fully connected layer with a 1 × 1 convolution. ECA utilizes a 1D convolution to facilitate the interaction of information across channels following channel-wise global average pooling, all while maintaining dimensionality integrity. The convolution kernel size is determined adaptively by a function, with the kernel size k indicating the extent of local cross-channel interactions, specifically the number of neighboring units participating in the attention prediction of a channel. Considering the channel dimension c, the convolution kernel size k can be determined adaptively as follows:
k = φ ( C ) = l o g 2 ( C ) γ + b γ o d d
Here, | t | o d d represents the odd number closest to t. In this paper, we set γ and b to 1 in all experiments.

2.2.5. ECA-Unet

The ECA-Unet model proposed in this study is primarily divided into three main components., as indicated in Figure 5 below:
The first component, the Encoder, is mostly utilized to construct a deep network architecture and extract profound semantic information. Utilizing the backbone component, we can extract the feature layers from each level. The backbone feature extraction component of ECA-Unet resembles VGG (refer to Figure 6), comprising a series of convolutions and max pooling layers. Upon traversing each block, the dimensions of the feature maps progressively diminish. With the Encoder section, we can obtain five initial valid feature layers, which will then be used for feature fusion in the second part.
The subsequent phase involves improving the feature extraction segment, namely, the Decoder component. This component is referred to as the expansion path or upsampling path, which is symmetrical to the Encoder segment. We upsample the first five effective feature layers derived from the backbone and subsequently concatenate them with the appropriate feature maps from the Encoder. Prior to concatenation, we incorporate the ECA module into the effective feature layers derived in the initial phase to produce a final effective feature layer that amalgamates all features.The proposed framework introduces an ECA-based attention module to perform channel-wise recalibration on Encoder-generated feature maps. By prioritizing tree species-related semantic cues and suppressing spatially redundant background activations, this mechanism enables the Decoder to establish more effective cross-scale connections between hierarchical features, thereby optimizing the multi-level feature fusion efficiency.
The third component is the prediction segment. The last valid feature layer is employed to classify each feature point, analogous to classifying each pixel point. Convolution techniques are employed to transform the feature map into a quantity of channels according to the number of categories. Each channel signifies the probability distribution of a category within the image. The softmax function or other classifiers are utilized to categorize each pixel, producing a segmentation result map that matches the dimensions of the input image.

2.2.6. Experimental Environment and Parameter Settings

This experiment trains using an AMD Ryzen 7 5800H CPU, a 6 GB NVIDIA GeForce RTX 3060 laptop GPU, a Lenovo motherboard, and 16 GB of memory. The appropriate hyperparameter mix depends on the model, data, and hardware environments; therefore, picking the right ones affects model training and deep learning performance. This study used numerous experiments to find the best model hyperparameters. Object detection model training uses a cosine decay-based variable learning rate technique. The starting learning rate is 0.001, and the minimum is 0.00001. Learning rate degradation is cosine. Optimization uses stochastic gradient descent (SGD) with momentum and a weight degradation of 0.00005. The training is divided into a freezing phase and a thawing phase, the network backbone training feature extraction network does not change when freezing the training, the thawing phase training parameters’ backbone network is not frozen, and the feature extraction network will change. The advantage of this is that it can reduce the amount of computation and accelerate the training speed so that the model converges faster, and for small datasets after freezing the backbone network, only a small number of parameters are adjusted, which can improve the model’s generalization ability. Based on past training experience, and the reason for the smaller data samples in this experiment, the freeze training is generally in the 50–1000 epoch under the model loss value, which will tend to stabilize, and at this time, all the backbone network is unfrozen for enhancement. In this experiment, we set the first 50 epochs for freezing training and 200 epochs for the unfreezing phase because the two phases occupy different memory batch sizes of 8 and 4, respectively.

2.2.7. Accuracy Evaluation Index

Evaluation metrics for semantic segmentation typically utilize the confusion matrix to summarize a model’s classification outcomes. In binary classification problems, the class of interest is usually designated as the positive class, whereas other categories are classified as negative [31]. This study employs mean Intersection over Union (mIoU), pixel accuracy (PA), mean pixel accuracy (mPA), and overall accuracy (Accuracy) as metrics to evaluate the semantic segmentation performance of the model. The equations for these metrics are outlined below:
M I o U = 1 k + 1 i = 0 k p i i j = 0 k p i j + j = 0 c p j i p i i
m P A = 1 k + 1 i = 0 k p i i j = 0 c p i j
P A = i = 0 K p i i i = 0 K j = 0 K p i j
A c c u r a c y = 1 k + 1 i = 0 k p i i + p j j j = 0 c p i j
In the above formula, k represents the number of target classes, p i j denotes the number of pixels where class i is predicted as class j, p i i denotes the number of pixels where class i is predicted as class i, and p j j denotes the number of pixels where class j is predicted as class j.

3. Results

3.1. Experimental Results

In this study, under the established experimental environment, the ECA-Unet semantic segmentation model designed in the paper was trained using a single-tree species training set labeled with LabelMe software. Individual tree species segmentation was subsequently accomplished by integrating the training parameters into the model. The trained model was used to calculate the result’s IoU and PA, as shown in Table 4. Overall, the recognition accuracy was around 67% for all trees except rubber trees. While the Precision of rubber tree is only 45.72%, the occurrence of lower accuracy is still mainly due to the fact that one of them is the high canopy depression within the growing area of rubber tree. This can also be seen through its IoU value, which is only 34.37%; the prediction result has a lower degree of overlap with the real label, reflecting the inaccuracy of its identification in some areas. Its second rubber tree feature is not easily recognized on UAV images, and it is morphologically more similar to other broadleaf trees. Trees with larger canopies perform better on the pixel accuracy metric. However, trees like areca and coconut, while having certain detection accuracy, struggle to achieve precise segmentation at the edges of their branches.
The results of semantic segmentation using ECA-Unet model are shown in the Figure 7 below, which includes the original UAV image, the segmented pixel map obtained after model training, and the image created by blending the two images with adjusted transparency. In this figure, the blue patches represent detected areca trees, the purple-red patches represent coconut trees, and the green patches represent jackfruit trees. It can be seen that, for areas with significant leaf overlap in the areca tree regions, the model is able to detect individual trees. However, the boundary delineation for areca trees is not clear enough, leading to potential pixel segmentation errors. For coconut and jackfruit trees, whose features are more distinct and have lower canopy density, the model can accurately segment individual trees. In Figure 7, trees closer to the center of the image are segmented better, while trees at the edges or those with overlapping canopies tend not to be detected. It is proved that the model is still deficient in classifying the pixel points at the edges, and there is still room for improvement in the model’s handling of image edges.
The loss function in deep learning object detection represents the discrepancy between the final anticipated outcomes of the model and the actual values. It is the most straightforward metric for assessing the model’s convergence, overfitting, and the caliber of the training process [32]. In this study, the loss value of the model changes, as shown in Figure 8, and after 150 epochs of training, the loss function of the model gradually closes to about 0.22. During the whole training process, the loss value gradually decreases and tends to be stable, and the performance of the model on both the training set and the validation set reaches a good level, indicating that the model has converged normally.

3.2. Model Accuracy Comparison

In order to validate the accuracy of the proposed ECA-Unet semantic segmentation model in this paper, comparison experiments with mainstream U-net, PSPNet [33], and DeepLabV3+ [34] networks were conducted to analyze the validation accuracies of each model in the test set after training on the same dataset. The validation accuracy of each model was analyzed after training on the same dataset and testing on the test set. The results of the model accuracy comparison in Table 5 indicate that the ECA-Unet model suggested in this paper excels in single tree semantic segmentation. In the studies involving four distinct models, all three accuracy measures are at their peak. This model achieved an Intersection over Union (IoU) of 49.19%, an overall accuracy of 85.4%, and a mean pixel accuracy of 63.33%, thereby showcasing its strengths in the segmentation of individual tree species.
The validation results for every model in the experiment established are presented in Figure 9. The blue patches denote segmented areca trees, the purple-red patches indicate coconut trees, and the green patches represent jackfruit trees. The improved ECA-Unet model demonstrates superior edge segmentation for individual trees and enhanced detection accuracy when compared with conventional semantic segmentation models like U-net, PSPNet, and DeepLabV3+. The model demonstrates improved capability in delineating boundaries between various tree species, resulting in less fragmentation along with jagged edges of individual trees.

4. Conclusions and Discussion

There are currently few studies on individual tree segmentation in mixed forests, and most research on the application of deep learning techniques for tree species identification and segmentation concentrates on a single or dominant species. In this study, we trained the ECA-Unet model, which is based on an improved U-net design, using a dataset labeled manually with the LabelMe tool on UAV remote sensing images. We suggested a quick and effective strategy for classifying each tree species semantic segmentation after comparing the training results with those of conventional deep learning semantic segmentation models. This approach performs better in individual tree edge segmentation and segmentation accuracy when compared with conventional techniques. The main conclusions we draw are as follows:
  • A method for semantic segmentation of individual tree species utilizing an enhanced ECA-Unet model, which is based on the U-net architecture, has been developed. This model attained an overall accuracy of 85.87% for the semantic segmentation of individual tree species in the tropical tree species research area of Hainan Province, representing an increase of 1.3 percentage points relative to the original U-net model. This illustrates that the model can effectively and intelligently segment individual tree species in confined areas, markedly diminishing the burden of manual segmentation.
  • The ECA-Unet model proposed in this paper improves the average intersection ratio, average pixel accuracy, and overall accuracy compared with the traditional Unet, PSPNet, and DeepLabV3+ models by 0.28%, 8.64%, and 1.74% on mIou and 2.1%, 9.7%, and 2.34% on mPA, respectively, and shows the superiority for mono-wood species segmentation.
The research procedure still has certain limits. The UAV imagery used has a rather low spatial resolution, and the identification accuracy is impacted by jagged edges in the photos. The majority of the tree species in the research area used in this paper are shrubs and broadleaf trees. To apply this technique to the identification of tree species in large-scale regions, more study is required. In individual tree segmentation, there are still issues with unclear boundary delineation for overlapping trees, and the size of individual tree crowns does not always match perfectly. Further improvements to the model are needed to optimize its handling of detailed crown edge segmentation in UAV images. In future research, it is suggested to enhance the model’s learning of crown edge features and incorporate multi-source data to improve the segmentation and identification performance of the model.

Author Contributions

Conceptualization, S.X. and B.Y.; methodology, S.X. and R.W.; software, S.X. and D.Y.; validation, S.X. and B.Y.; writing—original draft preparation, S.X.; writing—review and editing, J.L. and J.W.; visualization, J.L. and J.W.; supervision, S.X. and R.W.; project administration, B.Y. and R.W.; funding acquisition, B.Y. and D.Y. All authors have read and agreed to the published version of the manuscript.

Funding

This study was supported by the National Natural Science Foundation of China (41971376) and the Beijing Natural Science Foundation (8212031): Study on the Red Line Division Mechanism of Water Conservation Ecological Protection in Beijing Based on the SWAT Model and Ecological Security Pattern.

Institutional Review Board Statement

Not applicable.

Informed Consent Statement

Not applicable.

Data Availability Statement

The original contributions presented in this study are included in the article. Further inquiries can be directed to the corresponding author.

Conflicts of Interest

Author Dabing Yang was employed by the company Beijing Yupont Electric Power Technology Co., Ltd. The remaining authors declare that the research was conducted in the absence of any commercial or financial relationships that could be construed as a potential conflict of interest.

References

  1. Pommerening, A. Evaluating structural indices by reversing forest structural analysis. For. Ecol. Manag. 2006, 224, 266–277. [Google Scholar] [CrossRef]
  2. Saarela, S.; Andersen, H.E.; Grafström, A.; Lappi, J.; Pippuri, I.; Rautiainen, M.; Hyyppä, J.; Rönkä, M.; Heikkinen, J.; Mäkinen, T. A new prediction-based variance estimator for two-stage model-assisted surveys of forest resources. Remote. Sens. Environ. 2017, 192, 1–11. [Google Scholar] [CrossRef]
  3. Mou, H. Monitoring of Forestland Dynamic Changes by Using Multi Source and High Resolution Satellite Remote Sensing Images. For. Resour. Manag. 2016, 4, 107. [Google Scholar]
  4. Wang, X. Study on Forest Individual-Tree Segmentation Method Based on Airborn LiDAR Data; Northeast Forestry University: Harbin, China, 2020. [Google Scholar]
  5. Hu, Z.; Shan, L.; Chen, X.; Zhang, L.; Liu, Z.; Wang, M.; Wu, Z.; Yang, X.; Li, J.; Zhao, Z. Individual Tree Segmentation of UAV-LiDAR Based on the Combination of CHM and DSM. Sci. Silvae Sin. 2024, 60, 14–24. [Google Scholar]
  6. Chen, S.; Liang, D.; Ying, B.; Zhang, X.; Wang, J.; Liu, H.; Liu, X.; Li, S.; Zhao, H.; Zhang, Y. Assessment of an improved individual tree detection method based on local-maximum algorithm from unmanned aerial vehicle RGB imagery in overlapping canopy mountain forests. Int. J. Remote. Sens. 2021, 42, 106–125. [Google Scholar]
  7. Jing, L.; Hu, B.; Noland, T.; Zhang, Y.; Liu, W.; Wang, F.; Li, J.; Zhao, X.; Yang, L.; Sun, Y. An individual tree crown delineation method based on multi-scale segmentation of imagery. ISPRS Photogramm. Remote. Sens. 2012, 70, 88–98. [Google Scholar]
  8. Hua, Z. Research on Individual Tree Segmentation and Structural Parameter Extraction Based on Laser Point Cloud Data; Nanjing Forestry University: Nanjing, China, 2023. [Google Scholar]
  9. Latifi, H.; Fassnacht, F.E.; Müller, J.; Schneider, M.; Kienast, F.; Koenig, H.; Meyer, M.; Fischer, R.; Leuschner, C.; Nussbaum, S. Forest inventories by LiDAR data: A comparison of single tree segmentation and metric-based methods for inventories of a heterogeneous temperate forest. Int. J. Appl. Earth Obs. Geoinf. 2015, 42, 162–174. [Google Scholar]
  10. Yan, W.; Guan, H.; Cao, L.; Zhang, Y.; Li, J.; Wang, S.; Liu, M.; Zhao, X.; Chen, Z.; Li, Y. A self-adaptive mean shift tree-segmentation method using UAV LiDAR data. Remote. Sens. 2020, 12, 515. [Google Scholar]
  11. Koch, B.; Heyder, U.; Weinacker, H. Detection of individual tree crowns in airborne lidar. Photogramm. Eng. Remote. Sens. 2006, 72, 357–363. [Google Scholar]
  12. Weinmann, M.; Weinmann, M.; Mallet, C.; Rutzinger, M.; Lague, D.; Mandelbrot, A.; Morsdorf, F.; Soudani, K.; Tress, M.; Ziegler, T. A classification-seg-mentati on framework for the detection of individual trees in dense M-MS point cloud data acquired in urban areas. Remote. Sens. 2017, 9, 277. [Google Scholar]
  13. Yuan, Y.; Shi, X.; Gao, J. Building extraction from remote sensing images with deep learning: A survey on vision techniques. Comput. Vis. Image Underst. 2024, 251, 104253. [Google Scholar]
  14. Taye, M.M. Understanding of Machine Learning with Deep Learning: Architectures, Workflow, Applications and Future Directions. Computers 2023, 12, 91. [Google Scholar] [CrossRef]
  15. Osco, L.P.; Junior, J.M.; Ramos, A.P.M.; Silva, F.S.; Oliveira, R.S.; Costa, A.L.; Souza, G.T.; Rodrigues, T.A.; Alves, M.C.; Pereira, R.F. A review on deep learning in UAV remote sensing. Int. J. Appl. Earth Obs. Geoinf. 2021, 102, 102456. [Google Scholar]
  16. Ferreira, M.P.; De Almeida, D.R.A.; de Almeida Papa, D.; Silva, F.R.; Costa, L.M.; Santos, R.T.; Lima, E.M.; Souza, J.P.; Oliveira, J.A.; Almeida, C.S. Individual tree detection and species classification of Amazonian plams using UAV images and deep learning. For. Ecol. Manag. 2020, 457, 118397. [Google Scholar]
  17. Karantzalos, K.; Argialas, D. Improving edge detection and watershed segmentation with anisotropic. Int. J. Remote. Sens. 2006, 27, 5247–5434. [Google Scholar]
  18. Nezami, S.; Khoramshahi, E.; Nevalainen, O.; Lehtonen, A.; Mäki, M.; Palosuo, T.; Holopainen, M.; Mielikäinen, J.; Ruokolainen, L.; Männistö, M. Tree species classification of drone hyperspectral and RGB imagery with deep learning convolutional neural networks. Remote. Sens. 2020, 12, 1070. [Google Scholar]
  19. Weinstein, B.G.; Marconi, S.; Bohlman, S.; Zasada, M.; Williams, M.; Clark, J.; Knight, L.; Wadsworth, T.; Campbell, B.; Brown, R. Individual tree-crown detection in RGB imagery using semi-supervised deep learning neural networks. Remote. Sens. 2019, 11, 1309. [Google Scholar]
  20. Li, Y.; Zheng, H.; Luo, G.; Yang, L.; Wang, W.; Gui, D. Extraction and Counting of Populus Euphratica Crown Using UAV Images Integrated with U-Net Method. Remote. Sens. Technol. Appl. 2019, 34, 939–949. [Google Scholar]
  21. Ferro, M.V.; Sørensen, C.G.; Catania, P. Comparison of different computer vision methods for vineyard canopy detection using UAV multispectral images. Comput. Electron. Agric. 2024, 225, 109277. [Google Scholar]
  22. Osco, L.P.; Nogueira, K.; Marques Ramos, A.P.; Silva, F.S.; Costa, A.L.; Souza, G.T.; Rodrigues, T.A.; Alves, M.C.; Pereira, R.F.; Oliveira, R.S. Semantic segmentation of citrus-orchard using deep neural networks and multispectral UAV-based imagery. Precis. Agric. 2021, 22, 1171–1188. [Google Scholar]
  23. Cui, B.G.; Wu, Y.N.; Zhong, Y.; Zhong, L.W.; Lu, Y. Hyperspectral image rolling guidance recursive filtering and classification. J. Remote. Sens. 2019, 23, 431–442. [Google Scholar]
  24. Yu, K. Research on UAV Remote Sensing Vegetation Recognition Method Based on Deep Learning; Anhui University: Hefei, China, 2022. [Google Scholar]
  25. Long, J.; Shelhamer, E.; Darrell, T. Fully convolutional networks for semantic segmentation. In Proceedings of the IEEE Conference on Computer Vision and Pattern Recognition, Boston, MA, USA, 7–12 June 2015; pp. 3431–3440. [Google Scholar]
  26. Dong, Y.; Zhang, Q. A survey of depth semantic feature extraction of high-resolution remote sensing images based on CNN. Remote. Sens. Technol. Appl. 2019, 34, 1–11. [Google Scholar]
  27. Wu, G.; Chen, Q.; Shibasaki, R.; Guo, Z.; Shao, X.; Xu, Y. High Precision Building Detection from Aerial Imagery Using a U-Net Like Convolutional Architecture. Acta Geod. Cartogr. Sin. 2018, 27, 864. [Google Scholar]
  28. Agnihotri, S.; Grabinski, J.; Keuper, M. Improving feature stability during upsampling–spectral artifacts and the importance of spatial context. In Proceedings of the European Conference on Computer Vision, Munich, Germany, 24–30 August 2024; Springer Nature: Cham, Switzerland, 2024; pp. 357–376. [Google Scholar]
  29. Chen, C.; Peng, L.; Yang, J. UAV Small Object Detection Algorithm Based on Feature Enhancement and Context Fusion. Comput. Sci. 2024, 114. Available online: http://kns.cnki.net/kcms/detail/50.1075.TP.20241225.1945.022.html (accessed on 5 February 2025).
  30. Wang, Q.; Wu, B.; Zhu, P.; Zhang, X.; Li, J.; Liu, Y.; Li, Z.; Gao, L.; Yu, Z.; Yang, Q. ECA-Net: Efficient channel attention for deep convolutional neural networks. In Proceedings of the IEEE/CVF Conference on Computer Vision and Pattern Recognition, Seattle, WA, USA, 13–19 June 2020; pp. 11534–11542. [Google Scholar]
  31. Wang, Y. Research on Apple Tree Segmentation and Crown Extraction based on UAV Visible Light Images; Northwest A&F University: Yangling, China, 2024. [Google Scholar]
  32. Ma, Y.K.; Liu, H.; Ling, C.X.; Zhang, J.; Li, L.; Wang, S.; Zhou, X.; Liu, G.; Li, X.; Zhang, Y. Object Detection of Individual Mangrove Based on Improved YOLOv5. Laser Optoelectron. Prog. 2022, 59, 436–446. [Google Scholar]
  33. Zhao, H.; Shi, J.; Qi, X.; Wang, Z.; Li, Y.; Yu, L.; Liu, Y.; Song, Y.; Li, W.; Xu, L. Pyramid scene parsing network. In Proceedings of the IEEE Conference on Computer Vision and Pattern Recognition, Honolulu, HI, USA, 21–26 July 2017; pp. 2881–2890. [Google Scholar]
  34. Chen, L.C.; Zhu, Y.K.; Papandreou, G.; Schroff, F.; Adam, H.; Gossow, M.; Li, X.; Wei, Z.; Li, J.; Huang, C. Encoder decoder with atrous separable convolution for semantic image segmentation. Eur. Conf. Comput. Vision. 2018, 11211, 833–851. [Google Scholar]
Figure 1. Location of the study area and images.
Drones 09 00237 g001
Figure 2. Sample labeling diagram.
Drones 09 00237 g002
Figure 3. U-net network model structure.
Drones 09 00237 g003
Figure 4. ECA structure.
Drones 09 00237 g004
Figure 5. ECA-Unet model structure.
Drones 09 00237 g005
Figure 6. Schematic diagram of VGG network structure.
Drones 09 00237 g006
Figure 7. Model semantic segmentation results.
Drones 09 00237 g007
Figure 8. Model loss curve.
Drones 09 00237 g008
Figure 9. Comparison of segmentation results of different models.
Drones 09 00237 g009
Table 1. Sensor bands and band parameters.
Band NameWavelengthBand Value Range
Blue450nm@35nm0–7350
Green555nm@27nm0–10,420
Red660nm@22nm0–8737
NIR1720nm@10nm0–6843
NIR2750nm@10nm0–12,454
NIR3840nm@30nm0–10,260
Table 2. The numbering of each tree species and their label quantities within the study area.
NumberTree SpeciesLabelsN PixelsPicture Demonstration
1Areca Trees2526,304,700Drones 09 00237 i001
2Jackfruit Trees2945,348,891Drones 09 00237 i002
3Banyan Trees1703,456,893Drones 09 00237 i003
4Rubber Trees2396,611,559Drones 09 00237 i004
5Coconut Trees451,081,013Drones 09 00237 i005
Table 3. Dataset sample description.
CategoryValue
Training Set Images1509
Images in the Verification Set168
Test Set Images187
Total Dataset Labels22,790
Table 4. Segmentation accuracy index of various types of single trees under the ECA-Unet model.
ClassesIoUPAF1RecallPrecision
Areca Trees42.56%53.59%0.6460.41%67.42%
Jackfruit Trees53.73%73.11%0.5451.77%66.97%
Banyan Trees38.62%47.69%0.5138.33%67.02%
Rubber Trees34.37%58.06%0.3836.03%45.72%
Coconut Trees38.13%46.25%0.5947.86%68.48%
Table 5. Segmentation accuracy index of various types of single trees under the ECA-Unet model.
ModelmIoUmPAAccuracy
U-net48.91%61.23%84.64%
DeepLab V3+47.45%60.99%85.40%
PSPNet40.55%53.63%83.26%
ECA-Unet49.19%63.33%85.87%
Disclaimer/Publisher’s Note: The statements, opinions and data contained in all publications are solely those of the individual author(s) and contributor(s) and not of MDPI and/or the editor(s). MDPI and/or the editor(s) disclaim responsibility for any injury to people or property resulting from any ideas, methods, instructions or products referred to in the content.

