Article

Mapping, Modeling and Designing a Marble Quarry Using Integrated Electric Resistivity Tomography and Unmanned Aerial Vehicles: A Study of Adaptive Decision-Making

1
Key Laboratory of Efficient Mining and Safety of Metal Mines, Ministry of Education, School of Resource and Safety Engineering, University of Science and Technology Beijing, Beijing 100083, China
2
Mining Engineering Department, Faculty of Engineering, Karakoram International University, Gilgit 15100, Gilgit-Baltistan, Pakistan
3
China Academy of Safety Science and Technology, Beijing 100012, China
4
Faculty of Science, University of the Fraser Valley, Abbotsford, BC V2S 7M8, Canada
*
Author to whom correspondence should be addressed.
Drones 2025, 9(4), 266; https://doi.org/10.3390/drones9040266
Submission received: 23 February 2025 / Revised: 23 March 2025 / Accepted: 27 March 2025 / Published: 31 March 2025

Abstract

:
The characterization of dimensional stone deposits is essential for quarry assessment and design. However, uncertainties in mapping and designing pose significant challenges. To address this issue, an innovative approach is initiated to develop a virtual reality model by integrating unmanned aerial vehicle (UAV) photogrammetry for surface modeling and Electric Resistivity Tomography (ERT) for subsurface deposit imaging. This strategy offers a cost-effective, time-efficient, and safer alternative to traditional surveying methods for challenging mountainous terrain. UAV methodology involved data collection using a DJI Mavic 2 Pro (20 MP camera) with 4 K resolution images captured at 221 m altitude and 80 min flight duration. Images were taken with 75% frontal and 70% side overlaps. The Structure from Motion (SfM) processing chain generated high-resolution outputs, including point clouds, Digital Elevation Models (DEMs), Digital Surface Models (DSMs), and orthophotos. To ensure accuracy, five ground control points (GCPs) were established by a Real-Time Kinematic Global Navigation Satellite System (RTK GNSS). An ERT method known as vertical electric sounding (VES) revealed subsurface anomalies like solid rock mass, fractured zones and areas of iron leaching within marble deposits. Three Schlumberger (VES-1, 2, 3) and two parallel Wenner (VES-4, 5) arrays to a depth of 60 m were employed. The resistivity signature acquired by PASI RM1 was analyzed using 1D inversion technique software (ZondP1D). The integrated outputs of photogrammetry and subsurface imaging were used to design an optimized quarry with bench heights of 30 feet and widths of 50 feet, utilizing open-source 3D software (Blender, BIM, and InfraWorks). This integrated approach provides a comprehensive understanding of deposit surface and subsurface characteristics, facilitating optimized and sustainable quarry design and extraction. This research demonstrates the value of an innovative approach in synergistic integration of UAV photogrammetry and ERT, which are often used separately, for enhanced characterization, decision-making and promoting sustainable practices in dimensional stone deposits.

1. Introduction

The increasing population and industrialization necessitate the construction of new infrastructures such as residential areas, hospitals, schools, and commercial buildings [1]. This has resulted in growing demand for dimensional stones such as limestone, slate, and marble in the form of rock aggregates and slabs [2]. Dimensional stones are those natural rock stones that are drilled, cut, and trimmed to designated shapes and sizes to be used for a variety of purposes, including slabs, stone tiles, facades, and so on [3]. Thus, to cope with this high demand, exploration of new deposits is required. For this reason, advanced and innovative exploration techniques are urgently needed in the mining field for a better understanding of the surface and subsurface nature of deposits that are cost- and time-effective for the exploration of new deposits. These techniques should range from regional- to local-scale studies [4]. A common practice in mining is to assess the feasibility and worth of deposits prior to mining. Generally, the value of the mineral deposit is determined based on the grade of the valuable mineral; however, in the case of marble, the value is computed based on the ratio of the bedrock volume to the topsoil. The dimensional stone deposit is considered feasible for mining if the bedrock volume is three times the topsoil [3,5]. To estimate the volume of the topsoil and bedrock, the information regarding the surface topography as well as a detailed delineation of subsurface lithological features are prerequisites [6].
The surveying methods for mine deposit quantification and demarcation, as well as the investigation of surface and subsurface situations, are tedious and time-consuming [7]. In mountainous areas with steep and rugged terrain, it is difficult to use conventional surveying and modeling methods to obtain detailed data prior to mining activities and mine lease grants [8]. Extensive subsurface investigation methods are expensive and difficult to carry out at high-altitude mines [9]. Similarly, these expensive methods are beyond the range of developing and underdeveloped countries for use in surface and subsurface modeling [9]. In view of these constraints, it is very important to introduce fast, portable, accurate, and inexpensive methods. This fills the gap in remote sensing data in the low-height flight of heliborne and airborne platforms for the detailed evaluation of deposits in far-flung areas.
Currently, UAV surveys, locally known as drone surveys, are commonly used techniques for topographic mapping [10]. UAVs provide dense, accurate, and precise 3D point clouds at a reasonable cost, making them suitable for applications ranging from mineral exploration to mine reclamation [11,12]. Furthermore, the UAV survey does not require physical access to the site; thus, a topographic survey of the geologically complex area can be obtained safely and remotely [12]. The UAV survey includes capturing a series of images of the study area at sufficient overlap, followed by the reconstruction of the Digital Terrain Model (DTM), point cloud, and the Digital Elevation Model (DEM) [13]. The DEM enables the generation of the contour maps of the study area, allowing the extraction of the surface topographic information [14]. A high-precision and high-quality DEM can be obtained by using known fieldwork and optimum flight planning techniques, appropriate parameters of the camera, and the accurate GCPs [15,16].
Similarly, for subsurface lithological feature delineation, the Electrical Resistivity Imaging (ERI) technique is widely used to determine subsurface conditions such as water zones, solid rock, and fractured rock in mineral deposits [17]. This technique offers a reliable, low-cost, non-destructive approach and advanced data interpretation with collection for investigation [6,18]. The geological formation of metamorphic rocks under high pressure and temperature makes them extremely hard rock, thus being characterized by high resistivity values ranging from 100 to 108 Ω·m [19]. An extensive literature review demonstrates that plenty of work has been performed on surface modeling of mineral deposits using UAVs, from 3D modeling of outcrops to identification of minerals based on their signatures, as well as subsurface modeling by using geophysical methods. However, the literature on the synergistic utilization of UAVs and ERT in the field is very limited.
In this study, an innovative and synergistic approach, integrating low-cost, lightweight UAVs and ERTs (VES), is employed for comprehensive surface and subsurface modeling of marble deposits in the Minapin Valley of Nagar District, Pakistan. Although individual applications of UAV photogrammetry for surface mapping and geophysical methods for subsurface exploration are known, the synergistic utilization of these technologies for a holistic deposit assessment remains limited in the current literature. Traditional surveying techniques, like ground-based total stations and terrestrial laser scanning (TLS), require significant time for data collection and post-processing. The integration of surface and subsurface models facilitates a more comprehensive understanding of the marble deposit, including the delineation of solid bedrock, fractured rock mass, and areas of iron leaching. This approach supports sustainable quarry design, enhances decision-making for planning in challenging mountainous terrains and demonstrates the suitability of the area for future quarrying and the exploration of dimensional stones for commercial purposes.

2. Materials and Methods

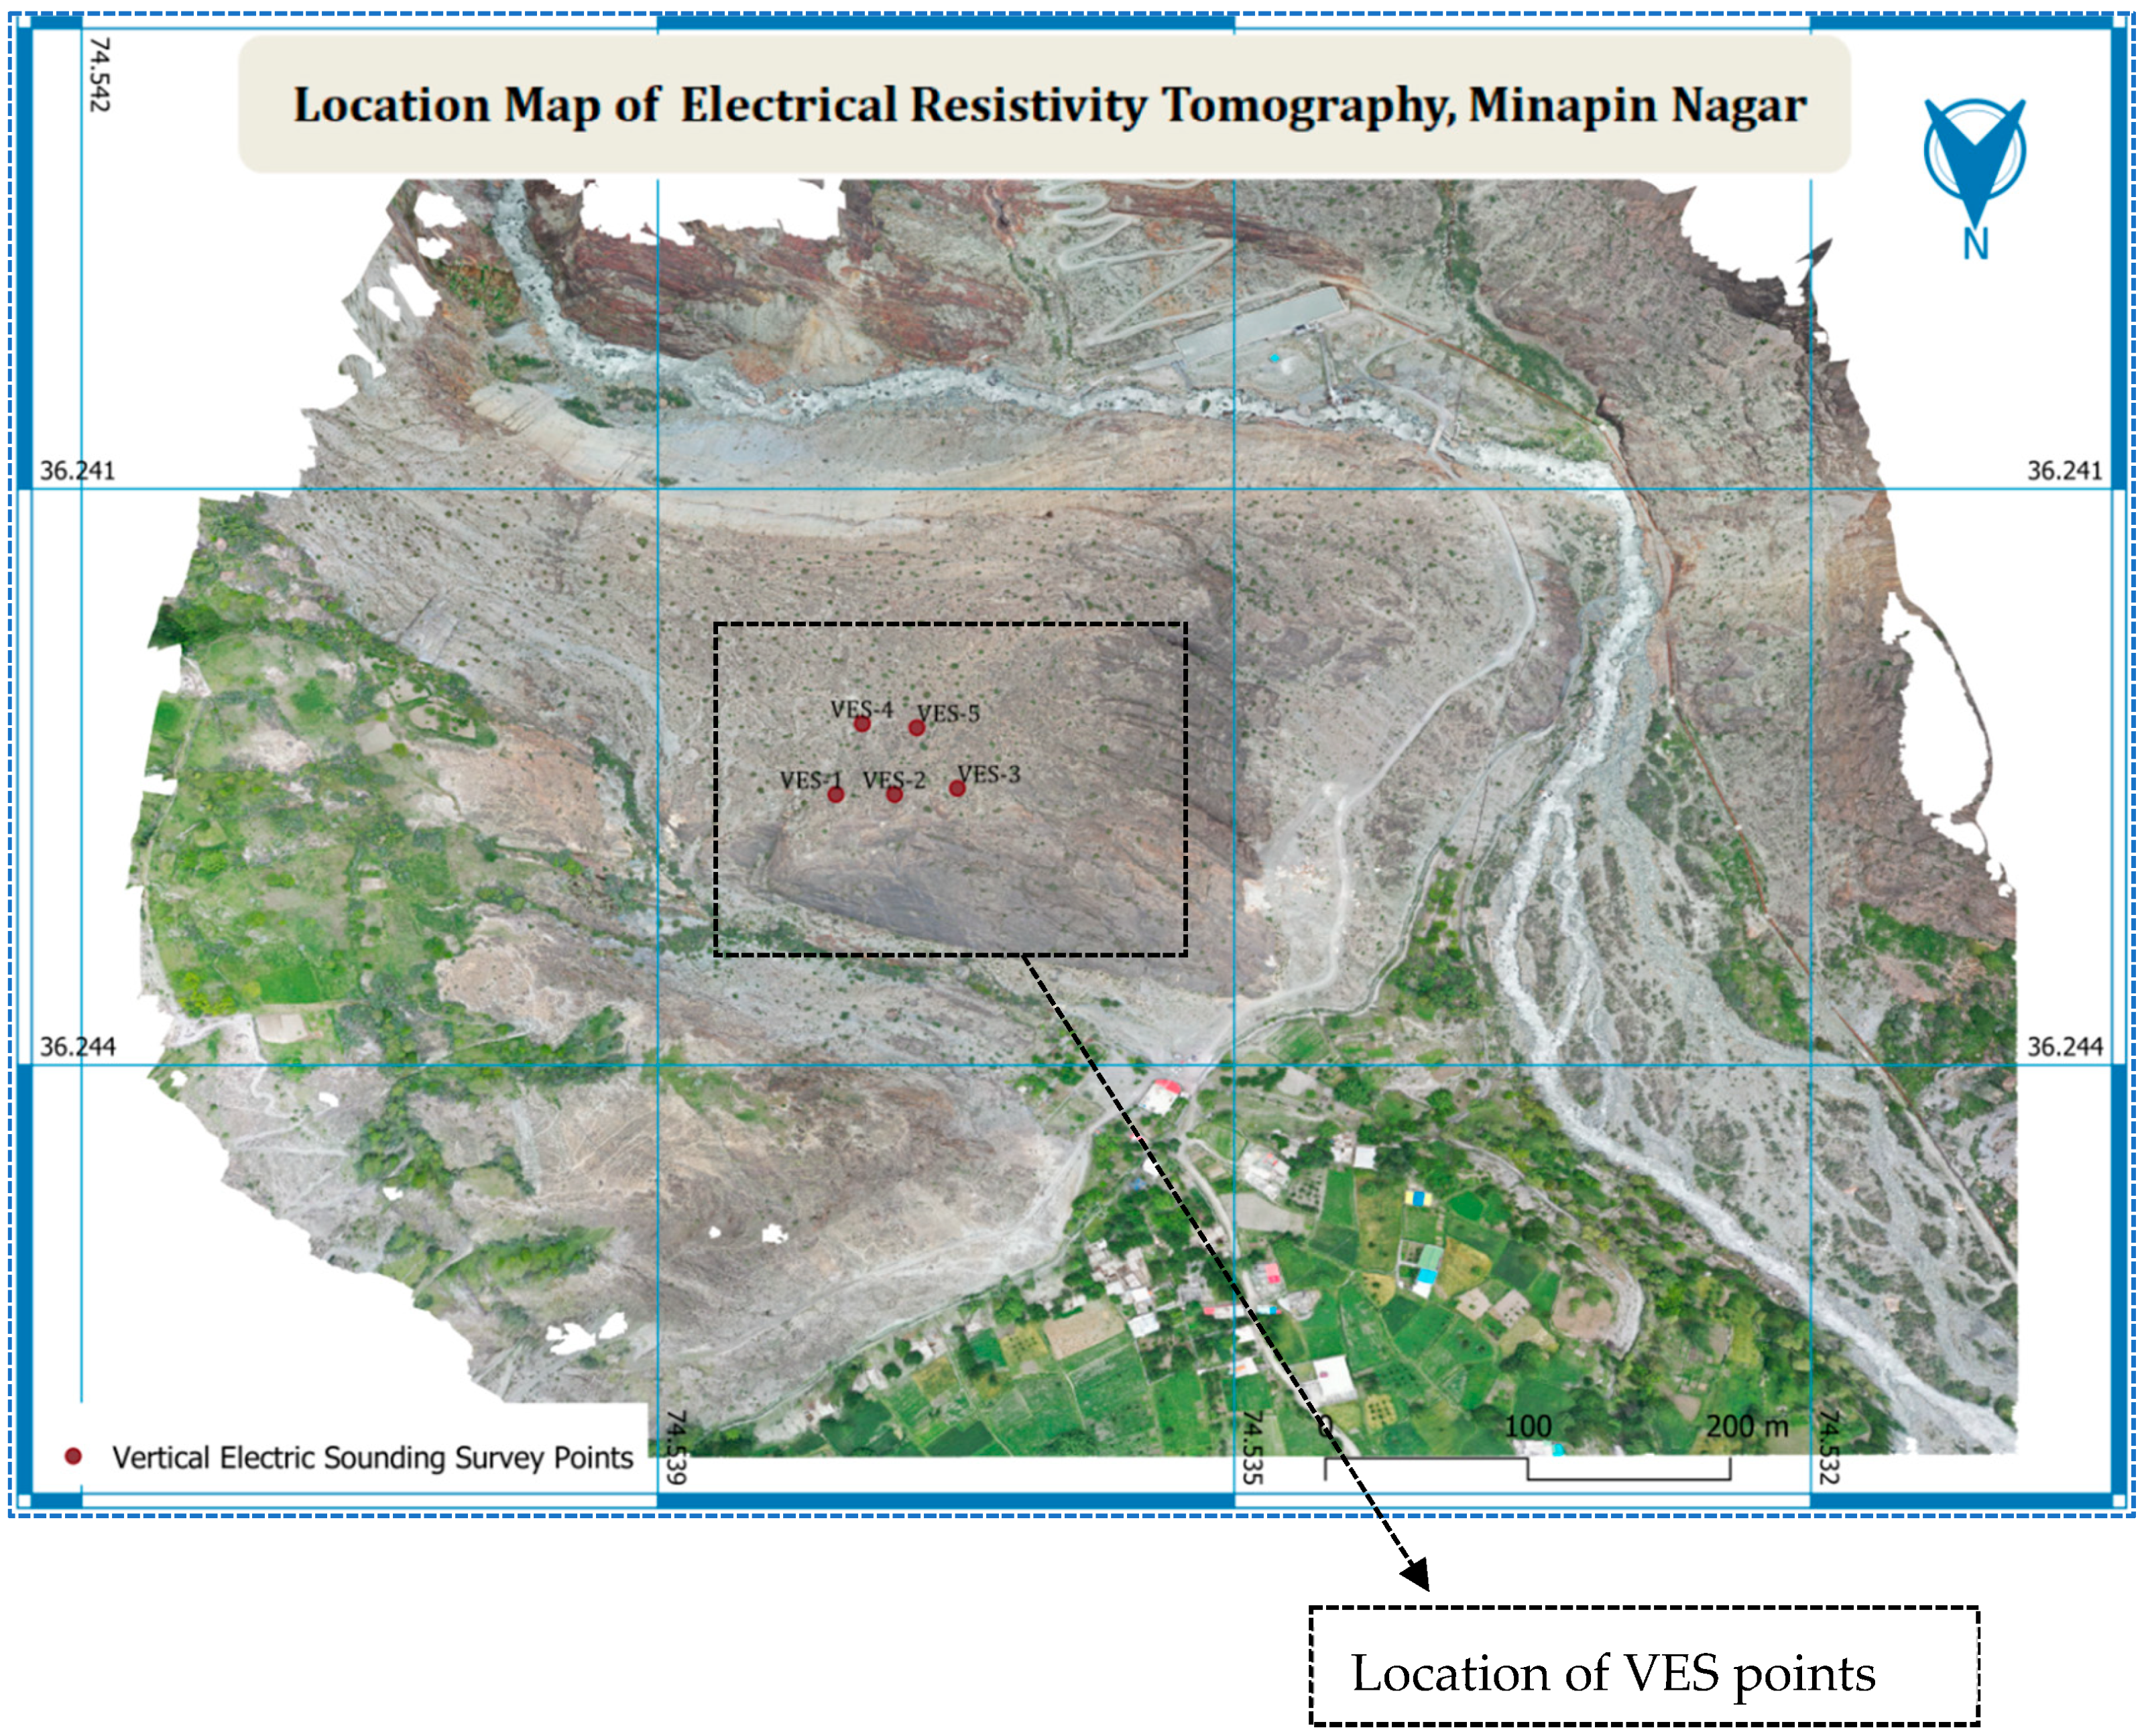
2.1. Location Map of the Study Area

The research site is located in the Minapin Nagar Valley of Gilgit Baltistan Province in northern Pakistan. This area is surrounded by mighty mountains such as Rakaposhi and Diran Peak. The valley is adjacent to the Karakoram Highway (KKH) about a 2-hour drive from Gilgit City. The marble of this area is renowned for its translucency, fine grains, and creamy white color. The location map of this study area is shown in Figure 1. The geology of the area is made up of particular formations, namely Staurolite Schists, Garnet-Chloritoid Schists, Shyok Suture Zone and Kohistan Batholith [20]. This region was tectonically active in the past and had an influence on the surrounding formation of the main Karakoram Thrust (MKT), due to which the deposited mineral contains fractures.

2.2. Data Collection

UAVs and ERT (VES) were used synergistically for surface and subsurface modeling of marble deposits. Based on the UAV-generated 3D surface models, a preliminary quarry design was developed to facilitate the efficient extraction of marble for both local and commercial use, thereby minimizing waste during the extraction process. Marble deposits with and without fractures were identified using VES based on fractures and anomalies. Figure 2 shows the proposed virtual plan for surface and subsurface modeling of the research area.

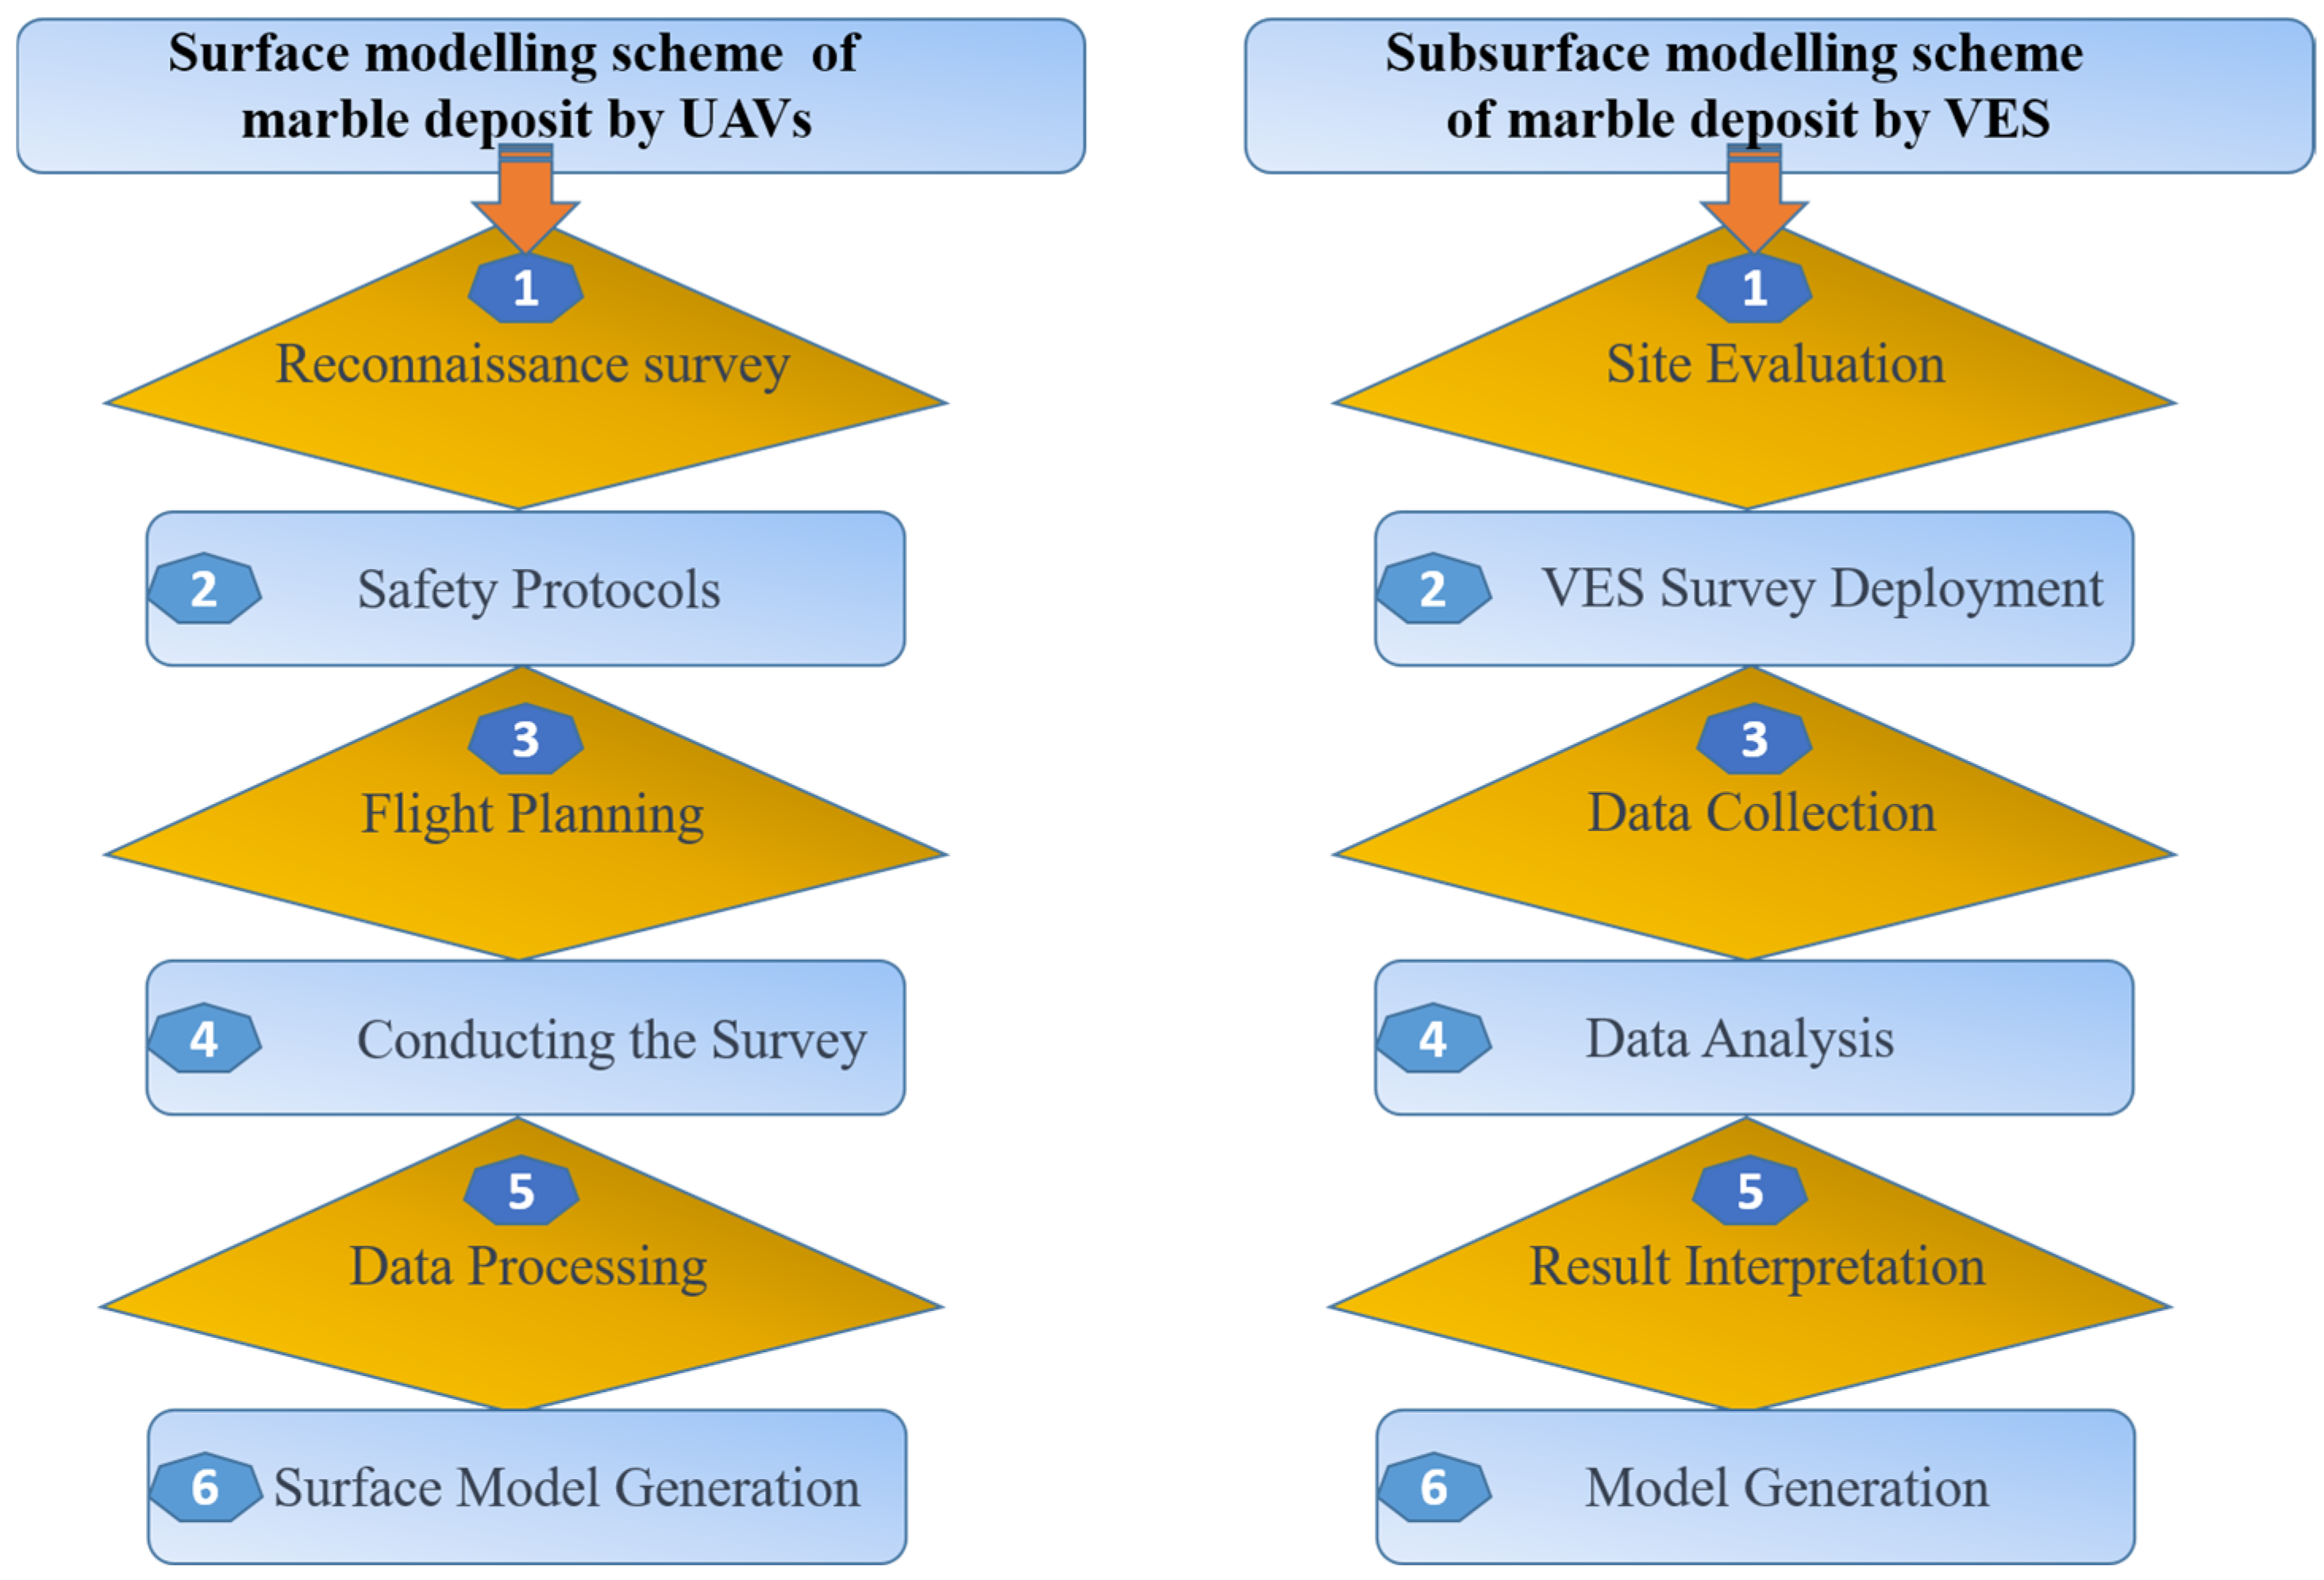
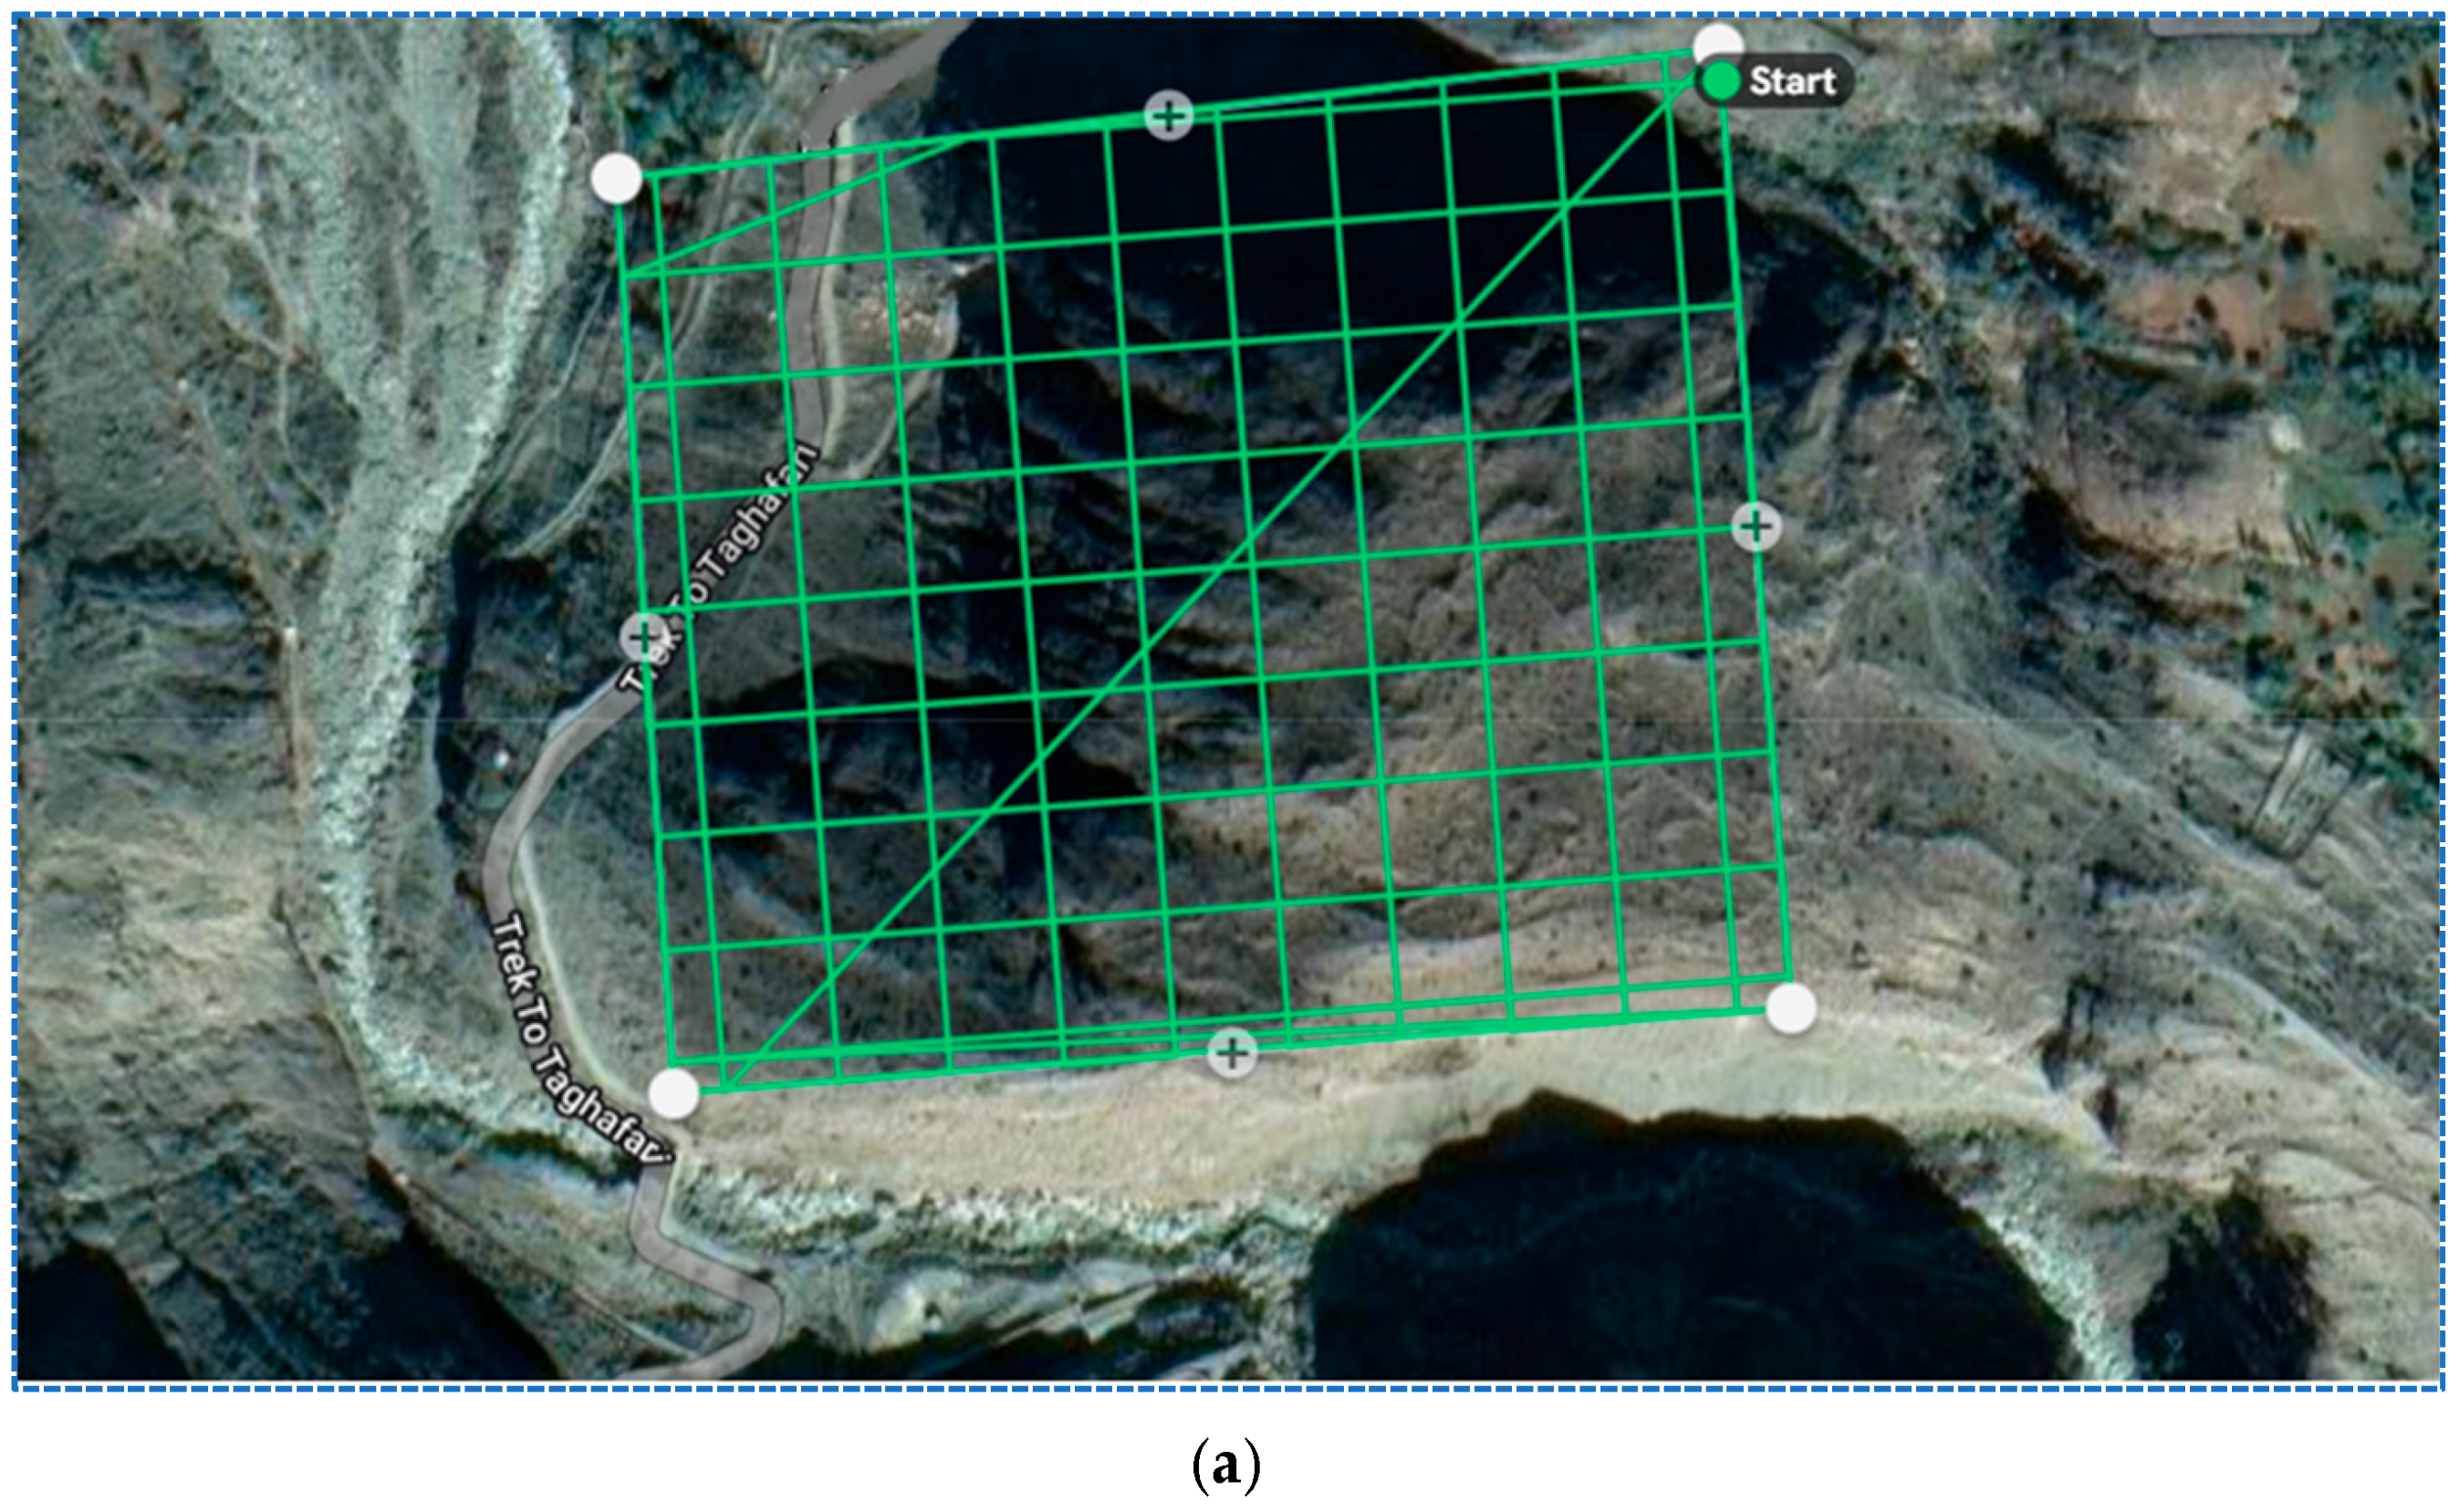
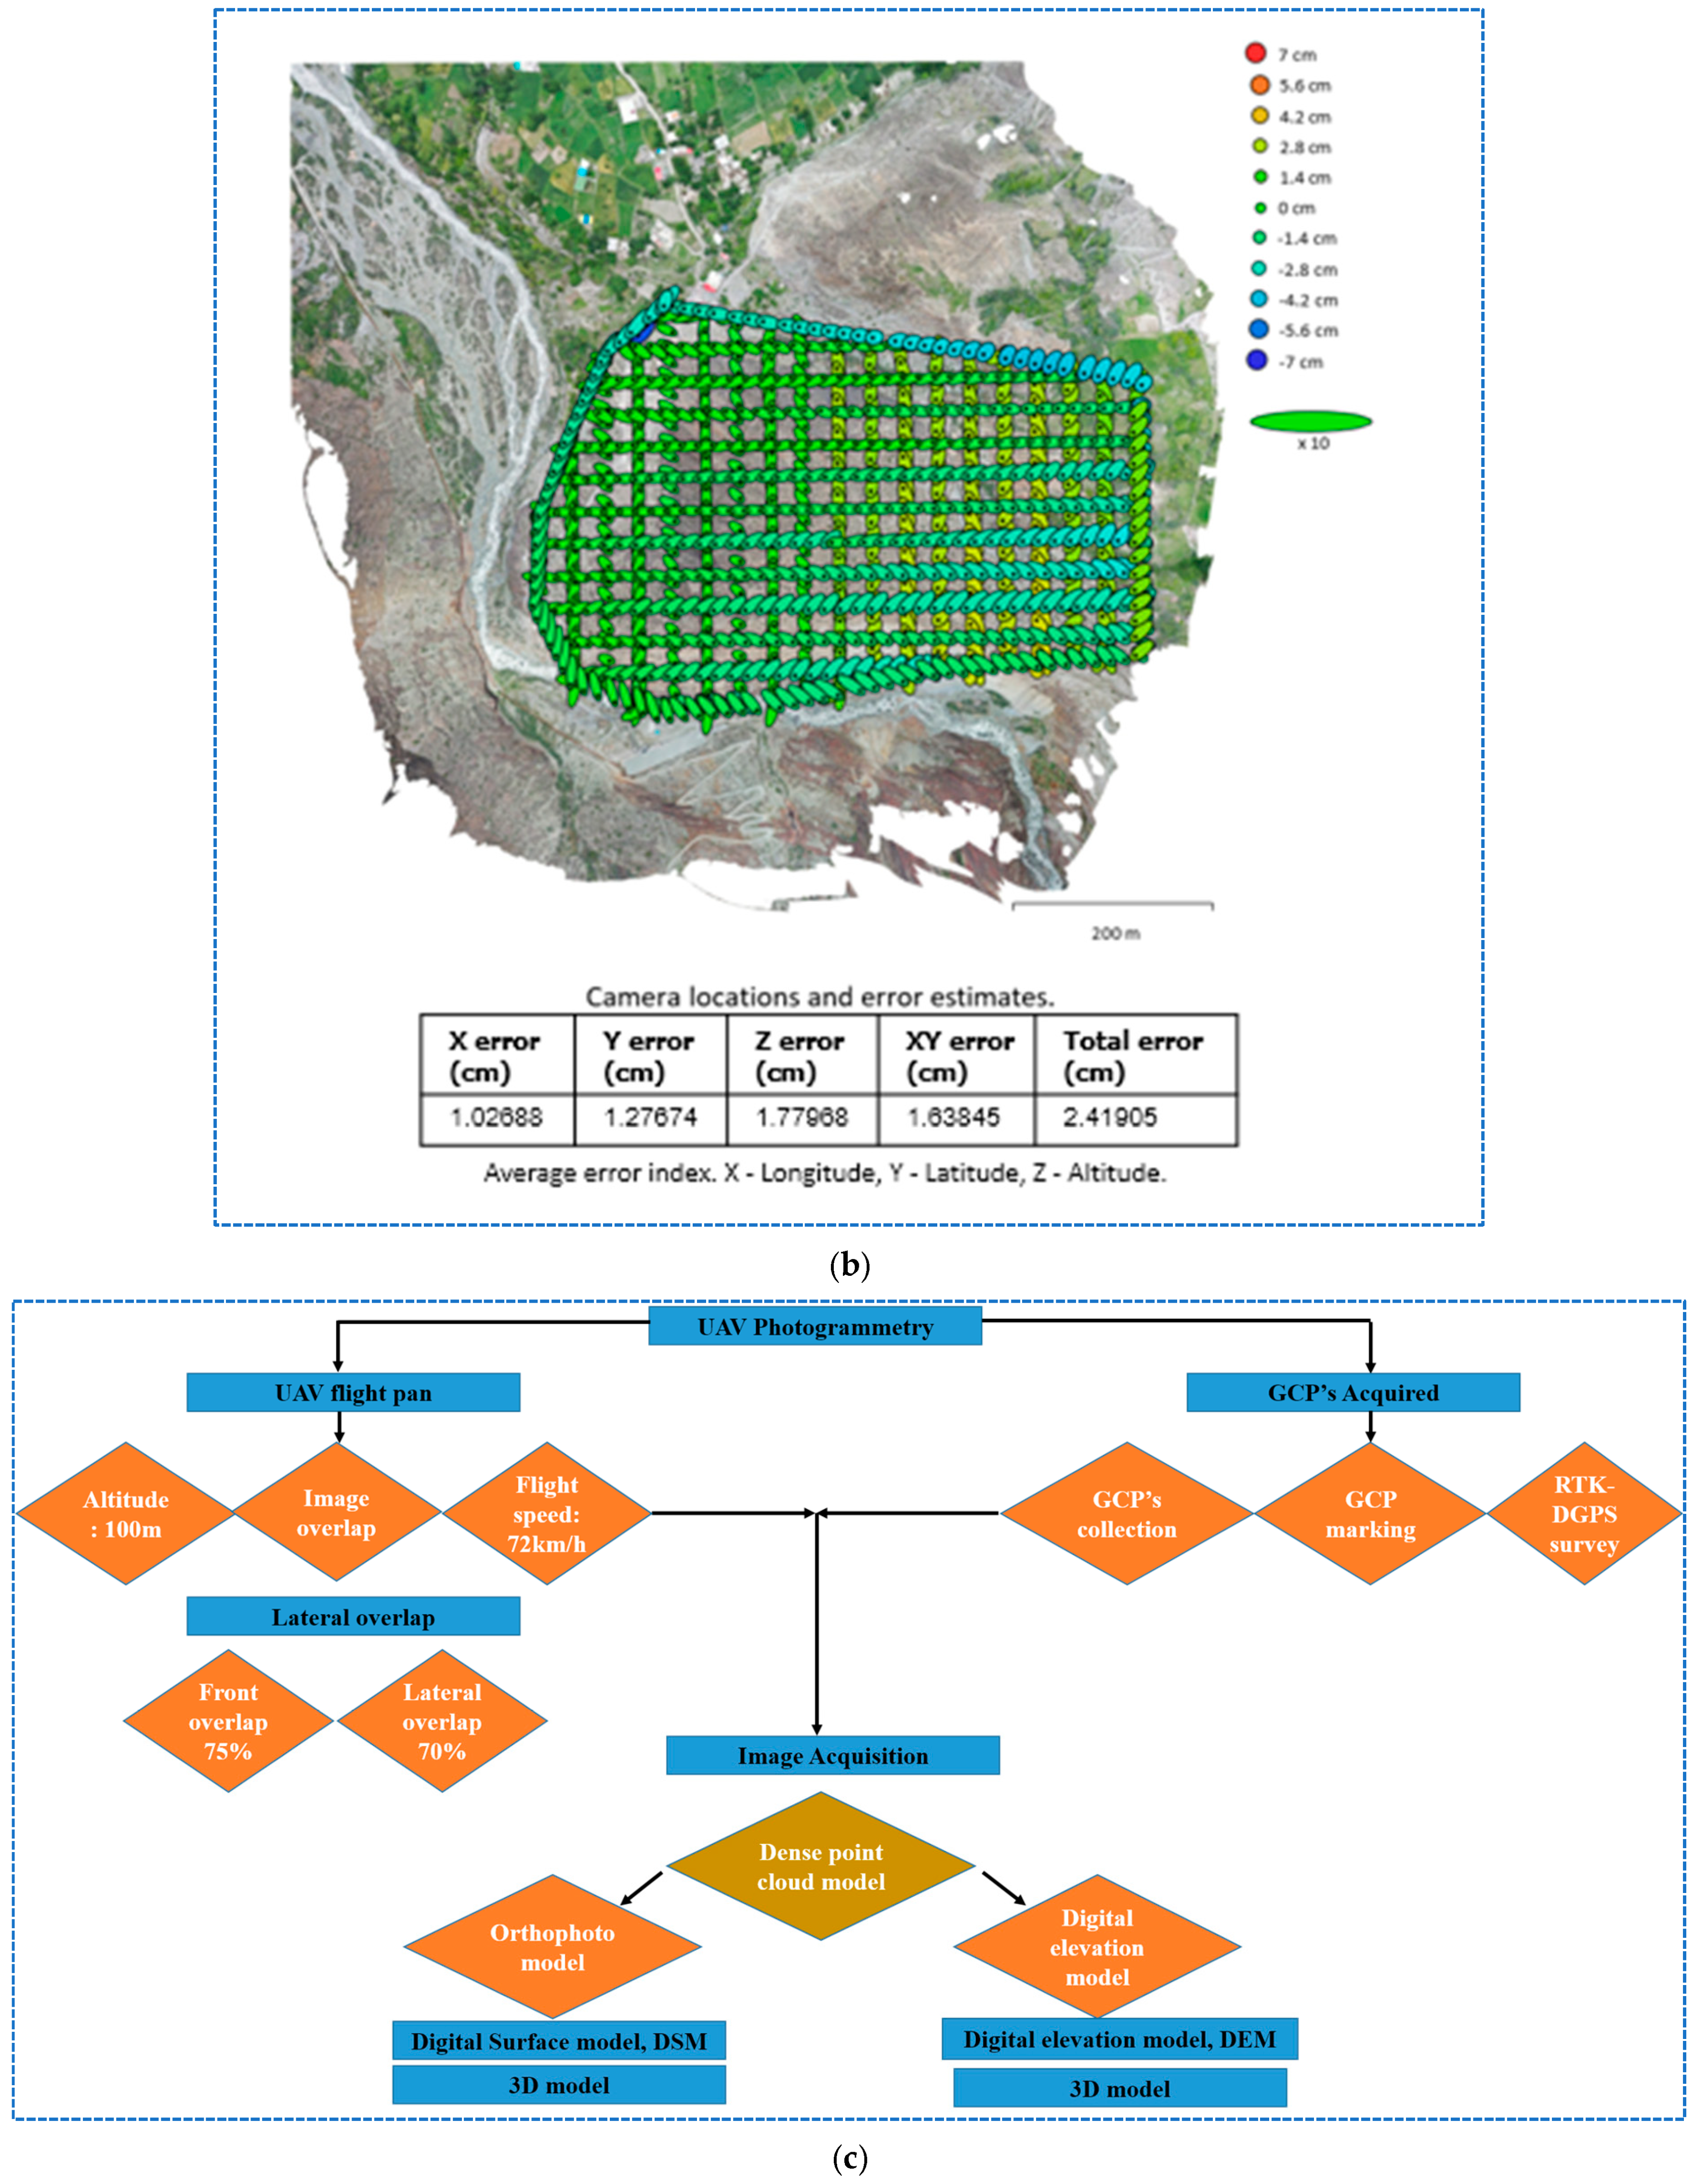
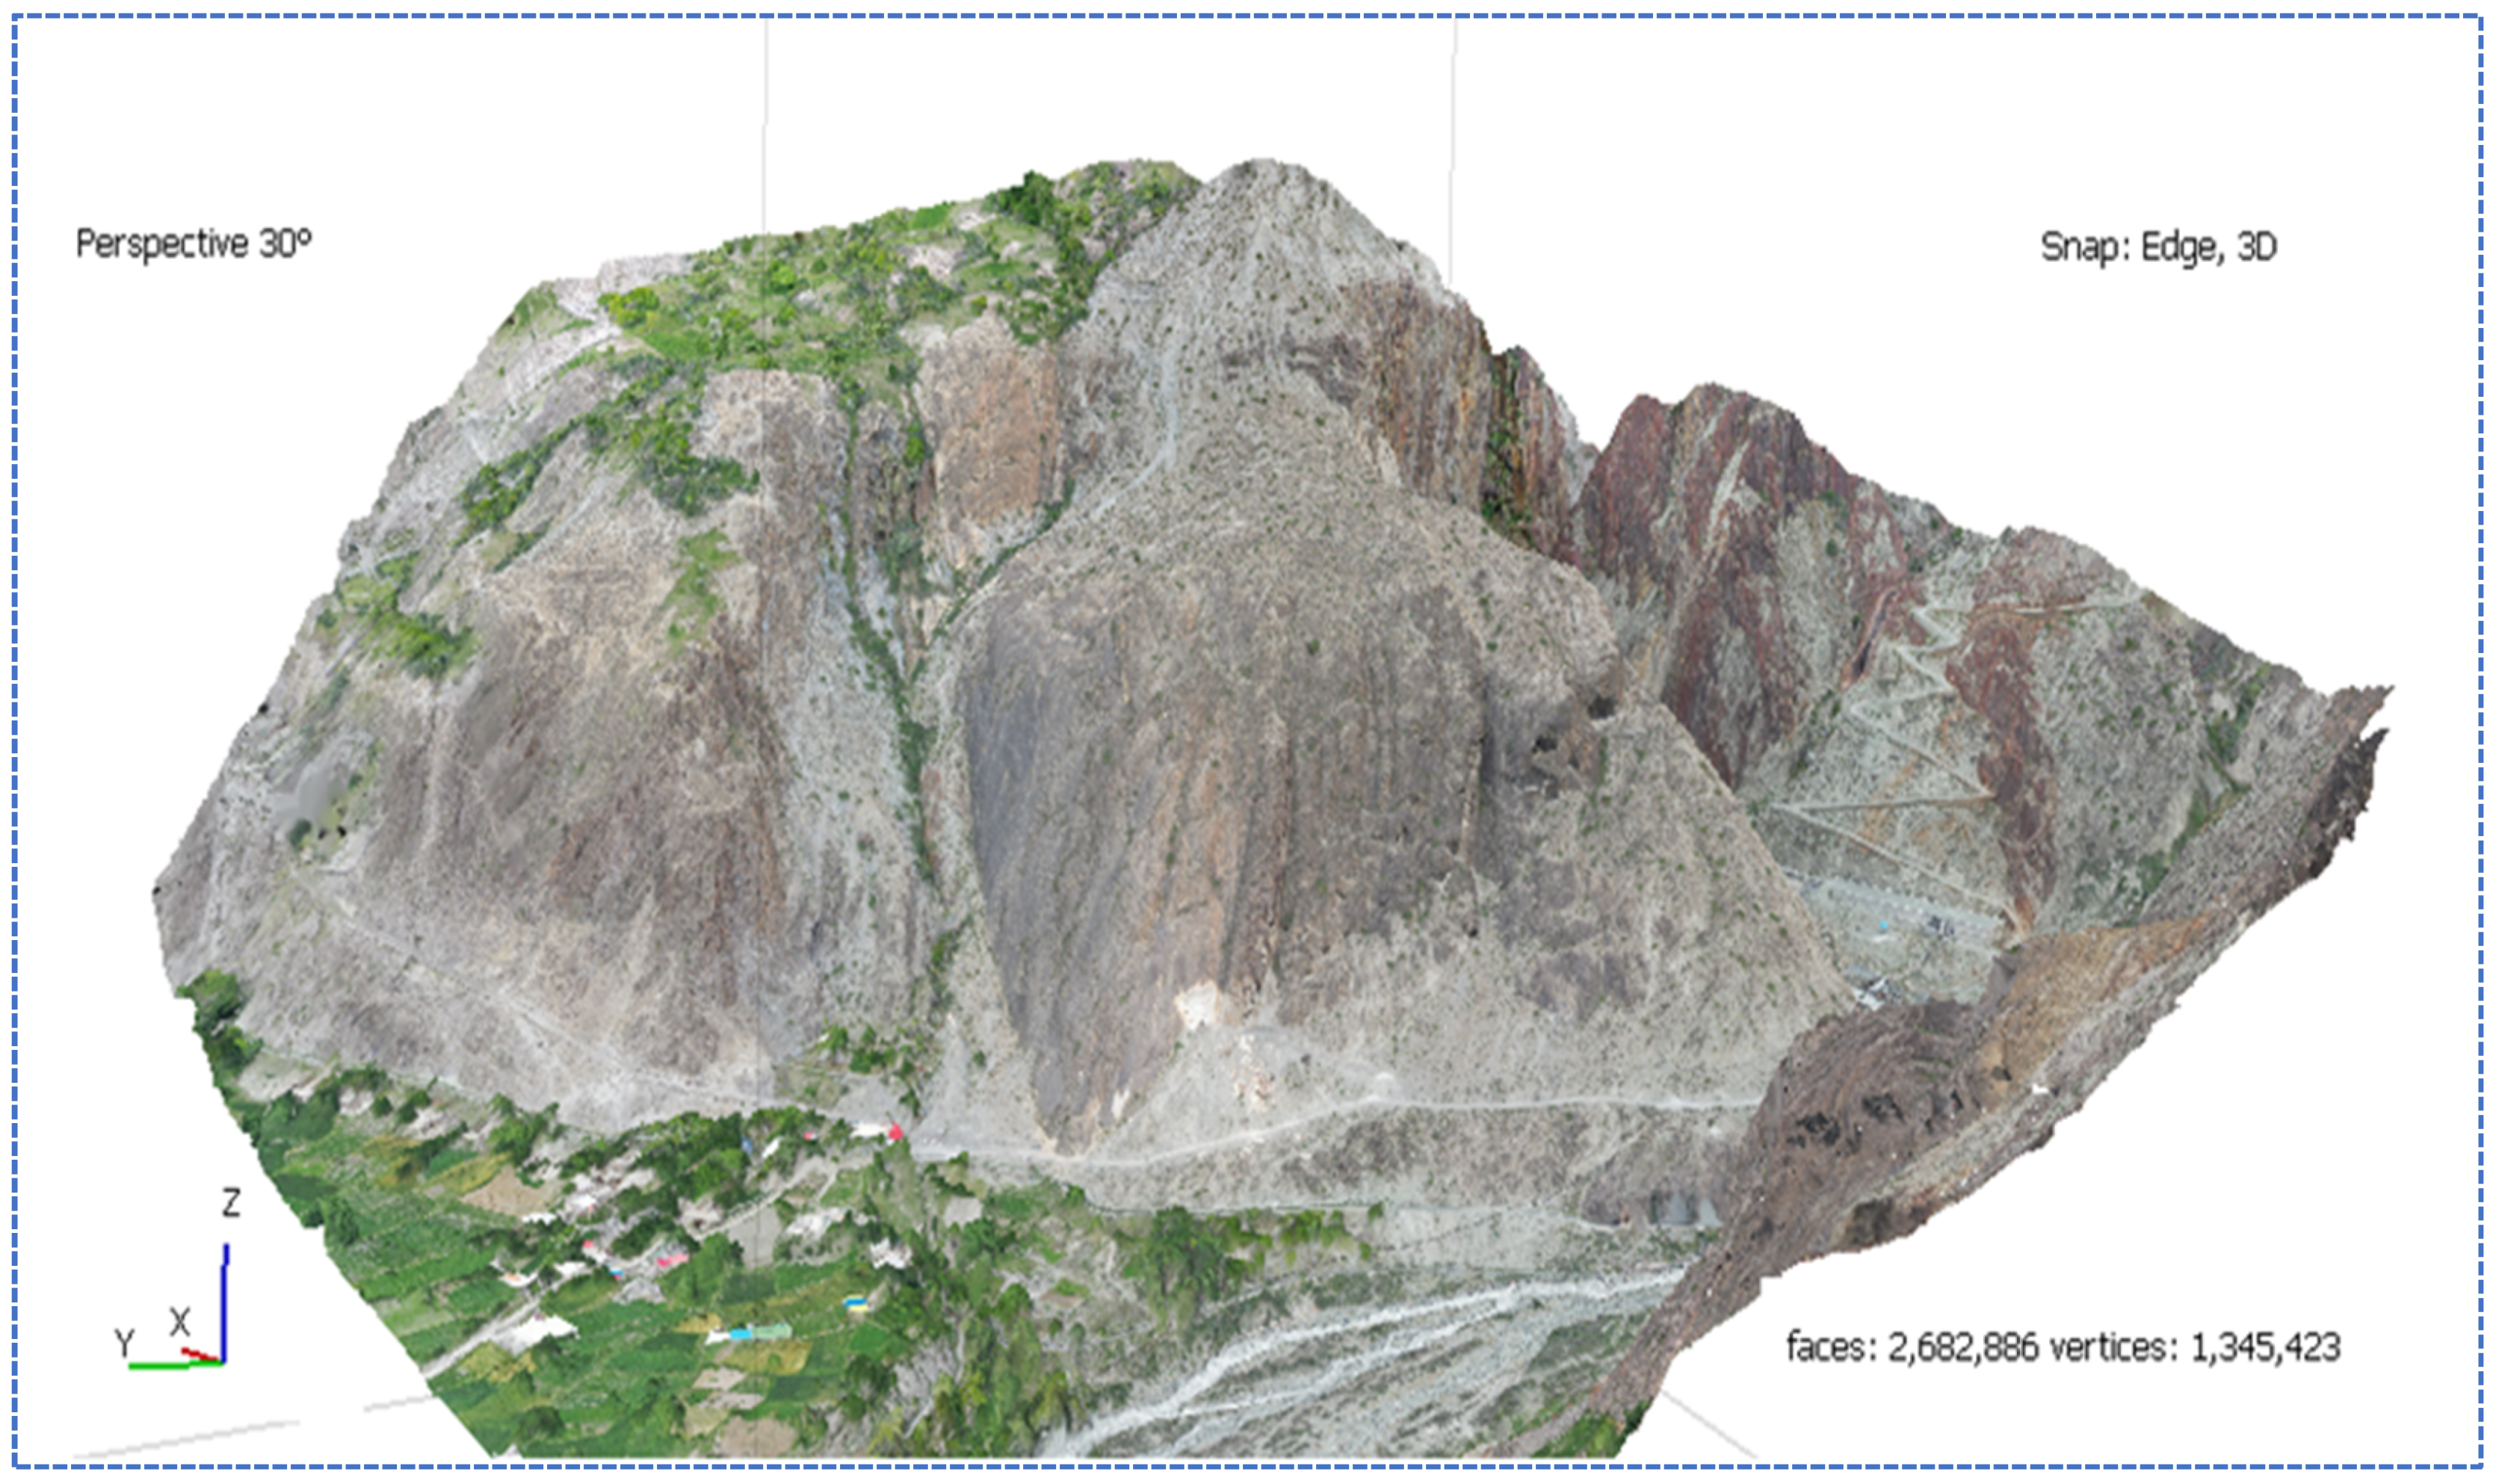
2.2.1. UAV Survey Data Acquisition and Processing

Natural rocks (dimensional stones) can be used for decorative or ornamental purposes in daily life [21]. Dimensional stone’s color and texture (appearance), discontinuities, intrusions, changes, inclusions, contact zones, and accessory minerals all affect its quality and viability [3]. Geological and structural mapping, geophysical research, and core drilling are examples of exploration activities used to resolve issues regarding the feasibility and quality of dimensional stones [22]. For a thorough study to be completed successfully, all portions of the deposit must be easily and securely accessed. The Minapin marble deposit displays extended and large outcrops on rugged topography, which makes it difficult to carry out conventional fieldwork as well as terrestrial surveying. Hence, aerial mapping is a promising technique in this research area.
A UAV survey was conducted to collect detailed, high-resolution data throughout the deposit. A total of 980 aerial photographs were captured using a DJI Mavic 2 Pro UAV system. This system is equipped with a 20 MP camera that has a focal length of 10.26 mm and is capable of capturing 4 K high-resolution images. To ensure high-quality photogrammetry, the images were captured with 75% frontal overlap and 70% side overlap, based on the flight height and camera focal length. This approach minimizes data gaps and ensures the accuracy of the 3D models.
The flight parameters were carefully optimized for data collection, including a 221 m altitude, an 80 min total flying duration, a ground sampling distance (GSD) of 4.96 cm/pixel and an oblique waypoint.
The main procedures and technical specifications for UAV data gathering and handling of finished products used in geological engineering applications are detailed in Table 1 and Figure 3. To achieve accurate georeferencing, five GCPs were established using RTK GNSS. This step is crucial for aligning generated models with real-world coordinates and improving their spatial accuracy. The captured images were processed using SfM techniques with the Agisoft Metashape software (version 1.8.2) [23]. The SfM workflow involves selecting geotagged images, optimizing photo matching and key point analysis, and generating 3D meshes, dense point clouds, texture atlas tiles, and orthorectified orthomosaics [24,25].
The final outputs of the UAV survey included high-resolution 3D Digital Terrain Models (DTMs), Digital Elevation Models (DEMs), and contour maps. These products are essential for planning haulage roads, identifying optimal bench locations, and calculating the reserve volumes within the study area. Figure 3a shows the pre-flight UAV path, designed as a systematic grid pattern over the study area’s orthomosaic map, with a designated starting point in the northeastern section. The flight plan features parallel transects intersected by diagonal cross-sections to ensure comprehensive coverage and data overlap. This design accounts for complex terrain features such as elevated topography and existing infrastructure along the western boundary of the survey area.
Figure 3b presents the executed UAV flight path overlaid on the orthomosaic imagery. The color-coded points represent deviations in the estimated camera positions (X, Y, and Z coordinates), with errors ranging from −7 cm to 7 cm. The systematic survey pattern demonstrates comprehensive coverage of the study area, with a 200 m scale bar indicating the spatial extent of the investigation. The accompanying error analysis table reveals high precision in positional accuracy, with a total error of 2.41905 cm derived from X (longitude), Y (latitude), and Z (altitude) components measuring 1.02988 cm, 1.27674 cm, and 1.77698 cm, respectively. This validates the reliability of the aerial survey data collection methodology. The final orthomosaic was produced after orthorectification [26].

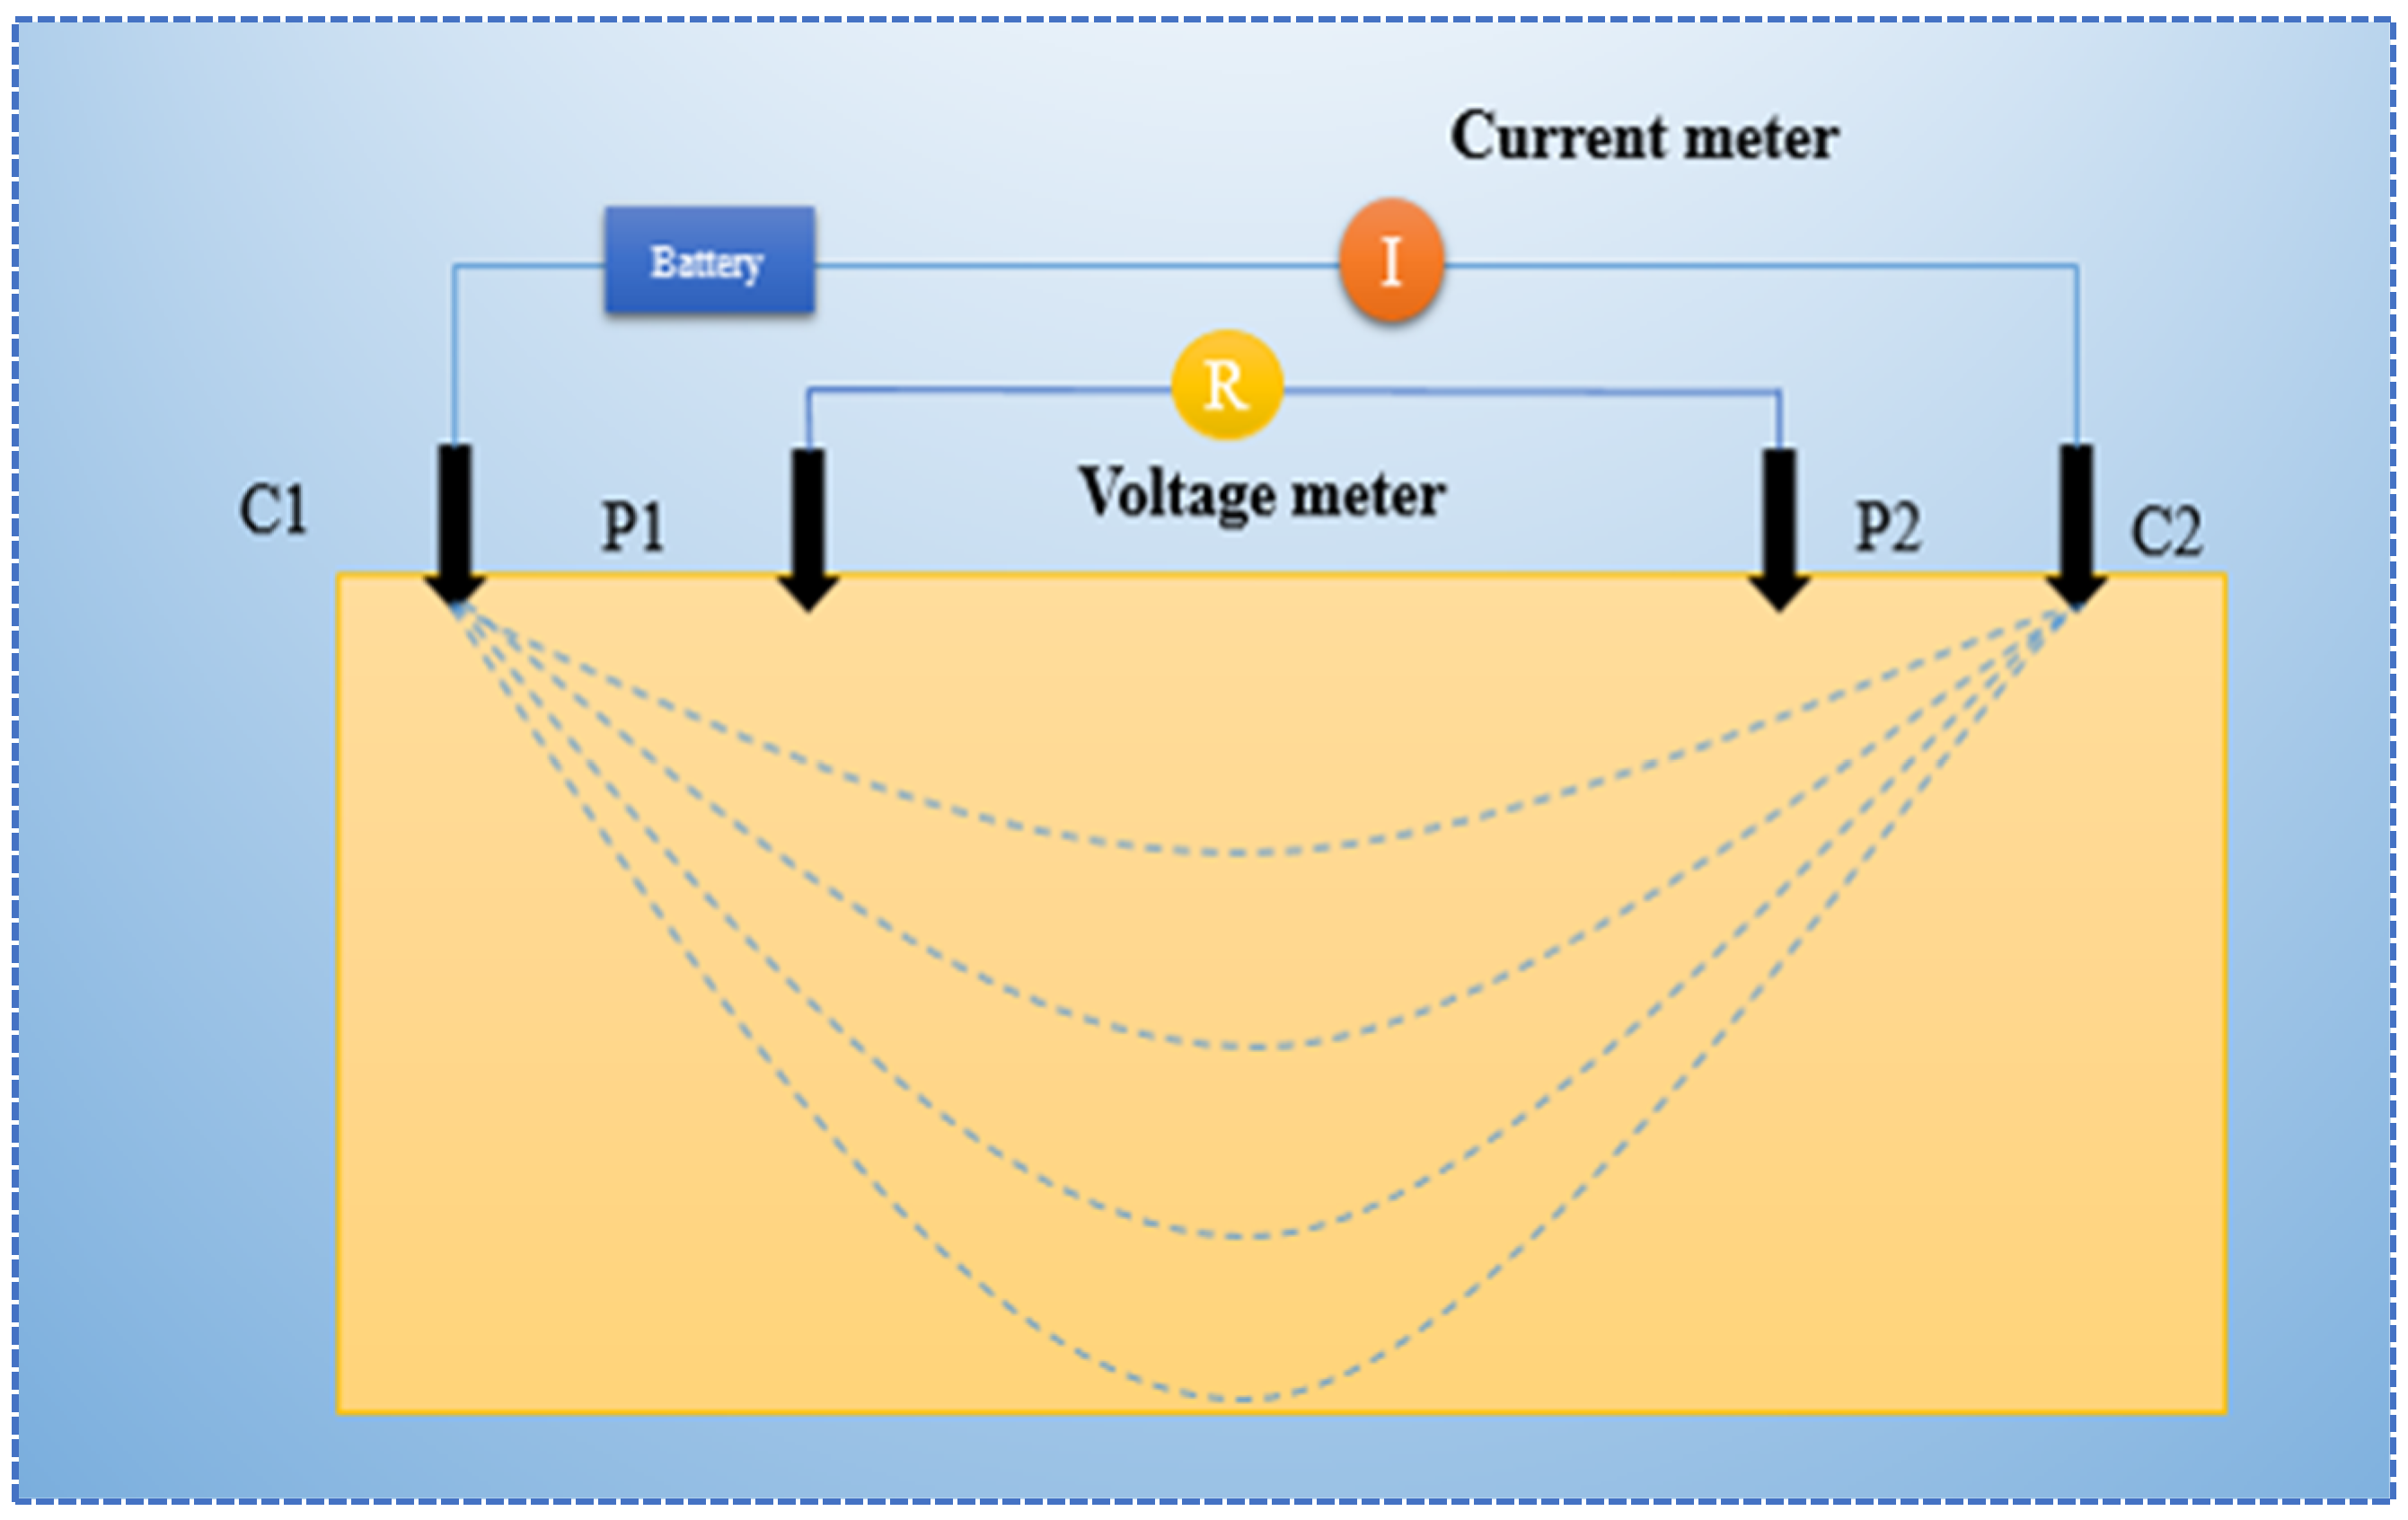
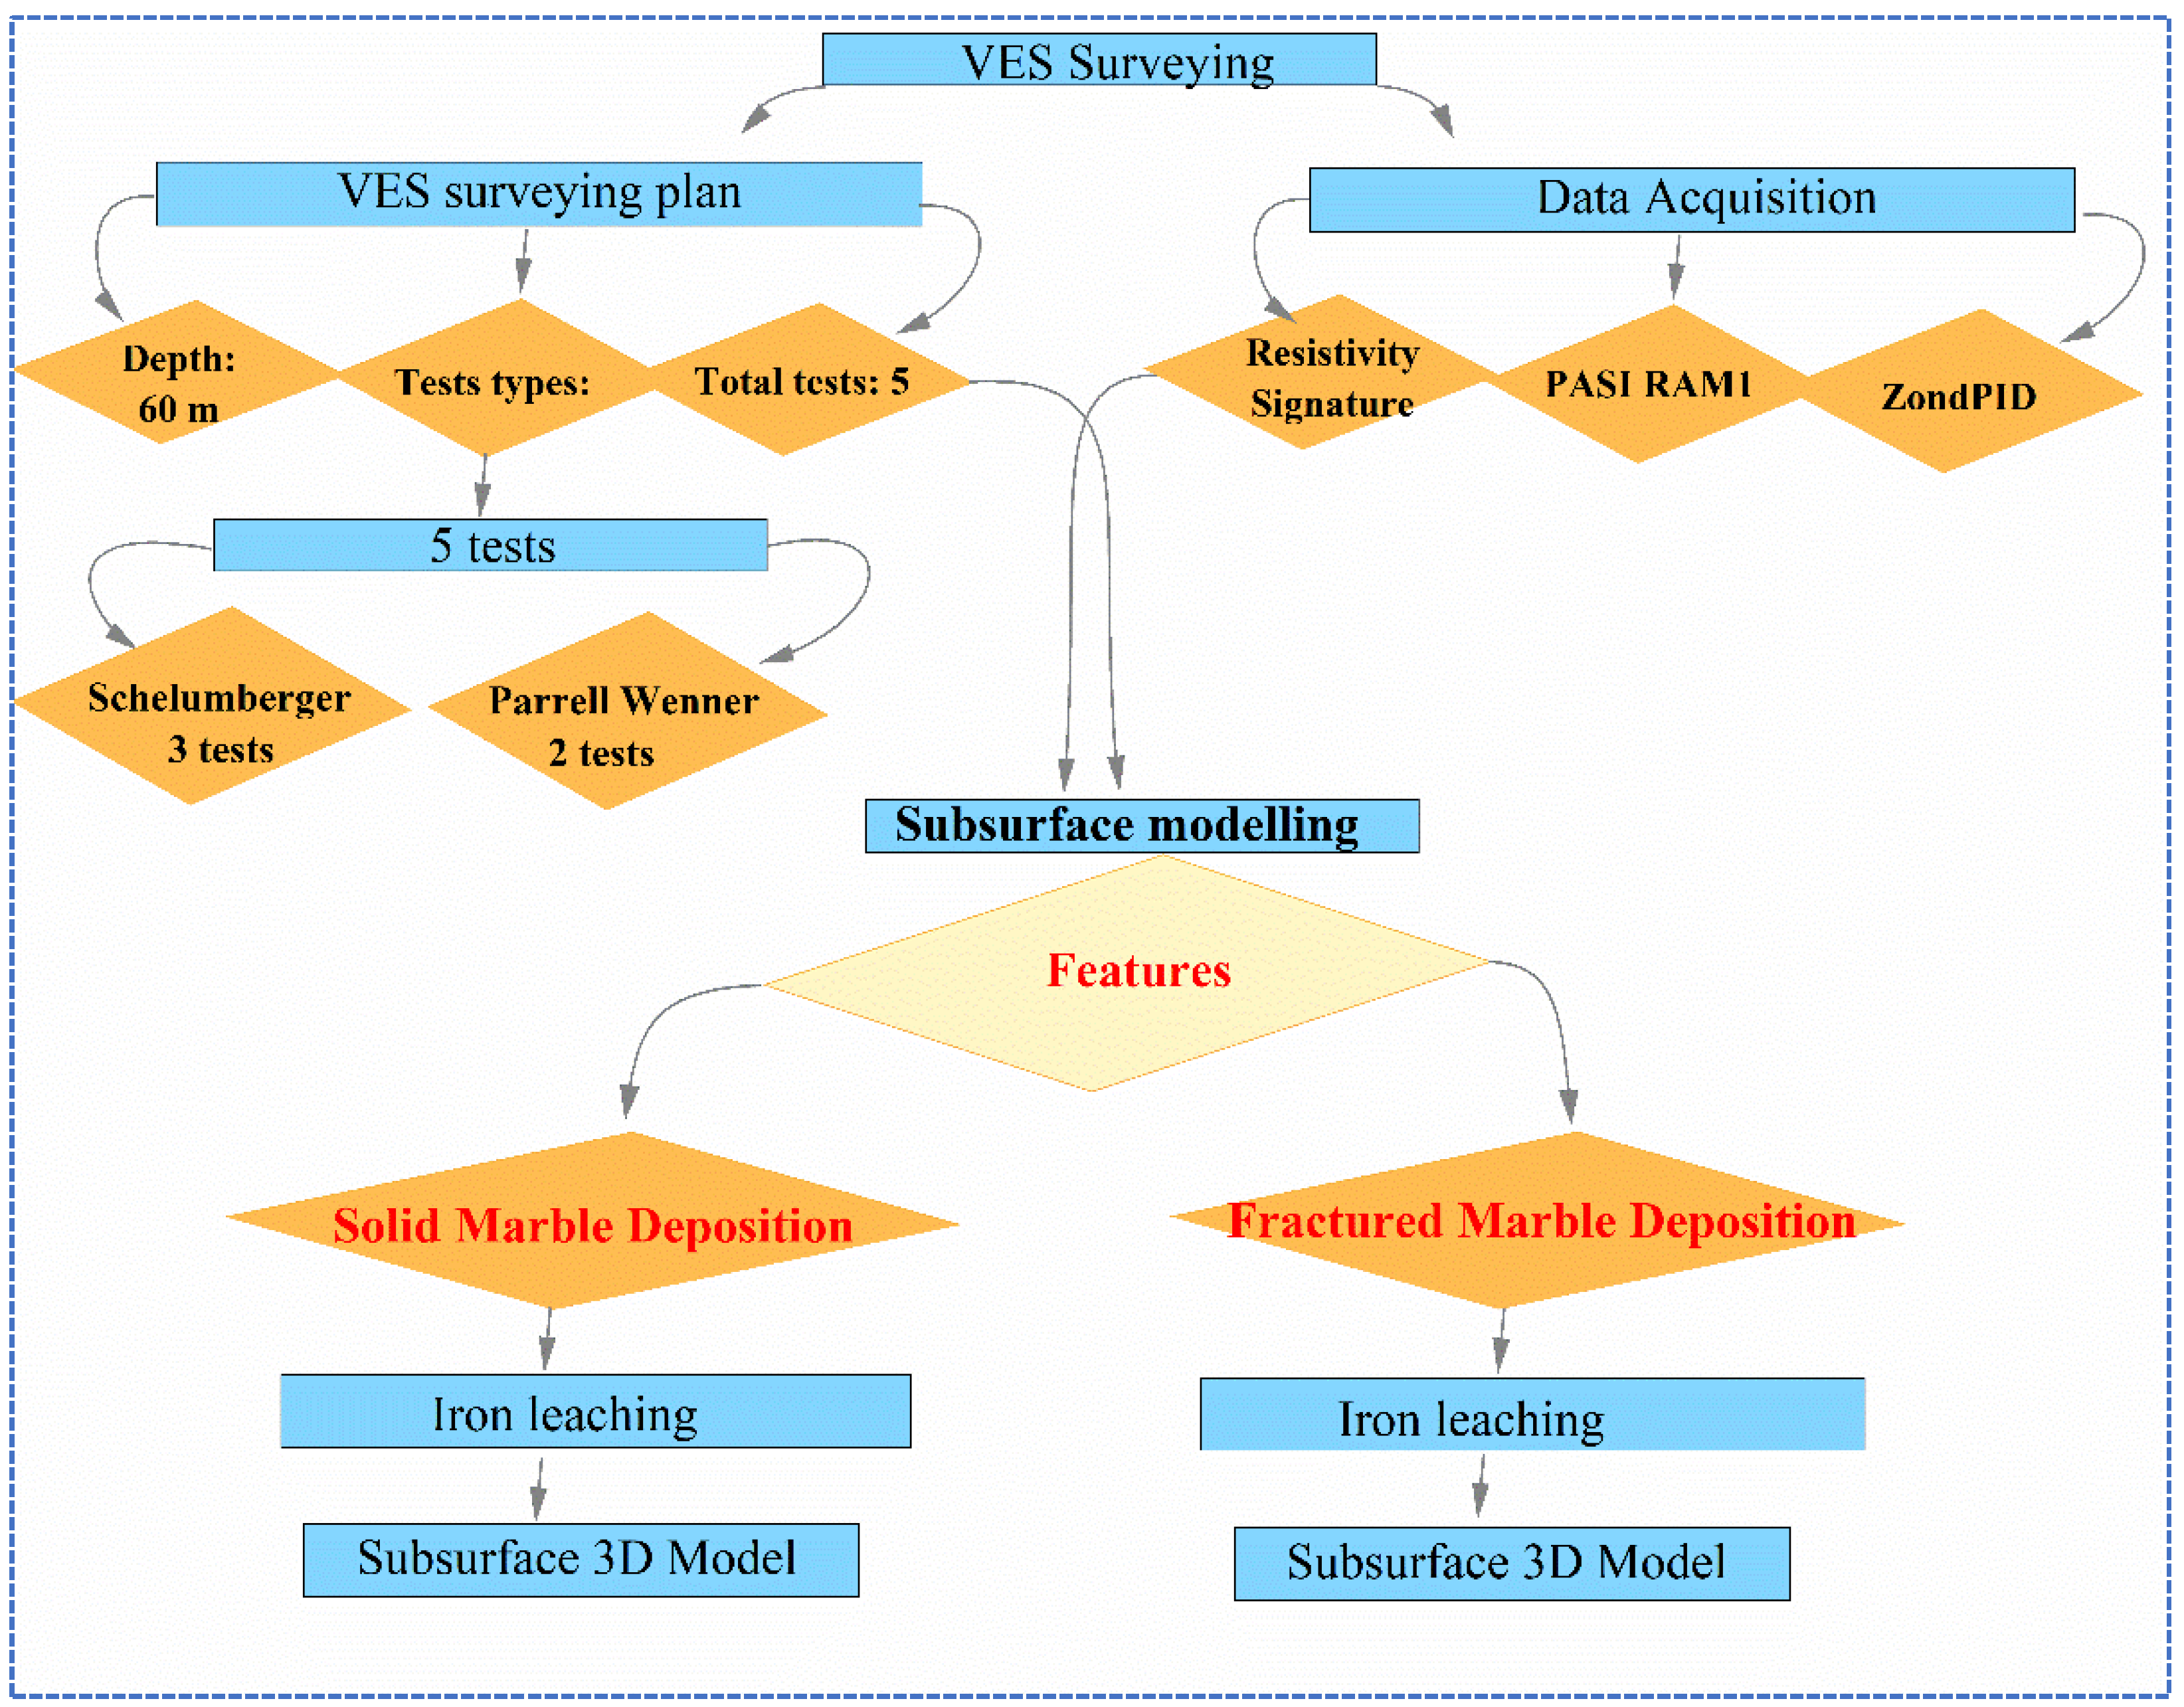
2.2.2. Vertical Electric Sounding (Data Acquisition and Interpretation)

The VES technique significantly enhances subsurface deposit modeling, supporting more sustainable and efficient dimensional stone quarrying [27]. VES facilitates decision-making and planning prior to extraction by providing a clear visualization of the deposit. This leads to more efficient, optimized, and economically viable quarry operations while promoting sustainability. In the geoelectrical resistivity survey, two electrodes are positioned on the surface of the ground at a specific distance from one another. These electrodes are used to inject current into the subsurface ground earth and to measure the potential difference, as shown in Figure 4.
Although the electrodes’ spacing is extended, the electrode array’s fixed center point allows for the recovery of data from deeper underground regions. When the current electrodes are positioned at their maximum separation, the electrical field penetrates deeper into the subsurface layers compared to when they are closer together. The resistance of the Earth can be calculated by measuring the potential difference within the induced electrical field between the two electrodes. The data from multiple VES lines are then integrated to create a subsurface 3D model, which highlights the quality and extent of the deposit. The workflow of subsurface 3D modeling is summarized in Figure 5.
The resistivity inversion process was conducted in a step-by-step manner to observe and define subsurface anomalies. The quality of the inverted resistivity models was first assessed by comparing the computed apparent resistivity values with the observed data, which had a low RMS error (<5%) and good visual fit. Finally, an uncertainty analysis was conducted through sensitivity tests, in which significant inversion parameters were changed to determine their influence on the final model.
During fieldwork in the research area, Schlumberger and Wenner array configurations were used to acquire resistivity signatures at a depth of 60 m vertically from the surface of the marble deposit. Consecutively, three Schlumberger (VES-1, VES-2, and VES-3) and two parallel Wenner (VES-4 and VES-5) arrays were configured to map the subsurface anomalies. The purpose of VES (1D resistivity survey) is to map the layers of solid marble deposition, fractured marble, and iron leaching within the research area. The locations of ERT survey points are shown in Figure 6.

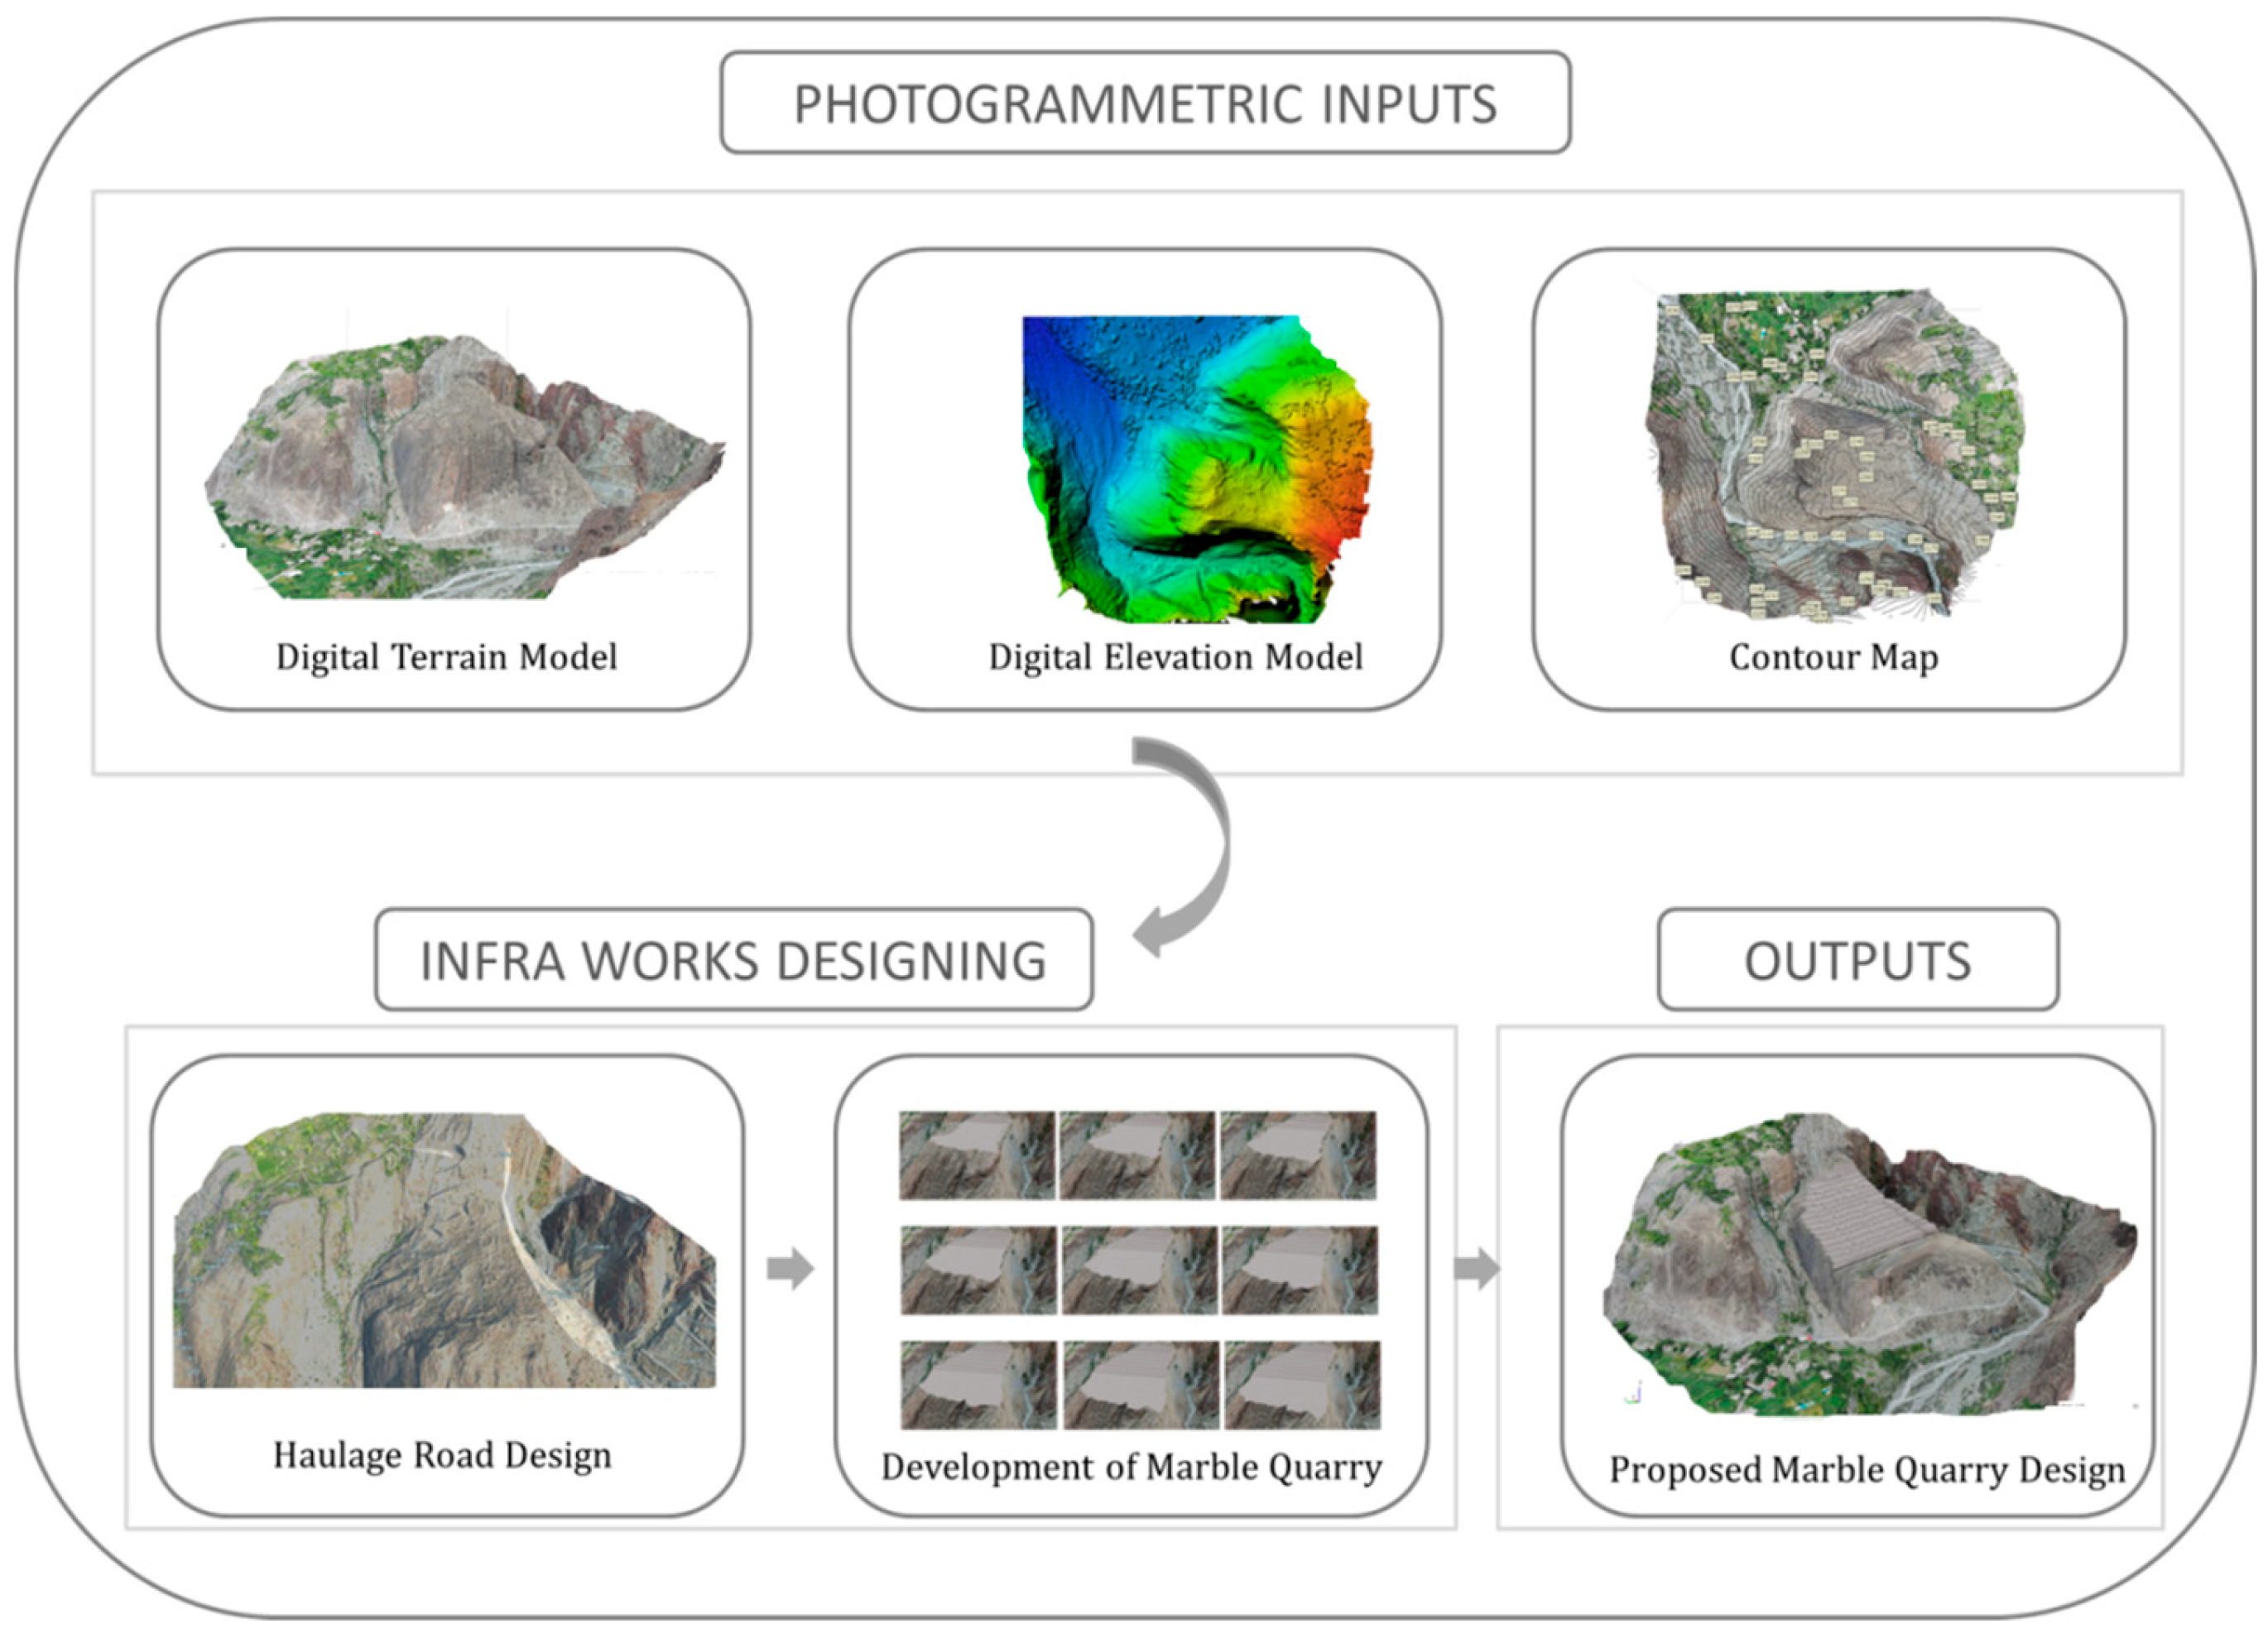
2.3. Quarry Design Processes

For the photo-realistic design of a quarry, the open-source 3D software Blender (3.1, 2022) and InfraWorks (2022) were used. Blender, a Python-based software, is capable of producing high-quality texture and rendering mapping for Building Information Modeling (BIM, 360, 2022) and 3D models. These models are widely used in urban planning, architecture, and construction [26]. The GBL- and DAE-format (3D) files exported from Agisoft Metashape were imported in InfraWorks 360 and Blender. The haulage road was designed in Infraworks (Figure 7) [28]. The 3D model corresponding to the subset projection on the faces from the source images is called UAV mapping. Due to the large number of meshes in the 3D model, the triangles were tied to the source images. Whenever it is not possible to edit due to the number of faces, the number of meshes is reduced to overcome this situation. This advanced editing tool was used to design benches from the top of the terrain in descending order with a bench height of 30 feet and a width of 50 feet.

3. Results and Discussion
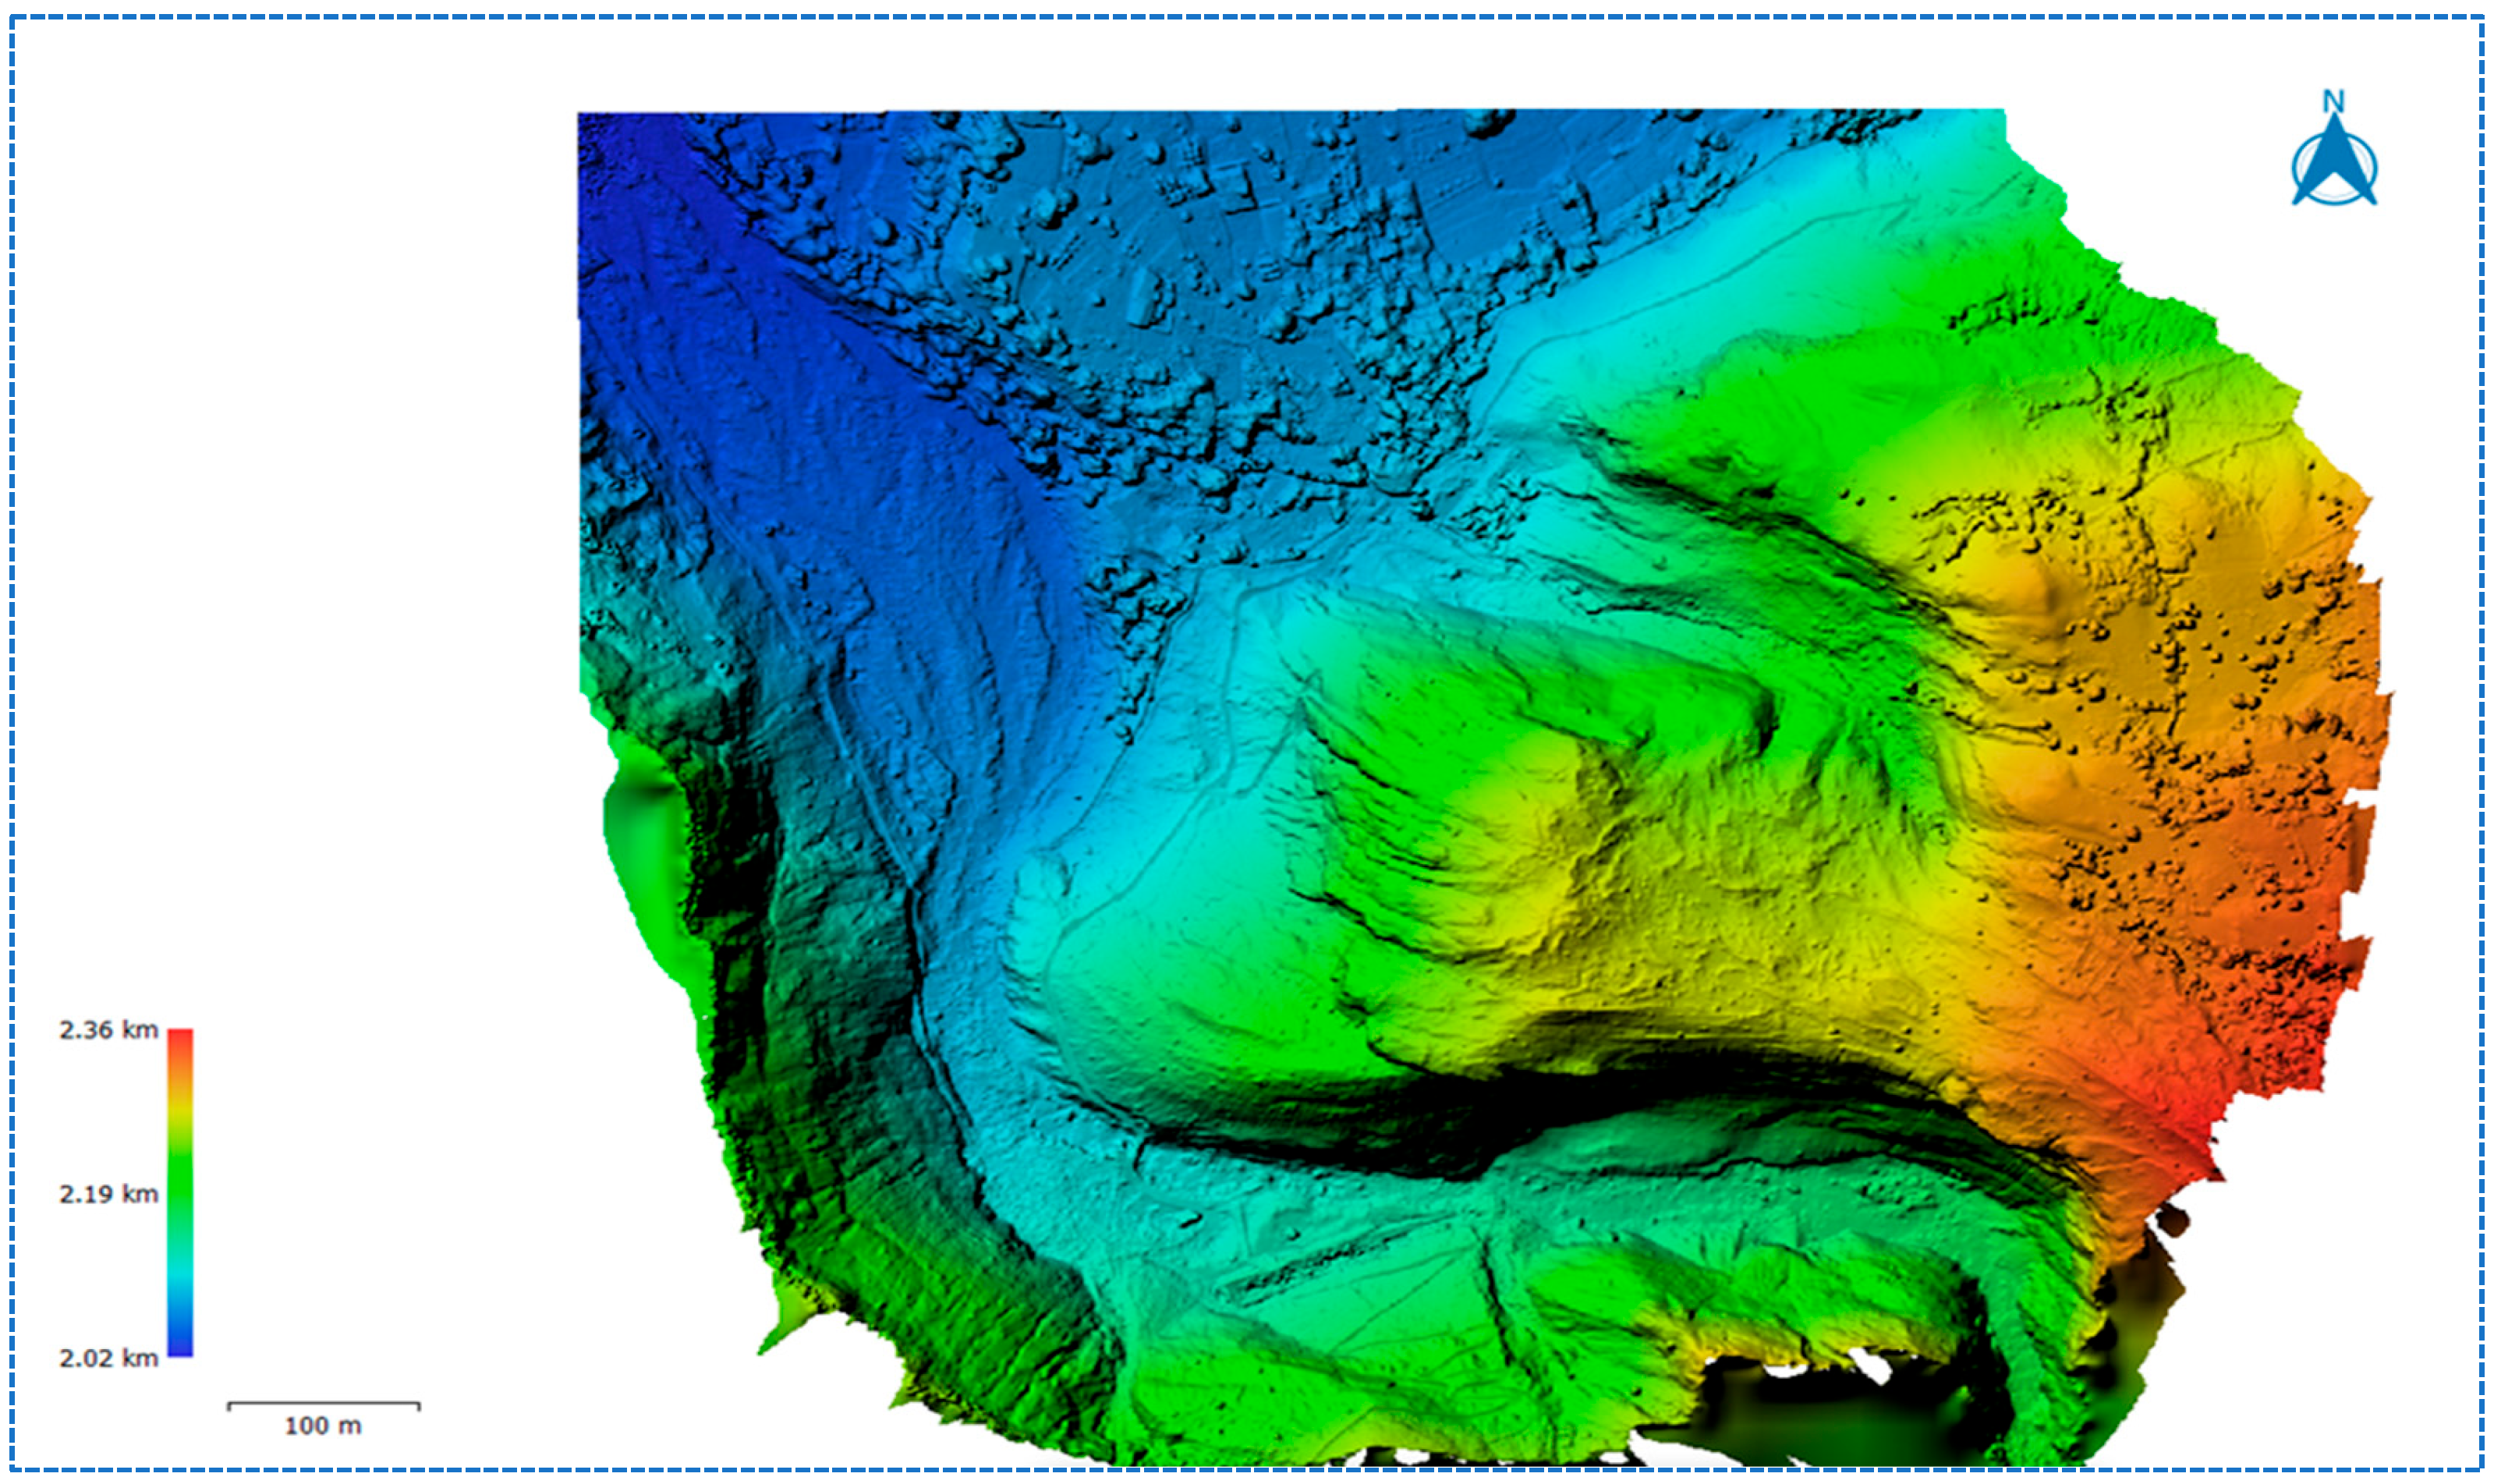
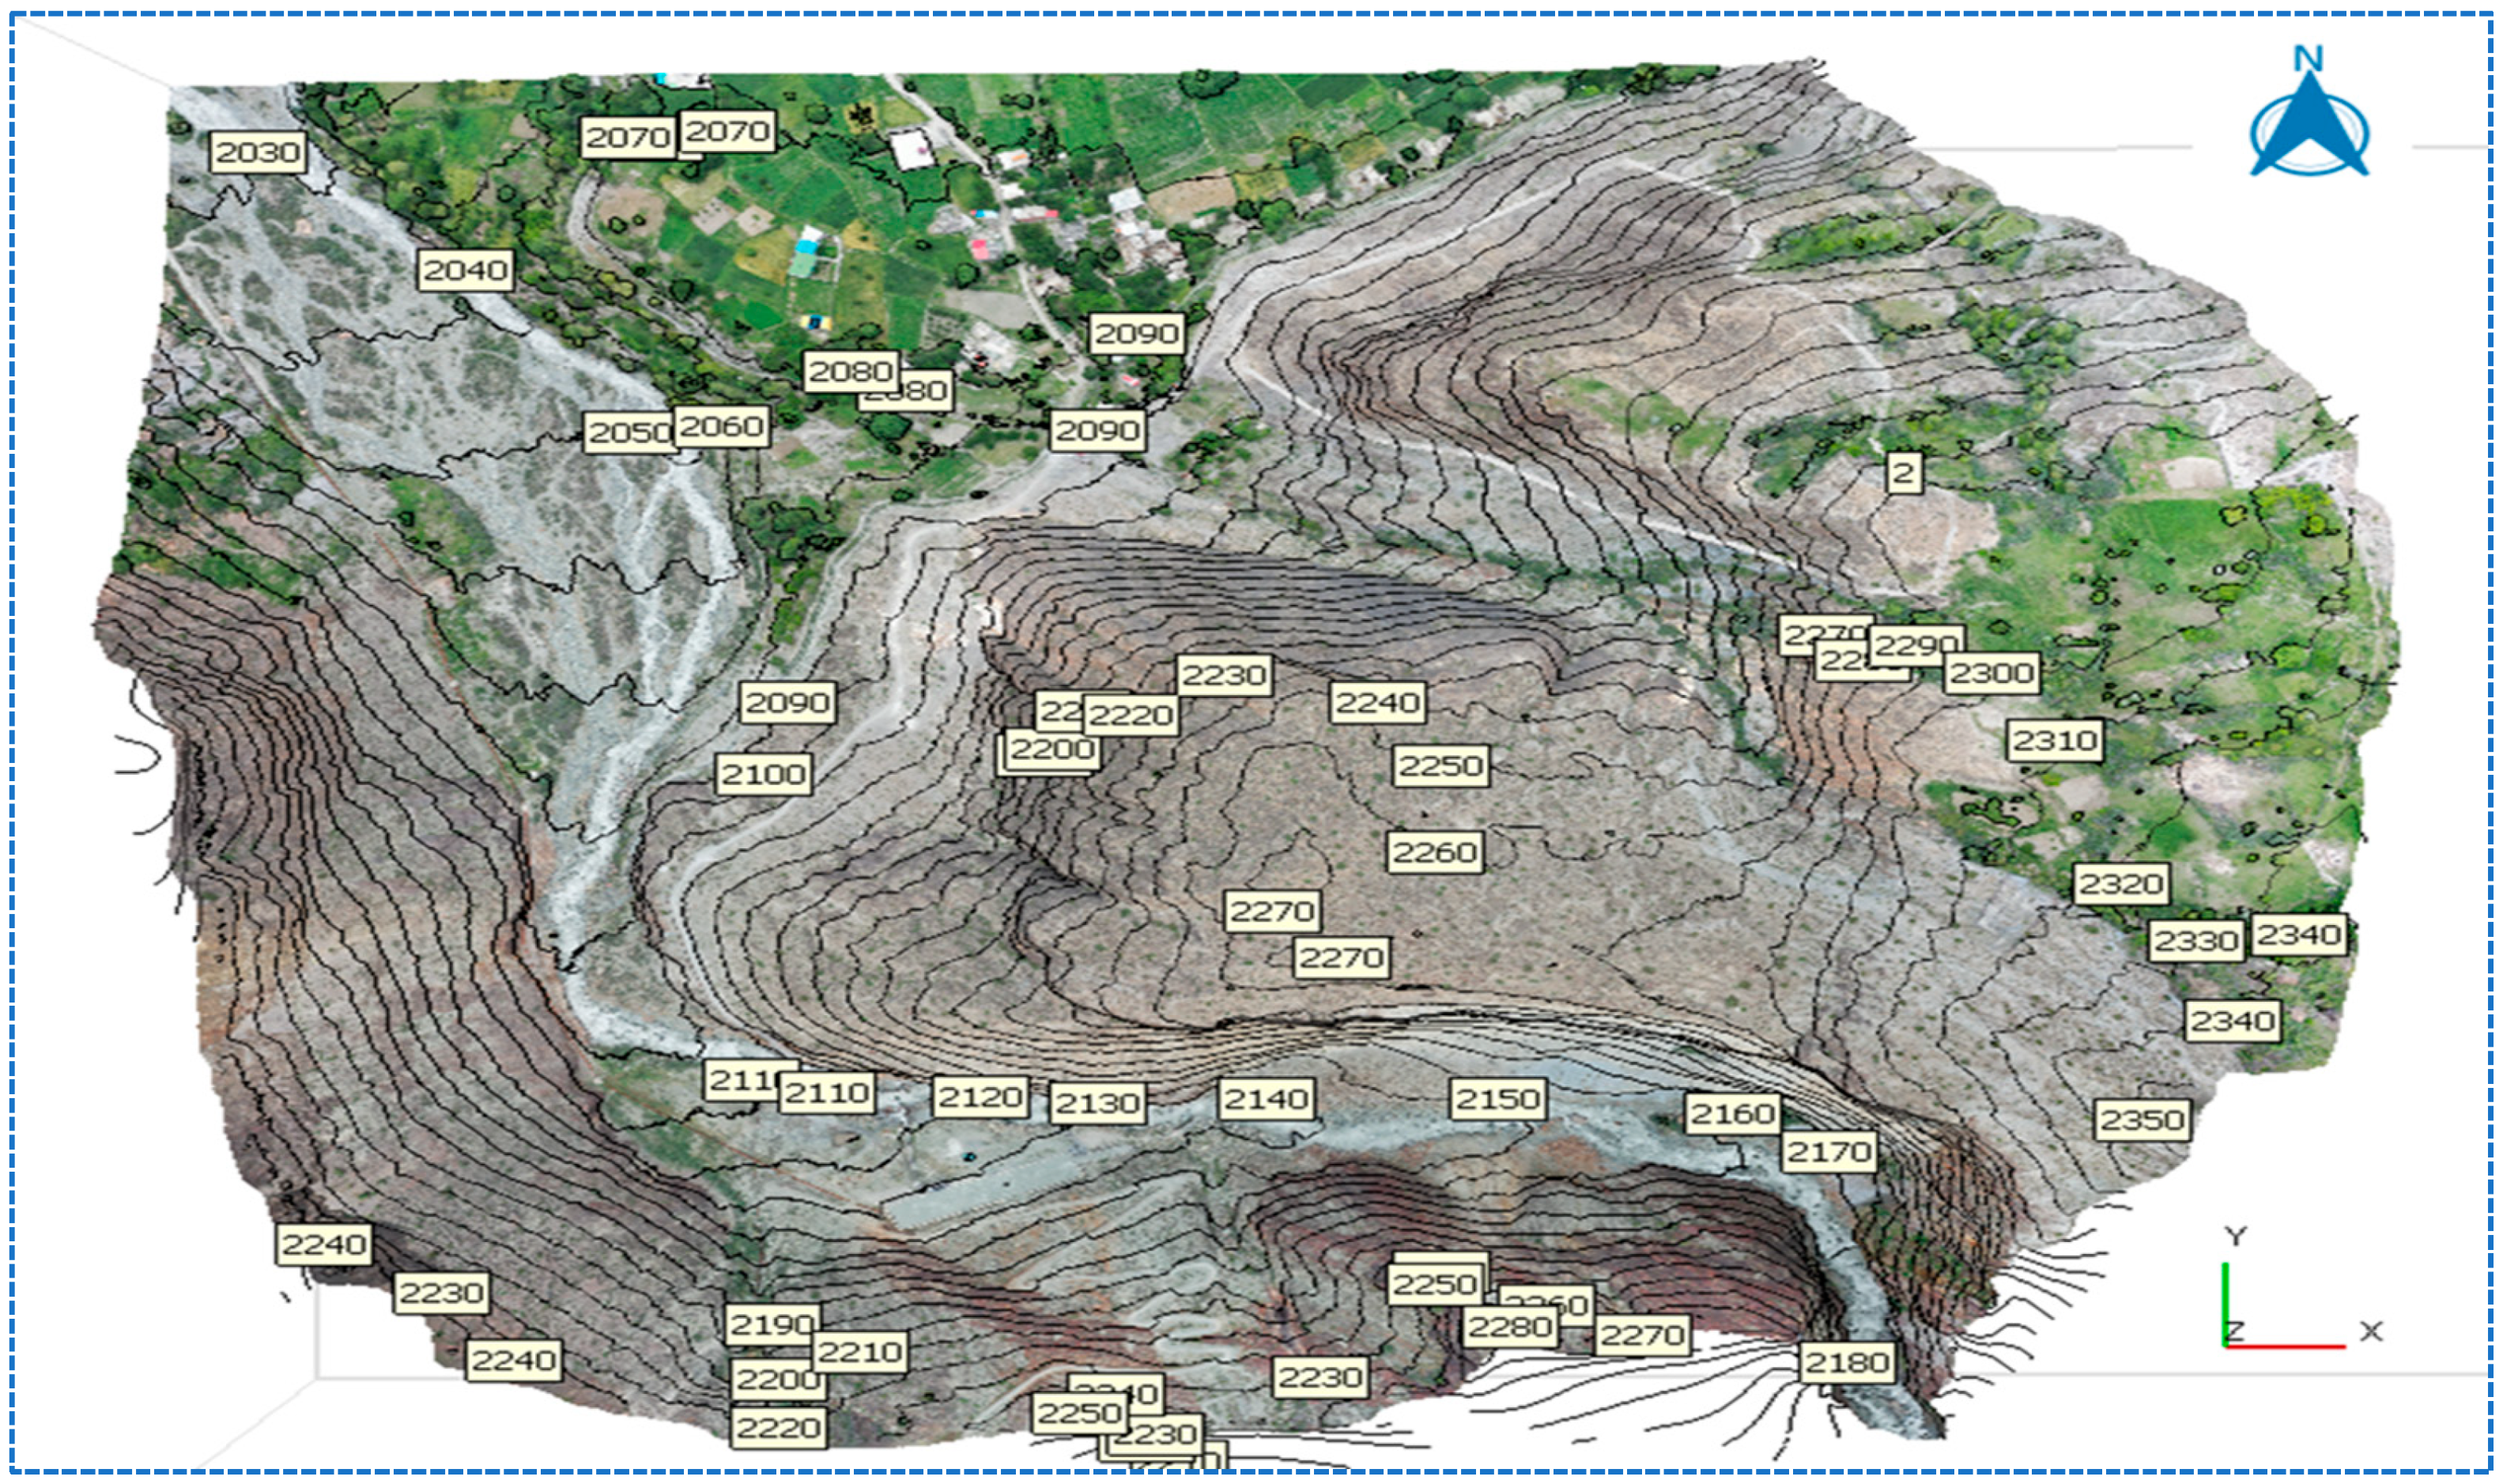
3.1. UAV Survey

Characterizing the initial components of the quarry design was the major goal of the modeling. The UAV survey generated high-resolution 3D models, including a Digital Terrain Model (DTM), a Digital Elevation Model (DEM), and contour maps, as shown in Figure 8, Figure 9 and Figure 10, respectively. These models virtually digitized the field area, integrating it into a virtual reality environment for detailed analysis and planning.
The DEM represents the bare ground topographic surface of the earth, with elevation data from sea level depicted using a color-scale ramp. The 3D models had an overall RMSE of 2.41905 cm, with horizontal (X, Y) and vertical (Z) errors of 1.02988 cm, 1.27674 cm, and 1.77698 cm, respectively. These error margins confirm the high precision of the photogrammetric models and ensure their suitability for detailed quarry design and planning. DTM, DEM, and contour mappings were used for designing and planning the haulage road, optimum benches, and calculation of reserve in the study area.

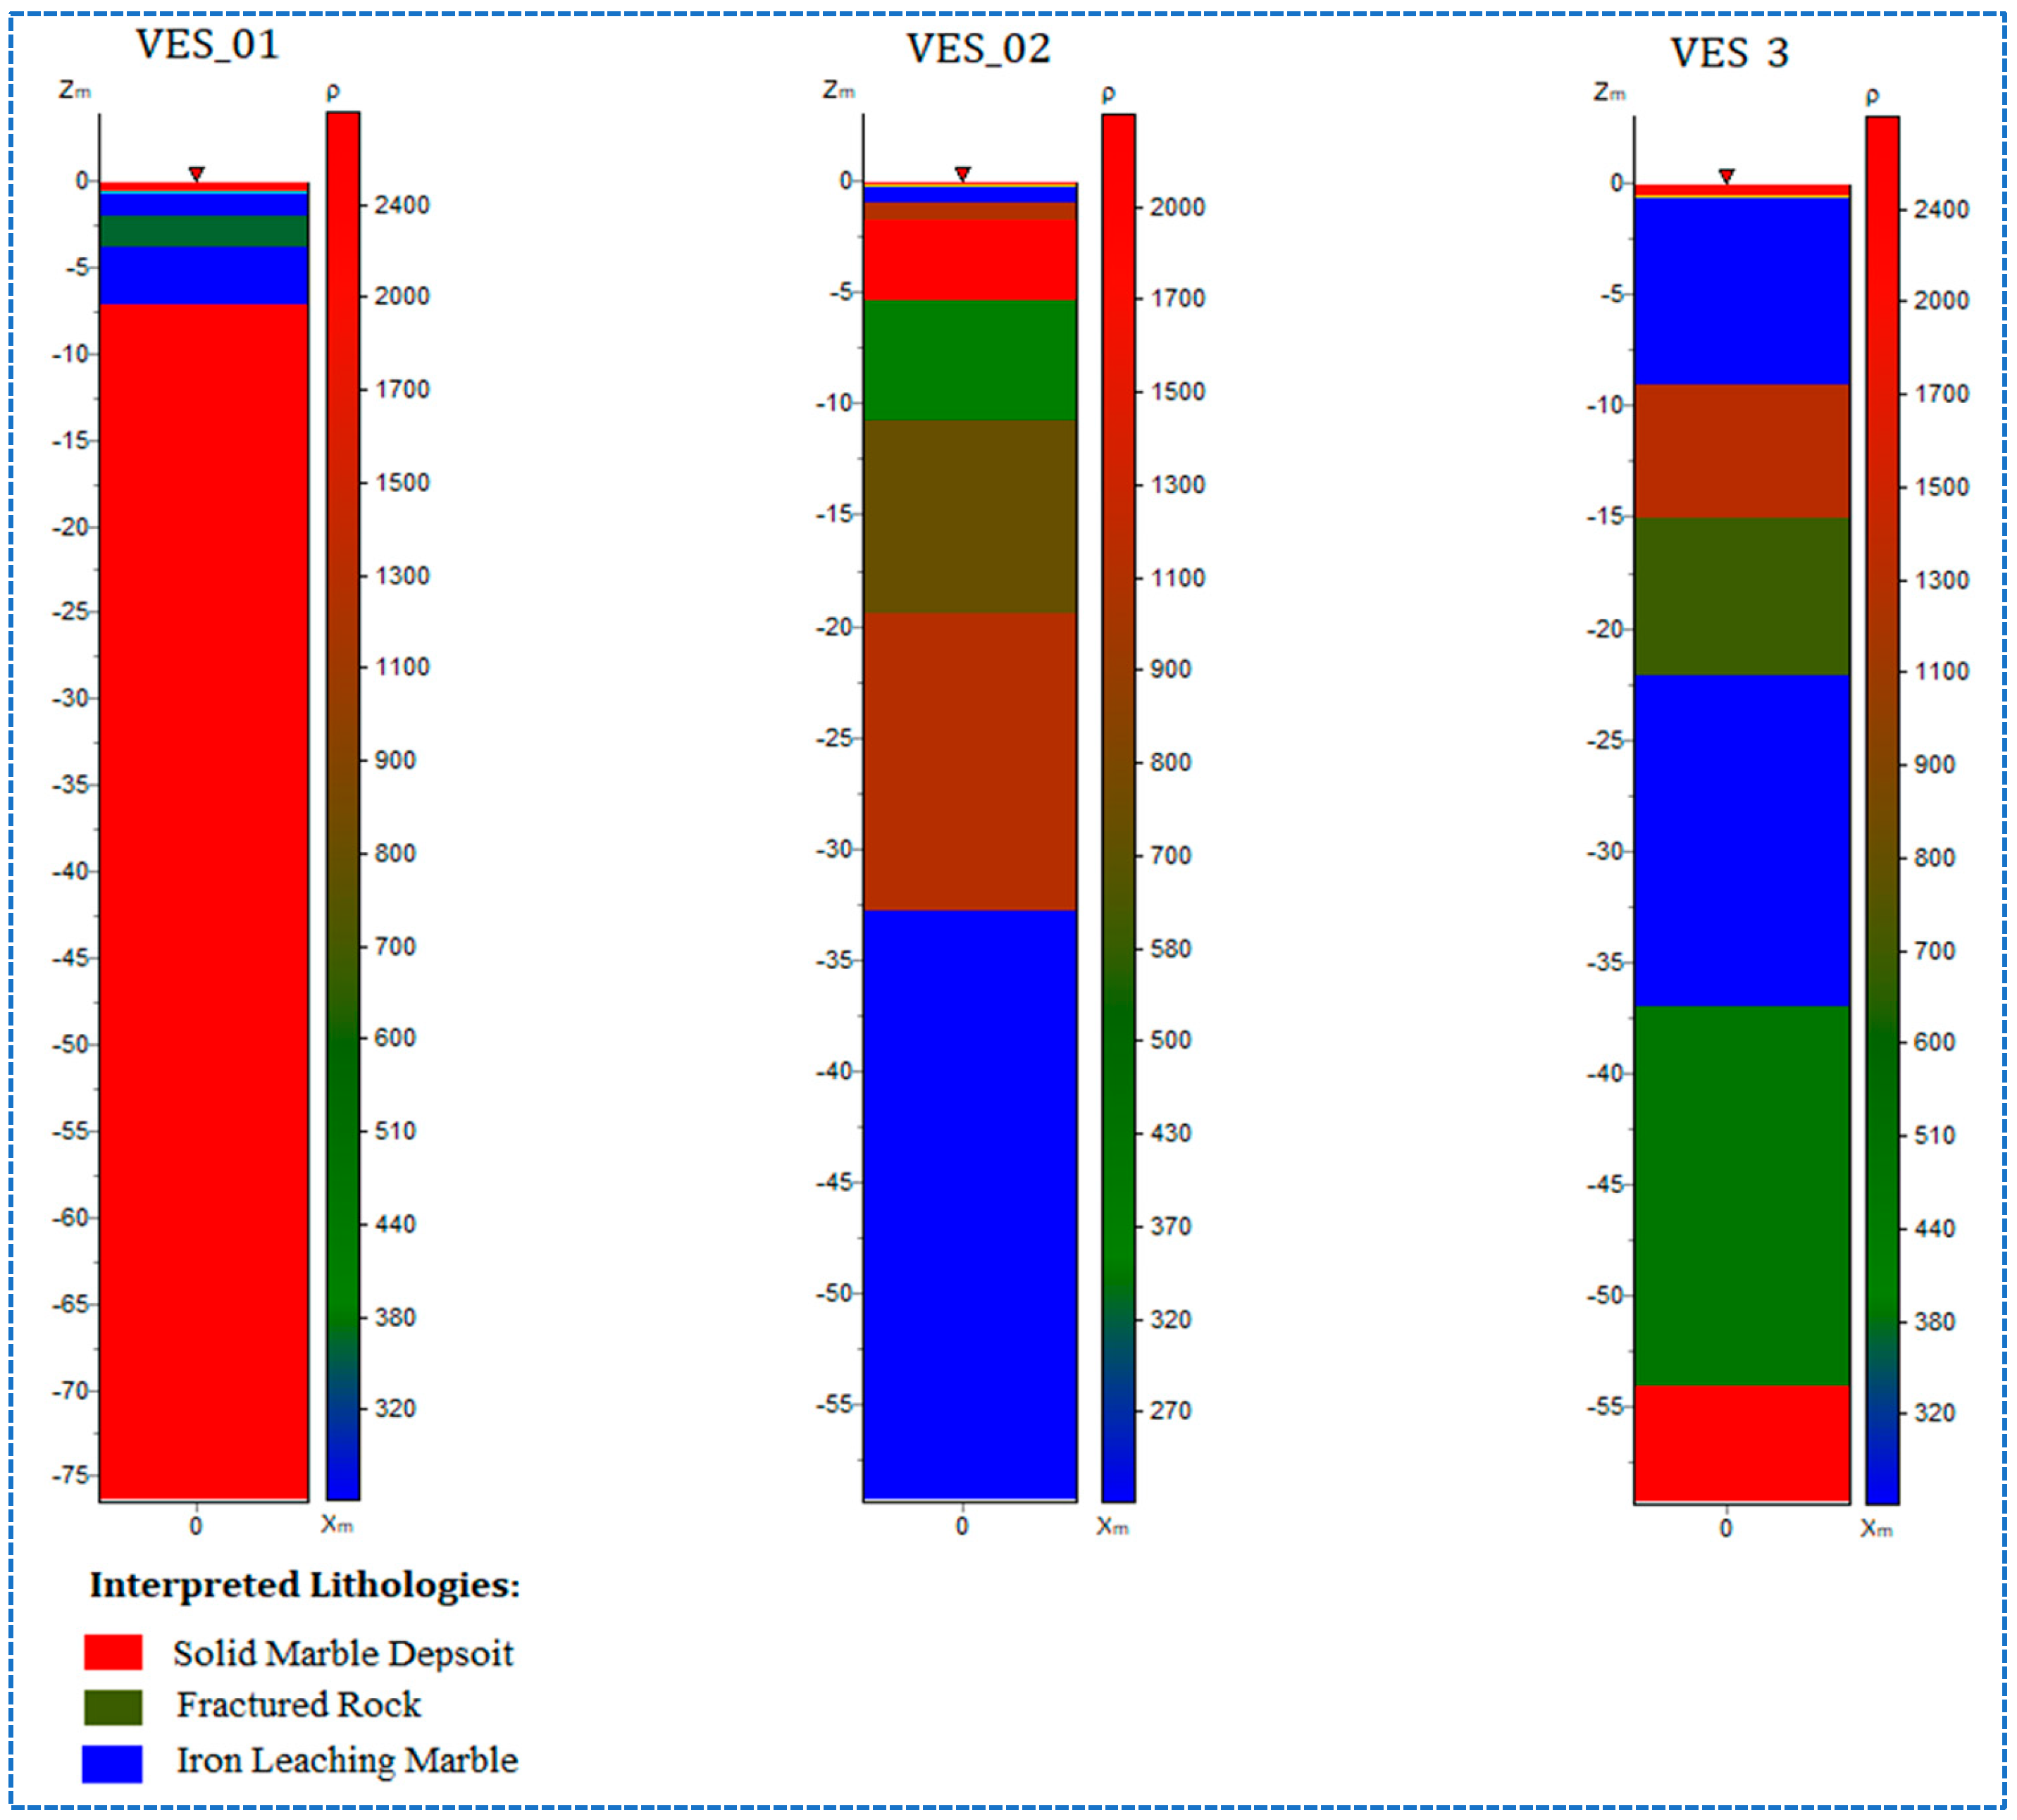
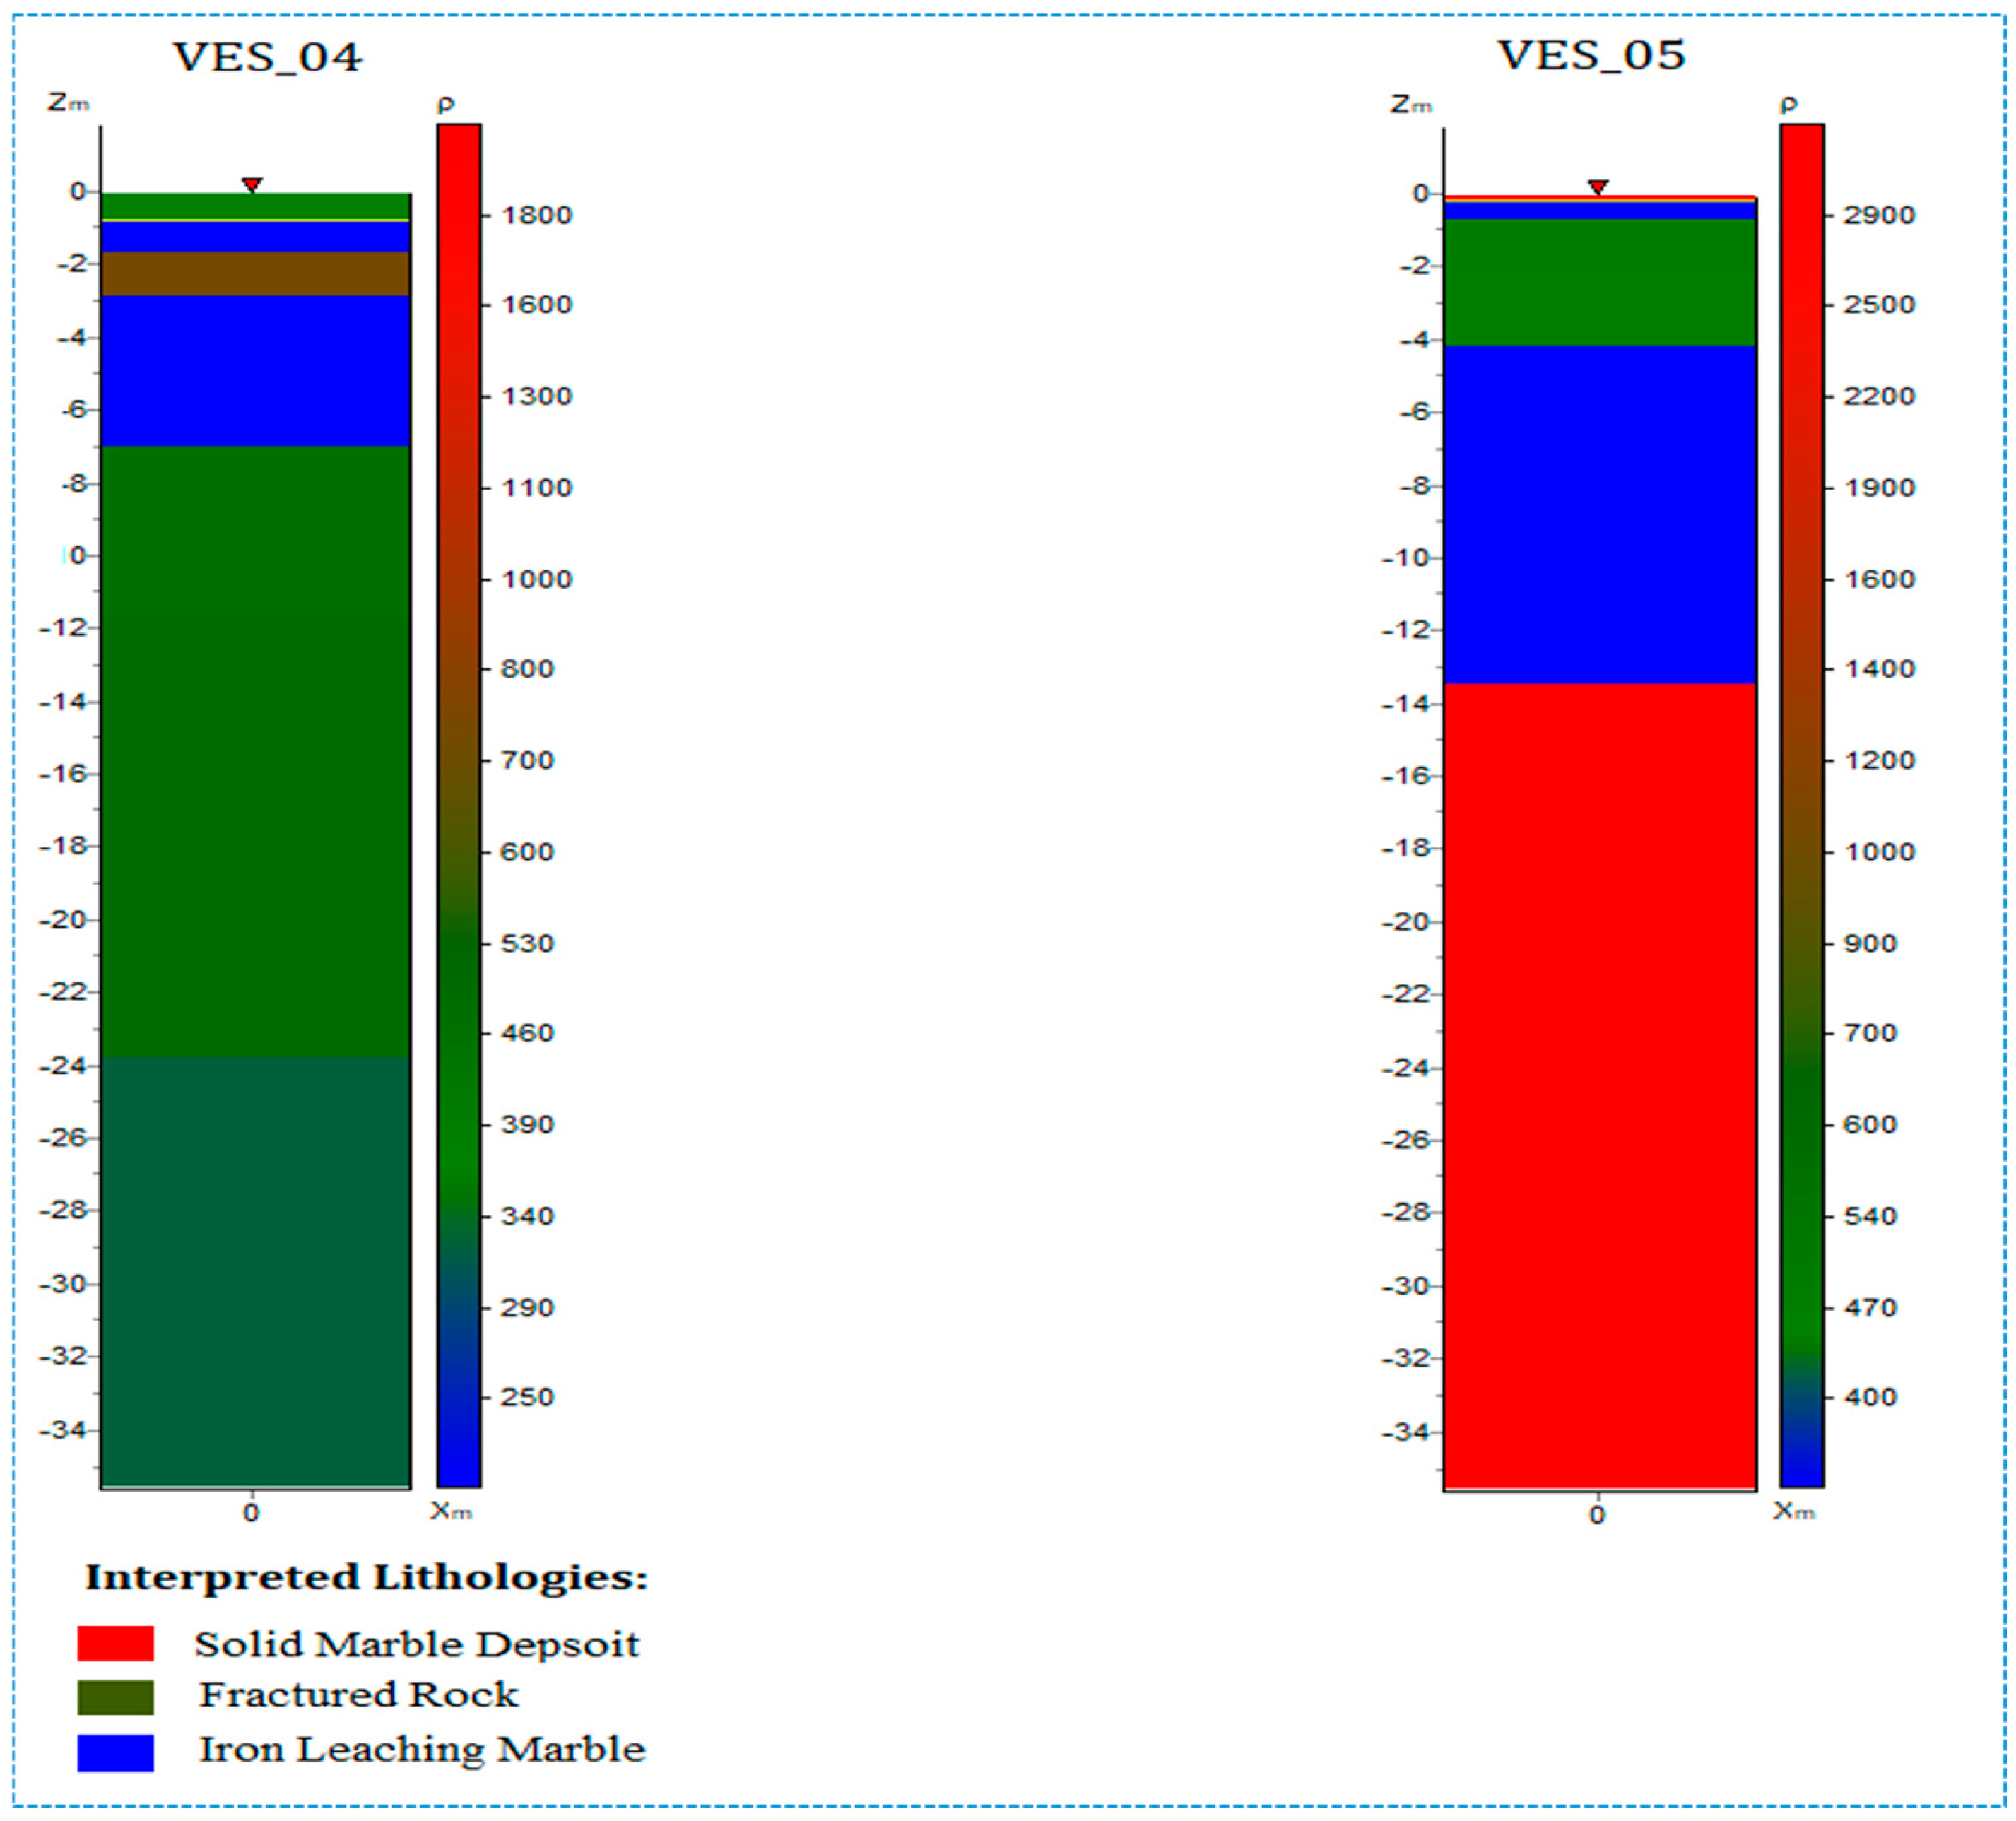
3.2. Electric Resistivity Sounding

The resistivity data was developed and interpreted into lithological columns, as shown in Figure 11 and Figure 12. The characterization of data was carried out based on resistivity values ranging between 100 and 3000 Ω·m, which were categorized into three lithological layers: solid marble deposits, fractured rock mass, and marble with iron leaching. A summary of the resistivity values and their corresponding interpretations, including the depth ranges for each VES profile, are provided in Table 2.
Since resistivity is inversely proportional to the degree of weathering and iron leaching, low-resistivity materials clearly indicate weathered rock, provided that there is no accumulation of clay or water in the region [29]. The higher resistivity values (>1000 Ω·m) suggest the existence of competent bedrock [30]. Metamorphic and igneous rocks typically have high resistivity values [31], and the resistivity of these rocks is mostly dependent on the percentage of the solid rock mass and the degree of fractures [32,33].
The VES_1, 2, and 3 Schlumberger array profiles have an interpreted depth of marble bedrock (having a resistivity value >1000 Ω·m) as 7–75 m, 12–33 m, and 8–15 m, respectively. As stated in the literature [33], the resistivity value of marble varies from 102 ohm/m to 2.5 × 10⁸ ohm/m. A resistivity value within the range (350 Ω·m to 1000 Ω·m) indicates that the fractured rock mass has a thickness of 2–3 m, 6–12 m, and 36–54 m. The moderate resistivity of these rocks is mainly dependent on the degree of fracturing, as fractures are commonly filled with clay. Clay, which conducts electric current, has significantly lower resistivity, leading to reduced resistivity values [32]. A resistivity value < 350 Ω·m suggests that marble contains iron leaching within 4–8 m, 33–60 m and 22–36 m, as shown in Figure 11 and Figure 12. However, the low resistivity recorded in the column is due to the accumulation of iron content in marble, which leads to an increase in conductivity; as a result, the resistivity will be low [34].
However, the VES_04 and 05 Wenner array profiles have an interpreted depth of marble bedrock (having a resistivity value >1000 Ω·m) from 13 to 35 m, as confirmed in VES_05 only. The resistivity value within the range (350 Ω·m to 1000 Ω·m) shows the fractured rock mass having a thickness of 7–35 m and 1–4 m, and the resistivity value < 350 Ω·m represented as marble contains iron leaching within 3–7 m and 4–14 m, as shown in Figure 12. After interpretation, the results show that there is an accumulation of marble deposits with fractures and leaching of iron due to the impact of the regional geology.

3.3. Total Quarry Design Concept

The total quarry design concept integrates safety and operational efficiency to ensure safe extraction while maximizing reserves and profitability. The following technical parameters were considered while designing the quarry.

3.3.1. Haulage Road Geometry

The optimum location for the haulage road was selected based on the DTM obtained from the UAV survey. The existing road was extended to the top of the quarry by considering the geometric parameters, as shown in Figure 13. The designed road had a grading limit of 7 m in width, a length of 640 m, and a grade range of 4.47% to 6.8%, as shown in Figure 14. Many factors influence haul road geometry, including maximum grade, cross slopes of the road, running width, and so on [35]. The haul road gradient was limited to a maximum of 10%, but generally gradients greater than 8% were avoided [36]. The maximum curve super-elevation was generally limited to 4%, and speed limits were imposed on tighter curves to reduce the required super-elevation [37]. The maximum road cross slope varied widely from mine to mine (1.5% to 4%) depending on precipitation and rock type; however, most mines considered a 4% cross slope to be optimal [38].

3.3.2. Development of a Quarry

The face angle was maintained at 90° due to the hard rock formation, minimizing the risk of slope failure [39]. This design also facilitates efficient marble extraction. The bench width was set at 50 feet to ensure safe operation of the executor and wire saw, whereas the bench height was designed at 30 ft to accommodate the extraction of 1 × 1 m blocks, as shown in Figure 14.
The economical bench height and width determination may vary with the types of equipment and machinery used, topography, operation plans, environmental conditions, and so on [40]. Moreover, bench width and height are closely related to the unit cost of the product [41]. To maintain the cost at an optimum level, determining an economical bench height and width must be based on individual economic assessments of quarrying [42]. To maximize production, the bench width and height should be kept optimum to increase the recovery of blocks. However, it varies from site to site [43].

3.4. Cost–Benefit Anlysis

The proposed method, which integrates UAV photogrammetry and ERT, offers significant advantages over traditional surveying techniques, in terms of cost and time efficiency. UAV surveys require minimal equipment and personnel (1–2 operators), thereby reducing labor and equipment costs. In contrast, traditional methods such as ground-based total station surveys require larger teams and more time, leading to higher operational expenses. For example, a UAV survey of the Minapin marble deposit was completed in 80 min, whereas traditional methods can take days or weeks to complete.
This method also improves the time efficiency. UAVs capture high-resolution images of large areas quickly, whereas ERT surveys can be completed in a single day. This rapid data collection is particularly beneficial for remote and challenging terrain. Additionally, the proposed method enhances safety by eliminating the need for personnel to access hazardous areas, thereby reducing the accident risk.
However, this method has several limitations. UAV surveys depend on favorable environmental conditions (e.g., weather and lighting), whereas ERT surveys can be affected by soil moisture, which may influence resistivity measurements. This method also relies on specialized software which requires technical expertise and computational resources. Data processing time can be significant, especially for large datasets, and integrating surface and subsurface models may require additional validation.

4. Conclusions

This study demonstrated the successful integration of unmanned aerial vehicles (UAVs) and vertical electric sounding (VES) for comprehensive surface and subsurface modeling of marble deposits in the Minapin Valley, Pakistan. The key findings and contributions of this research are as follows:
(1)
The synergistic use of UAVs and ERT offers a cost-effective, efficient, and non-destructive alternative to traditional surveying techniques. This integrated approach is particularly advantageous in challenging terrains, where conventional methods are often impractical or labor-intensive.
(2)
By accurately mapping subsurface anomalies such as solid rock, fractured zones, and areas of iron leaching, this approach minimizes material waste during extraction. The optimized quarry design, with bench heights of 30 feet and widths of 50 feet, ensures efficient resource recovery and reduces environmental impact. This promotes sustainable quarrying practices by maximizing resource utilization and minimizing unnecessary excavation.
(3)
While this study focuses on marble deposits, the proposed methodology can be extended to other dimensional stones (e.g., granite, limestone) and mineral resources in different geological settings. Future research should explore the applicability of this approach in diverse environments, such as sedimentary or igneous terrains, to evaluate its effectiveness across a wider range of geological conditions.
(4)
Future research should also investigate the integration of advanced machine learning algorithms for enhanced data interpretation and predictive modeling, which could further improve the accuracy and efficiency of deposit characterization. Additionally, the use of UAVs and ERT could be expanded to monitor post-extraction land rehabilitation, contributing to sustainable mining practices by ensuring effective land restoration and minimizing environmental impact.

Author Contributions

Methodology, H.u.D.H., Z.Y., J.F., S.Z. (Siqi Zhang), S.Z. (Sitao Zhu) and W.N.; software, Z.H. and H.u.D.H.; formal analysis, Z.Y. and S.Z. (Siqi Zhang); investigation, Z.H.; resources, S.Z. (Sitao Zhu); data curation, S.Z. (Sitao Zhu); writing—original draft, Z.H.; writing—review and editing, J.L., S.Z. (Siqi Zhang) and M.H.; supervision, J.L., J.F., W.N. and M.H.; project administration, J.L., W.N. and M.H.; funding acquisition, J.L. All authors have read and agreed to the published version of the manuscript.

Funding

This work was supported by the National Key R&D Program of China (2023YFC3805103), the Natural Science Foundation of China (52374076), the Young Elite Scientists Sponsorship Program by CAST (2021QNRC001), Hebei Provincial Key Research Projects (22373706D), Fundamental Research Funds for the Central Universities and the Youth Teacher International Exchange & Growth Program (QNXM20230011) and 111 Project (B20041).

Data Availability Statement

The authors confirm that the supporting data related to the findings of this research are available within this paper.

Conflicts of Interest

The authors declare no conflict of interest.

References

  1. Zhou, S. Platforming for industrialized building: A comparative case study of digitally-enabled product platforms. Build. Res. Inf. 2023, 52, 4–18. [Google Scholar] [CrossRef]
  2. Vagnon, F.; Dino, G.A.; Umili, G.; Cardu, M.; Ferrero, A.M. New developments for the sustainable exploitation of ornamental stone in carrara basin. Sustainability 2020, 12, 9374. [Google Scholar] [CrossRef]
  3. Siegesmund, S.; Török, Á. Building stones. In Stone in Architecture: Properties, Durability; Springer: Berlin/Heidelberg, Germany, 2010; pp. 11–95. [Google Scholar]
  4. Sun, T.; Chen, F.; Zhong, L.; Liu, W.; Wang, Y. GIS-based mineral prospectivity mapping using machine learning methods: A case study from Tongling ore district, eastern China. Ore Geol. Rev. 2019, 109, 26–49. [Google Scholar] [CrossRef]
  5. Junaid, M.; Abdullah, R.A.; Sa’ari, R.; Ali, W.; Islam, A.; Sari, M. 3D Modelling and Feasibility Assessment of Granite Deposit using 2D Electrical Resistivity Tomography, Borehole, and Unmanned Aerial Vehicle Survey. J. Min. Environ. 2022, 13, 929–942. [Google Scholar]
  6. Junaid, M.; Abdullah, R.A.; Sa’ari, R.; Ali, W.; Rehman, H.; Alel, M.N.A.; Ghani, U. 2D Electrical Resistivity Tomography an advance and expeditious exploration technique for current challenges to mineral industry. J. Himal. Earth Sci. 2021, 54, 11–22. [Google Scholar]
  7. Scheidt, C.; Li, L.; Caers, J. Quantifying Uncertainty in Subsurface Systems; Wiley: Hoboken, NJ, USA, 2018; ISBN 9780875900056. [Google Scholar]
  8. Mishra, V.; Prakash, S.; Sharma, A.; Nautiyal, D.; Thakur, A.; Sharma, R.S. Limestone Mining in the Himalayas: Advancing Adaptive Governance for Ecological and Socioeconomic Resilience. In The Himalayas in the Anthropocene: Environment and Development; Springer: Cham, Switzerland, 2024; pp. 185–201. [Google Scholar]
  9. Wang, S.; Bai, Z.; Lv, Y.; Zhou, W. Monitoring Extractive Activity-Induced Surface Subsidence in Highland and Alpine Opencast Coal Mining Areas with Multi-Source Data. Remote Sens. 2022, 14, 3442. [Google Scholar] [CrossRef]
  10. Junaid, M.; Abdullah, R.A.; Abdelrahman, K.; Ullah, A.; Mahmood, S.; Sa’Ari, R.; Islam, A. Assigning Resistivity Values To Rock Quality Designation Indices Using Integrated Unmanned Aerial Vehicle and 2D Electrical Resistivity Tomography in Granitic Rock. Geocarto Int. 2024, 39. [Google Scholar] [CrossRef]
  11. Dandois, J.P.; Olano, M.; Ellis, E.C. Optimal Altitude, Overlap, and Weather Conditions for Computer Vision UAV Estimates of Forest Structure. Remote Sens. 2015, 7, 13895–13920. [Google Scholar] [CrossRef]
  12. Guisado-Pintado, E.; Jackson, D.W.T.; Rogers, D. 3D mapping efficacy of a drone and terrestrial laser scanner over a temperate beach-dune zone. Geomorphology 2019, 328, 157–172. [Google Scholar] [CrossRef]
  13. Mesas-Carrascosa, F.-J.; de Castro, A.I.; Torres-Sánchez, J.; Triviño-Tarradas, P.; Jiménez-Brenes, F.M.; García-Ferrer, A.; López-Granados, F. Classification of 3D point clouds using color vegetation indices for precision viticulture and digitizing applications. Remote Sens. 2020, 12, 317. [Google Scholar] [CrossRef]
  14. Hugenholtz, C.; Brown, O.; Walker, J.; Barchyn, T.E.; Nesbit, P.; Kucharczyk, M.; Myshak, S. Spatial accuracy of UAV-derived orthoimagery and topography: Comparing photogrammetric models processed with direct geo-referencing and ground control points. Geomatica 2016, 70, 21–30. [Google Scholar] [CrossRef]
  15. Zietara, A.M. Creating Digital Elevation Model (DEM) Based on Ground Points Extracted from Classified Aerial Images Obtained from Unmanned Aerial Vehicle (UAV). Master’s Thesis, Norwegian University of Science and Technology, Trondheim, Norway, 2017. [Google Scholar]
  16. Chaudhry, M.H.; Ahmad, A.; Gulzar, Q.; Farid, M.S.; Shahabi, H.; Al-Ansari, N. Assessment of DSM based on radiometric transformation of UAV data. Sensors 2021, 21, 1649. [Google Scholar] [CrossRef] [PubMed]
  17. Bharti, A.K.; Singh, K.K.K.; Ghosh, C.N.; Mishra, K. Detection of subsurface cavity due to old mine workings using electrical resistivity tomography: A case study. J. Earth Syst. Sci. 2022, 131, 39. [Google Scholar] [CrossRef]
  18. Falae, P.O.; Kanungo, D.P.; Chauhan, P.K.S.; Dash, R.K. Electrical resistivity tomography (ERT) based subsurface characterisation of Pakhi Landslide, Garhwal Himalayas, India. Environ. Earth Sci. 2019, 78, 430. [Google Scholar] [CrossRef]
  19. Briški, M.; Stroj, A.; Kosović, I.; Borović, S. Characterization of aquifers in metamorphic rocks by combined use of electrical resistivity tomography and monitoring of spring hydrodynamics. Geosciences 2020, 10, 137. [Google Scholar] [CrossRef]
  20. Searle, M.P.; Khan, M.A.; Fraser, J.E.; Gough, S.J.; Jan, M.Q. The tectonic evolution of the Kohistan-Karakoram collision belt along the Karakoram Highway transect, north Pakistan. Tectonics 1999, 18, 929–949. [Google Scholar]
  21. Bustillo Revuelta, M. Dimension Stone. In Construction Materials: Geology, Production and Applications; Springer International Publishing: Cham, Switzerland, 2021; pp. 55–90. [Google Scholar] [CrossRef]
  22. Selonen, O.; Luodes, H.; Ehlers, C. Exploration for dimensional stone—Implications and examples from the Precambrian of southern Finland. Eng. Geol. 2000, 56, 275–291. [Google Scholar] [CrossRef]
  23. Jiang, S.; Jiang, C.; Jiang, W. Efficient structure from motion for large-scale UAV images: A review and a comparison of SfM tools. ISPRS J. Photogramm. Remote Sens. 2020, 167, 230–251. [Google Scholar] [CrossRef]
  24. Eltner, A.; Sofia, G. Structure from motion photogrammetric technique. Dev. Earth Surf. Process. 2020, 23, 1–24. [Google Scholar]
  25. Török, Á.; Bögöly, G.; Somogyi, Á.; Lovas, T. Application of UAV in Topographic Modelling and Structural Geological Mapping of Quarries and Their Surroundings—Delineation of Fault-Bordered Raw Material Reserves. Sensors 2020, 20, 489. [Google Scholar] [CrossRef]
  26. Skondras, A.; Karachaliou, E.; Tavantzis, I.; Tokas, N.; Valari, E.; Skalidi, I.; Bouvet, G.A.; Stylianidis, E. UAV Mapping and 3D Modeling as a Tool for Promotion and Management of the Urban Space. Drones 2022, 6, 115. [Google Scholar] [CrossRef]
  27. Scivetti, N.; Marcos, P.; Benedini, L.; Arrouy, M.J.; Bahía, M.E.; Miralles, F.R.; Poiré, D.G. Multi-proxy geophysical modeling of subsurface Neoproterozoic limestones: Applications for mining industry in the Tandilia System, Argentina. J. S. Am. Earth Sci. 2021, 111, 103436. [Google Scholar] [CrossRef]
  28. Wu, S.; Zhang, X. Visualization of Railway Transportation Engineering Management Using BIM Technology under the Application of Internet of Things Edge Computing. Wirel. Commun. Mob. Comput. 2022, 2022, 4326437. [Google Scholar] [CrossRef]
  29. Gao, W.; Shi, L.; Han, J.; Zhai, P. Dynamic monitoring of water in a working face floor using 2D electrical resistivity tomography (ERT). Mine Water Environ. 2017, 37, 423–430. [Google Scholar] [CrossRef]
  30. Liang, H.; Jin, S.; Wei, W.; Gao, R.; Ye, G.; Zhang, L.; Yin, Y.; Lu, Z. Lithospheric electrical structure of the middle Lhasa terrane in the south Tibetan plateau. Tectonophysics 2018, 731–732, 95–103. [Google Scholar] [CrossRef]
  31. Su, O.; Momayez, M. Indirect estimation of electrical resistivity by abrasion and physico-mechanical properties of rocks. J. Appl. Geophys. 2017, 143, 23–30. [Google Scholar] [CrossRef]
  32. Jones, A.G.; Garcia, X. Electrical resistivity structure of the Yellowknife River Fault Zone and surrounding region, Gold Yellowknife Greenstone Belt, Northwest Territ. Results EXTECH III Multidiscip. Res. Proj. 2006, 3, 126–141. [Google Scholar]
  33. Loke, M.H. Electrical imaging surveys for environmental and engineering studies. Pract. Guid. 1999, 2, 70. [Google Scholar]
  34. Martínez, J.; Rey, J.; Sandoval, S.; Hidalgo, M.C.; Mendoza, R. geophysical prospecting using ERT and IP techniques to locate galena veins. Remote Sens. 2019, 11, 2923. [Google Scholar] [CrossRef]
  35. Tannant, D.; Regensburg, B. Guidelines for Mine Haul Road Design; University of British Columbia Library: Vancouver, BC, Canada, 2001. [Google Scholar] [CrossRef]
  36. Thompson, R. Mine haul road design and management best practices for safe and cost-efficient truck haulage. In Proceedings of the Society for Mining, Metallurgy and Exploration 2010, Phoenix, AZ, USA, 28 February–3 March 2010; Conference Proceedings Pre-Print. 2010; pp. 1–10. [Google Scholar]
  37. Chen, S.H. Mining Patterns and Factors Contributing to Crash Severity on Road Curves. Ph.D. Thesis, Queensland University of Technology, Brisbane, Australia, 2010. Available online: https://eprints.qut.edu.au/31711/2/Shin_Chen_Thesis.pdf (accessed on 26 March 2025).
  38. Bauer, J. Development of a Mining Concept for the Reactivation of a Limestone Quarry in a Multiple Pit Operation Considering Alternative Locations for Mobile Pre-Screening and Crushing Plants. Master’s Thesis, Aalto University Learning Centre, Espoo, Finland, 2018. [Google Scholar]
  39. Bar, N.; Barton, N. The Q-slope method for rock slope engineering. Rock Mech. Rock Eng. 2017, 50, 3307–3322. [Google Scholar] [CrossRef]
  40. Scott, B.; Ranjith, P.G.; Choi, S.K.; Khandelwal, M. A review on existing opencast coal mining methods within Australia. J. Min. Sci. 2010, 46, 280–297. [Google Scholar] [CrossRef]
  41. Soltanmohammadi, H.; Osanloo, M.; Sami, A.; Malekzadeh, S.B. Selection of practical bench height in open pit mining using a multi-criteria decision making solution. J. Geol. Min. Res. 2010, 2, 48–59. [Google Scholar]
  42. Alejano, L.; Pons, B.; Bastante, F.; Alonso, E.; Stockhausen, H. Slope geometry design as a means for controlling rockfalls in quarries. Int. J. Rock Mech. Min. Sci. Géoméch. Abstr. 2007, 44, 903–921. [Google Scholar] [CrossRef]
  43. Kose, H.; Aksoy, C.O.; G�nen, A.; Kun, M.; Malli, T. Economic evaluation of optimum bench height in quarries. J. S. Afr. Inst. Min. Metall. 2005, 105, 127–135. [Google Scholar]
Figure 1. Location map of study area.
Drones 09 00266 g001
Figure 2. Proposed scheme for surface and subsurface modeling of the research area.
Drones 09 00266 g002
Figure 3. (a) Flight plan of UAV. (b) Executed UAV path and (c) workflow of 3D surface modeling.
Drones 09 00266 g003aDrones 09 00266 g003b
Figure 4. Schematic illustration of Vertical Electrical Sounding (VES) configuration for subsurface surveying.
Drones 09 00266 g004
Figure 5. Workflow of VES 3D subsurface modeling. The data were acquired using a multi-electrode resistivity system, processed and inverted using ZondRes1D software, which is used for one-dimensional (1D) resistivity and induced polarization (IP) data inversion. We applied the smoothness-constrained least-squares inversion method for inversion because it provides a stable and geologically plausible solution. The regularization parameter (λ) was selected as 0.1 for the optimal trade-off between data misfit and model smoothness, and inversion was terminated when the root mean square (RMS) difference between the observed and calculated data fell below 5% or a threshold of 10 iterations. A half-space model with an evenly distributed initial resistivity value of 100 Ω·m was used as the initial inversion start model, and noisy data points were down-weighted to minimize their effect on the inversion outcome.
Drones 09 00266 g005
Figure 6. Location map of vertical electric imaging.
Drones 09 00266 g006
Figure 7. Workflow of quarry design.
Drones 09 00266 g007
Figure 8. Three-dimensional Digital Terrain Model of marble deposit at Minpin Nagar.
Drones 09 00266 g008
Figure 9. Digital Elevation Model of marble deposit at Minapin Nagar.
Drones 09 00266 g009
Figure 10. Contour of marble Mine at Minapin Nagar.
Drones 09 00266 g010
Figure 11. VES data interpretation (profiles VES−01, VES−02 and VES−03).
Drones 09 00266 g011
Figure 12. VES data interpretation for VES−04 and VES−05.
Drones 09 00266 g012
Figure 13. Haulage road design.
Drones 09 00266 g013
Figure 14. Proposed 3D marble quarry.
Drones 09 00266 g014
Table 1. Technical specifications of UAV survey in Agisoft Metashape.
CategoryParameterSetting/Value
Image alignmentAccuracyHigh
projections2,708,734
Tie Point Limit170,191
Re-projection error1.54 pixels
Camera stations930
Number of images980
Flying altitude221 m
Coverage area0.696 km2
Camera parametersCamera modelTest pro (10.26 mm)
Focal length10.26 mm
Pixel size2.41 µm
Table 2. Summary of the resistivity values and their corresponding interpretations.
Resistivity Range (Ω·m)InterpretationDepth Range (m)
>1000Solid Marble7–75 (VES-1), 12–33 (VES-2), 8–15 (VES-3), 13–35 (VES-5)
350–1000Fractured Marble2–3 (VES-1), 6–12 (VES-2), 36–54 (VES-3), 7–35 (VES-4), 1–4 (VES-5)
<350Iron Leaching4–8 (VES-1), 33–60 (VES-2), 22–36 (VES-3), 3–7 (VES-4), 4–14 (VES-5)
Disclaimer/Publisher’s Note: The statements, opinions and data contained in all publications are solely those of the individual author(s) and contributor(s) and not of MDPI and/or the editor(s). MDPI and/or the editor(s) disclaim responsibility for any injury to people or property resulting from any ideas, methods, instructions or products referred to in the content.

