Abstract
In this article, the authors conducted electromagnetic radiation research on telecommunication base stations using Unmanned Aerial Vehicles (UAVs). Until now, UAVs have only been capable of performing visual inspections, without investigating electrical parameters. The authors suggest a method that involves using a spectrum analyzer and an automated flight with a predefined trajectory around the base stations to conduct electromagnetic radiation research, which is used by telecommunication regulatory organizations. Two different types of UAVs were used in this work: a drone and a fixed-wing aircraft, each with distinct characteristics. The authors successfully designed and tested both types of UAVs under real conditions and performed measurements. A specialized algorithm with software was developed for processing measurement results, which accurately presents the data in a graphical format. Experiments were performed, and the results, at distances of 200 m or further from the telecommunication base tower by changing the altitude by 5 m, were collected.
1. Introduction
Integrating Unmanned Aerial Vehicles (UAVs) or drones for the monitoring of telecommunication towers or base stations has emerged as a promising technological advancement in recent years. UAVs offer unique advantages, in terms of accessibility, efficiency, and data collection capabilities, enhancing the overall monitoring process [1].
The publications reviewed describe developed algorithms, but their applications were different. For example, in work [2] the researchers collected images of overhead power lines and processed them to analyze and compile them into a unified whole. Complex image processing methods were used for this. In work [3], similarly to [2], image processing was used, but this time for analyzing external power line insulators, with the images collected using drones. Again, in work [4] images were used to search for bird nests built around power poles and wires.
In work [5], drones were used slightly differently, being equipped with a gas detector, allowing them to collect leak information while flying over a gas pipeline. Sequential data were then used with an artificial neural network that performed a simple classification task that, in our view, could have been conducted using a basic “if–else” condition—i.e., whether a leak was found or not.
A somewhat different task was undertaken by the authors of work [6], who developed software for drones to track gas or oil pipelines. Similar tasks are performed in autonomous vehicle tracking competitions, in which line following and photodetectors are used, whereas image processing tools were employed in the article. Similar software was developed in articles [7,8,9].
Monitoring and data analytics can be further improved by deploying UAVs equipped with advanced sensors and imaging technologies. These drones can be programmed to conduct automated flight missions, collecting data on electromagnetic radiation levels and specter at various points around the telecommunication towers. The data are then transmitted in real time to ground stations, allowing for immediate analysis and decision making [10,11].
On the other hand, in articles [10,11] the focus was on how to efficiently collect data from sensors using drones—this is essentially a classical graph theory problem aimed at finding the optimal flight route between sensors.
Articles [12,13,14,15,16,17,18,19] discussed how antenna characteristics should be measured. Of course, the most accurate measurements would be performed in a controlled laboratory environment, specifically in a specialized RF chamber. However, in our case, measurements were carried out under real flight conditions. We could anticipate some obvious interference and properties, but it was practically impossible to test all scenarios that could influence and to what extent affect our measurement errors. In this case, the other authors used measurement hardware and software that collected data and presented them using standard antenna radiation diagrams.
The use of UAVs also enables more frequent and cost-effective monitoring, as they can easily access difficult-to-reach tower locations without the need for physical infrastructure [20]. This accessibility not only enhances the safety of monitoring personnel but also ensures consistent and reliable data collection, especially in remote or hazardous environments.
A more interesting solution for precise drone control and photo collection to create a 3D map of a tower was presented in information bulletins [20,21].
Moreover, UAVs provide a dynamic perspective, allowing for a comprehensive assessment of the towers’ surroundings and potential environmental impacts [22]. On the other hand, no algorithms are provided here—only the idea and results are implemented—so comparison is practically impossible. Another work [22], also performed a similar task, but by flying in a circle and visually observing the tower while photographing it. GPS coordinates were attached to the photo. The complexity of the algorithm was related to the data collection, which was similar to our approach, but the main difference is that here image processing is used later.
High-resolution aerial imagery captured by drones can assist in identifying any structural issues, equipment malfunctions, or damage to the towers, enabling timely maintenance and preventive measures [21].
Additionally, UAVs equipped with specialized cameras and sensors can aid in wildlife and environmental impact assessments. The ability to observe wildlife habitats and ecosystems from an aerial viewpoint can provide valuable data on how electromagnetic radiation affects local fauna and flora, leading to more informed decisions on tower placement and environmental conservation [23,24].
With the deployment of 5G and future wireless technologies, monitoring the electromagnetic radiation from these new systems becomes even more critical. UAVs can play a crucial role in assessing the specific characteristics of 5G radiation emissions and their potential effects on human health and the environment. Their agility and flexibility make them ideal for adapting to the evolving needs of monitoring advanced telecommunication infrastructure.
Using UAVs for telecommunication tower monitoring also comes with its challenges. These include ensuring compliance with aviation regulations, acquiring proper permits for UAV operations, and addressing privacy concerns related to aerial surveillance. Data security during transmission and storage is also a paramount consideration when dealing with sensitive information gathered during monitoring [25,26].
The integration of UAVs into the monitoring of telecommunication towers and base stations offers a compelling solution to improving data collection, enhancing accessibility to remote sites, and providing valuable insights into health, safety, and environmental impacts. As technology continues to advance, the synergy between UAVs and telecommunication tower monitoring will likely become an indispensable part of ensuring efficient and responsible telecommunication infrastructure management.
This paper is structured as follows: Section 1 serves as an introduction and presents the background context. Section 2 provides a problem formulation and brief overview of the equipment used and the experiment setup. Section 3 presents our experiment results and the measured data. Finally, Section 4 presents the discussion, Section 5 future work and Section 6 conclusions.
2. Materials and Methods
To explore and validate the feasibility of utilizing Unmanned Aerial Vehicles (UAVs) as telecommunication base stations for monitoring, data acquisition, and analysis, the problem was segmented into three primary tasks, each with several subtasks:
- Selection of electromagnetic radiation measurement equipment:
- (a)
- Identification and/or development of suitable spectrum analyzers, filters, and antennas for installation on UAVs;
- (b)
- Development of control software tailored to the selected equipment;
- (c)
- Implementation of a multi-frequency data transmission channel to mitigate interference risks during diverse measurements.
- Design and adaptation of UAV platforms:
- (a)
- Selection or design of rotary-wing and fixed-wing UAV platforms capable of accommodating the chosen equipment;
- (b)
- Modification of UAVs for safe landing in populated areas;
- (c)
- Adjustment of autopilot software to fulfill the specialized requirements;
- (d)
- Selection of multi-frequency telemetry and control data transmission channels to minimize interference with measurement equipment.
- Integration of UAVs and measurement systems:
- (a)
- Integration of measurement equipment, particularly antennas, within UAV structures;
- (b)
- Compatibility assessment and testing of UAV systems, data transmission systems, and measurement systems;
- (c)
- Development of measurement methodologies;
- (d)
- Experimental validation of integrated systems.
This structured approach facilitated systematic exploration and validation of UAV-based telecommunication base stations, ensuring thorough consideration of equipment selection, platform adaptation, and system integration.
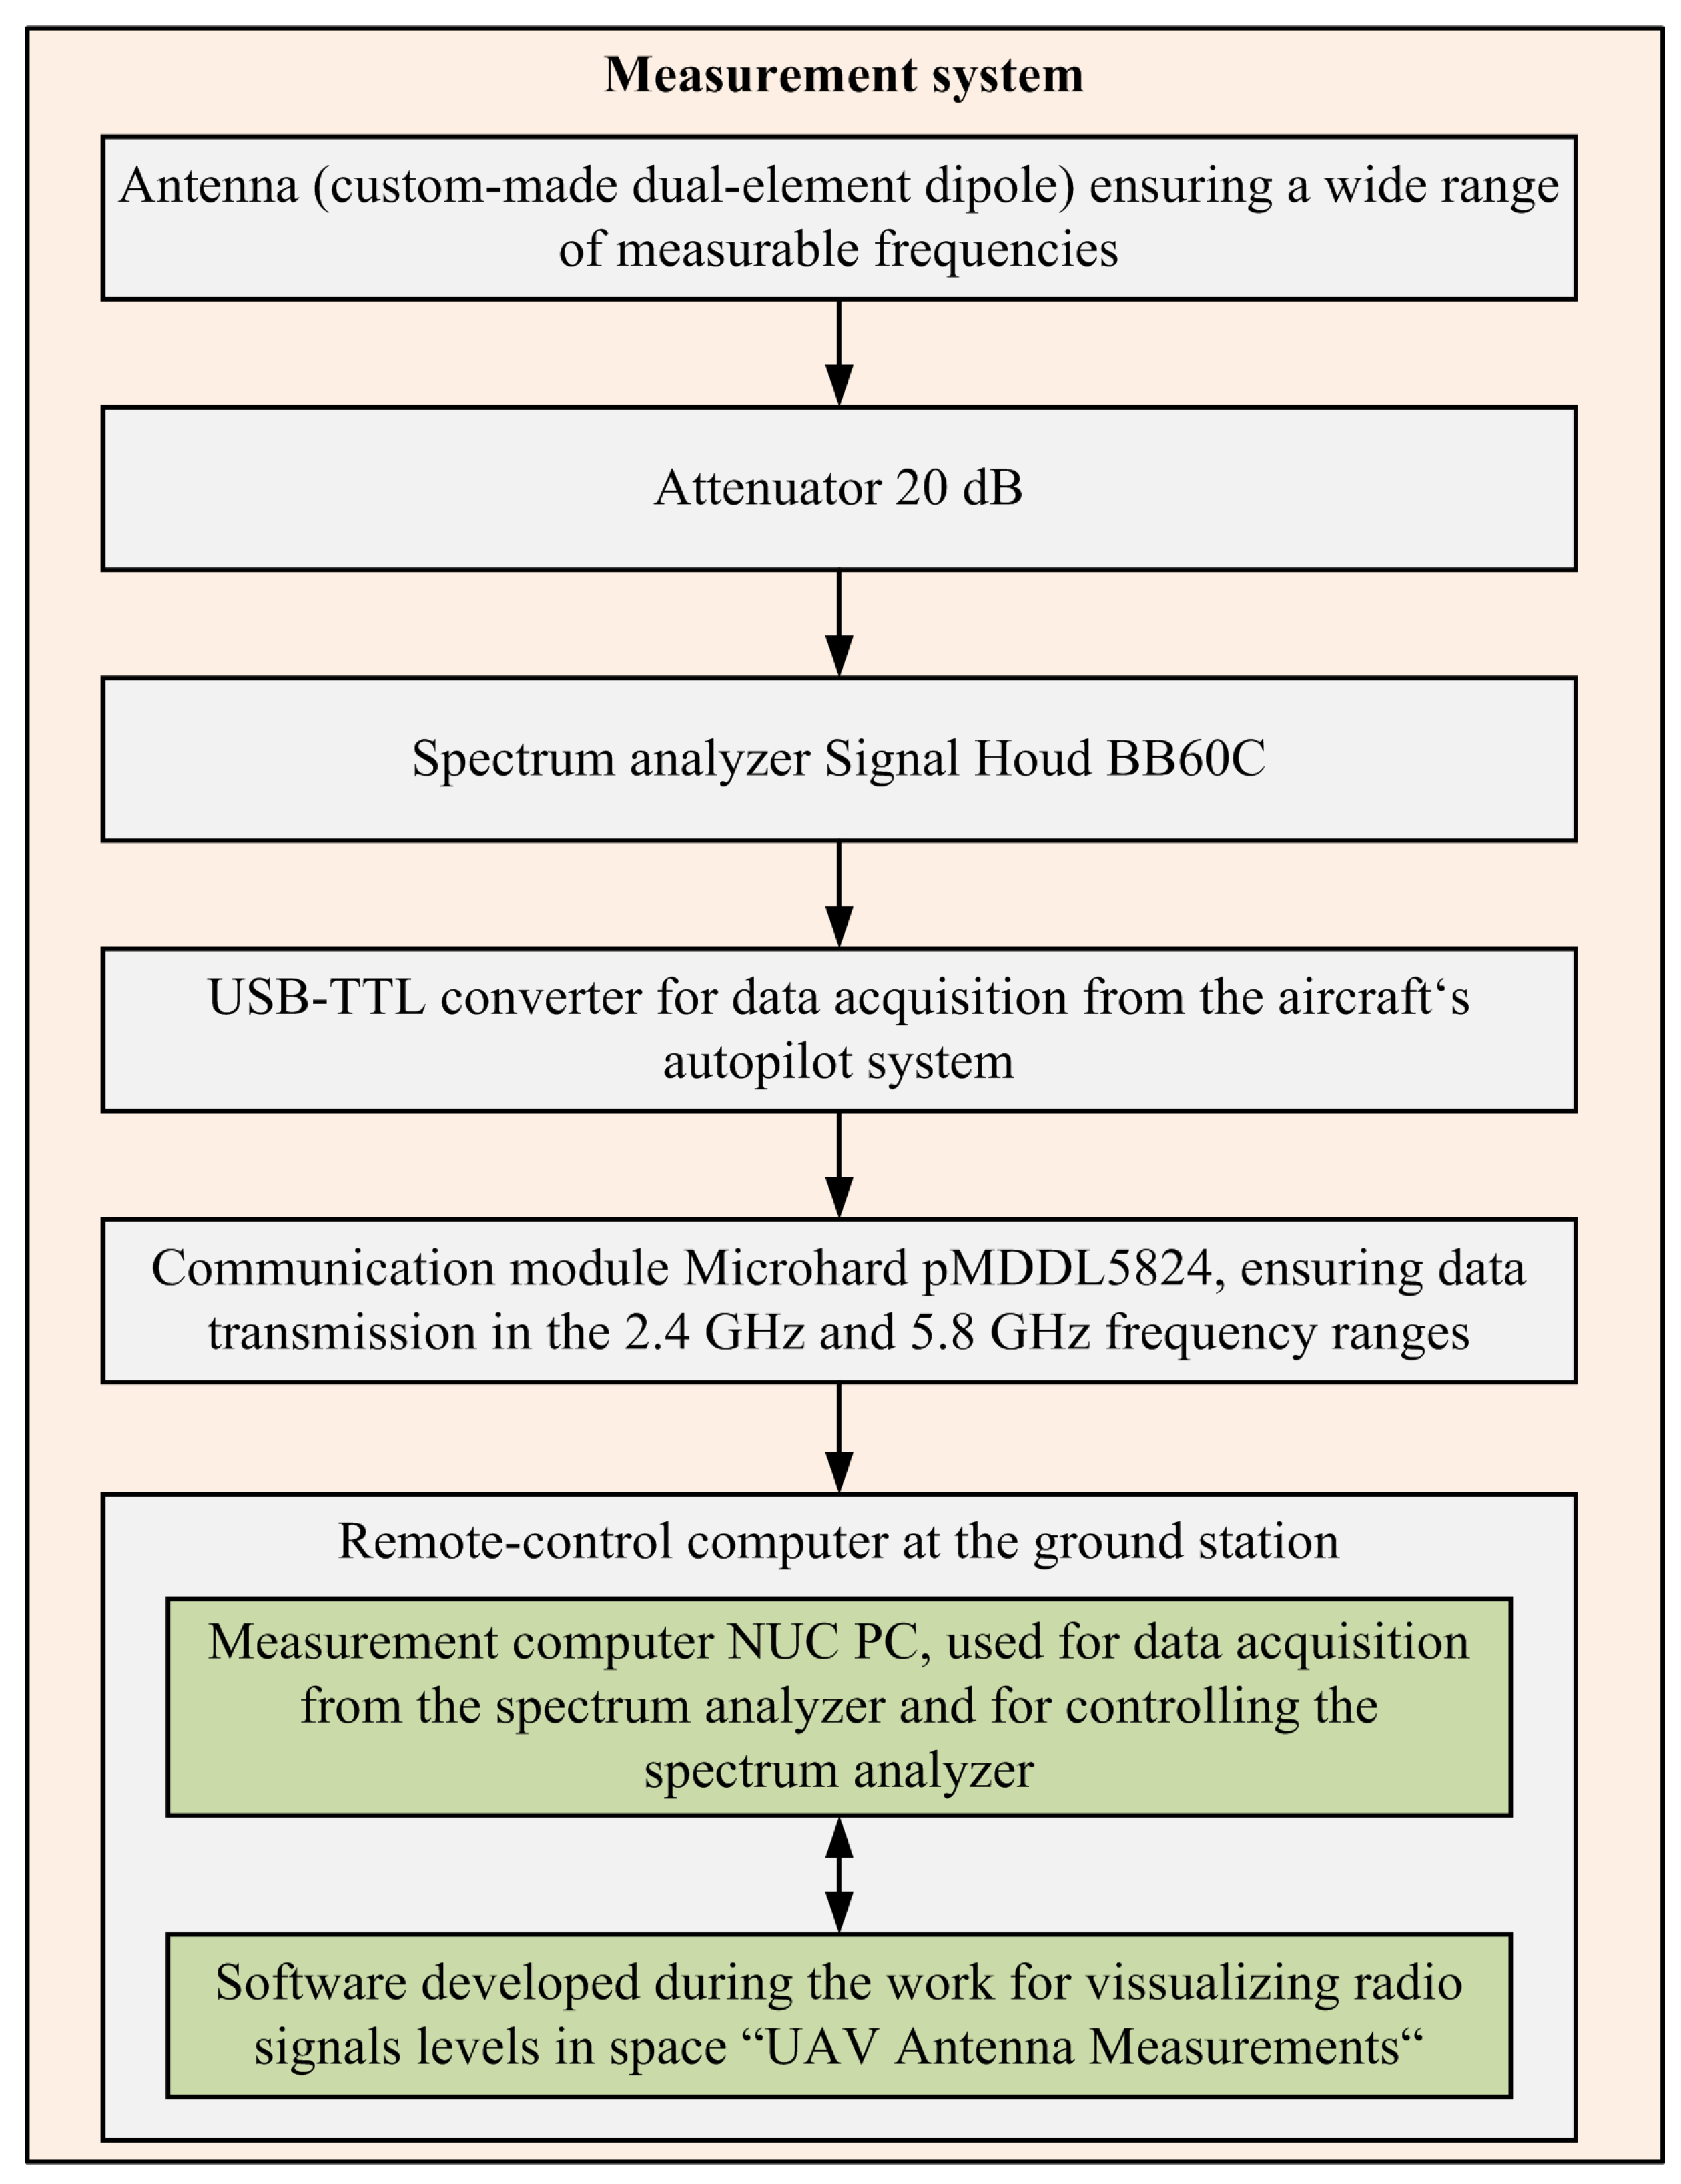
The general measurement system diagram is presented in Figure 1:
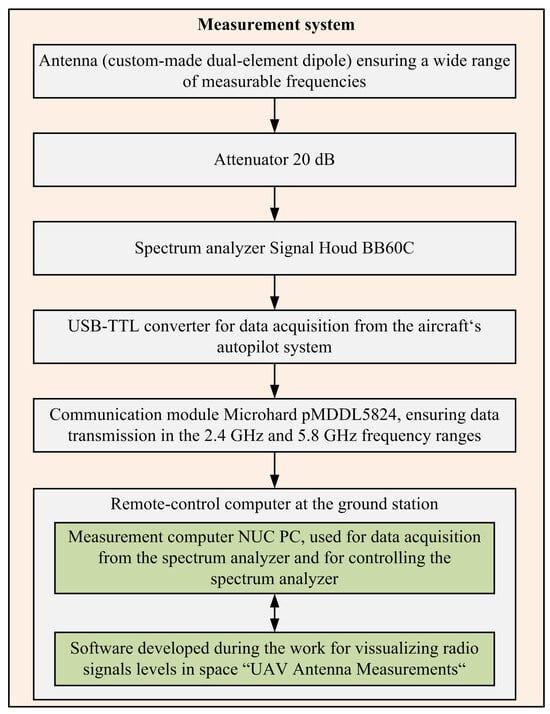
Figure 1.
General measurement system diagram.
Regarding the mentioned tasks and the general measurement diagram in Figure 1, radio frequencies recorded by the spectrum analyzer were transmitted to the onboard measurement computer, which also controlled the spectrum analyzer via a USB connection. Measurement data and control signals were transmitted from the aircraft via onboard dedicated communication equipment to the ground station, where they were displayed on a remote-control computer (ground station). The total weight of the measurement system when assembled was in the range of 2 kg.
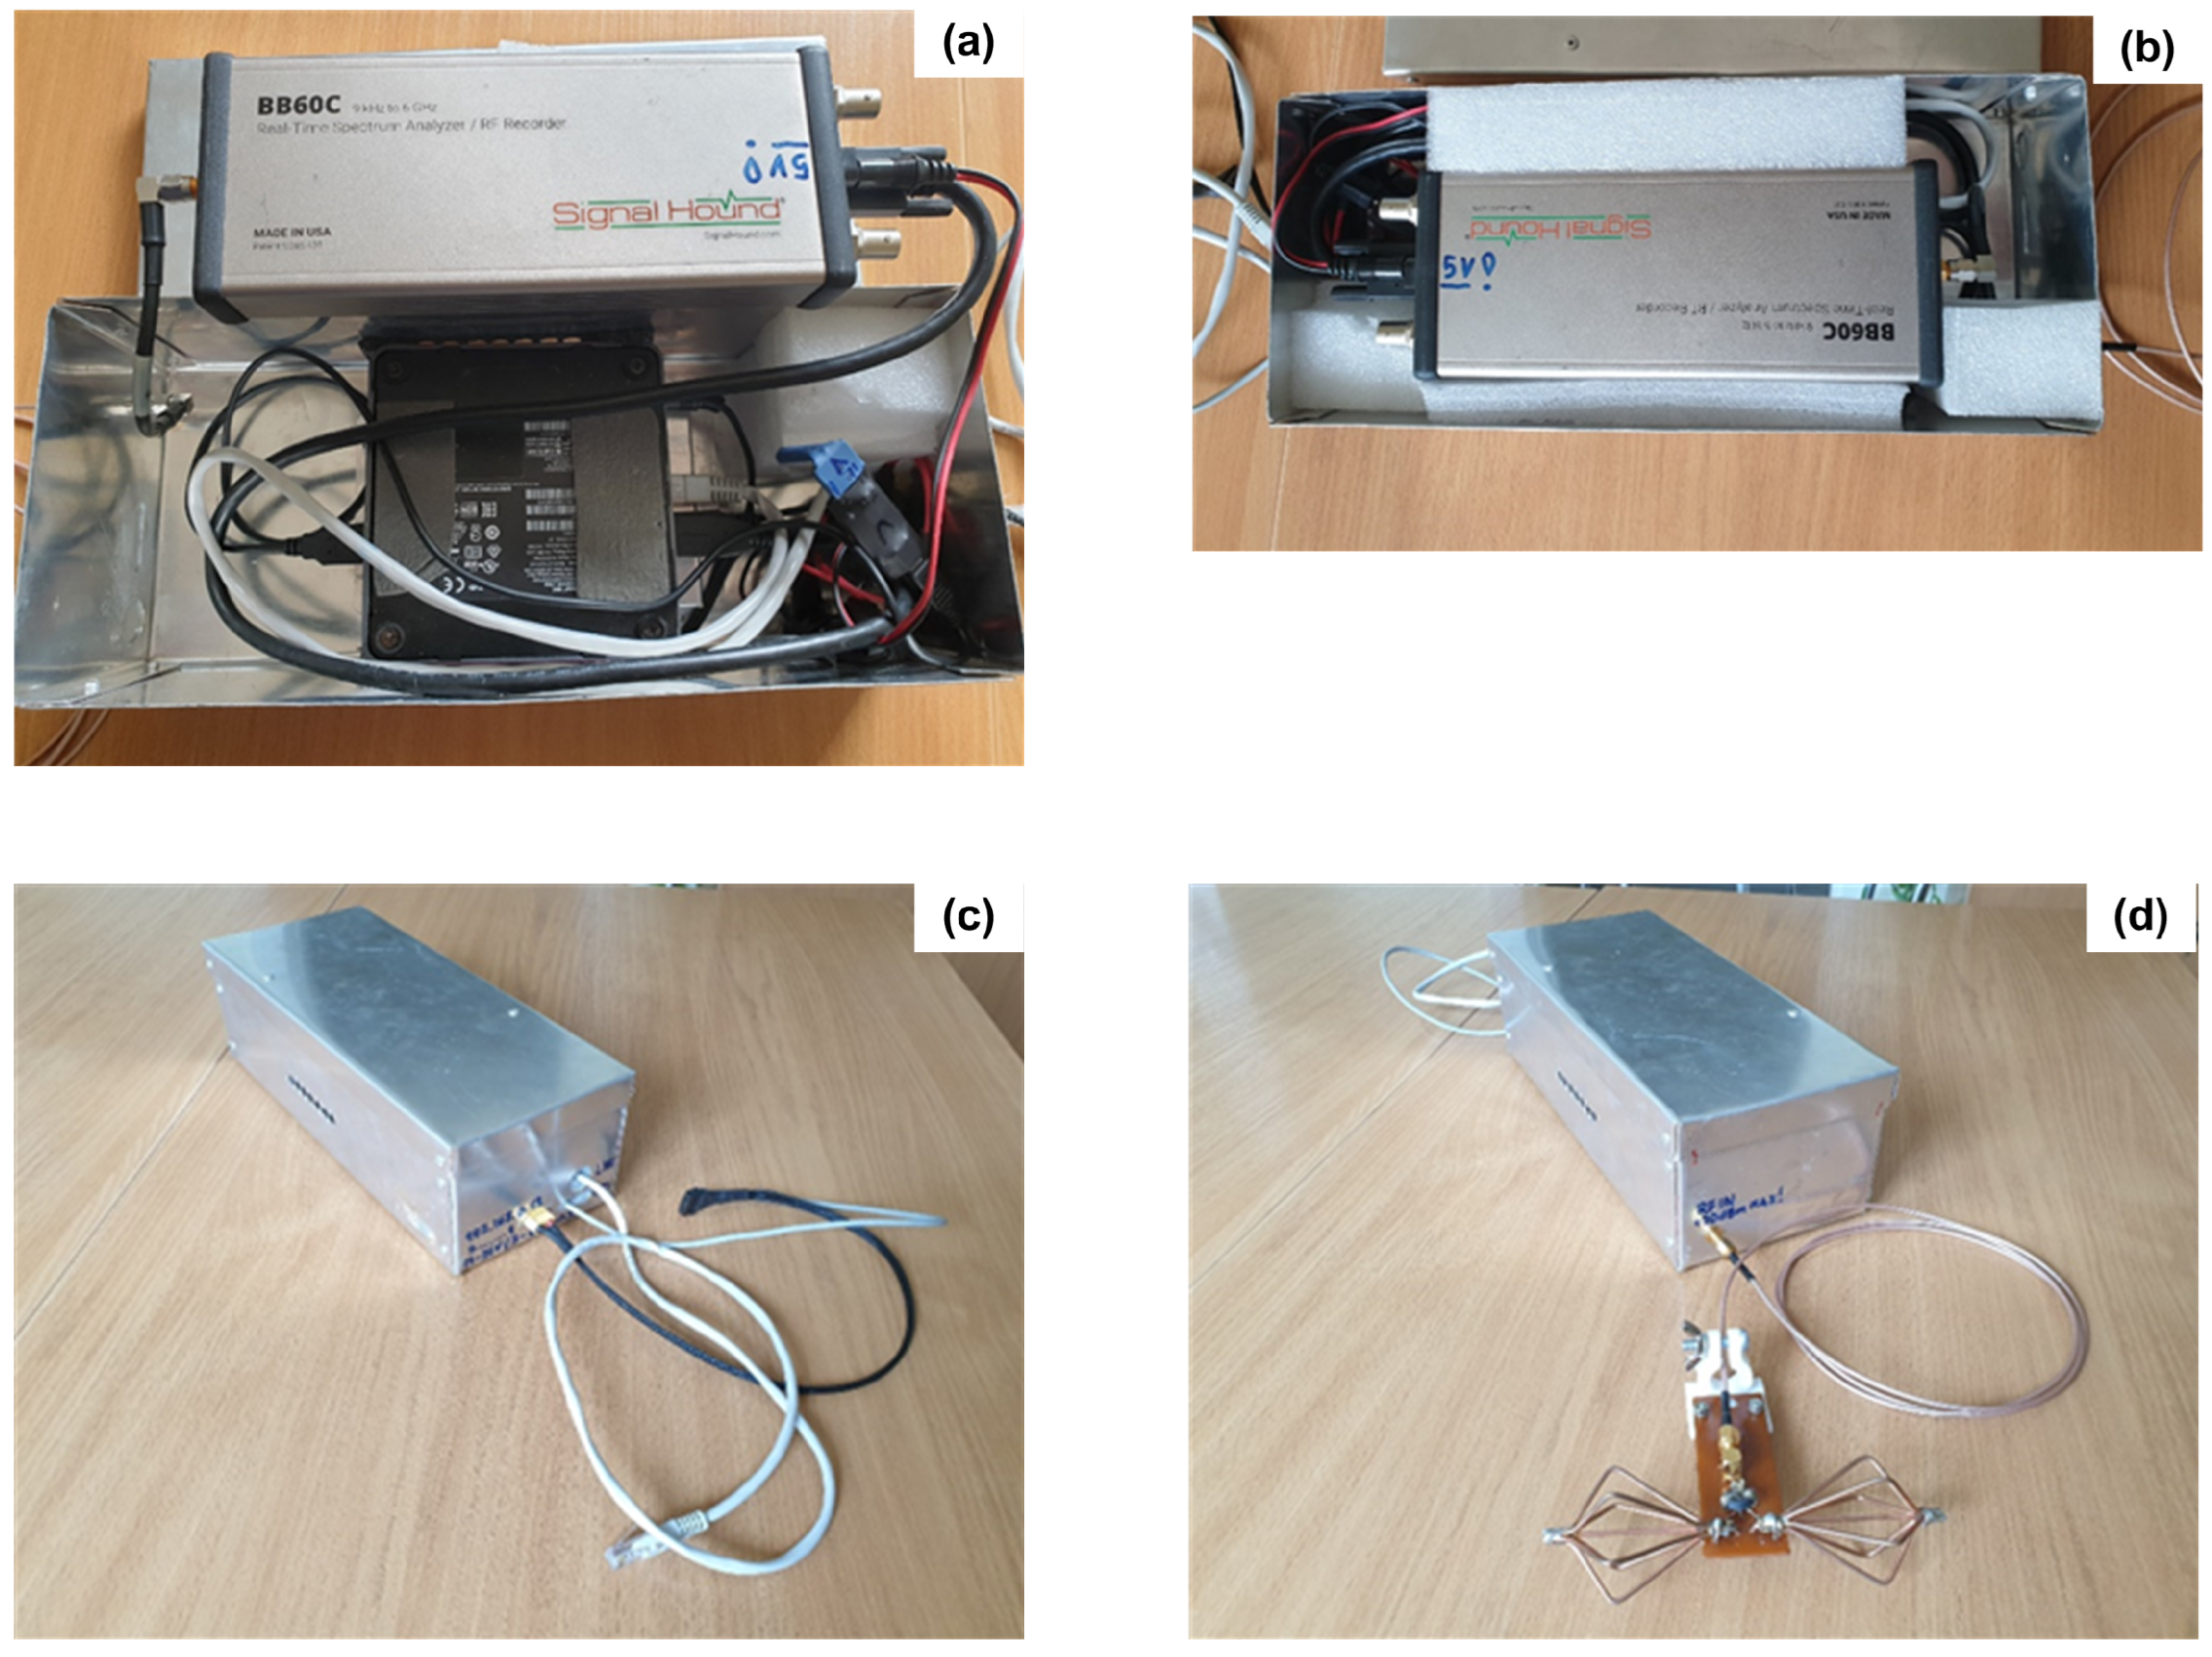
The entire measurement system located on the aircraft was integrated into a box (Figure 2a). After conducting measurements and testing (by analytical and experimental methods comparing metal and composite boxes), it was concluded that the most suitable option for the specific application would be an aluminum box, ensuring low radio interference, mechanical protection, and sufficient cooling of system components.
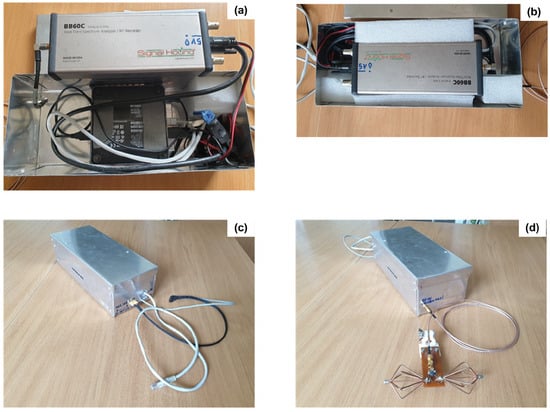
Figure 2.
(a) Measurement system equipment. (b) Measurement system equipment mounted in a specialized box. (c) Measurement system box. (d) Measurement system box with a specialized antenna.
The measuring equipment was installed in the aircraft, designed, and mounted in such a way that it could be easily mounted both in a multi-rotor and in a fixed-wing aircraft, or even used completely separately as ground-based measuring equipment.
In addition, a new measurement data processing algorithm and new recording software were developed.
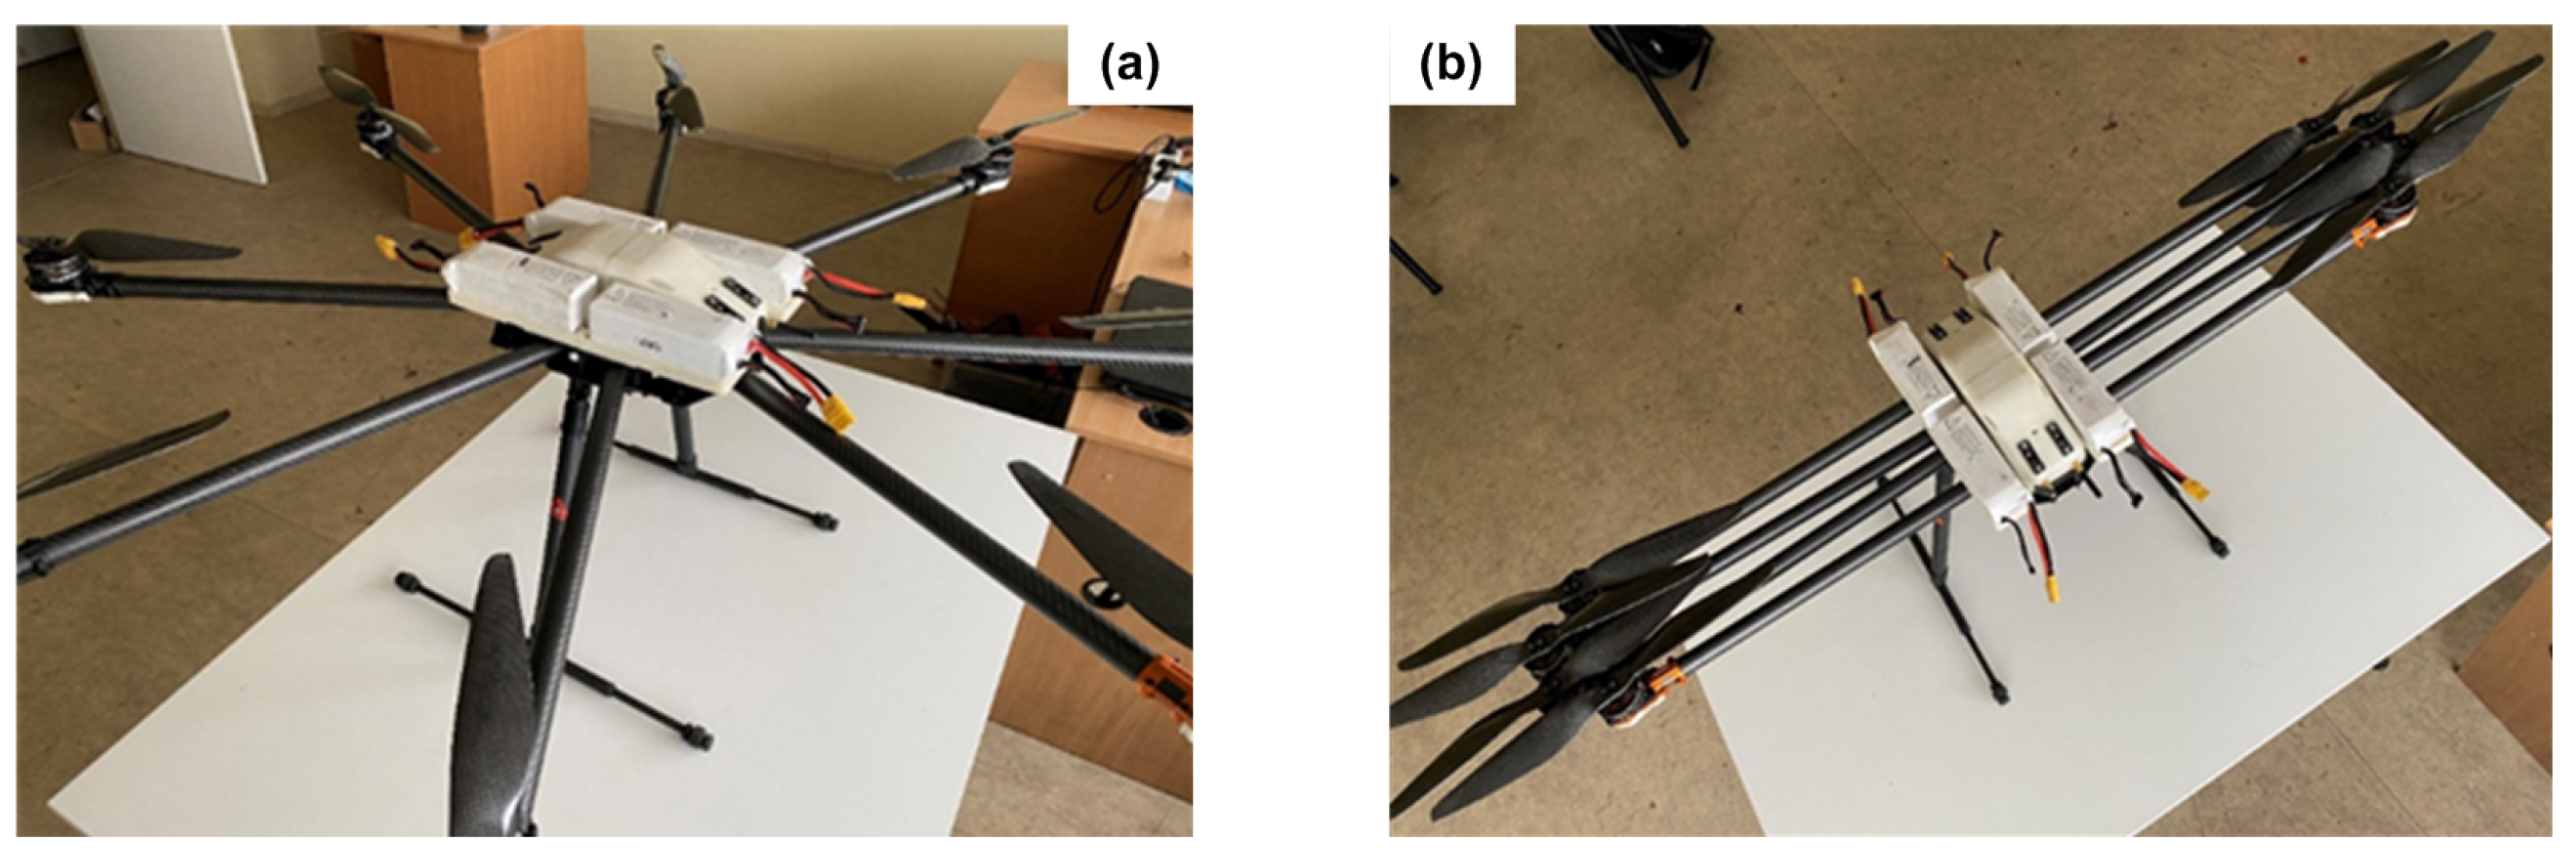
During the investigation and development, a few versions of the multi-rotor drones (Figure 3a) and a fixed-wing UAV were developed, as shown in Figure 3b, for conducting measurements, carrying the same equipment as the aforementioned experimental one.

Figure 3.
(a) The measurement equipment is mounted in a hexacopter. (b) The measurement equipment is mounted (experimentally) in a fixed-wing aircraft.
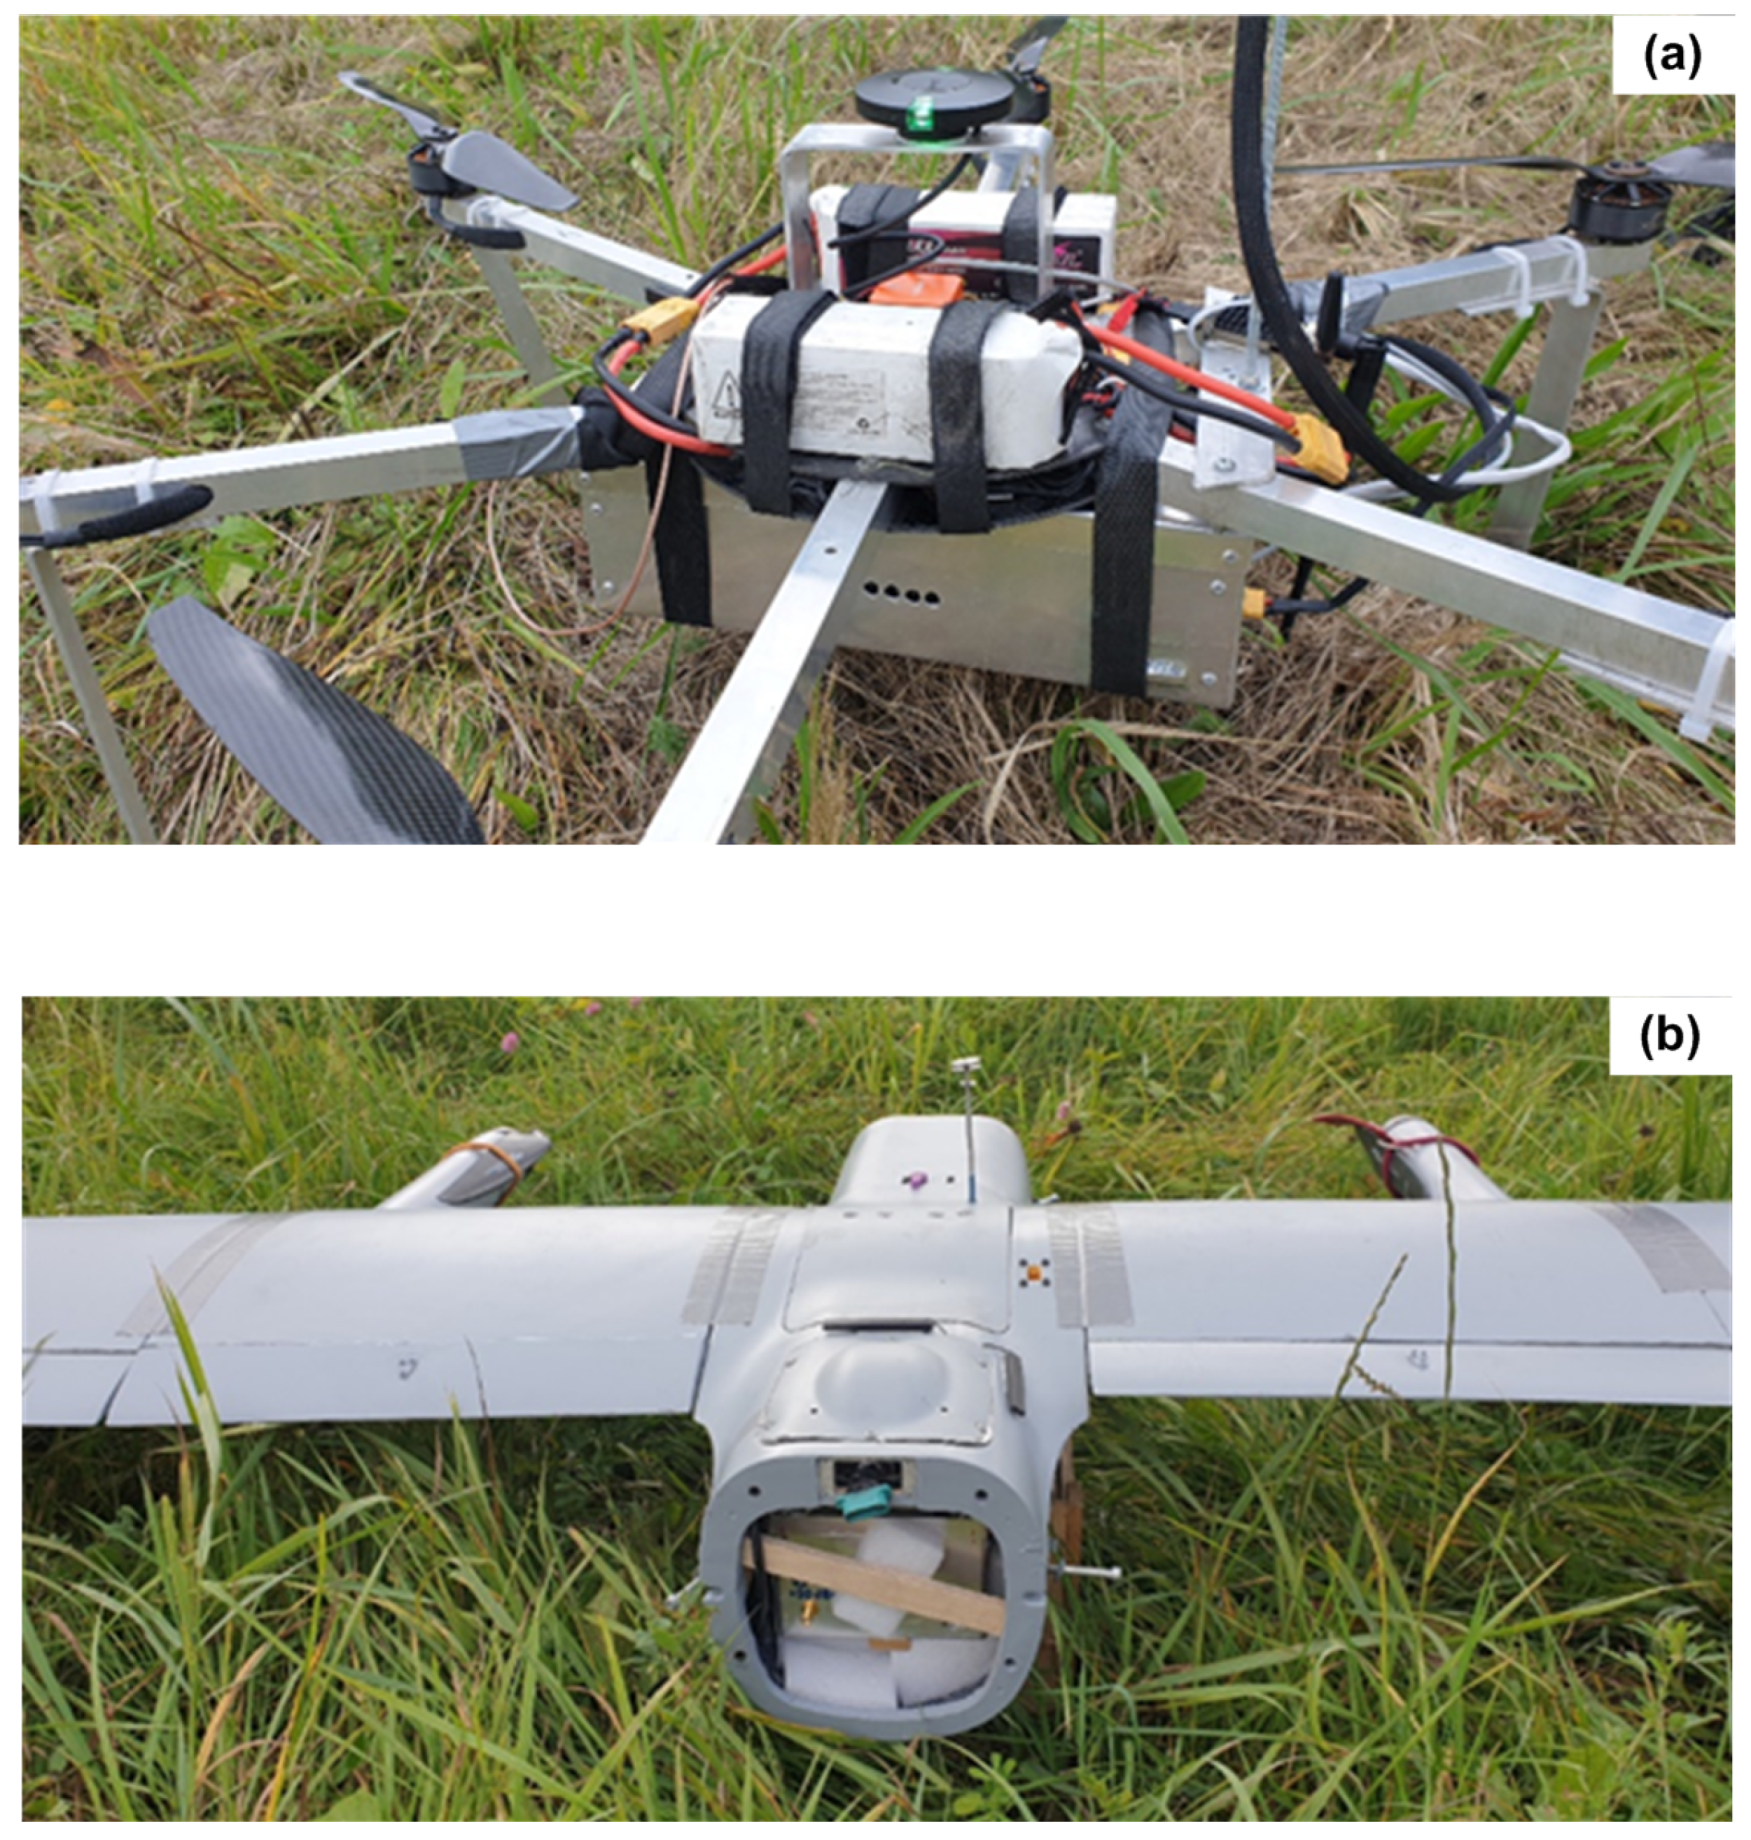
In all cases of investigation and during measurements, aircraft coordinates were determined using the RTK (Real-Time Kinematics) GNSS system, ensuring 1–2 cm accuracy in aircraft position. An experimental multi-rotor aircraft during flight is shown in Figure 4b.
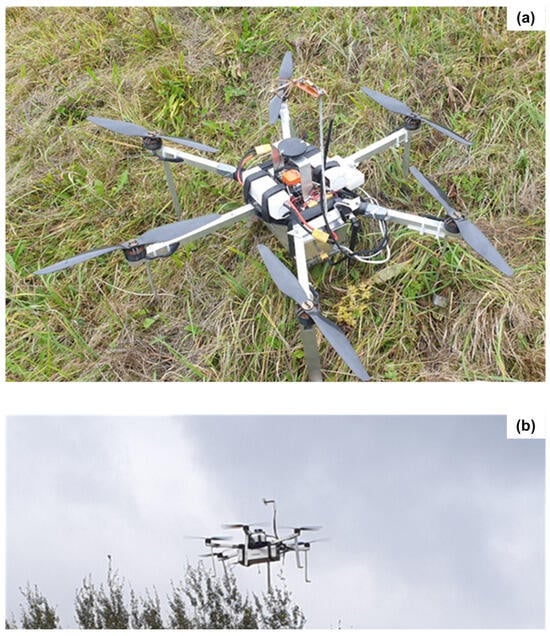
Figure 4.
(a) Experimental unmanned aircraft with measurement equipment. (b) Hexacopter aircraft during flight.
The experimental multi-rotor used in the investigation has a significant drawback—limited flight time (up to 15 min), which often is not sufficient for conducting measurements. For this reason, during the development, a larger multi-rotor aircraft (with 12 kg take-off mass) was designed and verified to ensure a longer flight time (up to 35 min); the vehicle is shown in Figure 5.
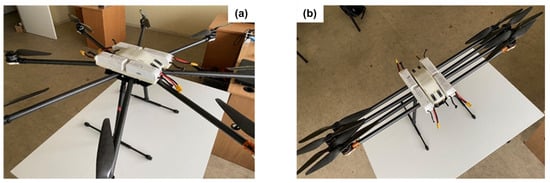
Figure 5.
(a) Hexacopter aircraft view from the side. (b) Hexacopter aircraft view from the front.
The implemented SignalHound BB60C spectral analyzer had no specific modifications. The measurements were performed at two frequencies, to allow for measurements of two radio transmitters at a time. The spectral analyzer was controlled through an onboard NUC Mini PC.
The drone had minor modifications for radio frequency measurements—a specially designed and manufactured 1mm aviation-grade aluminum box was installed with all of the radio sensitive equipment in it. The aluminum box was implemented to decrease the influence of external radio frequencies on the spectral analyzer performances (though no such effect was noted during real-life testing). The receiver antenna (spectral analyzer antenna) was mounted on a special glass-fiber stand to move it as far away as possible from the drone sources of radio interference (telemetry transmitter, wide-band data transmitter, etc.) and the possibly reflective parts of the drone (carbon fiber main board, batteries, etc.).
The implemented RTK GNSS receiver (single-frequency U-Blocks M8P-2) has manufacturer-stated positioning accuracy of (with RTK) 0.025 m, ensuring sufficient accuracy for our implementation.
The use of a hexacopter unmanned aircraft ensured easy and fast take-off and landing, as well as sufficiently accurate flight route tracking. However, hexacopter aircraft have several key drawbacks:
- An average flight time of 15–30 min; nonetheless, this is much better than the first multi-rotor version.
- Low flight speed (up to 10–12 m/s). Such flight speed is both a drawback and an advantage. The drawback is that it is difficult to ensure measurements over long distances and large areas. The advantage is more accurate measurements.
- Limited flight distance (due to short flight time).
To improve the measurement capabilities, the measuring equipment was also installed on a fixed-wing (airplane-type) unmanned aircraft.
As mentioned earlier, the use of a fixed-wing unmanned aircraft ensured the following:
- Longer flight time (up to 4 h, depending on the power source);
- Higher flight speed (16–30 m/s);
- Ability to conduct measurements over longer distances (due to higher speed and longer flight time).
At the same time, the use of a fixed-wing aircraft for measurements has certain drawbacks:
- Maintained flight trajectory is not as precise, which can affect measurements;
- During flight, the aircraft’s flight azimuth can change, which can affect measurements (due to the measurement antenna diagram).
For the above-mentioned reasons, fixed-wing aircraft are used for collecting a larger quantity of data in larger areas, as well as for creating broader 3D antenna diagrams (which was demonstrated during the research).
The unmanned aircraft ‘Spartan’ (see Figure 6), which is in production by the “Zvelk Auksciau” company, was selected for the installation of the measurement equipment, with the following main characteristics:
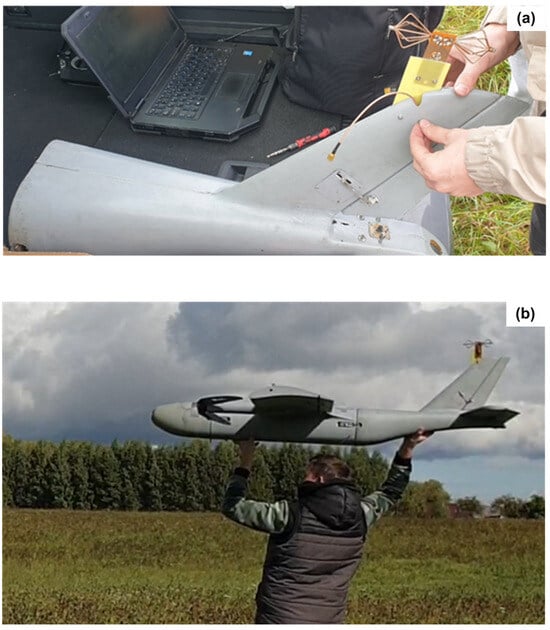
Figure 6.
(a) The mounting of measurement antennas in the aircraft. (b) The launch of the aircraft.
- Take-off weight—up to 14 kg;
- Payload weight—up to 2 kg;
- Flight time—up to 4 h (depending on conditions);
- Powerplant—two electric motors;
- Launch—hand-launched;
- Landing—belly landing.
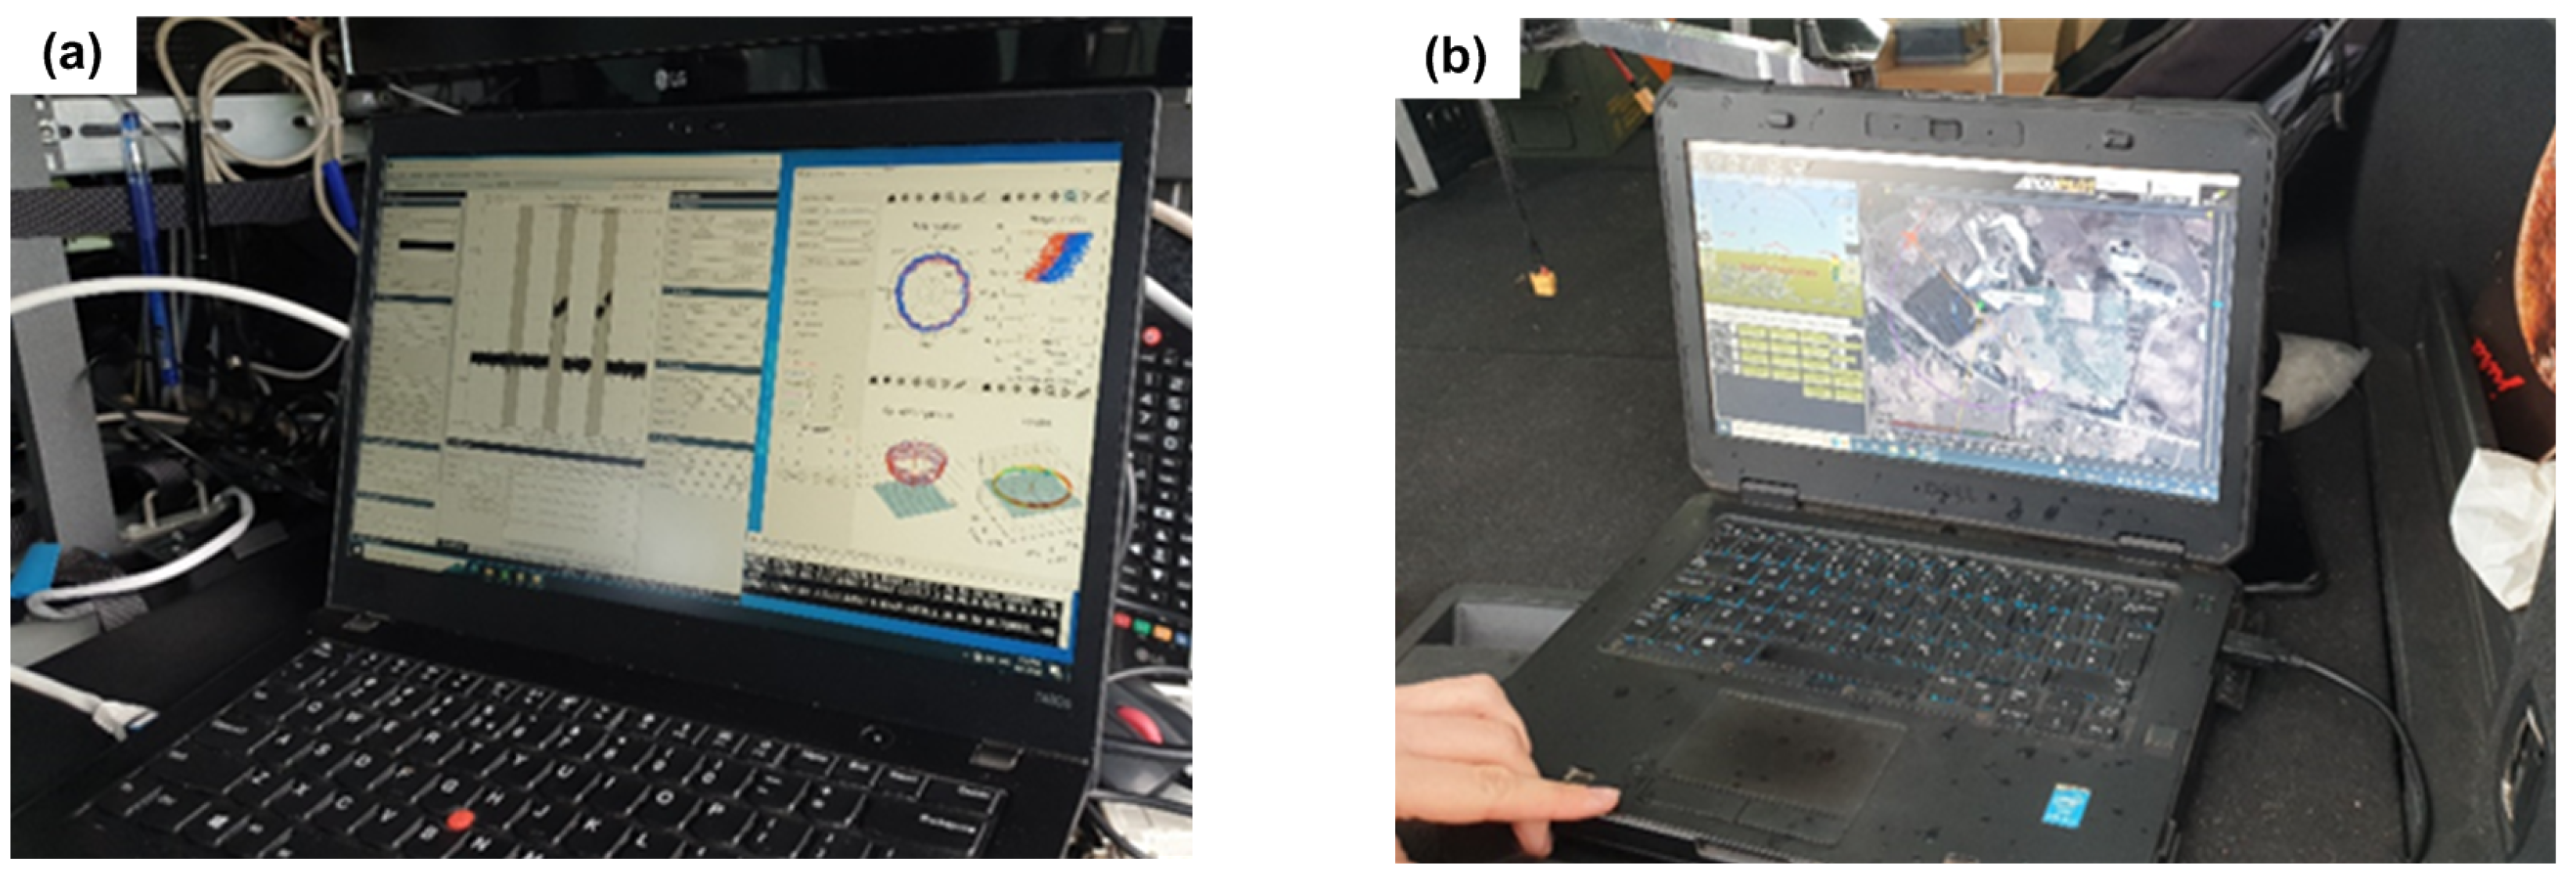
In all cases, two computers were used for flight and measurement equipment control and management: one for controlling and managing the aircraft’s flight and the other for controlling and managing the measurement equipment, as shown in Figure 7:

Figure 7.
(a) Ground station and software for data collection and analysis. (b) Ground station and software for the aircraft control.
3. Development and Experimentation
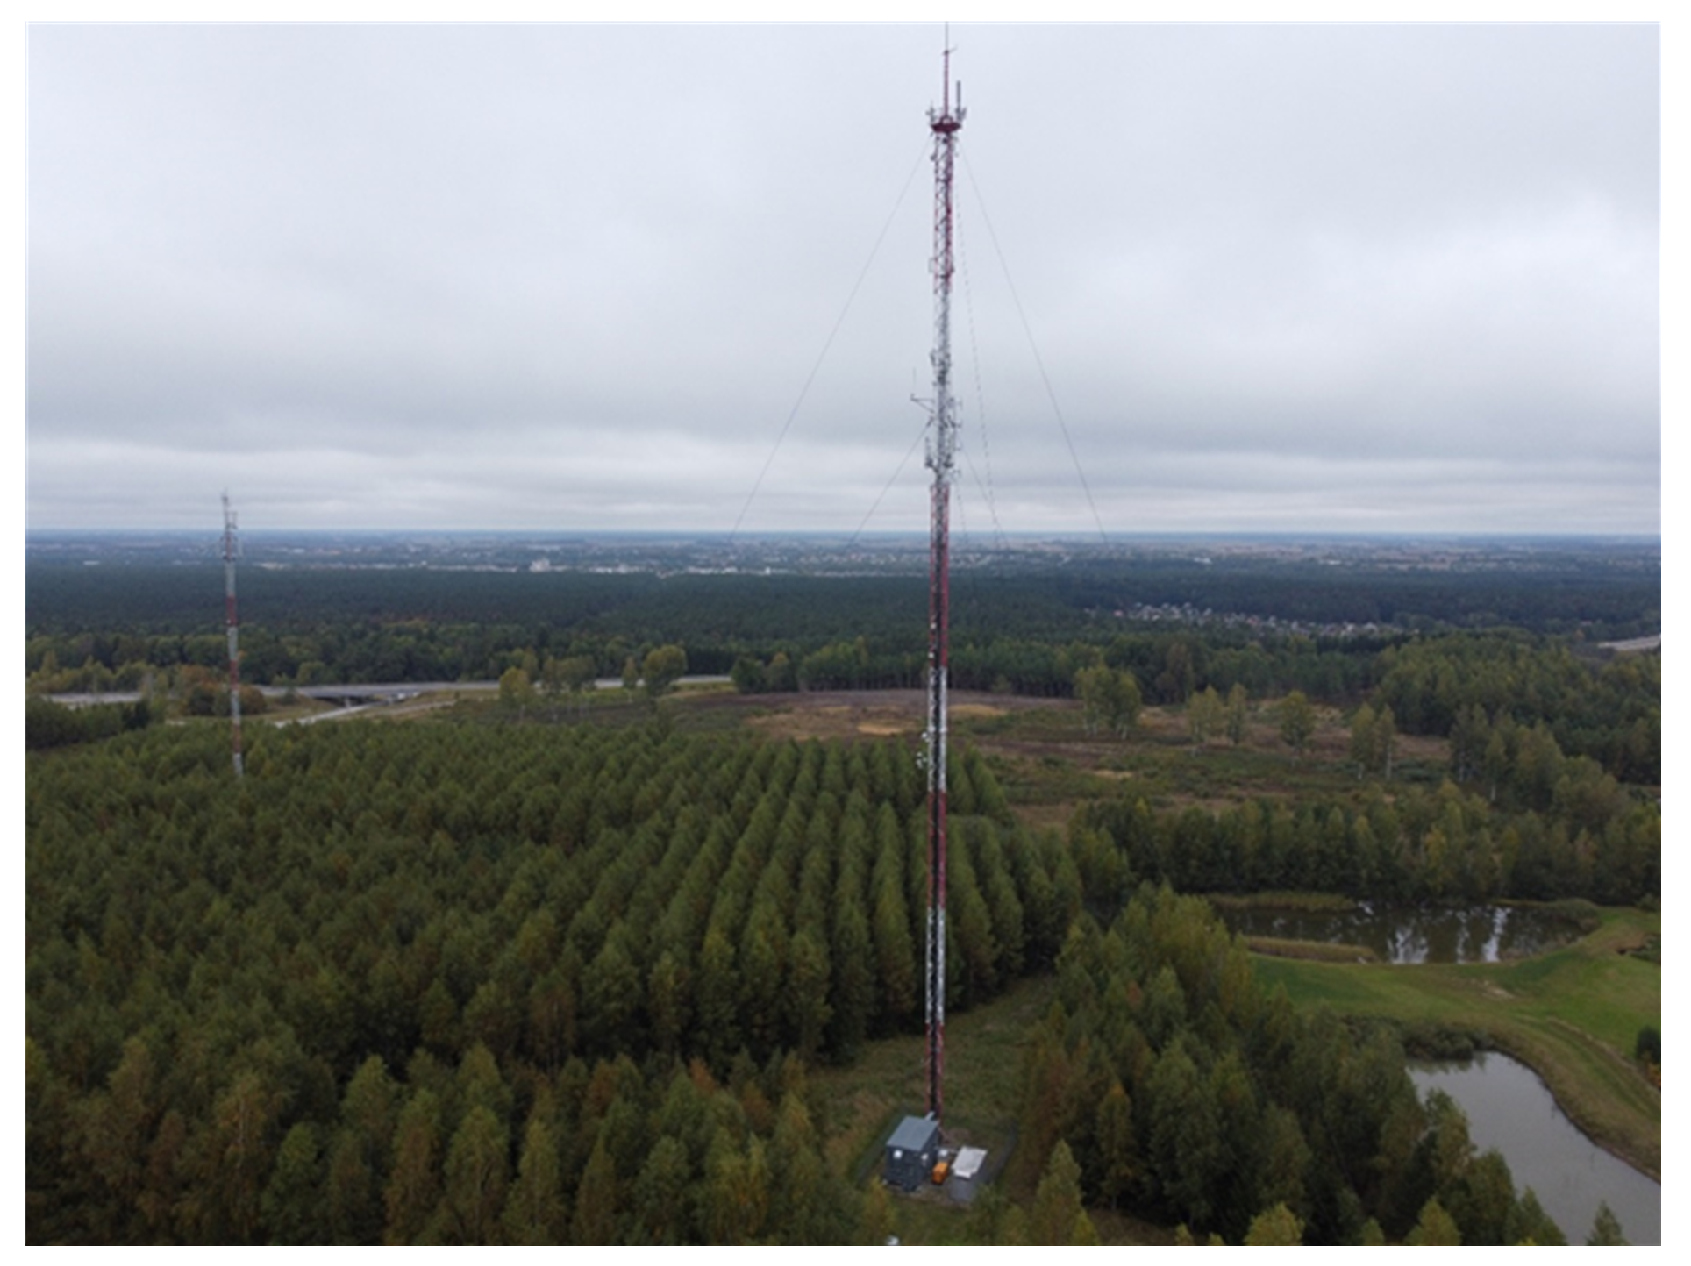
This article contains the data of the experimental measurements, where the measurements were carried out both with a winged and fixed-wing aircraft. The Ukmergė city (Lithuania) television broadcasting tower (Figure 8) was selected for the experiment, as one of the towers whose real antenna diagram is of interest to the Communications Regulatory Service in Lithuania.
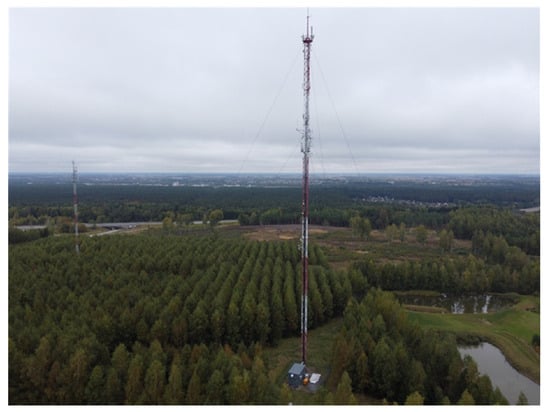
Figure 8.
Ukmergė city telecommunication broadcasting tower.
The GPS coordinates of the telecommunication tower are latitude N55.2280555555555 and longitude E24.8266666666666. The height of the area above sea level is 136 m. The height of the center of the antenna is 103 m above the ground and 239 m above sea level. Broadcast channels: 29 (538 MHz) and 32 (562 MHz), polarization H. Theoretical (declared broadcast antenna data, Table 1): Broadcast antenna Kathrein 770 881.

Table 1.
Theoretical Kathrein 770 881 antenna data.
Channels 29 and 32 were selected for the analysis of the broadcast antenna, Kathrein 770 881.
During the measurements, a real-time spectrum analyzer, BB60C, connected to a Raspberry Pi Foundation developed Raspberry Pi embedded computer was used. The embedded computer was connected to a digital data transmission system, allowing remote monitoring and control of the measurements. Specialized spectrum analyzer software was developed, to collect and transmit data to a ground station separate from the UAV control, as shown in Figure 7a.
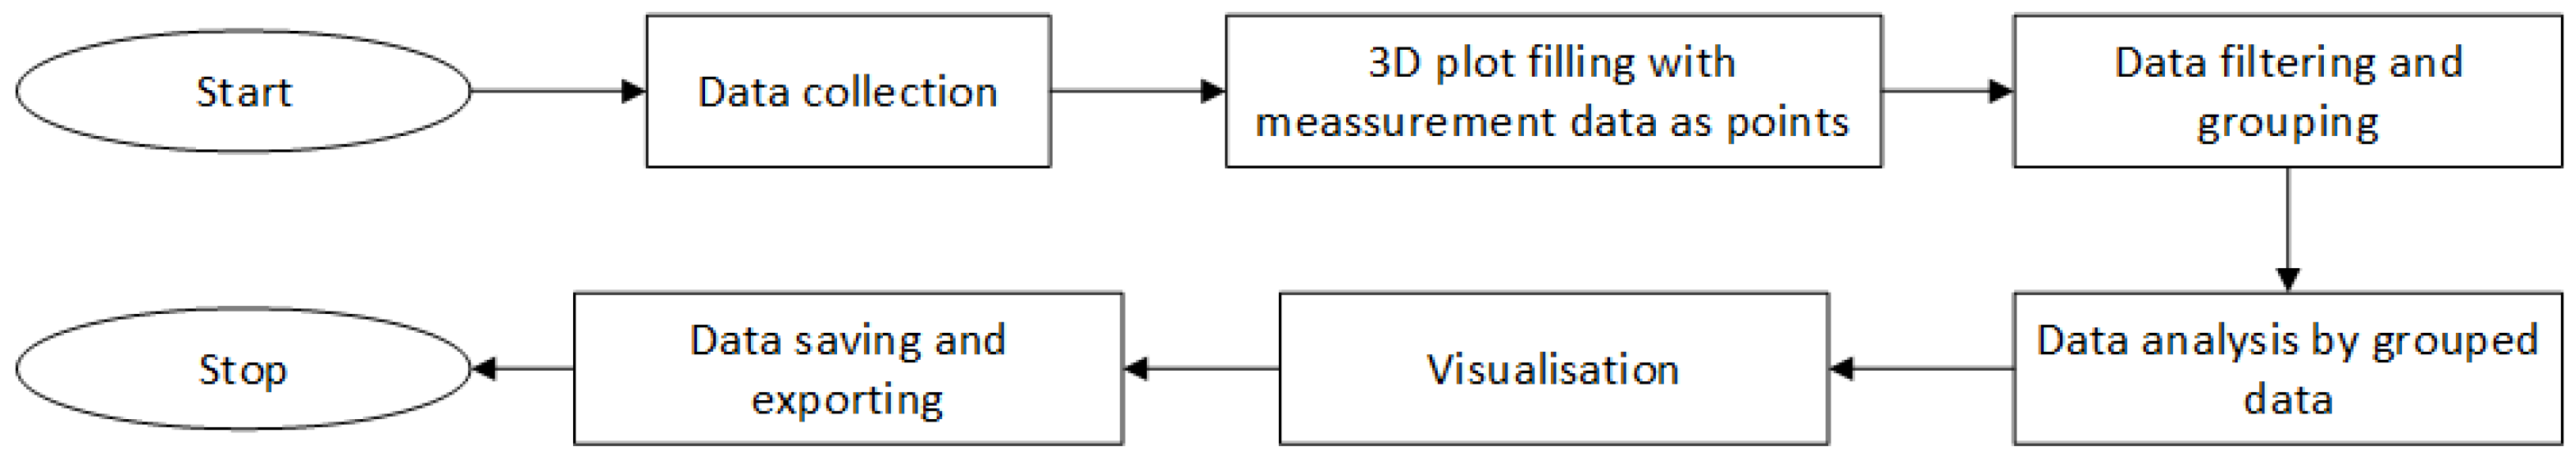
Since the measurement data were recorded at each measurement moment (approximately every 1 s) in different spatial positions, due to the flight characteristics of the UAVs, a new data processing and visualization algorithm had to be developed (see Figure 9):
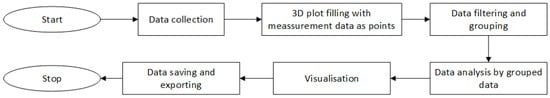
Figure 9.
Algorithm for data collection, analysis, and visualization.
The algorithm first takes the collected data and plots coordinate points in three-dimensional space, creating a flight map where each point stores the measurement result. In data analysis, possible random measurement errors are additionally evaluated, and potentially incorrect values are eliminated. Since the flight altitude and distance vary, the algorithm allows the assigning of measurement results according to the desired height and distance from the antenna. In the final step, the algorithm, as developed by the authors, can calculate the average electromagnetic field strength in dB values in the desired area or visualize the strength in space with colors depending on the measured instantaneous electromagnetic field strength. An example of a flight trajectory and the corresponding measured values in three-dimensional space is presented in Appendix A.
Our algorithm is unique because, unlike the reviewed works that mainly focused on image processing or simple classification tasks, it combines real-time drone flights with GPS-coordinated measurements of electromagnetic fields around telecommunication towers. Unlike laboratory-based or post-processed methods, our approach collects EM field data directly under real flight conditions, addressing dynamic environmental factors in situ—something not explored in the analyzed publications.
The stability of the UAV during flight can influence the accuracy of the measurements. Turbulence or slight movements can cause variations in the recorded data. But also, in this case, it cannot impact just one channel.
The drone itself can act as a physical obstruction, reflecting or blocking signals. This can lead to multipath propagation, where signals take multiple paths to reach the receiver, causing variations in the measured data. Drones flying close to the ground can exacerbate ground reflection effects. Signals bouncing off the ground can interfere with the direct signals, leading to inaccuracies in the measurements. The presence of a drone can alter the local environment, affecting factors like air pressure and temperature, which, in turn, can influence signal propagation.
3.1. Measurements of Channels 29 and 32
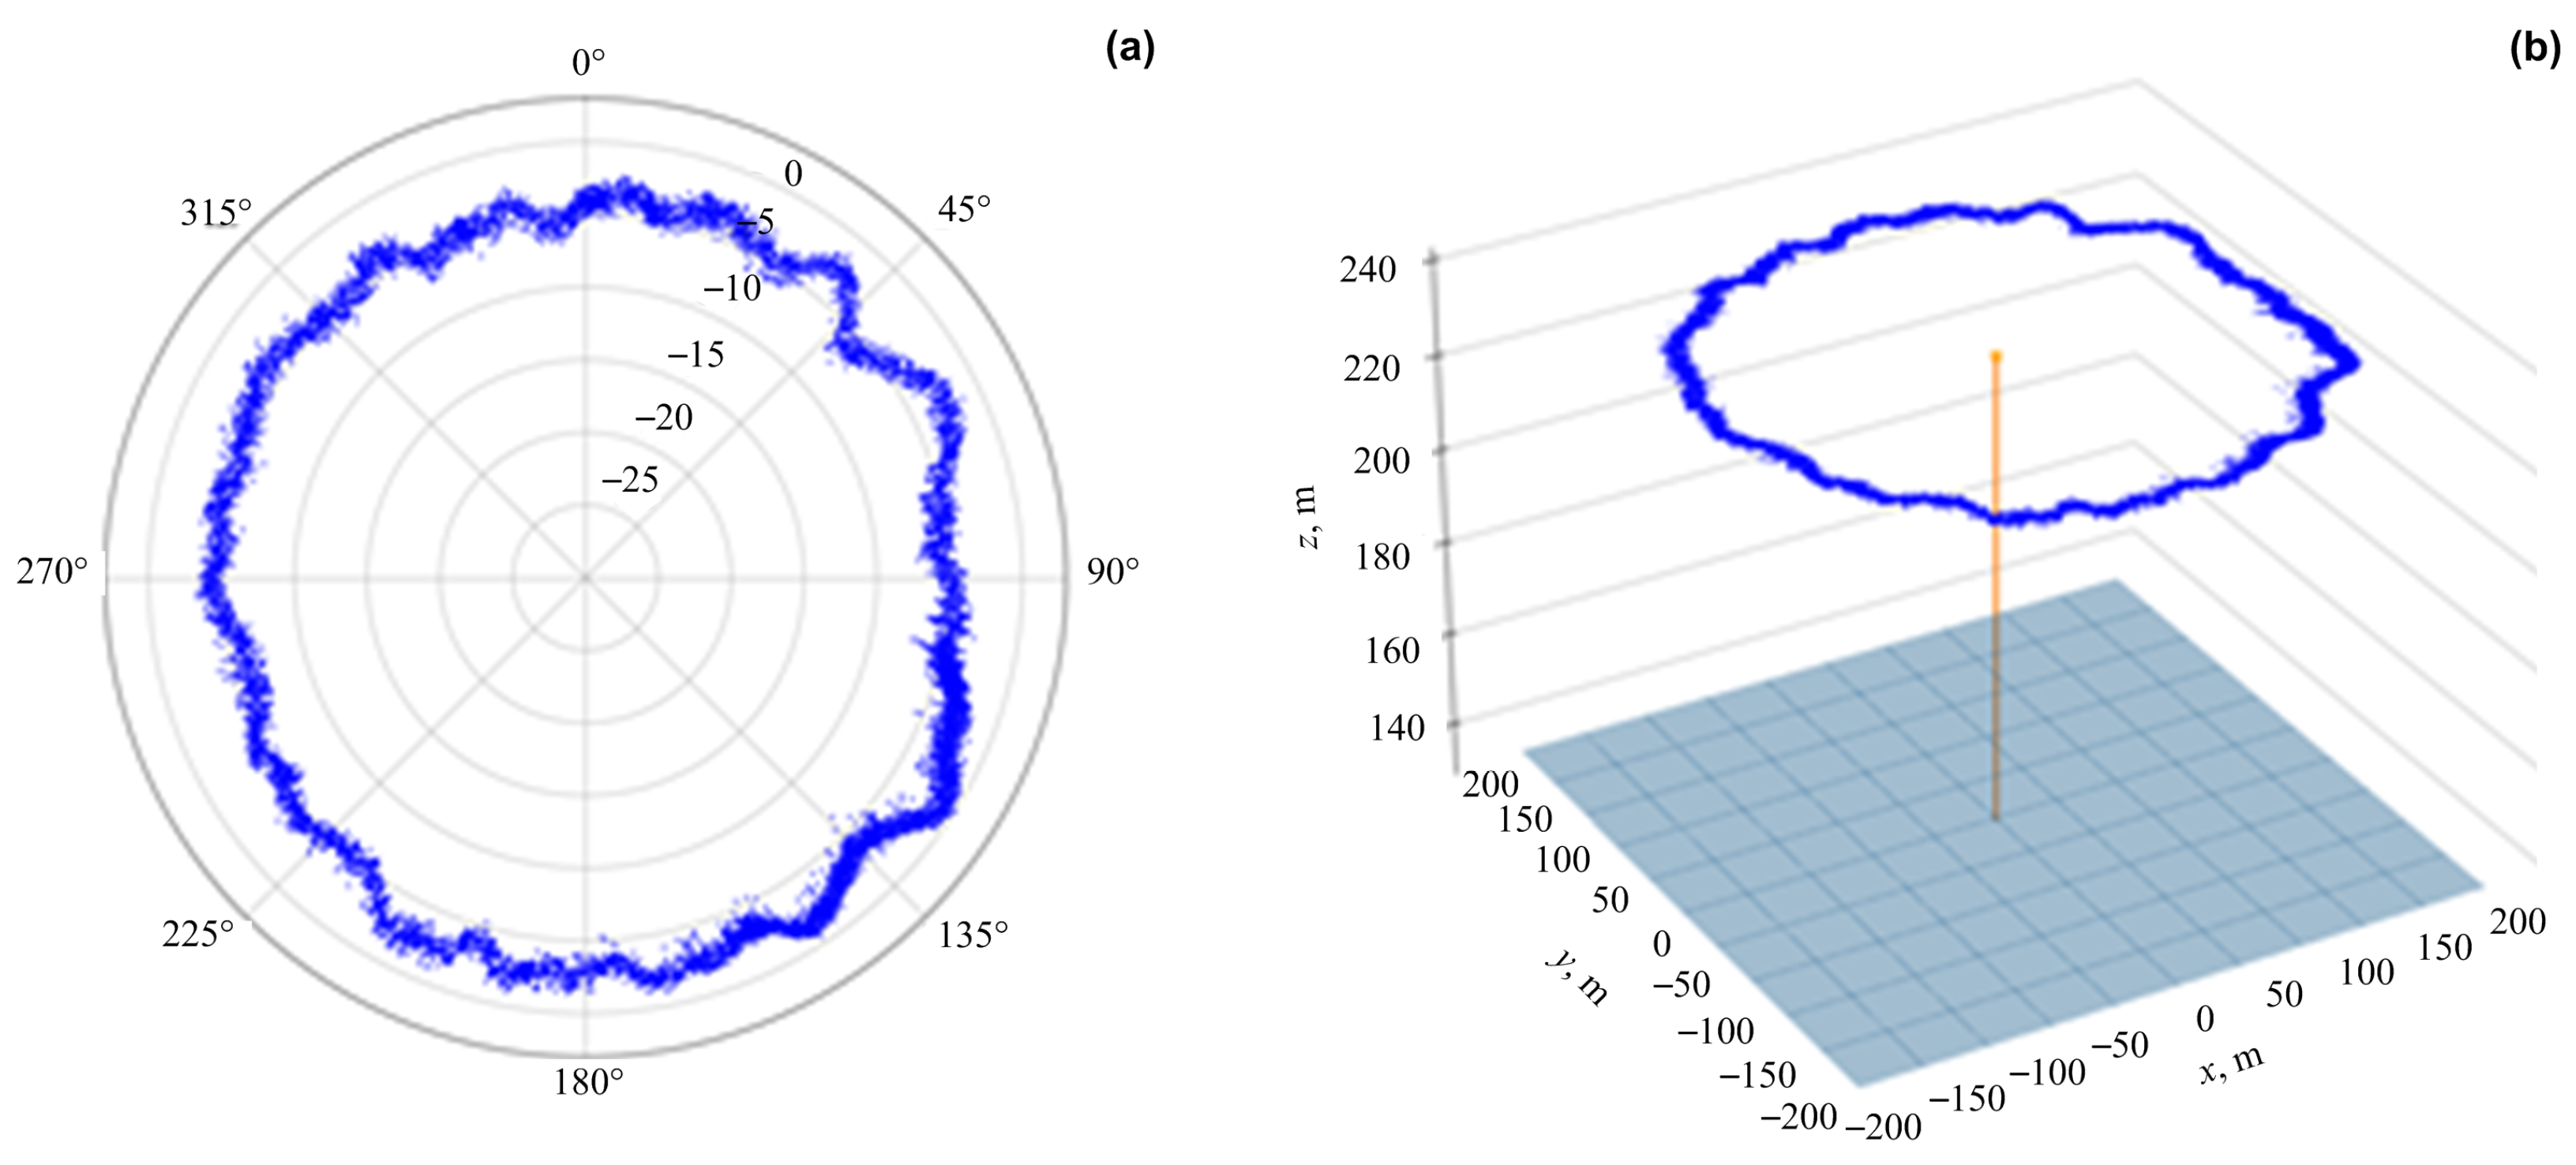
The initial antenna pattern measurement tests were conducted using a rotary-wing aircraft. Due to the limited flight time of the rotary-wing aircraft, in order to determine the maximum antenna radiation height (for further measurements) the first flight was performed by ascending vertically and measuring the antenna radiation. From the obtained results, it can be seen that the height of the main antenna lobe (maximum radiation) was 235 m above sea level, as shown in Figure 10a.
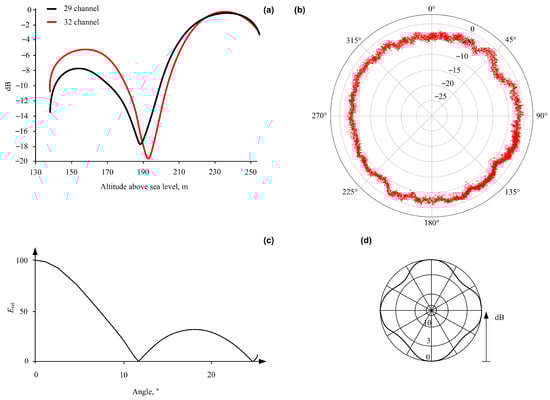
Figure 10.
(a) The maximum signal level was set at an altitude of 235 m. (b) A 2D diagram of the H-plane for channel 29 at a distance of 200 m from the tower. (c) Vertical radiation pattern. (d) Horizontal radiation pattern.
At the determined height (235 m), a flight was conducted around the antenna, recording the antenna radiation. The measurement results are presented in Figure 10b.
The antenna measurement results are difficult to compare to the theoretical because, according to the Kathrein 770 881 antenna description, the results are presented as the vertical radiation pattern’s dependence on angle and relative electric field strength (Figure 10c). Meanwhile, the directivity diagram of the Kathrein 770 881 antenna is shown in Figure 10d. Comparing Figure 10b and Figure 10d, it is evident that the directivity diagrams differ. This discrepancy arose because the signal strength was measured in dB at a distance of 200 m from the antenna, whereas the directivity diagram was theoretically obtained at two bays.
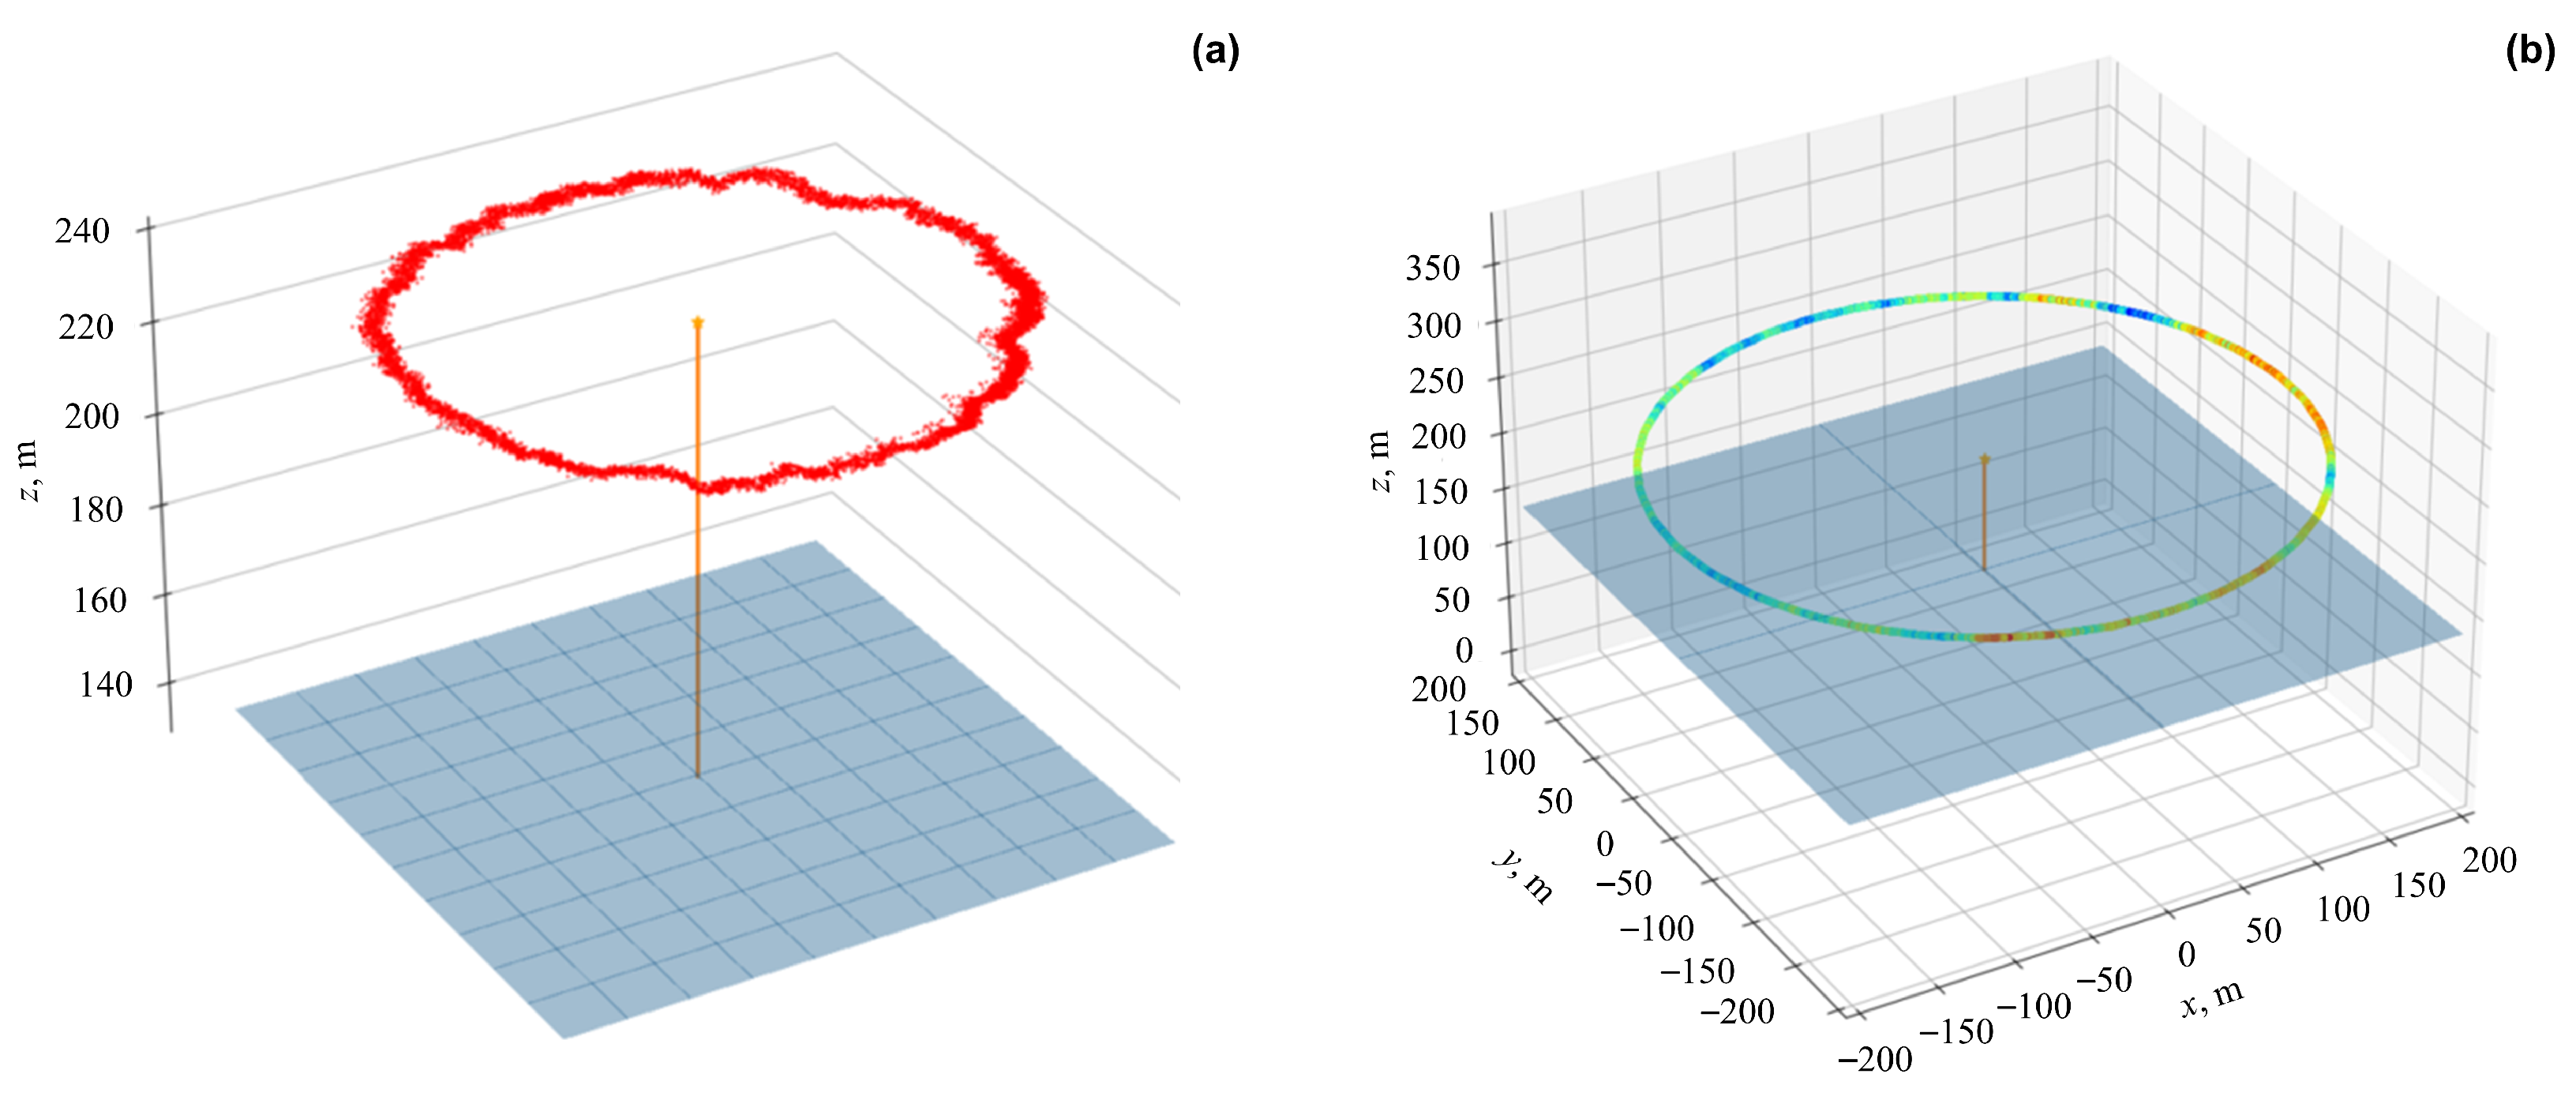
Three-dimensional diagrams of the H-plane for channel 29 at a distance of 200 m from the tower and with a focus on flight accuracy are presented in Figure 11a and Figure 11b, respectively.
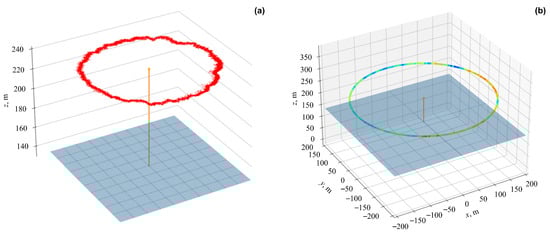
Figure 11.
(a) A 3D diagram of the H-plane for channel 29 at a distance of 200 m from the tower. (b) A 3D diagram of the H-plane for channel 29 at a distance of 200 m from the tower, focusing on flight accuracy.
Based on the general specifications for similar Kathrein antennas, the largest dimension is typically around 1.5 m. For example, using the 4G LTE frequency range (700 MHz to 2600 MHz), it is possible to calculate the far field distance for the lowest and highest frequencies using the speed of light constant c in meters per second unit and frequency f in Hz. For 700 MHz, the wavelength and the far field distance is equal to . Meanwhile, for 2600 MHz and .
The far field distance for the Kathrein 770 881 antenna operating in the 4G LTE frequency range is approximately between 10.5 m and 39 m, and our measurements fully covered the area of interest.
Thus, to measure the antenna pattern using a rotary-wing drone, it was necessary to perform at least two flights:
- A flight ascending vertically, to measure the radiation extremum along the vertical axis.
- At the determined height, a circular flight around the antenna was performed, with the drone continuously oriented towards the antenna.
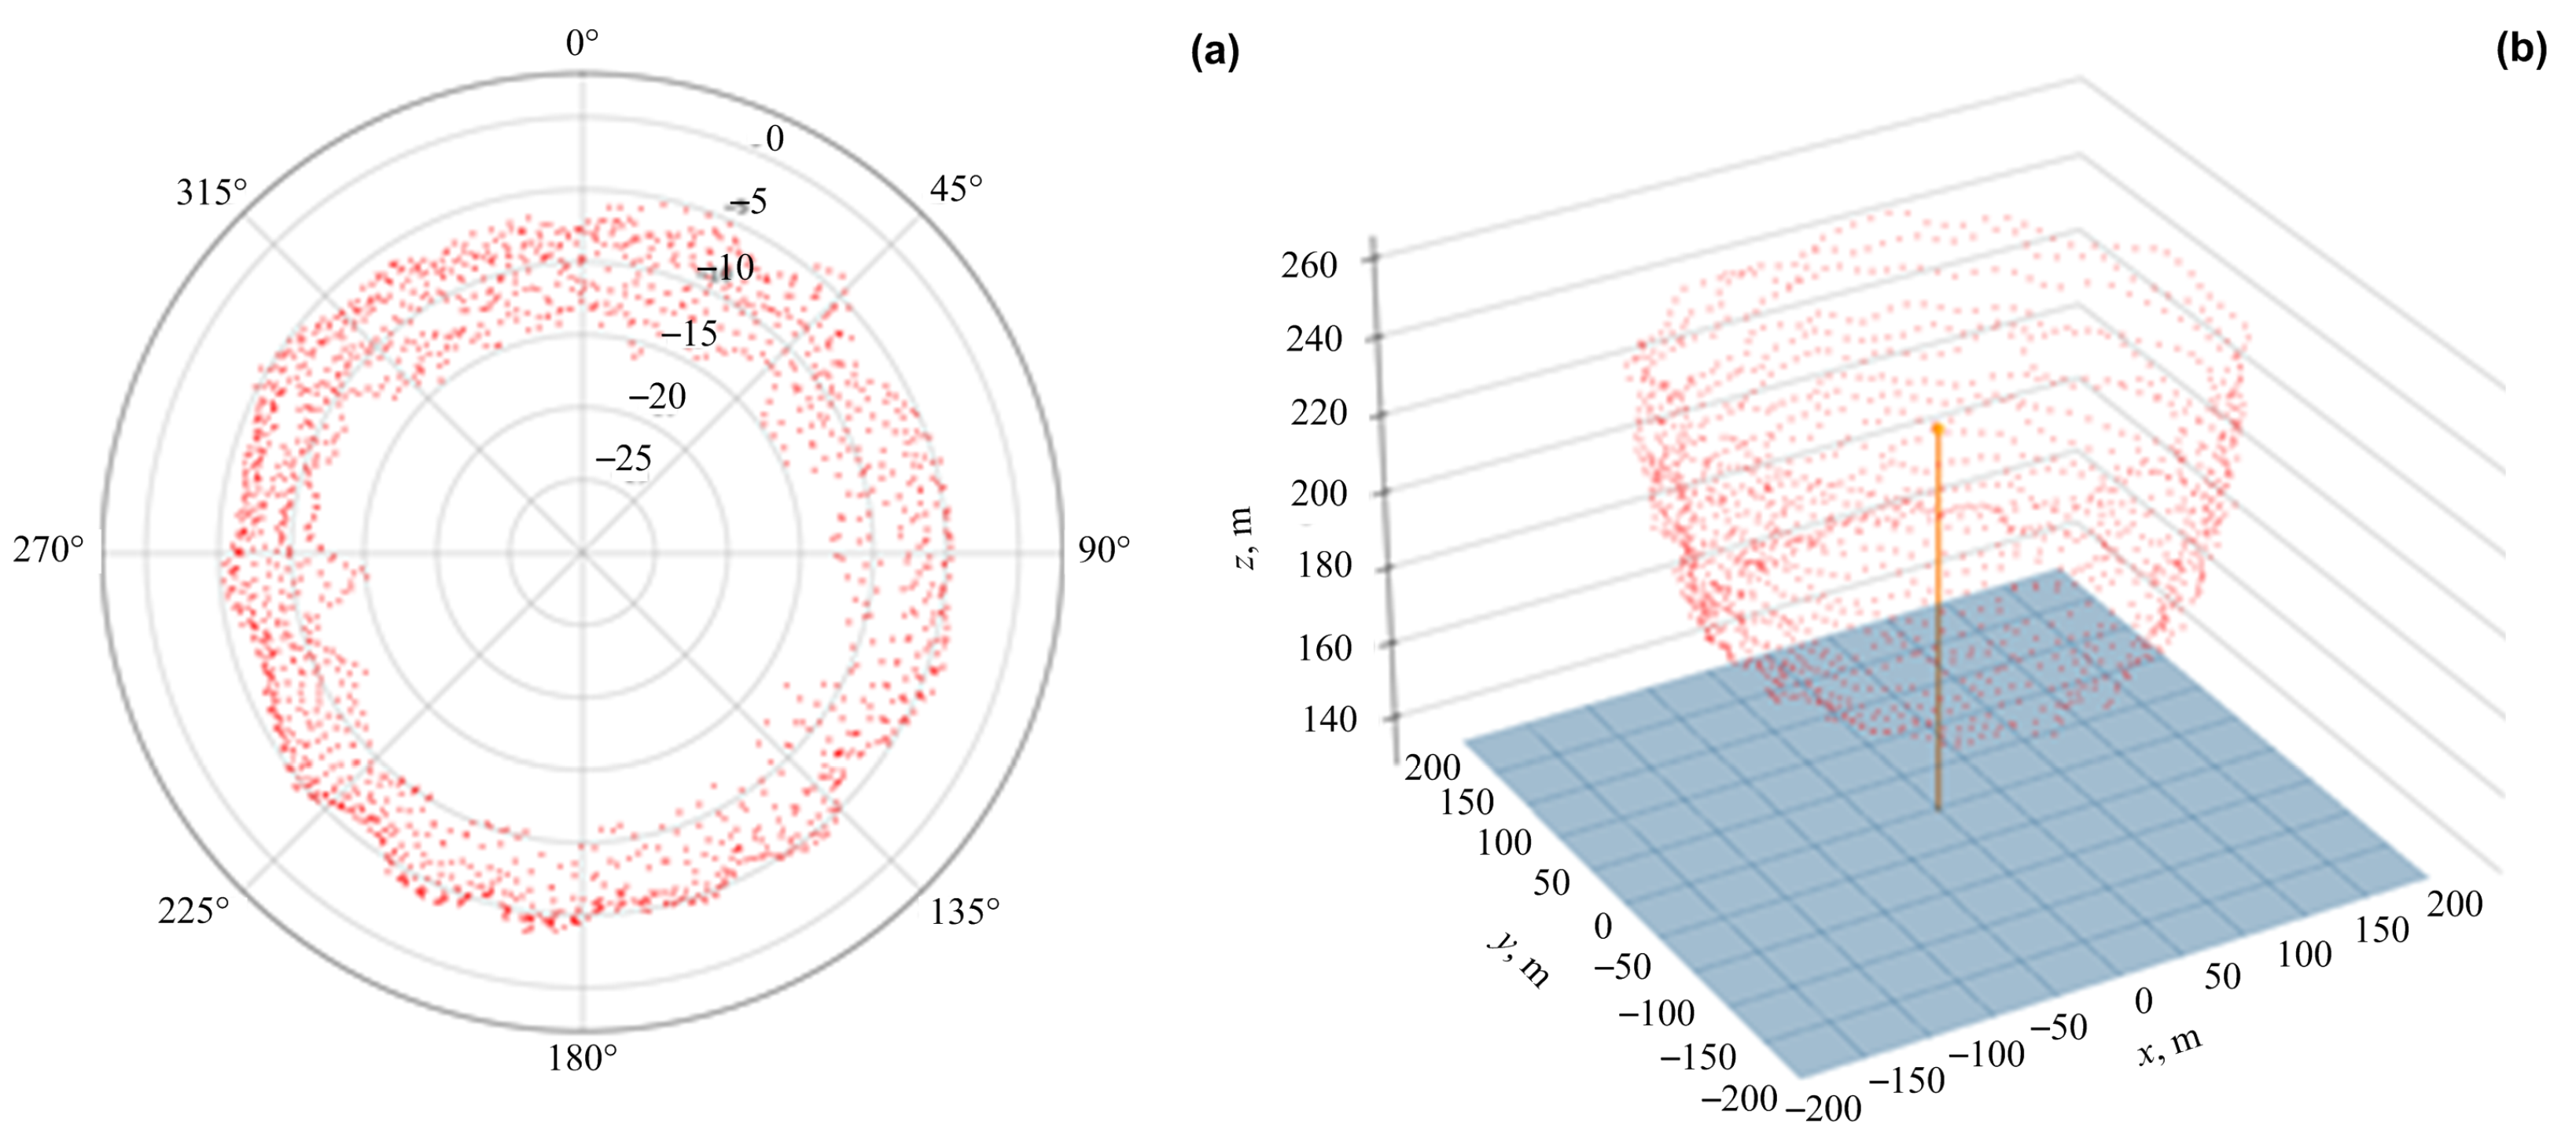
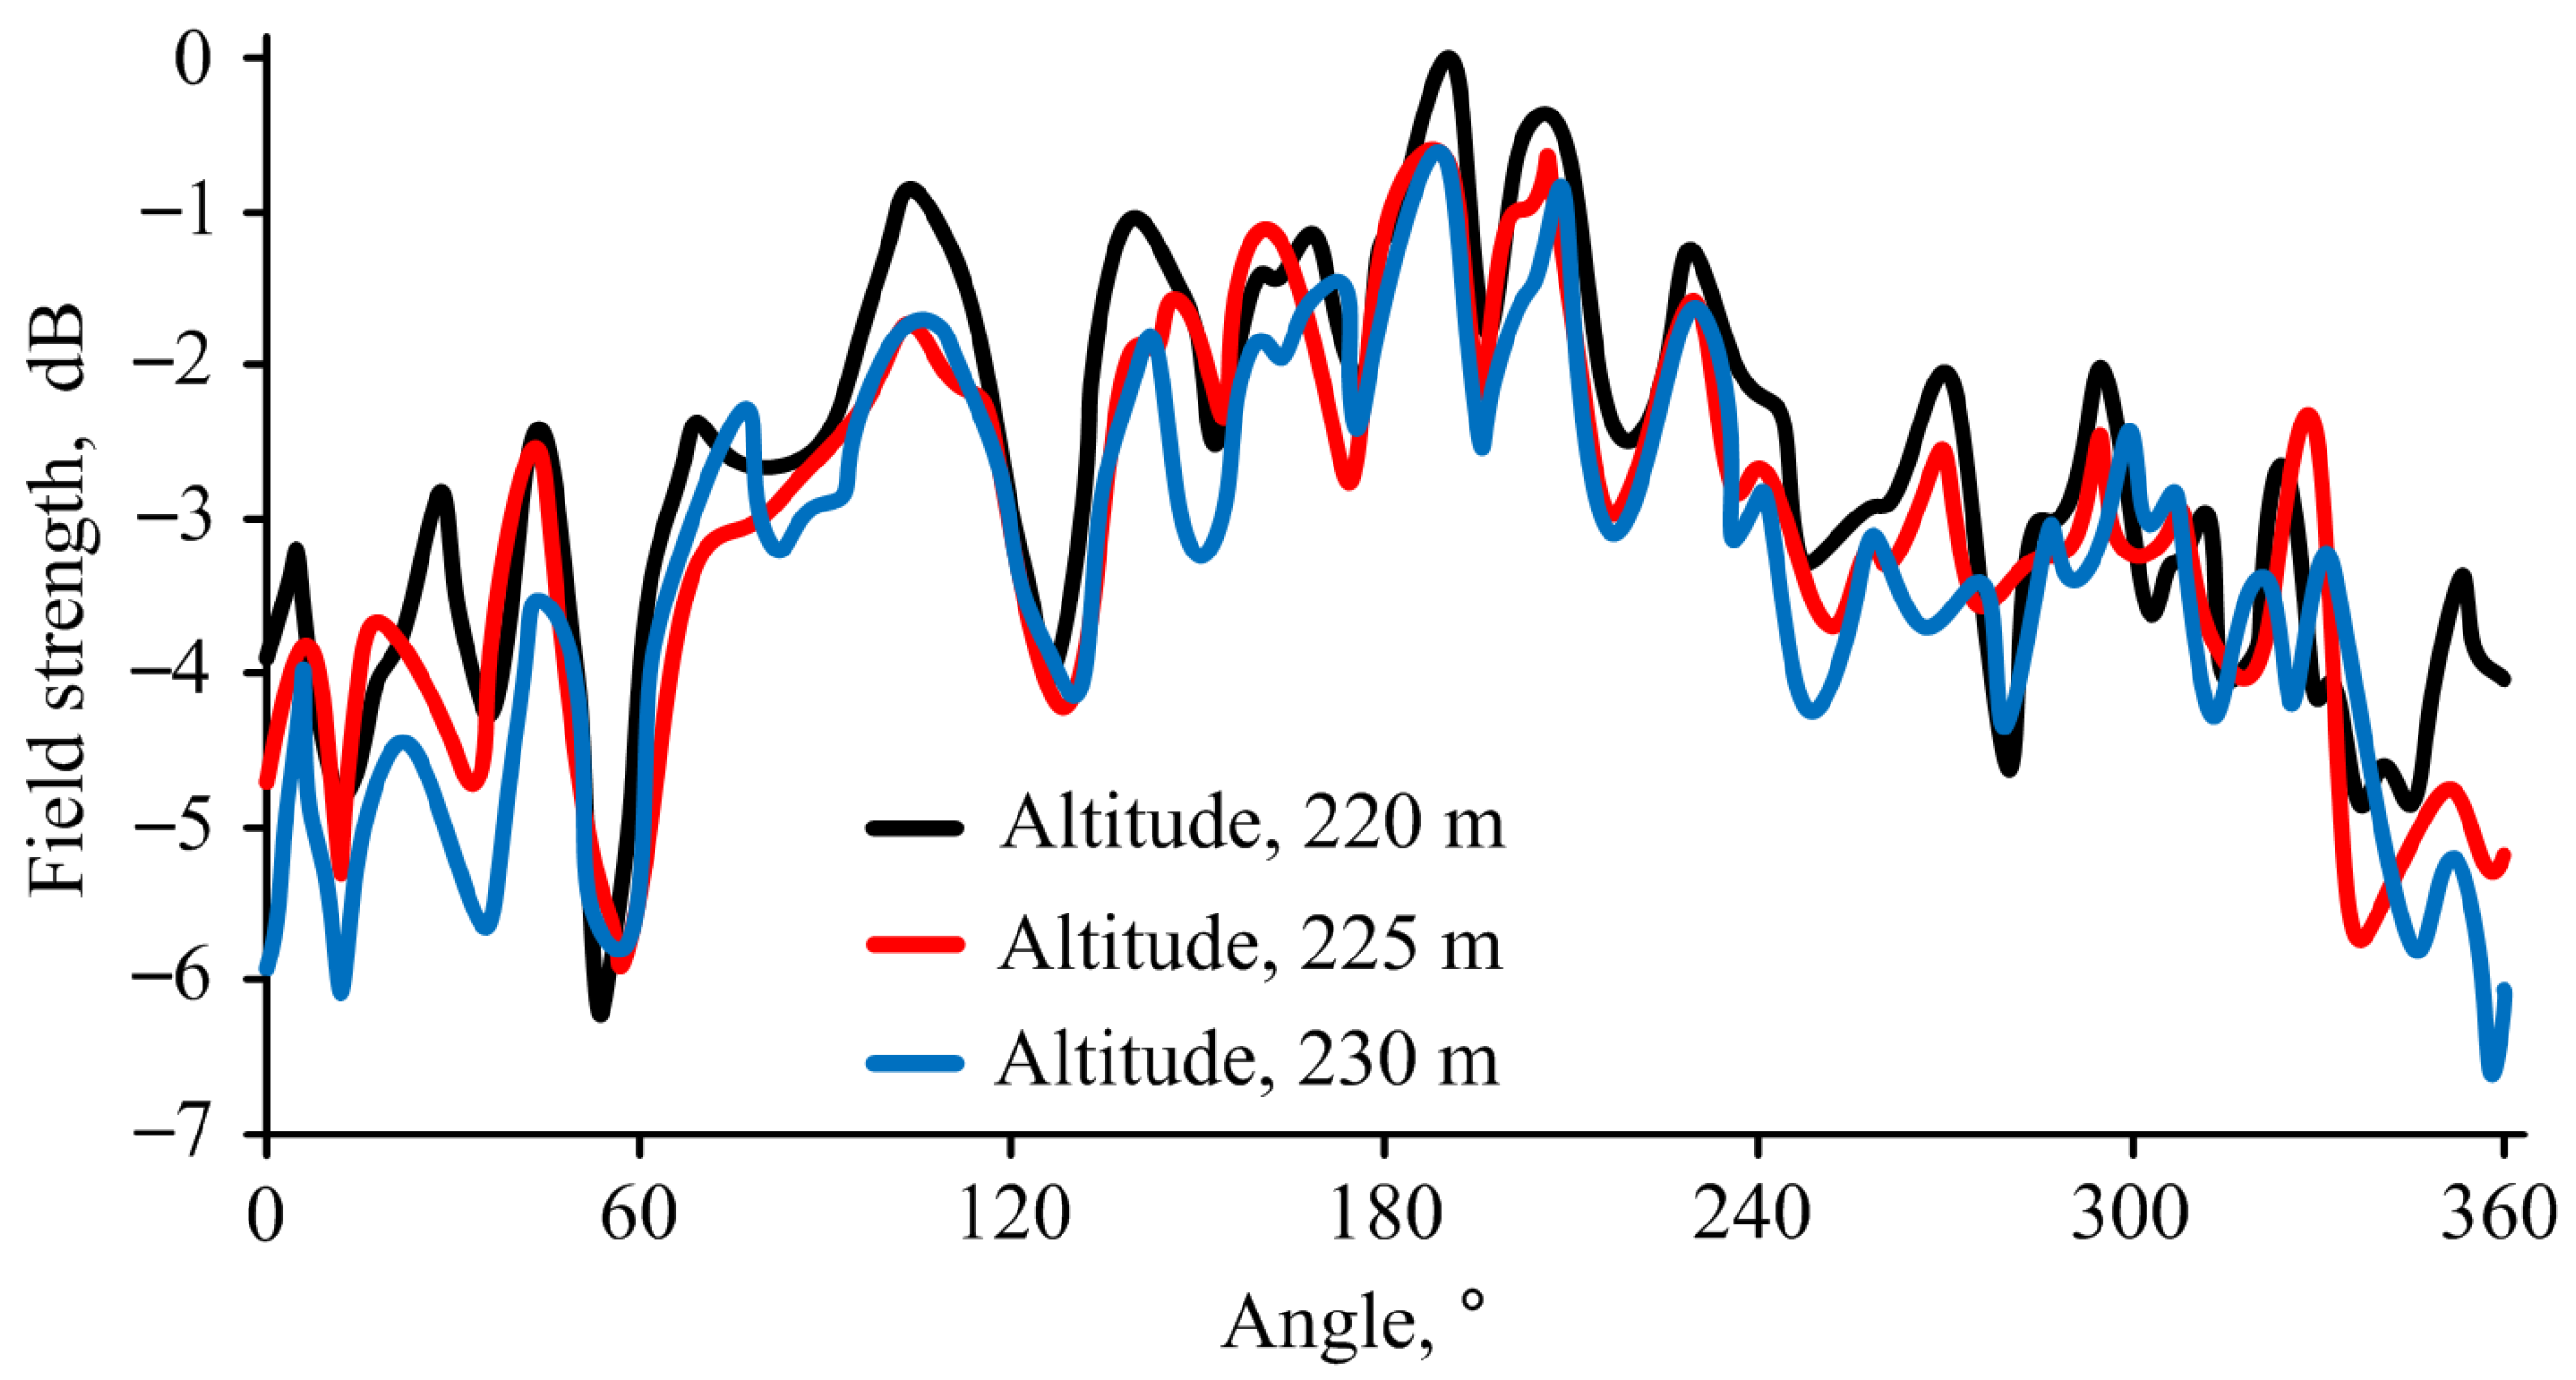
Measurements of the same antenna were also carried out, using a fixed-wing aircraft flying around the antenna at a fixed radius (330 m) but at different altitudes (in 5 m increments). Due to the high flight speed and long flight duration of the aircraft, it was possible to complete many circles around the antenna and collect a large amount of data at different altitudes, thereby creating a 3D antenna pattern, as shown in Figure 12:
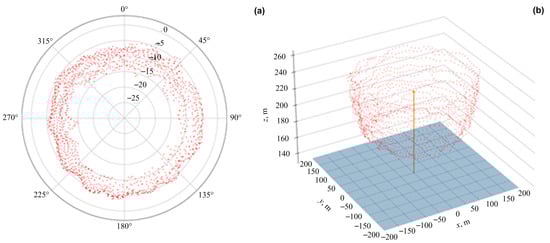
Figure 12.
(a) H-plane diagram for channel 29 at a distance of 330 m from the tower (airplane, altitudes ranging from 190 m to 250 m, step of 5 m), 2D diagram. (b) H-plane diagram for channel 29 at a distance of 330 m from the tower (airplane, altitudes ranging from 190 m to 250 m, step of 5 m), 3D diagram.
As seen from the provided examples, when using a fixed-wing aircraft, due to its high flight speed (and high measurement speed), it is not necessary to perform a vertical flight to determine the height of the antenna’s radiation maximum. It is sufficient to fly a sufficient number (10–20) of circles around the antenna at different altitudes, thereby obtaining the antenna’s 3D pattern, as shown in Figure 13:

Figure 13.
H-plane diagram for channel 29 at a distance of 330 m from the tower.
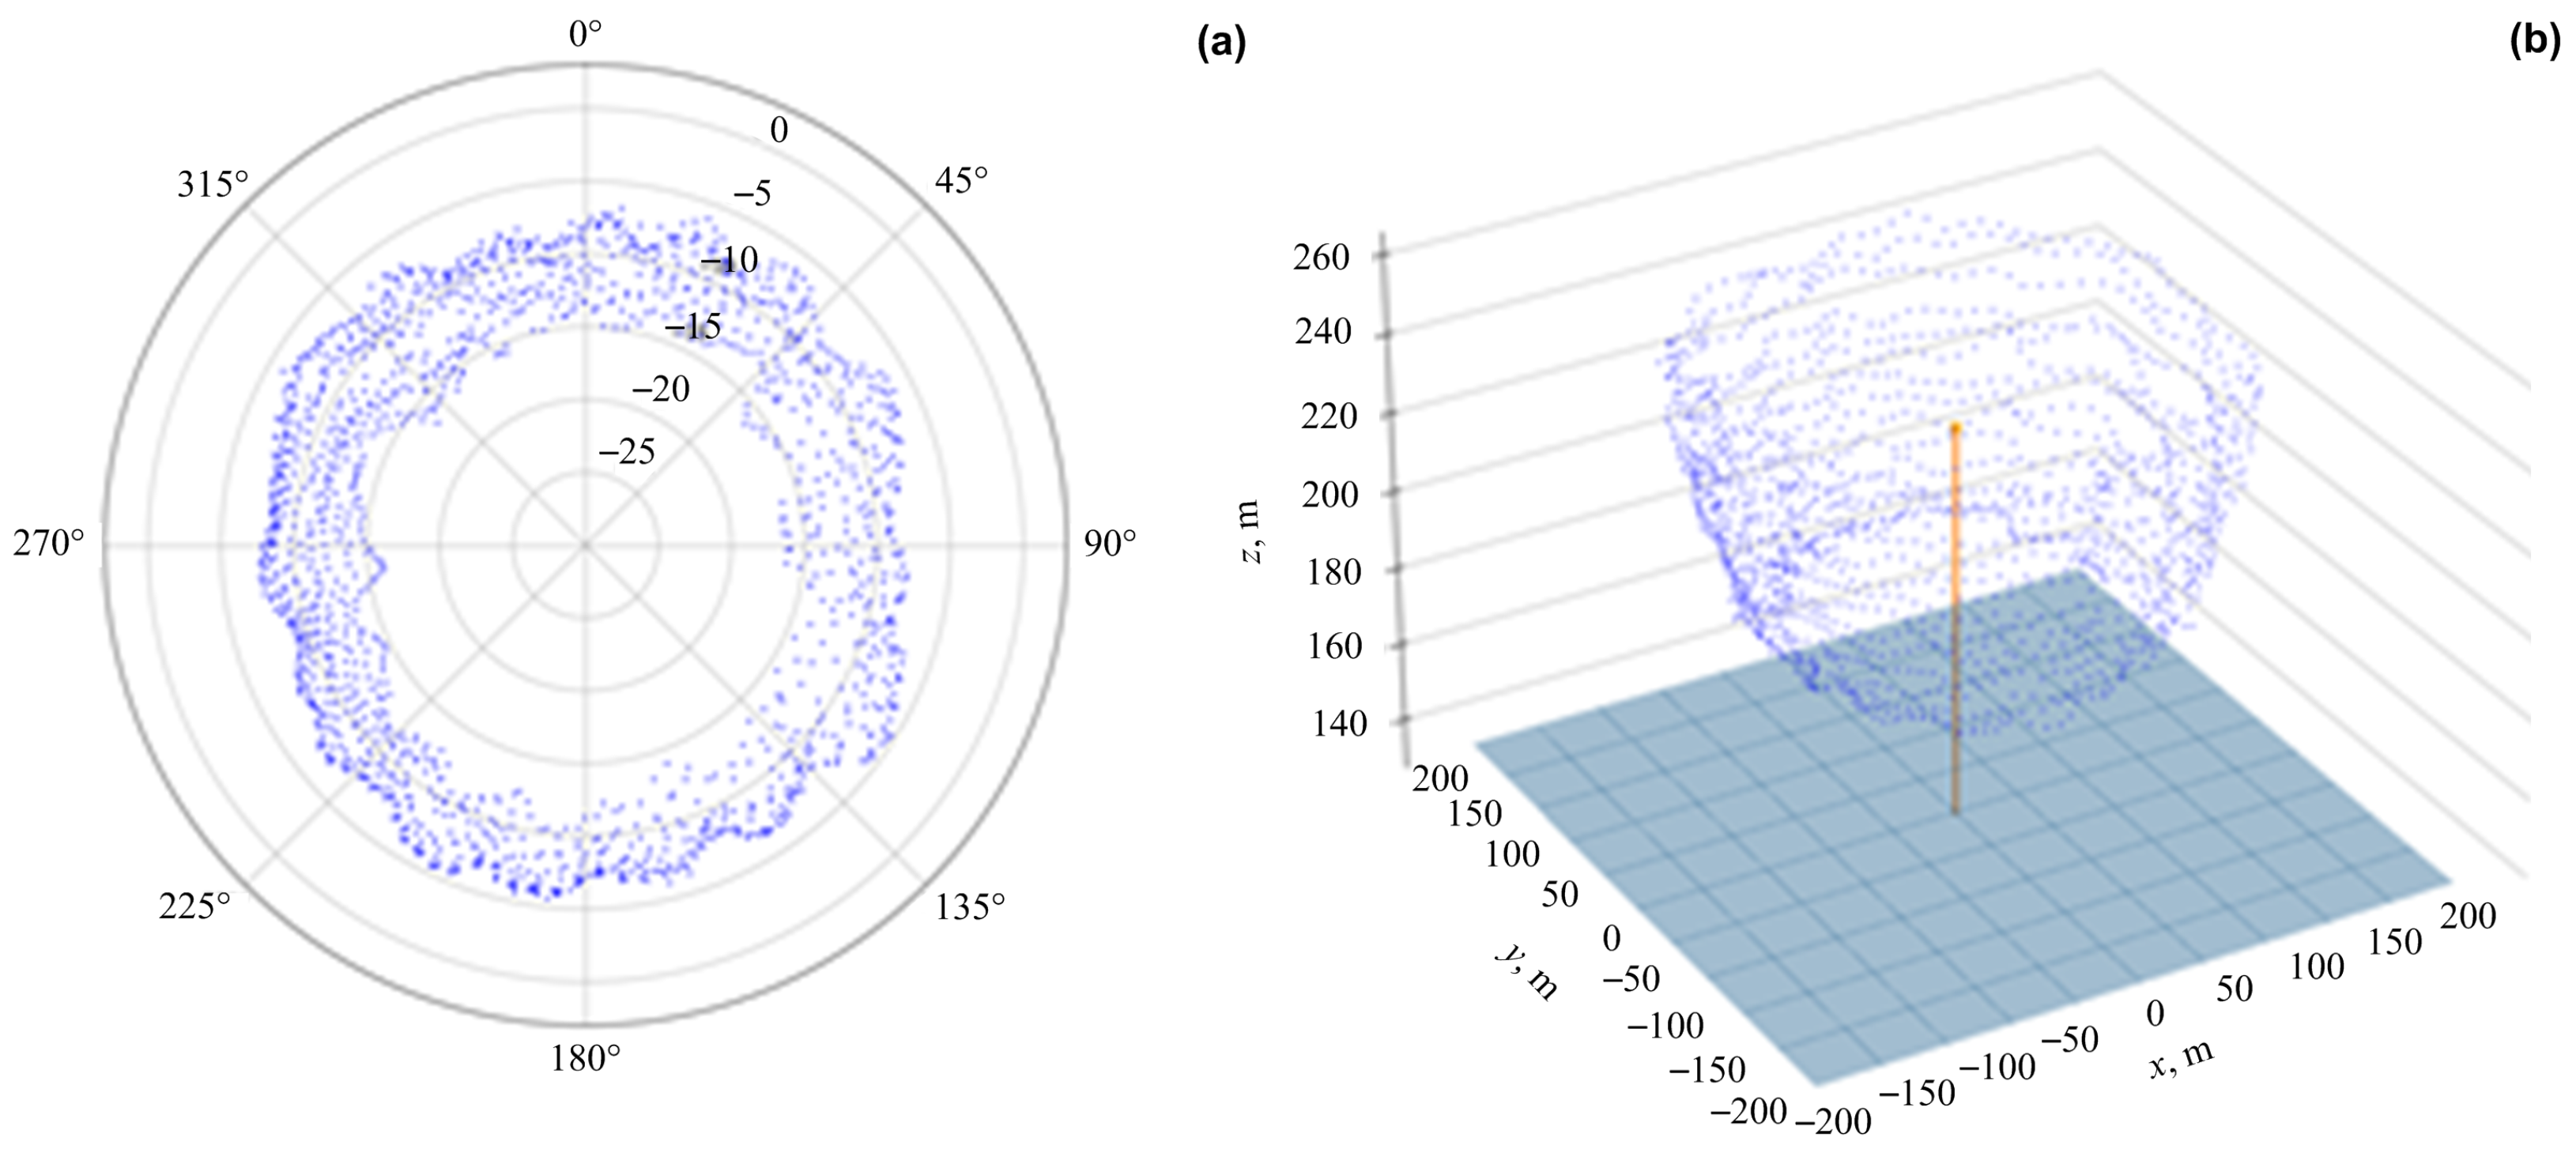
3.2. Measurement of Channel 32
Identical measurements were also carried out with the channel 32 antenna. Channel 32 H diagrams, 2D and 3D, at a distance of 200 m from the tower, are presented in Figure 14:
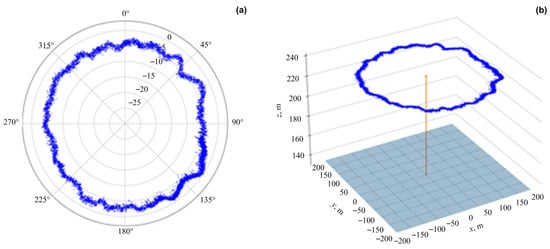
Figure 14.
(a) The channel 32 H diagram at a distance of 200 m from the tower, 2D diagram. (b) The channel 32 H diagram at a distance of 200 m from the tower, 3D diagram.
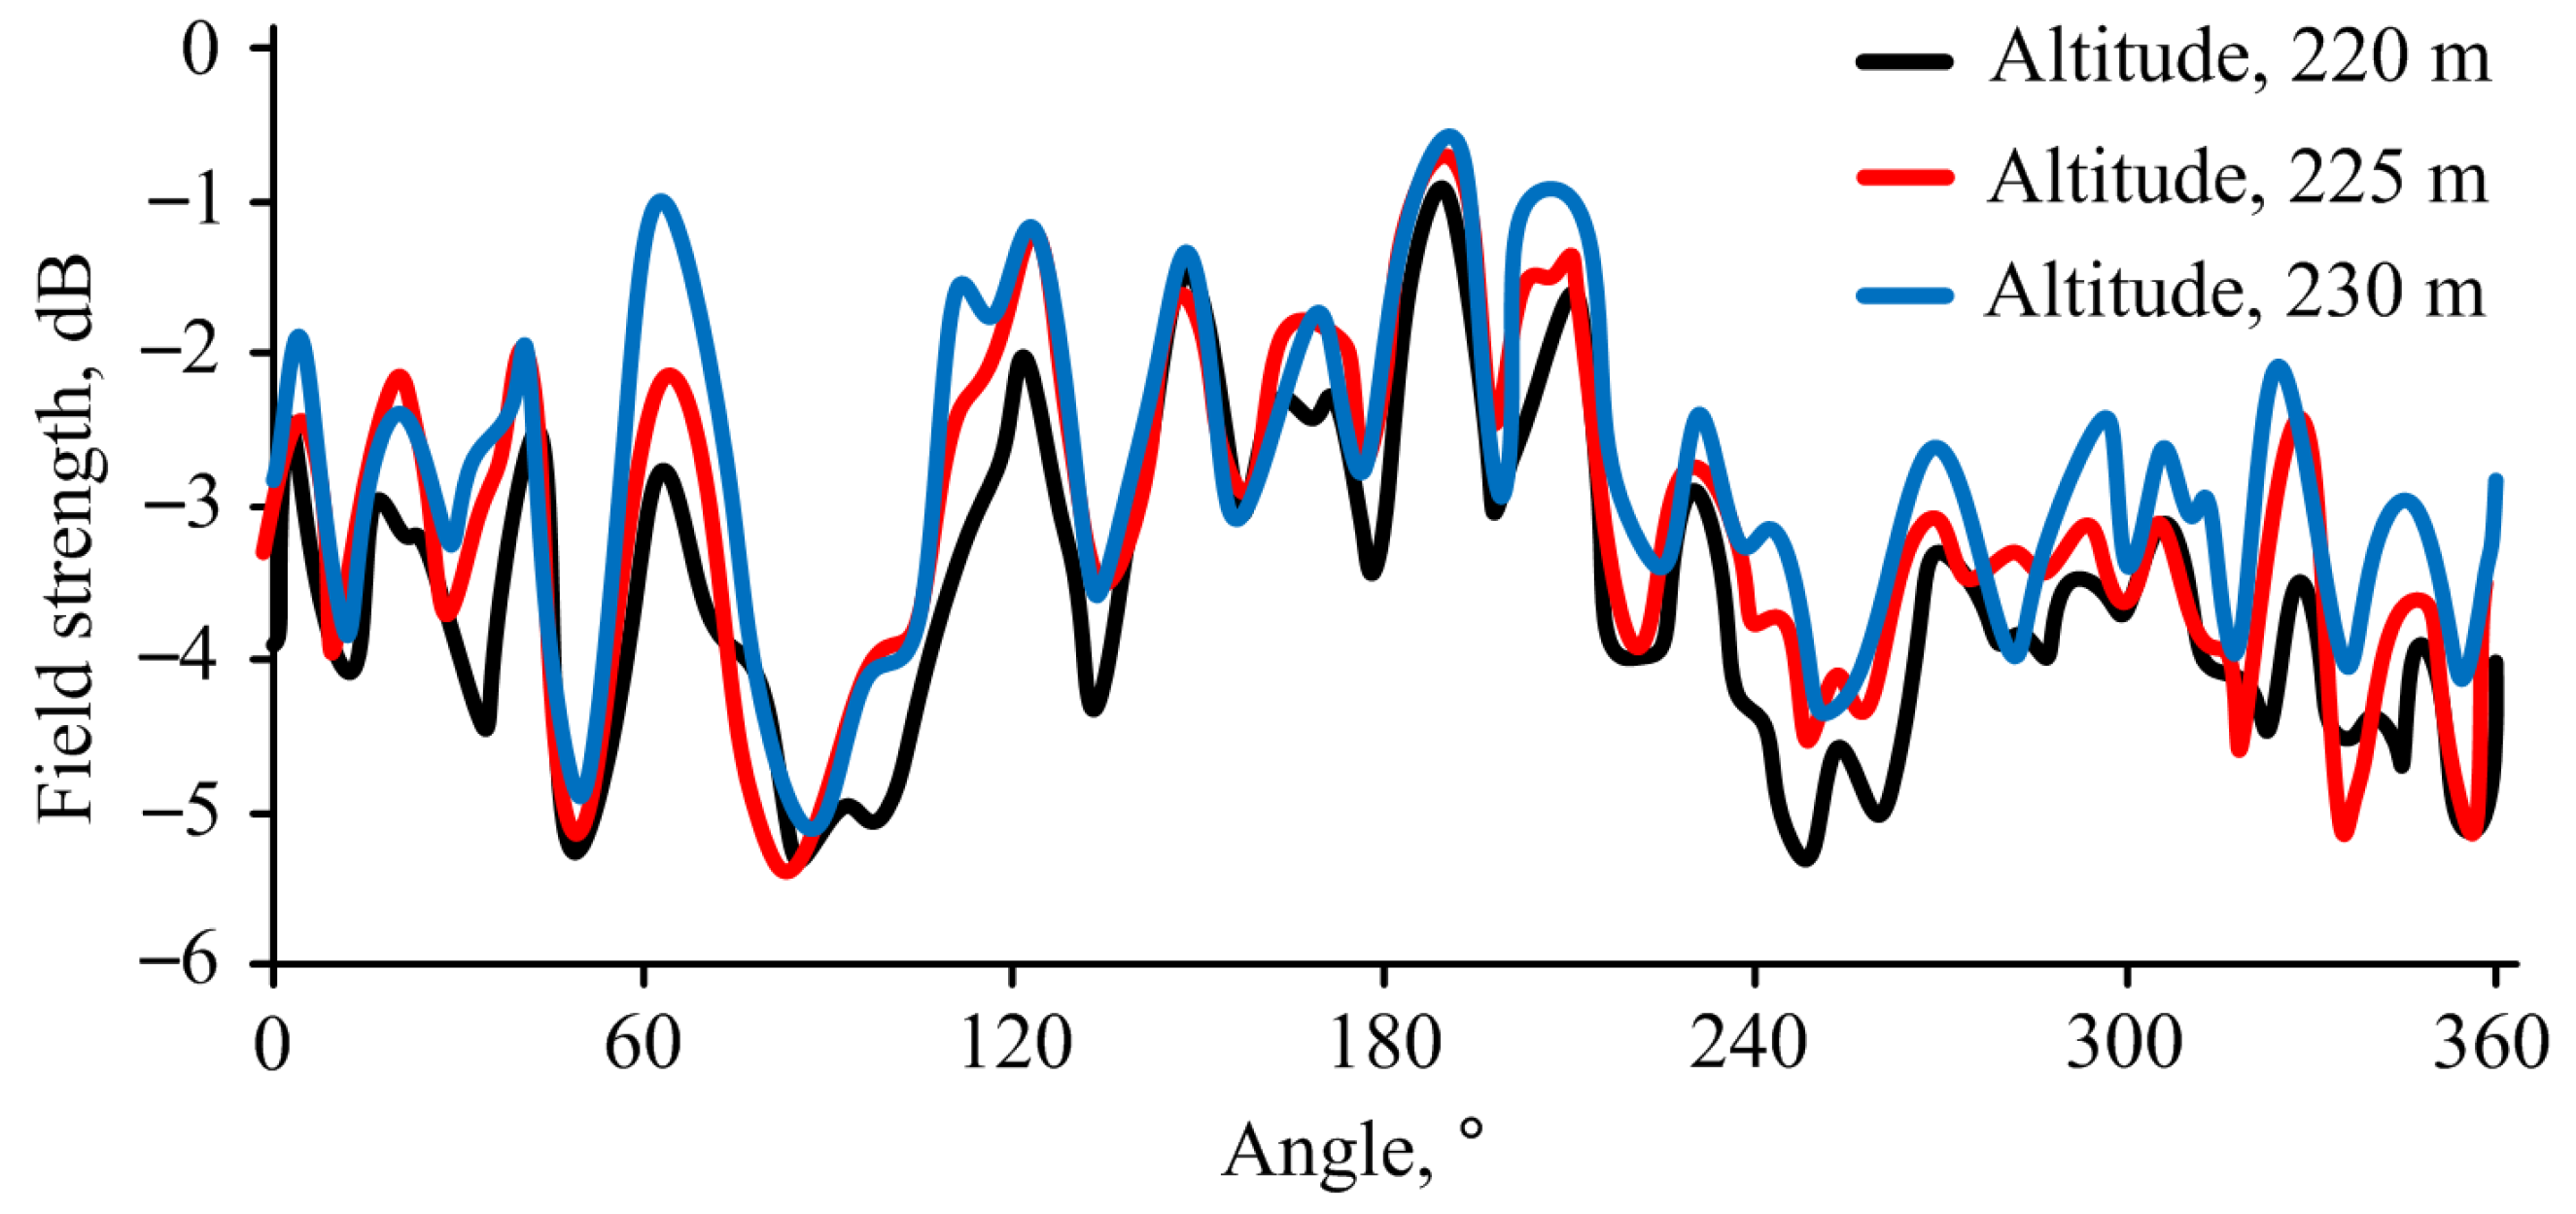
Identical measurements were also carried out using a fixed-wing aircraft; the results of the measurements are presented in Figure 15:

Figure 15.
(a) H-plane diagram for channel 32 at a distance of 330 m from the tower (airplane, altitudes ranging from 190 m to 250 m, step of 5 m), 2D diagram. (b) H-plane diagram for channel 32 at a distance of 330 m from the tower (airplane, altitudes ranging from 190 m to 250 m, step of 5 m), 3D diagram.
A channel 32 H diagram at a distance of 330 m from the tower is presented in Figure 16:
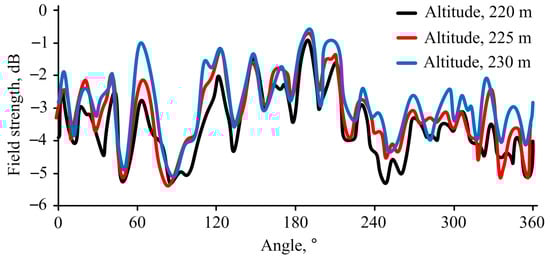
Figure 16.
Channel 32 H diagram at a distance of 330 m from the tower.
4. Discussion
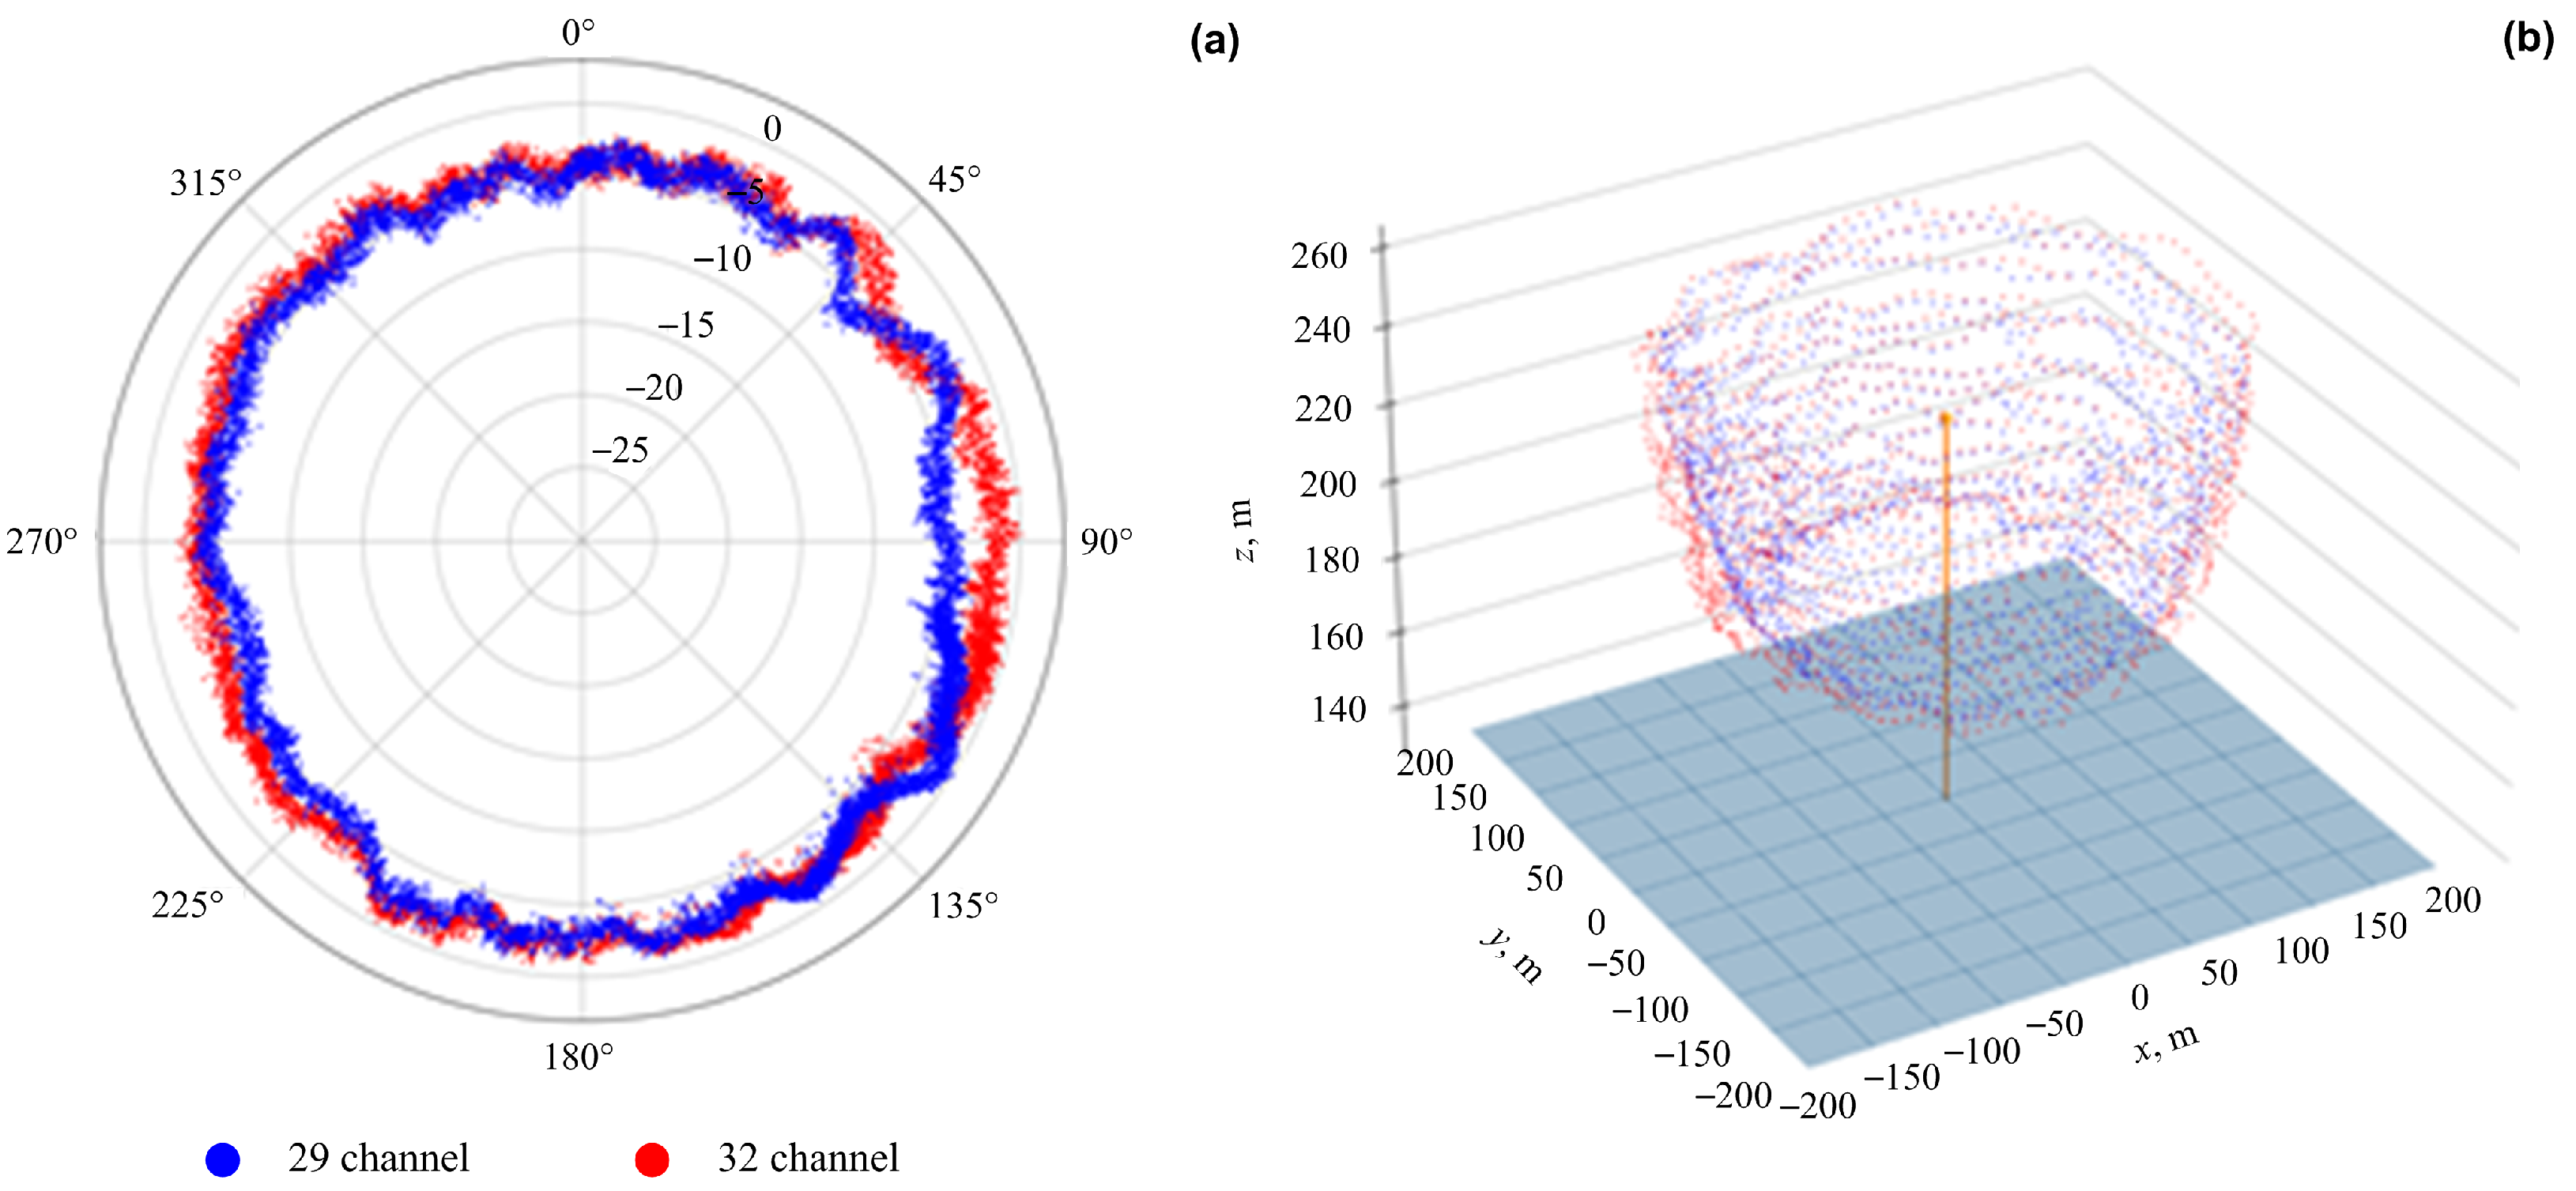
When conducting repeated measurements, the maximum discrepancy in the results was up to 1 dB. This indicates that the results could vary by as much as 1 dB between different measurements. In all cases, the results of the practical measurements differed significantly from the theoretically presented antenna gain data. This is interesting, because the measurements where performed in a clean environment, and no obvious physical obstruction, weather condition, multipath, or electromagnetic or frequency interference was observed at the UAV’s flight altitude. Two-dimensional channel 29 and channel 32 H diagrams at a distance of 200 m from the tower, 235 m height are presented in Figure 17a. Three-dimensional 29 channel 29 and channel 32 H diagrams at a distance of 330 m from the tower (airplane, radii from 190 m to 250 m, step 5 m) are presented in Figure 17b:

Figure 17.
(a) Two-dimensional channel 29 and channel 32 H-plane diagrams at a distance of 200 m from the tower. (b) Three-dimensional channel 29 and channel 32 H-plane diagrams at a distance of 330 m from the tower (airplane, altitudes ranging from 190 m to 250 m, step of 5 m).
As seen from the provided data, the obtained results varied for different channels and significantly differed from the theoretically presented antenna data. The H-plane radiation pattern plots show how the antenna radiated in the horizontal plane. The directional behavior in Figure 17a indicates variations in radiation intensity around the antenna. A more uniform or expected shape (e.g., circular or smooth lobes) suggests good antenna performance. The 3D plot in Figure 17b shows the radiation pattern in space, helping to visualize coverage at a given height and distance. Irregularities (small fluctuations in red and blue curves) suggest signal variations or potential interference.
The red color pattern is symmetrical and smooth, indicating stable radiation and proper design. There are no large distortions or unexpected nulls (areas with weak signals). The radiation coverage was consistent with the expected range.
There are significant asymmetries or distortions in the blue pattern, which could mean environmental interference, misalignment, or hardware issues. The signal fluctuated excessively between channels (seen in the red vs. blue differences). The coverage area was too narrow or scattered, reducing effective transmission.
The antenna radiation patterns appear mostly stable, but small fluctuations suggest minor variations in propagation. If these variations impact communication quality, further tuning or adjustments might be needed (e.g., modifying positioning, power levels, or interference mitigation). More detailed analysis with additional parameters (e.g., gain, beamwidth, side lobes, and efficiency) would be required, to fully assess the performance.
The authors defined the following systematic directions for analysis: Measurement Errors, Environmental Interference, Antenna Performance Issues, Experimental Setup and Methodology, and Theoretical Model Limitations.
In any case, weather conditions, such as variations in temperature, humidity, and atmospheric pressure, can affect signal propagation. During the experiments, the weather conditions were stable without significant changes. Physical obstructions like buildings, trees, and other structures can cause reflections, diffraction, and scattering of electromagnetic waves. We checked for such conditions and did not find any significant possible interference obstacles. Other electronic devices and communication systems operating in the vicinity can introduce noise and interference. We used a 5.8 GHz communication frequency between the drone and the base station. Harmonics can influence slightly; however, the signal strength from the telecommunication antenna and the drone differ significantly and cannot have great influence. A systematic analysis of each of these factors, including controlled experiments and detailed error analysis, is provided, to identify and mitigate the specific causes of the discrepancies.
Measurement errors can arise from several sources. Inaccurate calibration of the spectrum analyzer, antennas, and other measurement equipment can lead to erroneous readings. Issues with data-logging software or hardware malfunctions can result in incorrect data capture. Inaccurate positioning of the UAVs, despite using RTK GNSS systems, can lead to discrepancies in the measured data.
The actual performance of the antennas may differ from their theoretical specifications, due to variations in the manufacturing process, which can lead to differences in antenna performance. Improper installation or alignment of the antennas on the UAVs can affect their radiation patterns. Over time, antennas may degrade, due to environmental exposure, leading to performance deviations.
The experimental setup and methodology can also contribute to the observed differences. For example, variations in the UAV flight path and altitude can lead to inconsistent measurements. The algorithms used for data processing and visualization may introduce errors if not properly validated. The frequency and timing of data sampling can affect the accuracy of the measurements.
The theoretical models used to predict antenna performance may have inherent limitations. Theoretical models often rely on simplified assumptions that may not fully capture real-world complexities. Variations in the dielectric properties of the ground, buildings, and vegetation can affect signal propagation in ways not accounted for in the theoretical models.
To protect against distortions in electromagnetic field measurements using drones around telecommunication antennas, especially when signals are transmitted and received during UAV operations, we took several measures. Firstly, we ensured that the drone’s remote-control signals and the telecommunication antenna signals operated on different frequency bands. This helped to avoid frequency overlap and reduced the likelihood of interference. Secondly, we optimized the drone placement, whereby it was strategically positioned to minimize signal overlap. We avoided flying drones too close to antennas or other sources that could cause electromagnetic interference. Also, it was necessary to consider using dual-frequency devices that operated on multiple frequencies. This provided more flexibility and reduced the chances of interference. Lastly, we continuously monitored and analyzed interference, to quickly respond to any changes. This helped maintain measurement accuracy and reduced the impact of interference.
5. Future Work
In future work, we plan to design and test a larger (more suitable for measurements) hexacopter unmanned aircraft, conduct experiments with measurement equipment, perform radiation measurements of mobile communication systems, and evaluate the shortcomings of radiation measurement equipment. Additionally, efforts will be made to develop, improve, and enhance the operation of the ground station.
Here are the key points that support the future and current evaluation methods:
- In addition to radiation characteristics, we could measure signal quality metrics, such as Signal-to-Noise Ratio (SNR), Bit Error Rate (BER), and throughput. These metrics should provide a more holistic view of the base station’s performance and its ability to maintain high-quality communication.
- Our experiment included real-time monitoring of the base station’s performance, allowing us to detect and address issues promptly. This dynamic approach ensures that performance evaluations are not static and can adapt to changing conditions.
- Furthermore, it is possible, with the help of mobile operators, to evaluate the base station’s performance under different user densities and traffic loads. This aspect is critical, as it reflects real-world usage and helps in assessing the base station’s capacity to handle peak loads.
6. Conclusions
The hardware system for the data collection and analysis of the antenna radiation measurement equipment has been developed, implemented, and verified. It uses a spectrum analyzer, an embedded computer, a data transmission module, and a ground station computer. A new algorithm for collecting and analyzing antenna radiation data has been created. Its implementation greatly improves data analysis performance and gives users 3D visualization for different distances and altitudes practically in real time with data filtering and grouping functionality. A radiation measurement system based on a hexacopter and fixed-wing unmanned aircraft has been designed and successfully experimentally verified. Selected antenna measurement for experimental investigation were performed from 190- to 330-m distance from the telecommunication base tower by changing altitude for measurements by 5 m, and the results were obtained and processed. From the collected data results, we could see if the telecommunication base station was designed correctly by electromagnetic field strength radiation in the distance from the antenna. From the results which we presented, we could see that the directional behavior indicated variations in radiation intensity around the antenna and that a more uniform or expected shape suggested good antenna performance. Such results are most suitable for use by the communications regulatory authority authorities.
Author Contributions
Conceptualization, D.P. and R.P.; methodology, D.B.; software, R.P.; validation, D.B. and T.J.; formal analysis, D.P.; investigation, D.P. and R.P.; resources, D.B.; data curation, T.J.; writing—original draft preparation, D.P.; writing—review and editing, R.P.; visualization, D.P. All authors have read and agreed to the published version of the manuscript.
Funding
This research received no external funding.
Data Availability Statement
The original contributions presented in the study are included in the article, further inquiries can be directed to the corresponding author.
Acknowledgments
The authors would like to thank the Editors and Reviewers for many constructive suggestions and comments, which helped to improve the quality of the paper.
Conflicts of Interest
The authors declare no conflicts of interest.
Appendix A. Measurement Methodology (Development of Measurement Methodology)
Based on theoretical and practical research, methodologies for measuring antenna patterns using a multirotor aircraft (drone) and a fixed-wing aircraft (plane) were developed during the research.
Appendix A.1. Measurement Methodology Using a Multirotor Rotary-Wing Aircraft
Due to the short flight time and speed of rotary-wing aircraft, the measurement of antenna radiation is divided into two stages:
- Determination of the radiation maximum along the vertical axis (Figure A1a). In this stage, the aircraft ascends vertically (at an approximate measurement distance from the antenna being measured), and radiation strength measurements are taken. This process identifies the height at which the antenna under investigation radiates the most, i.e., the altitude at which the circular flight will be conducted in the next stage.
- After determining the antenna’s radiation maximum along the vertical axis, the second flight involves measuring the antenna’s radiation on the horizontal plane (Figure A1b). In this stage, the aircraft flies in a circle at the determined altitude and radius (typically 200 m) around the antenna being measured, collecting radiation strength data. The flight speed is usually limited by the aircraft’s capabilities and weather conditions, typically ranging from 5 to 7 m/s.
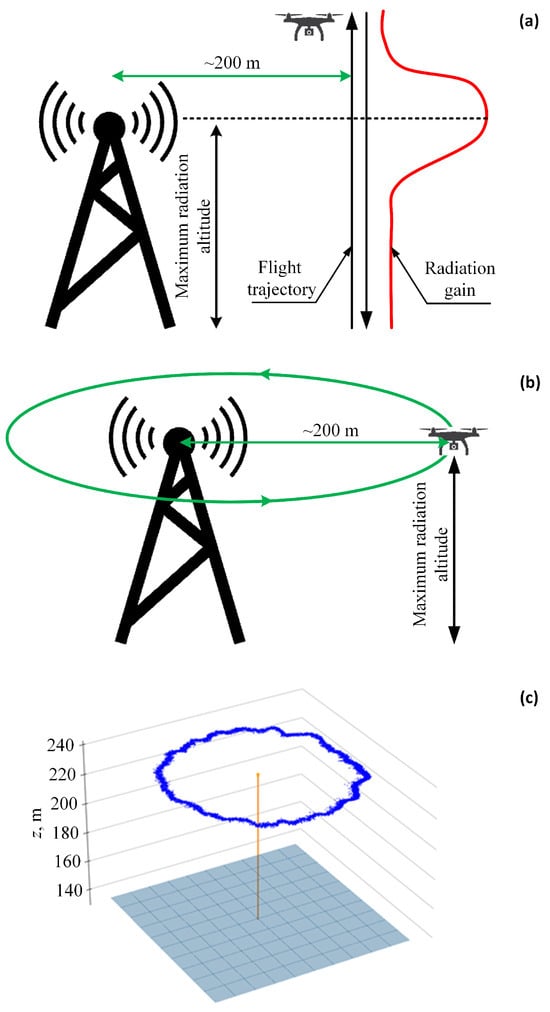
Figure A1.
(a) Determination of the antenna radiation peak along the vertical axis. (b) Antenna radiation measurement on the horizontal plane. (c) The obtained antenna radiation pattern (example).
Figure A1.
(a) Determination of the antenna radiation peak along the vertical axis. (b) Antenna radiation measurement on the horizontal plane. (c) The obtained antenna radiation pattern (example).
After completing the flight around the tower, a circular diagram of the antenna’s strength is generated in the developed software (Figure A1c), which can then be compared with the theoretical antenna pattern.
Appendix A.2. Measurement Methodology Using a Fixed-Wing Aircraft (Plane)
Using a fixed-wing aircraft, the measurement speed and the amount of data collected increase significantly, due to the much higher aircraft speed and longer flight time (and distance). When using a “Spartan” type aircraft, the flight time is typically about 2–3 h (depending on the conditions), with a flight speed of 16 m/s.
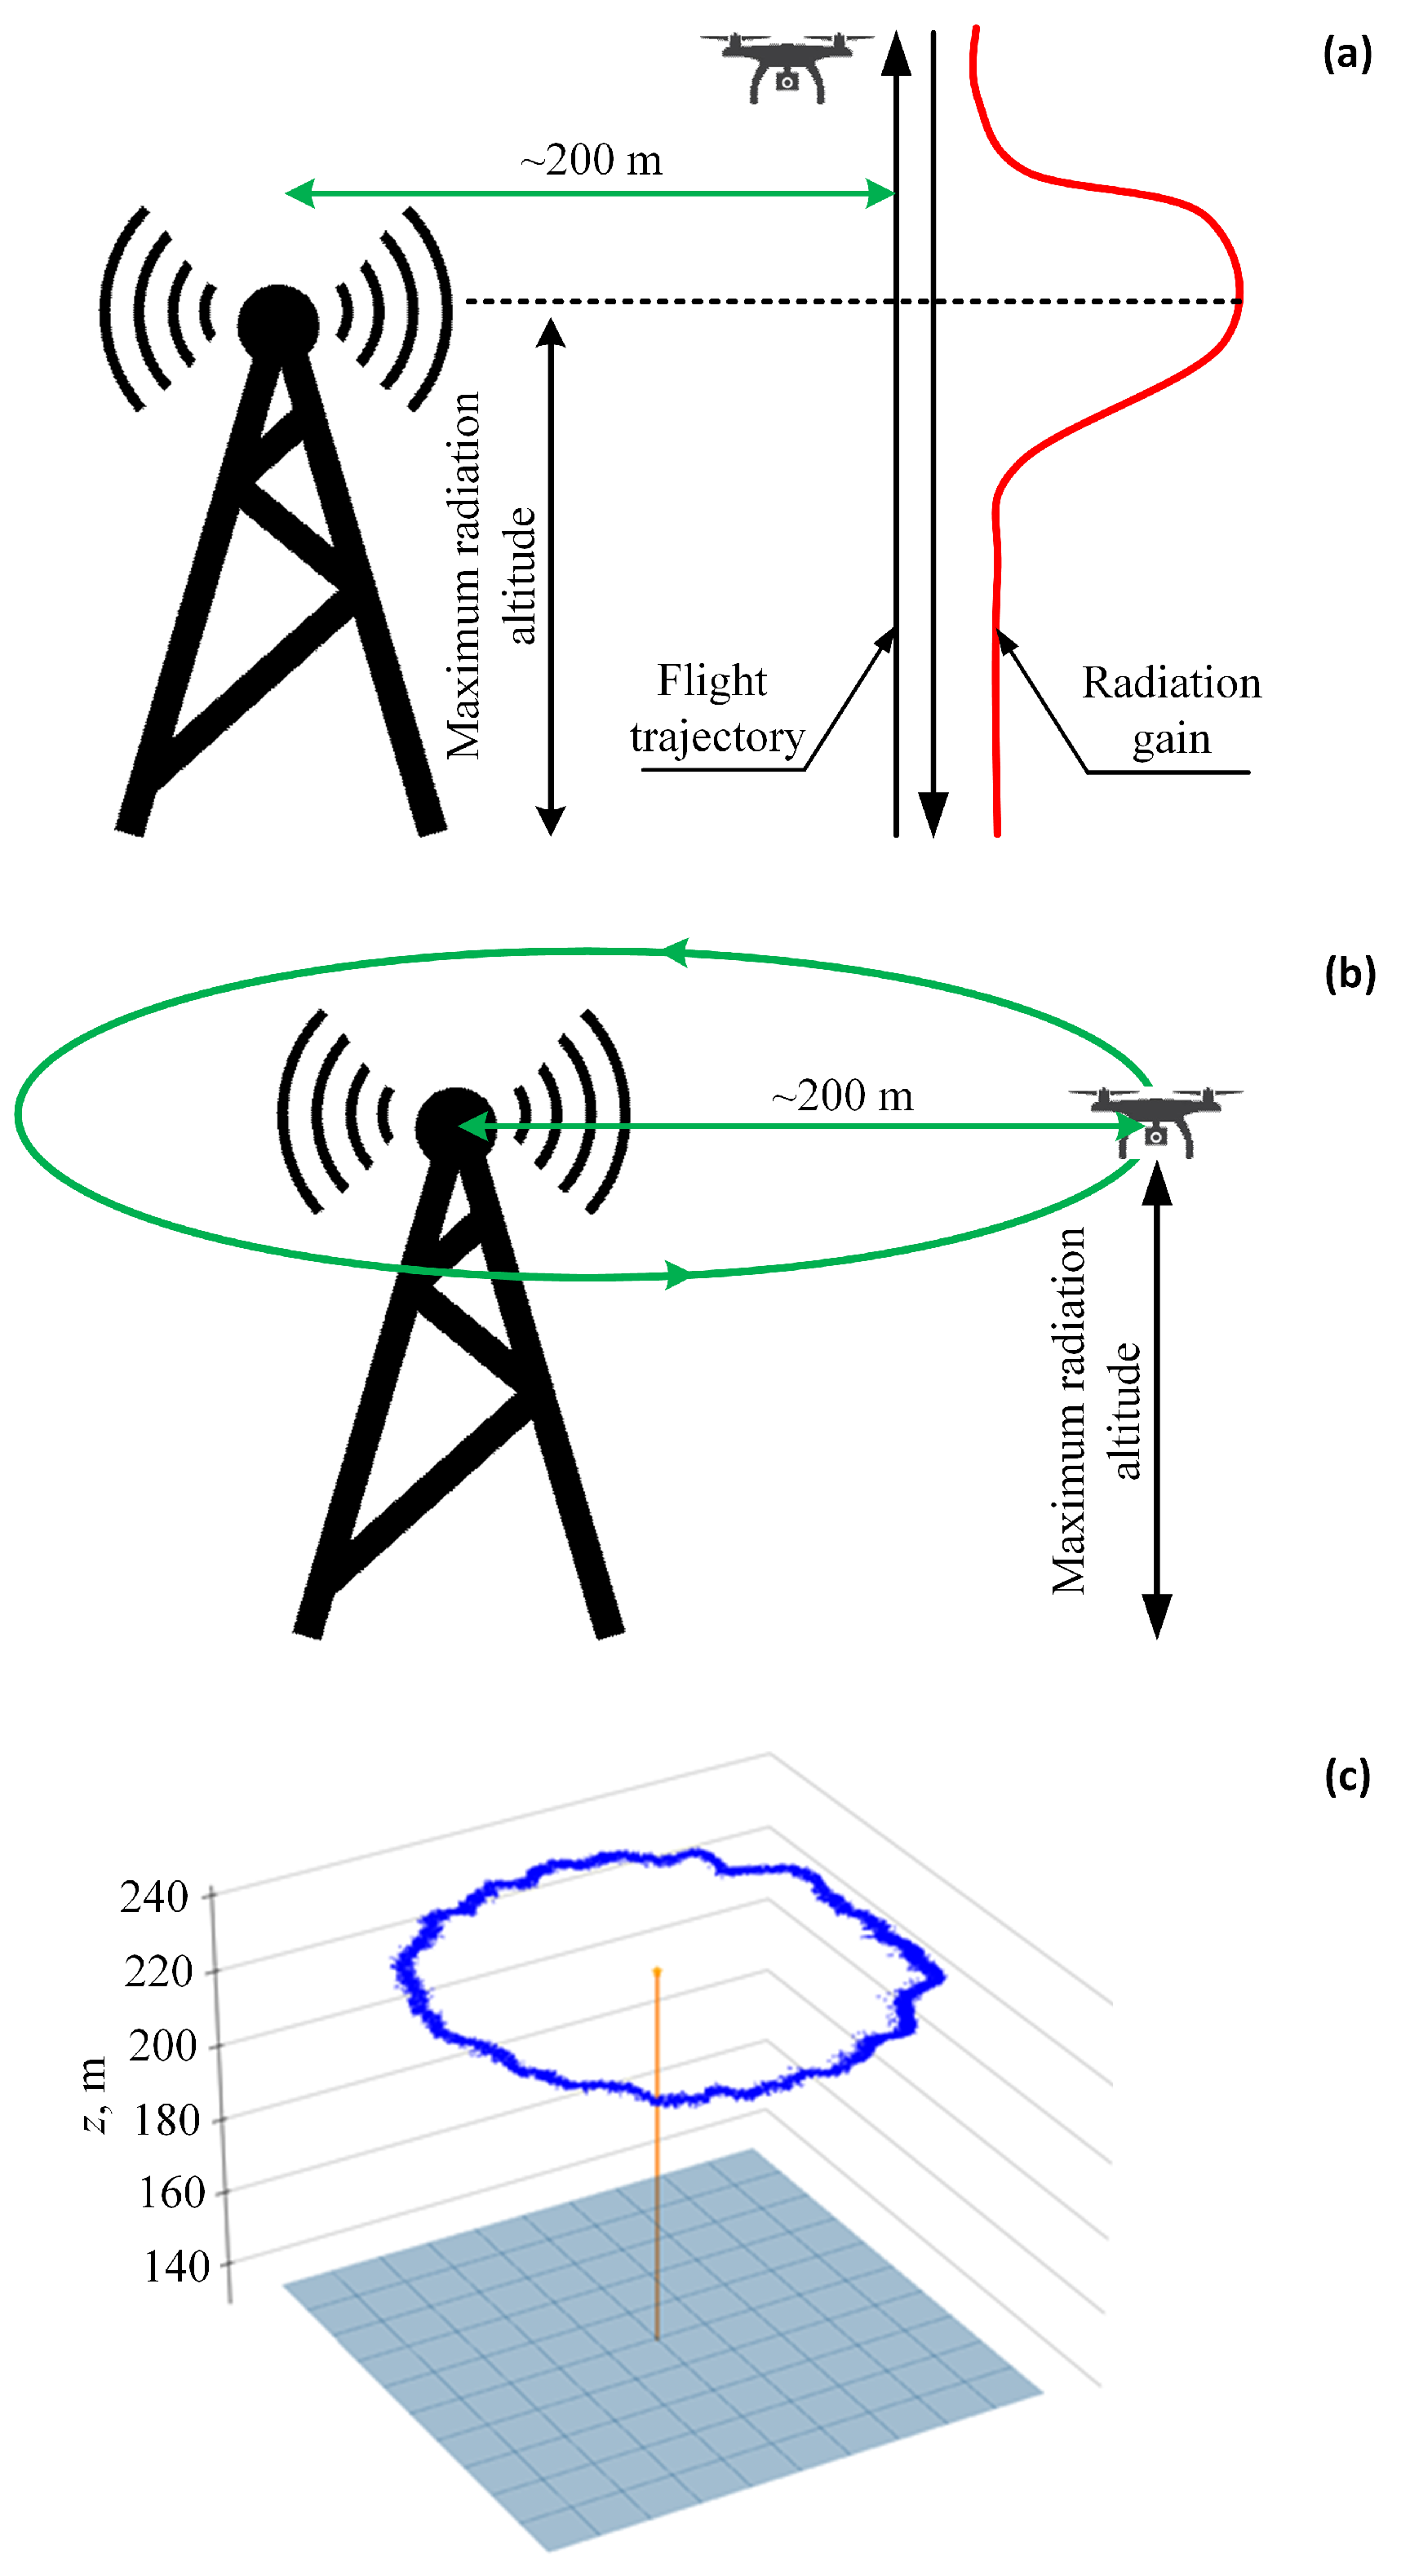
During measurements, the aircraft flies in circles around the antenna being measured, changing the altitude of the flight circle each time (Figure A2a).
Typically, during the measurement, the altitude of the flight circle is changed every 5 m (other altitude change steps are also possible). In all flight stages, antenna radiation measurements are conducted. In this way, due to measurements at different altitudes, a 3D antenna measurement diagram is obtained (Figure A2b).
Figure A2.
(a) Antenna radiation measurement on the horizontal plane. (b) The obtained 3D antenna radiation pattern (example).
Figure A2.
(a) Antenna radiation measurement on the horizontal plane. (b) The obtained 3D antenna radiation pattern (example).

The obtained 3D diagram provides much more information about the antenna’s radiation compared to the 2D diagram (which is obtained using a rotary-wing aircraft). Additionally, in this case, it is not necessary to perform measurements by ascending vertically, as measurements taken during the circular flight at different altitudes ensure the detection of the radiation peak when processing the data.
In all cases, the amount of measurement data obtained by the fixed-wing UAV is much larger (and obtained much faster) compared to using a rotary-wing aircraft. However, due to the simpler use of a rotary-wing aircraft (easy take-off and landing), both methods (or one of them) should be used, depending on the conditions.
References
- Isa, M.F.M.; Rahim, N.Z.A.; Fathi, M.S. It’s a bird… It’s a plane… It’s a drone: Telecommunication Tower Inspection Using Drone. In Proceedings of the 6th International Conference on Research and Innovation in Information Systems (ICRIIS), Johor Bahru, Malaysia, 2–3 December 2019; pp. 1–5. [Google Scholar] [CrossRef]
- Zhang, Y.; Yuan, X.; Li, W.; Chen, S. Automatic Power Line Inspection Using UAV Images. Remote Sens. 2017, 9, 824. [Google Scholar] [CrossRef]
- Jalil, B.; Leone, G.R.; Martinelli, M.; Moroni, D.; Pascali, M.A.; Berton, A. Fault Detection in Power Equipment via an Unmanned Aerial System Using Multi Modal Data. Sensors 2019, 19, 3014. [Google Scholar] [CrossRef] [PubMed]
- Li, Z.; Zhang, Y.; Wu, H.; Suzuki, S.; Namiki, A.; Wang, W. Design and Application of a UAV Autonomous Inspection System for High-Voltage Power Transmission Lines. Remote Sens. 2023, 15, 865. [Google Scholar] [CrossRef]
- Alharam, A.; Almansoori, E.; Elmadeny, W.; Alnoiami, H. Real Time AI-Based Pipeline Inspection using Drone for Oil and Gas Industries in Bahrain. In Proceedings of the International Conference on Innovation and Intelligence for Informatics, Computing and Technologies (3ICT), Sakheer, Bahrain, 20–21 December 2020; pp. 1–5. [Google Scholar] [CrossRef]
- Shukla, A.; Xiaoqian, H.; Karki, H. Autonomous tracking of oil and gas pipelines by an unmanned aerial vehicle. In Proceedings of the IEEE 59th International Midwest Symposium on Circuits and Systems (MWSCAS), Abu Dhabi, United Arab Emirates, 16–19 October 2016; pp. 1–4. [Google Scholar] [CrossRef]
- Shukla, A.; Xiaoqian, H.; Karki, H. Autonomous tracking and navigation controller for an unmanned aerial vehicle based on visual data for inspection of oil and gas pipelines. In Proceedings of the 16th International Conference on Control, Automation and Systems (ICCAS), Gyeongju, Republic of Korea, 16–19 October 2016; pp. 194–200. [Google Scholar] [CrossRef]
- Zhou, G.; Yuan, J.; Yen, I.L.; Bastani, F. Robust real-time UAV based power line detection and tracking. In Proceedings of the IEEE International Conference on Image Processing (ICIP), Phoenix, AZ, USA, 25–28 September 2016; pp. 744–748. [Google Scholar] [CrossRef]
- Li, Z.; Liu, Y.; Hayward, R.; Zhang, J.; Cai, J. Knowledge-based power line detection for UAV surveillance and inspection systems. In Proceedings of the 23rd International Conference Image and Vision Computing New Zealand, Christchurch, New Zealand, 26–28 November 2008; pp. 1–6. [Google Scholar] [CrossRef]
- Silva, R.I.D.S.; Rezende, J.D.C.V.; Sauza, M.J.F. Collecting large volume data from wireless sensor network by drone. Ad Hoc Netw. 2023, 138, 103017. [Google Scholar] [CrossRef]
- Caillouet, C.; Giroire, F.; Razafindralambo, T. Efficient data collection and tracking with flying drones. Ad Hoc Netw. 2019, 89, 35–46. [Google Scholar] [CrossRef]
- Rodriguez, I.; Nguyen, H.C.; Sorensen, T.B.; Franek, O. Base Station Antenna Pattern Distortion in Practical Urban Deployment Scenarios. In Proceedings of the IEEE 80th Vehicular Technology Conference (VTC2014-Fall), Vancouver, BC, Canada, 14–17 September 2014; pp. 1–6. [Google Scholar] [CrossRef]
- Chu, Q.X.; Luo, Y.; Wen, D.L. Design of base-station antennas with stable radiation patterns. In Proceedings of the International Workshop on Antenna Technology: Small Antennas, Novel EM Structures and Materials, and Applications (iWAT), Sydney, NSW, Australia, 4–6 March 2014; pp. 5–7. [Google Scholar] [CrossRef]
- Razmhosseini, M.; Vaughan, R.G. Accuracy of antenna pattern measurement. In Proceedings of the 17th International Symposium on Antenna Technology and Applied Electromagnetics (ANTEM), Montreal, QC, Canada, 10–13 July 2016; pp. 1–2. [Google Scholar] [CrossRef]
- Johnson, R.C.; Ecker, H.A.; Hollis, J.S. Determination of far-field antenna patterns from near-field measurements. Proc. IEEE 1973, 61, 1668–1694. [Google Scholar] [CrossRef]
- Mayekar, S.; Bansode, M.; Rathod, S.S. An automated antenna pattern measurement system. In Proceedings of the International Conference on Intelligent Computing and Control (I2C2), Coimbatore, India, 23–24 June 2017; pp. 1–4. [Google Scholar] [CrossRef]
- Farasat, M.; Thalakotuna, D.N.; Hu, Z.; Yang, Y. A Review on 5G Sub-6 GHz Base Station Antenna Design Challenges. Electronics 2021, 10, 2000. [Google Scholar] [CrossRef]
- Gabriel, R.; Geissler, M. Antenna Systems for Cellular Base Stations. In Handbook of Antenna Technologies; Springer Science+Business Media: Singapore, 2016; pp. 2271–2346. [Google Scholar] [CrossRef]
- Asplund, H.; Astely, D.; Butovitsch, P.V.; Chapman, T.; Frenne, M.; Ghasemzadeh, F.; Hagström, M.; Hogan, B.; Jöngren, G.; Karlsson, J.; et al. Radio Performance Requirements and Regulation. In Advanced Antenna Systems for 5G Network Deployments; Academic Press (Elsevier): Cambridge, MA, USA, 2020; pp. 453–525. [Google Scholar] [CrossRef]
- Bollard, B.; Doshi, A.; Gilbert, N.; Poirot, C.; Gillman, L. Drone Technology for Monitoring Protected Areas in Remote and Fragile Environments. Drones 2022, 6, 42. [Google Scholar] [CrossRef]
- Shajahan, N.M.; Kuruvila, T.; Kumar, A.S.; Davis, D. Automated Inspection of Monopole Tower Using Drones and Computer Vision. In Proceedings of the 2nd International Conference on Intelligent Autonomous Systems (ICoIAS), Singapore, 28 February–2 March 2019; pp. 187–192. [Google Scholar] [CrossRef]
- How to 3D Model a Cell Tower for Inspection a Step by Step Guide. Available online: https://www.hammermissions.com/post/how-to-3d-model-a-cell-tower-for-inspection-a-step-by-step-guide (accessed on 1 April 2024).
- Gonzalez, L.F.; Montes, G.A.; Puig, E.; Johnson, S.; Mengersen, K.; Gaston, K.J. Unmanned Aerial Vehicles (UAVs) and Artificial Intelligence Revolutionizing Wildlife Monitoring and Conservation. Sensors 2016, 16, 97. [Google Scholar] [CrossRef] [PubMed]
- Levitt, B.B.; Lai, H.C.; Manville, A.M. Effects of non-ionizing electromagnetic fields on flora and fauna, Part 2 impacts: How species interact with natural and man-made EMF. Rev. Environ. Health 2022, 37, 327–406. [Google Scholar] [CrossRef] [PubMed]
- Tran, T.H.; Nguyen, D.D. Management and Regulation of Drone Operation in Urban Environment: A Case Study. Soc. Sci. 2022, 11, 474. [Google Scholar] [CrossRef]
- Mohsan, S.A.H.; Othman, N.Q.H.; Li, Y.; Alsharif, M.H.; Khan, M.A. Unmanned aerial vehicles (UAVs): Practical aspects, applications, open challenges, security issues, and future trends. Intell. Serv. Robot. 2023, 16, 109–137. [Google Scholar] [CrossRef] [PubMed]


Disclaimer/Publisher’s Note: The statements, opinions and data contained in all publications are solely those of the individual author(s) and contributor(s) and not of MDPI and/or the editor(s). MDPI and/or the editor(s) disclaim responsibility for any injury to people or property resulting from any ideas, methods, instructions or products referred to in the content. |
© 2025 by the authors. Licensee MDPI, Basel, Switzerland. This article is an open access article distributed under the terms and conditions of the Creative Commons Attribution (CC BY) license (https://creativecommons.org/licenses/by/4.0/).