Abstract
Accurate detection and timely management of high-voltage transmission accessories are crucial for ensuring the safe operation of power transmission. Existing network models suffer from issues like low precision in accessory detection, elevated model complexity, and a narrow range of category detection, especially in UAV-based inspection scenarios. To alleviate the above problems, we propose an innovative Weight Coordinated Adaptive Network (WCANet) in this paper, aiming to improve the efficiency and accuracy of high-voltage transmission accessories detection. The network is designed with a plug-and-play WCA module that can effectively identify dense small targets, retain information in each channel, and reduce computational overheads, while incorporating Sim-AFPN with a skip-connection structure into the network aggregate feature information layer by layer, enhancing the ability to capture key features, and achieving a lightweight network structure. The WIoU loss of bounding box regression (BBR) is to reduce the competitiveness of high-quality anchor boxes and mask the effects of the low-quality examples, thus improving the accuracy of the model. The experimental results show that WCANet has achieved remarkable results in the HVTA, VisDrone2019, and VOC2007 datasets. Compared with other methods, our WCANet achieves highly accurate prediction of high-voltage transmission accessories with fewer parameters and model sizes, availably balancing model performance and complexity.
1. Introduction
Electricity is the basis for the functioning of modern society, from lighting and heating to industrial manufacturing and digital communication; all of them are driven by it. With the progress of science and technology and the acceleration of industrialization, the demand for electricity has been increasing [1], which has brought great pressure on the power system, and how to ensure the safe and stable operation of large-scale power grids has become an urgent problem to be solved. It is very critical to detect key high-voltage transmission accessories, especially suspension clamp, grading ring, vibration damper, link fitting, and insulators to maintain the operation of a power system. These accessories together ensure the mechanical stability, electrical insulation, and operational safety of transmission lines. Their failure will lead to cascading blackouts, so their accurate identification and state evaluation is very important to improve the reliability of a power grid and prevent catastrophic accidents. Among them, transmission accessories detection faces a series of difficulties. On the one hand, the existing transmission accessories detection method is susceptible to environmental influences, especially in harsh environments, detection workers carrying out transmission accessories detection, and maintenance; the slightest carelessness can lead to personal injury accidents. On the other hand, the traditional transmission accessories detection method often relies on a manual method [2,3], which requires high professional skills of detection personnel, and detection personnel are extremely fatigued during the detection process; it is easy to detect misjudgment and a leakage detection problem. For this reason, in view of the difficulty of inspecting the transmission network at high altitude and high voltage, researching a deep learning-based transmission accessories detection algorithm has become an inevitable trend in the future [4,5,6].
In recent years, for the task of power object detection in visible light images, domestic and foreign scholars have carried out a lot of research work. With the continuous development of technology, the detection frameworks adopted by scholars are also advancing, resulting in higher and higher detection accuracy. Most of the detection methods initially adopted by researchers are traditional image processing algorithms, such as in the detection of transmission conductors [7]. Guo et al. [8] argue that the combined matching algorithm utilizing SURF and FLANN is employed for solving. The SURF features exhibit exceptional performance in capturing details, while the utilization of the Hessian matrix for extremum computation enhances the speed of feature extraction, rendering it straightforward and efficient. The FLANN algorithm, employing a tree-based structure for storage and search, effectively addresses the issue of slow high-dimensional feature matching. In insulator detection, Zhao et al. [9] proposed using SIFT (Scale Invariant Feature Transform) to extract the features of each insulator, and then using RANSAC (Random Sample Consistency) to remove outliers, so that the matching inner points of each template are accurate points, which has high accuracy in identifying and locating insulators in a complex background. For the detection of spacer bars [10], a single sliding time window was used to modify the micro meteorological data, and then the gray correlation analysis method and specific gravity method were used to obtain the influence weights, constructing a GA-BP-SVM combination model. Texture, gray distribution, and other features were used to achieve segmentation of the sky area; a threading method and rotating projection were then combined to realize the exact positioning of transmission lines. A sliding window was used to traverse the transmission lines and detect the spacers according to Laws’ texture energy values of projection curves in the window.
Nowadays, more and more scholars adopt deep learning algorithms to achieve the power object detection task [11], because deep learning algorithms can adapt to more complex detection scenarios, and the detection accuracy is better than that of other methods. The object detection algorithms based on deep learning are mainly divided into two categories. The first category is a two-stage target detection model, which mainly includes Mask RCNN [12], Faster RCNN [13], and Cascade RCNN [14]. The two-stage network model generally has high detection accuracy, but the model is too large to meet the real-time detection requirements. The second category is the one-stage object detection model, including RetinaNet [15], SSD [16], YOLO series [17,18,19], and EfficientDet [20]. Because of its relatively small model and low hardware requirements, the update iteration is very fast at present, and the detection accuracy of the latest one-stage network model is not much different from or even better than that of the two-stage network model. Zhang et al. [21] put forward an MS-COCO pre-training strategy to improve the accuracy, and improved Cascade R-CNN based on the ResNeXt-101 network and FPN module to realize accurate detection of insulators on transmission lines, but its inference speed is not satisfactory. Zhao et al. [22] designed an automatic visual shape clustering network (AVSCNet), proposed an unsupervised visual shape clustering method for bolts, and used three deep convolution neural network optimization methods in the model. These methods have excellent detection accuracy and are very suitable for the defect detection of transmission lines in cloud servers. However, the currently designed network model has large parameters and still has the potential for optimization. Hence, some studies began to explore the use of a lightweight model to optimize the network structure in order to achieve faster reasoning speed. Ning et al. [23] used MobileNet combined with YOLOv3 to improve the IoU-Kmeans algorithm for target location prediction, which increased the number of network layers and enriched the feature mapping module while maintaining a small amount of computation. Peng et al. [24] constructed the EDF-YOLOv5 model for detecting transmission line defects through inspection images of unmanned aerial vehicles. Based on YOLOv5, this model introduced an advanced semantic feature information extraction network, DCNv3C3, and a bounding box loss function, Focal-CIoU, which improved its generalization ability for defects with different shapes. A lightweight network is designed to speed up the processing speed, but it also leads to the reduction in model accuracy. In the complex environment that requires high-precision detection, this network may not meet the needs of practical applications.
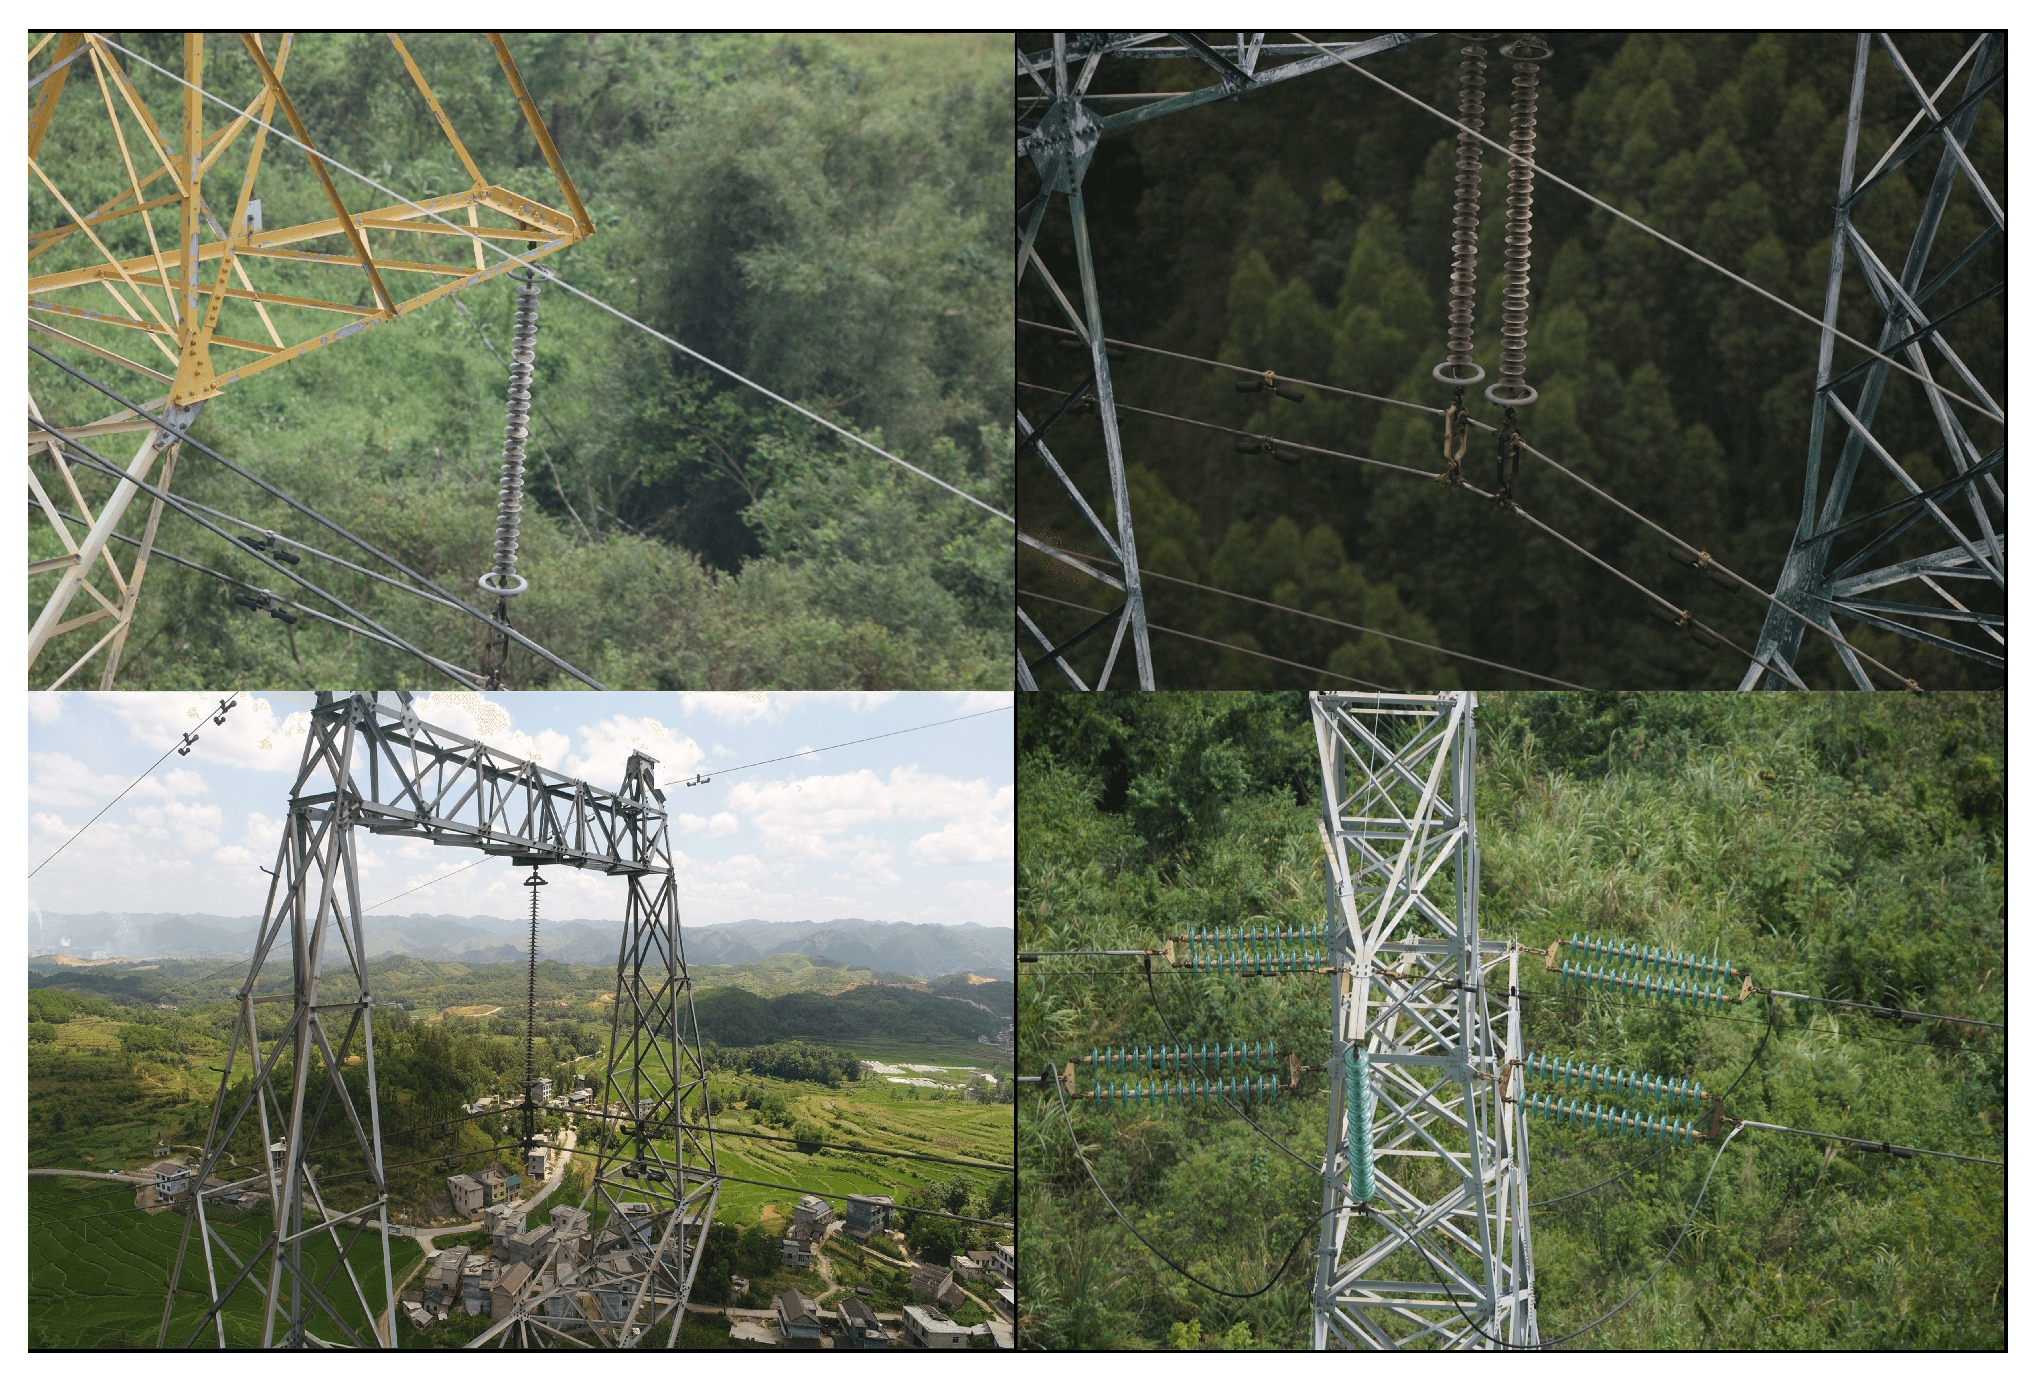
As shown in Figure 1, it is worth noting that most of the transmission accessories are dense small targets, and the contrast with the surrounding environment is low, which makes it difficult for the object detection algorithm to accurately identify and locate small targets. Moreover, the field of view of the camera is limited, and small targets may be affected by factors such as viewing angle and occlusion, which in turn reduces the accuracy of object detection. Consequently, this paper proposes an efficient and lightweight WCANet model for high-voltage transmission accessories. The main contributions of this research are summarized below.
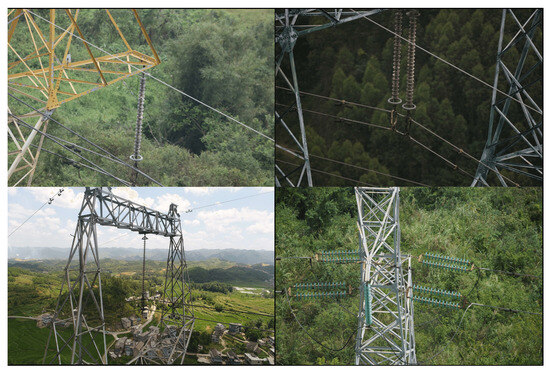
Figure 1.
HVTA dataset.
(1) The plug-and-play WCA module is designed, which employs adaptive adjustment of the number of operation channels to help balance the feature extraction and representation capabilities and ensure the computational efficiency, enabling the network to focus on the key features of small-target objects and suppress the interference of the complex background.
(2) The novel network WCANet for high-voltage transmission accessory detection is proposed, which suggests that Sim-AFPN can be able to extract features with different detail information and semantic information from various scale layers with reduced computational overhead, which makes the feature representation richer and more comprehensive, and thus achieves better detection results.
(3) The performance of the proposed model is tested on the self-built high-voltage transmission accessories dataset and the public dataset VisDrone2019. Compared with other mainstream target detection models, the model significantly improves the accuracy of image detection, and both parameters and size size are more lightweight.
This paper is organized as follows: Section 2 describes the methodology, including the proposed WCANet architecture and specific innovations. Section 3 describes the experimental details and training results, including a comparison of the innovations, ablation experiments, and comparisons between different models. Section 4 concludes this paper.
2. Methodology
2.1. The Network Structure of WCANet
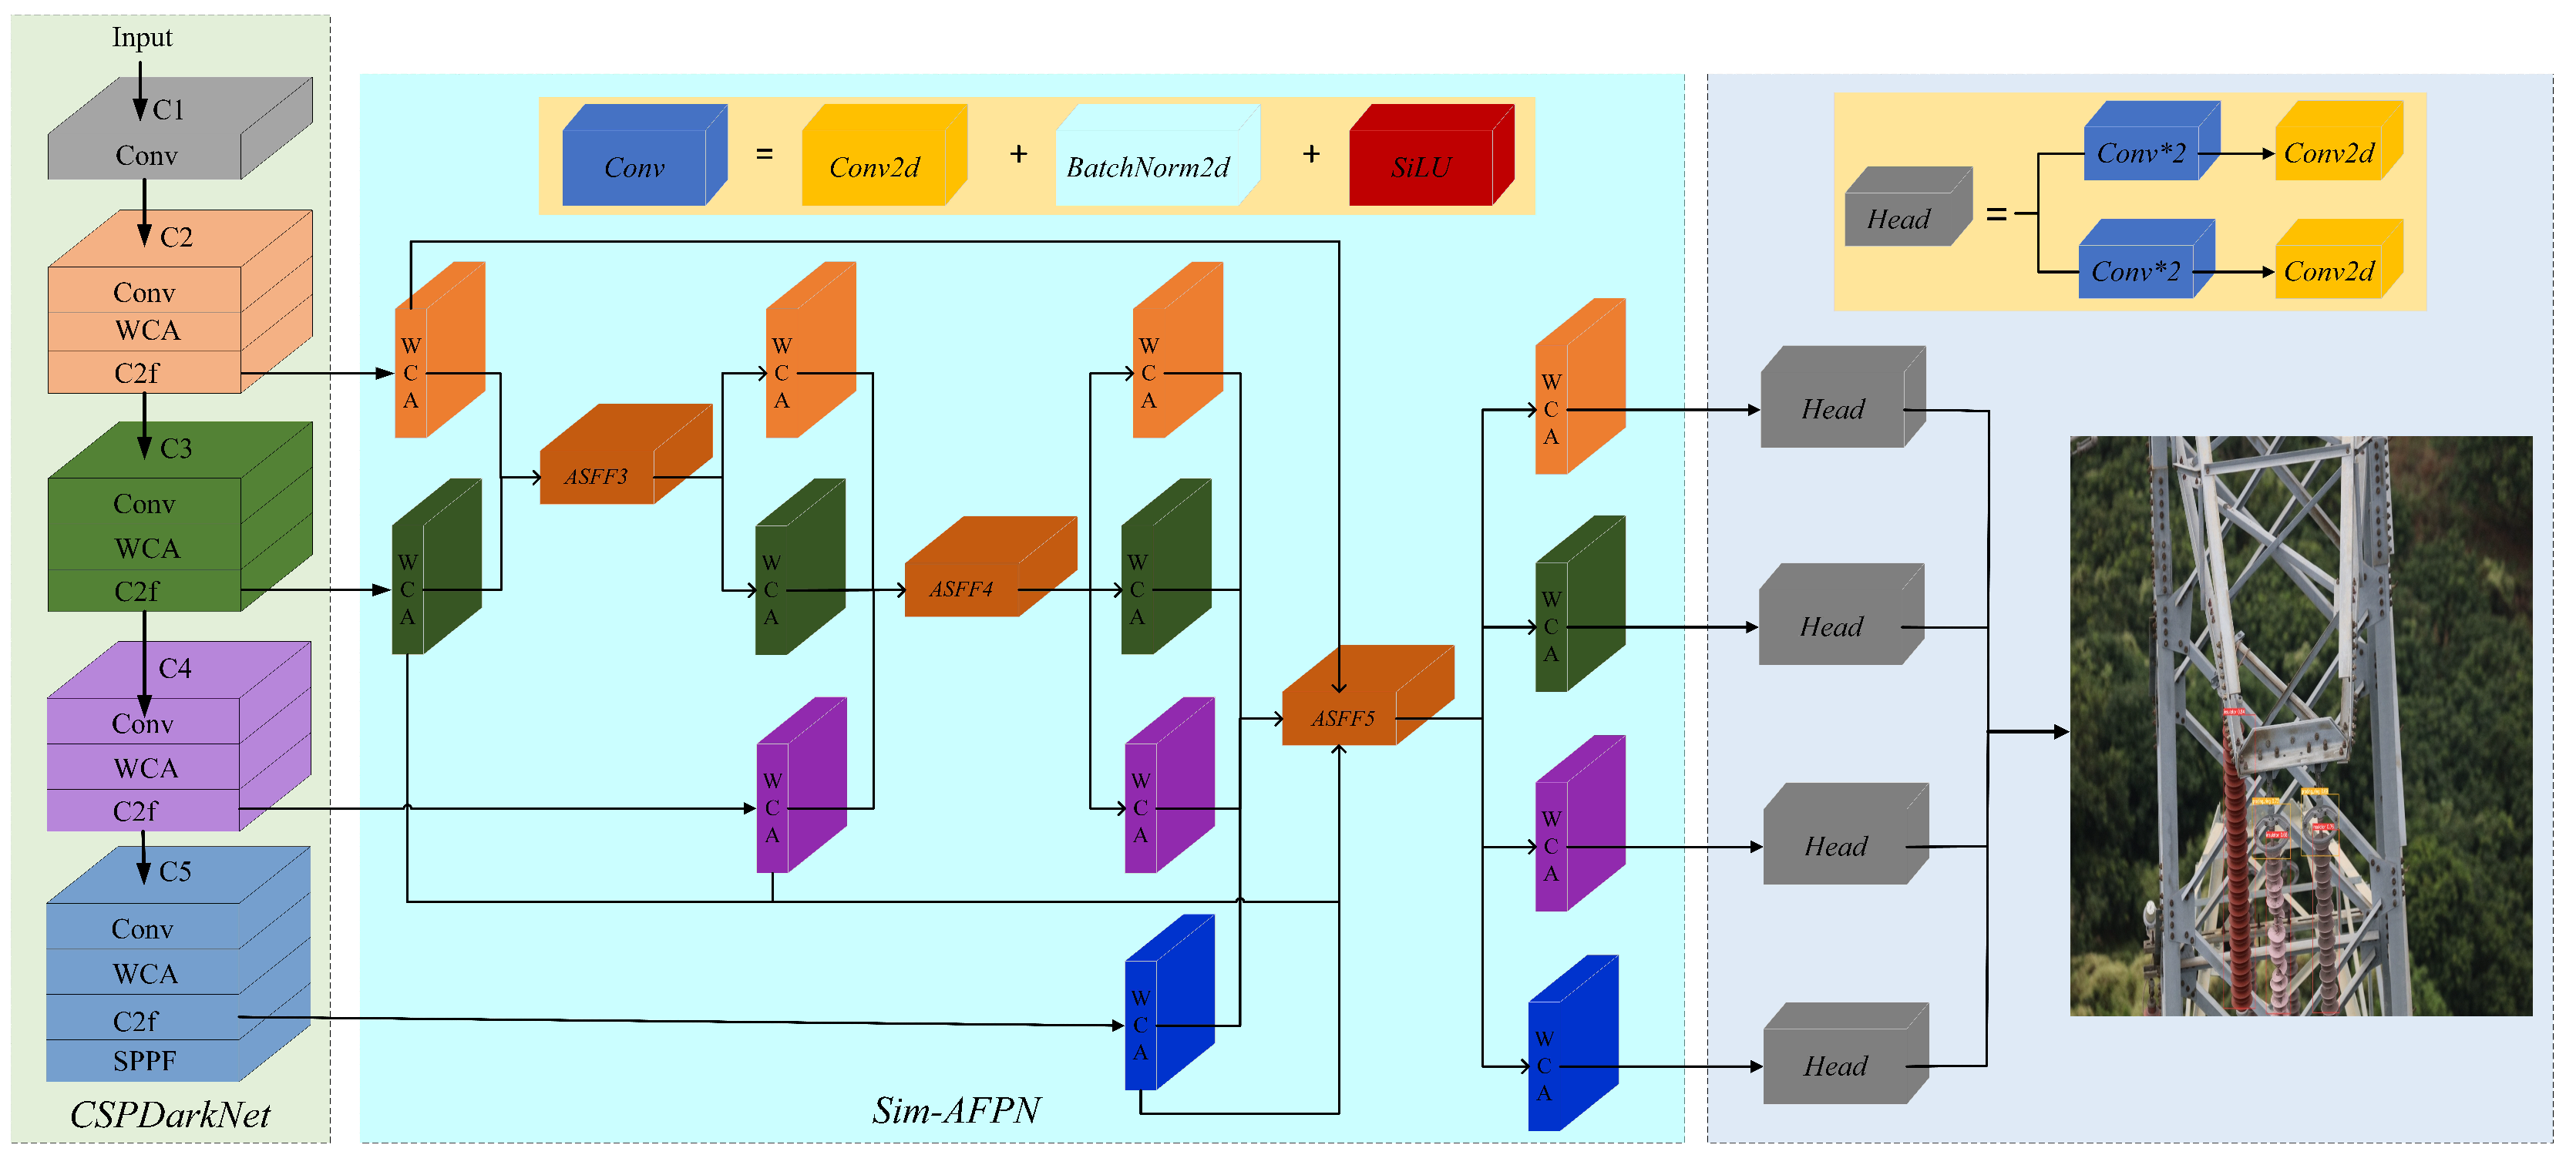
The framework of the proposed WCANet is shown in Figure 2, which consists of a backbone part, a neck part, and a decoupled head part. First, the backbone part of the WCANet network model, which uses the CSPDarkNet architecture, is responsible for extracting the multi-layer feature map of key information from the original image, which enables the neck to carry out multi-scale feature fusion and provides a more accurate and comprehensive feature representation for the final object detection task. In addition, the WCA module is added to the backbone to synthesize global and spatial location information for the purpose of more effectively capturing long-range interactions and spatial structures. Subsequently, the design of a decoupled head [25] makes each scale have independent detectors, effectively capturing information of targets at different scales and avoiding feature interference from different subtasks, thereby improving the accuracy of object detection. Lastly, while most network models use CIoU as the boundary loss function, it has the following drawbacks: the aspect ratio describes relative values, leading to a certain degree of ambiguity, and it does not consider the balance between difficult and easy samples, resulting in inaccurate BBR regression. Therefore, we choose the WIoU loss function to solve the above problems and make BBR regression more accurate.
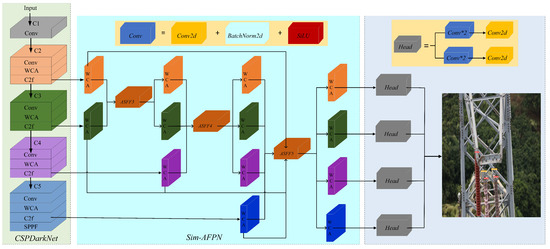
Figure 2.
Framework of the proposed WCANet.
2.2. Weight Coordinate Attention (WCA)
Innovative improvements have been made to address the deficiencies of existing mainstream attention mechanisms (such as SE, ECA, CBAM, and CA) in terms of spatial position preservation, multi-scale information fusion, and computational efficiency. The Squeeze-and-Excitation (SE) module generates channel weights by compressing spatial information through global average pooling, but it completely ignores spatial dimensional features, making it difficult to locate the precise positions of small target objects. The Efficient Channel Attention (ECA) module captures local cross-channel interactions using one-dimensional convolutions, which reduces computational complexity but still lacks the ability to model long-range dependencies in the spatial dimension. The Convolutional Block Attention Module (CBAM) achieves dual enhancement by concatenating channel and spatial attention, but its spatial attention layer employs simple max/average pooling concatenation and 7 × 7 convolutions, leading to the blurring of spatial position information and making it challenging to distinguish subtle features in complex backgrounds. The Coordinate Attention (CA) module generates direction-aware feature maps by decomposing coordinate information, which can retain some positional information, but its unidirectional encoding mechanism may result in incomplete spatial structure modeling.
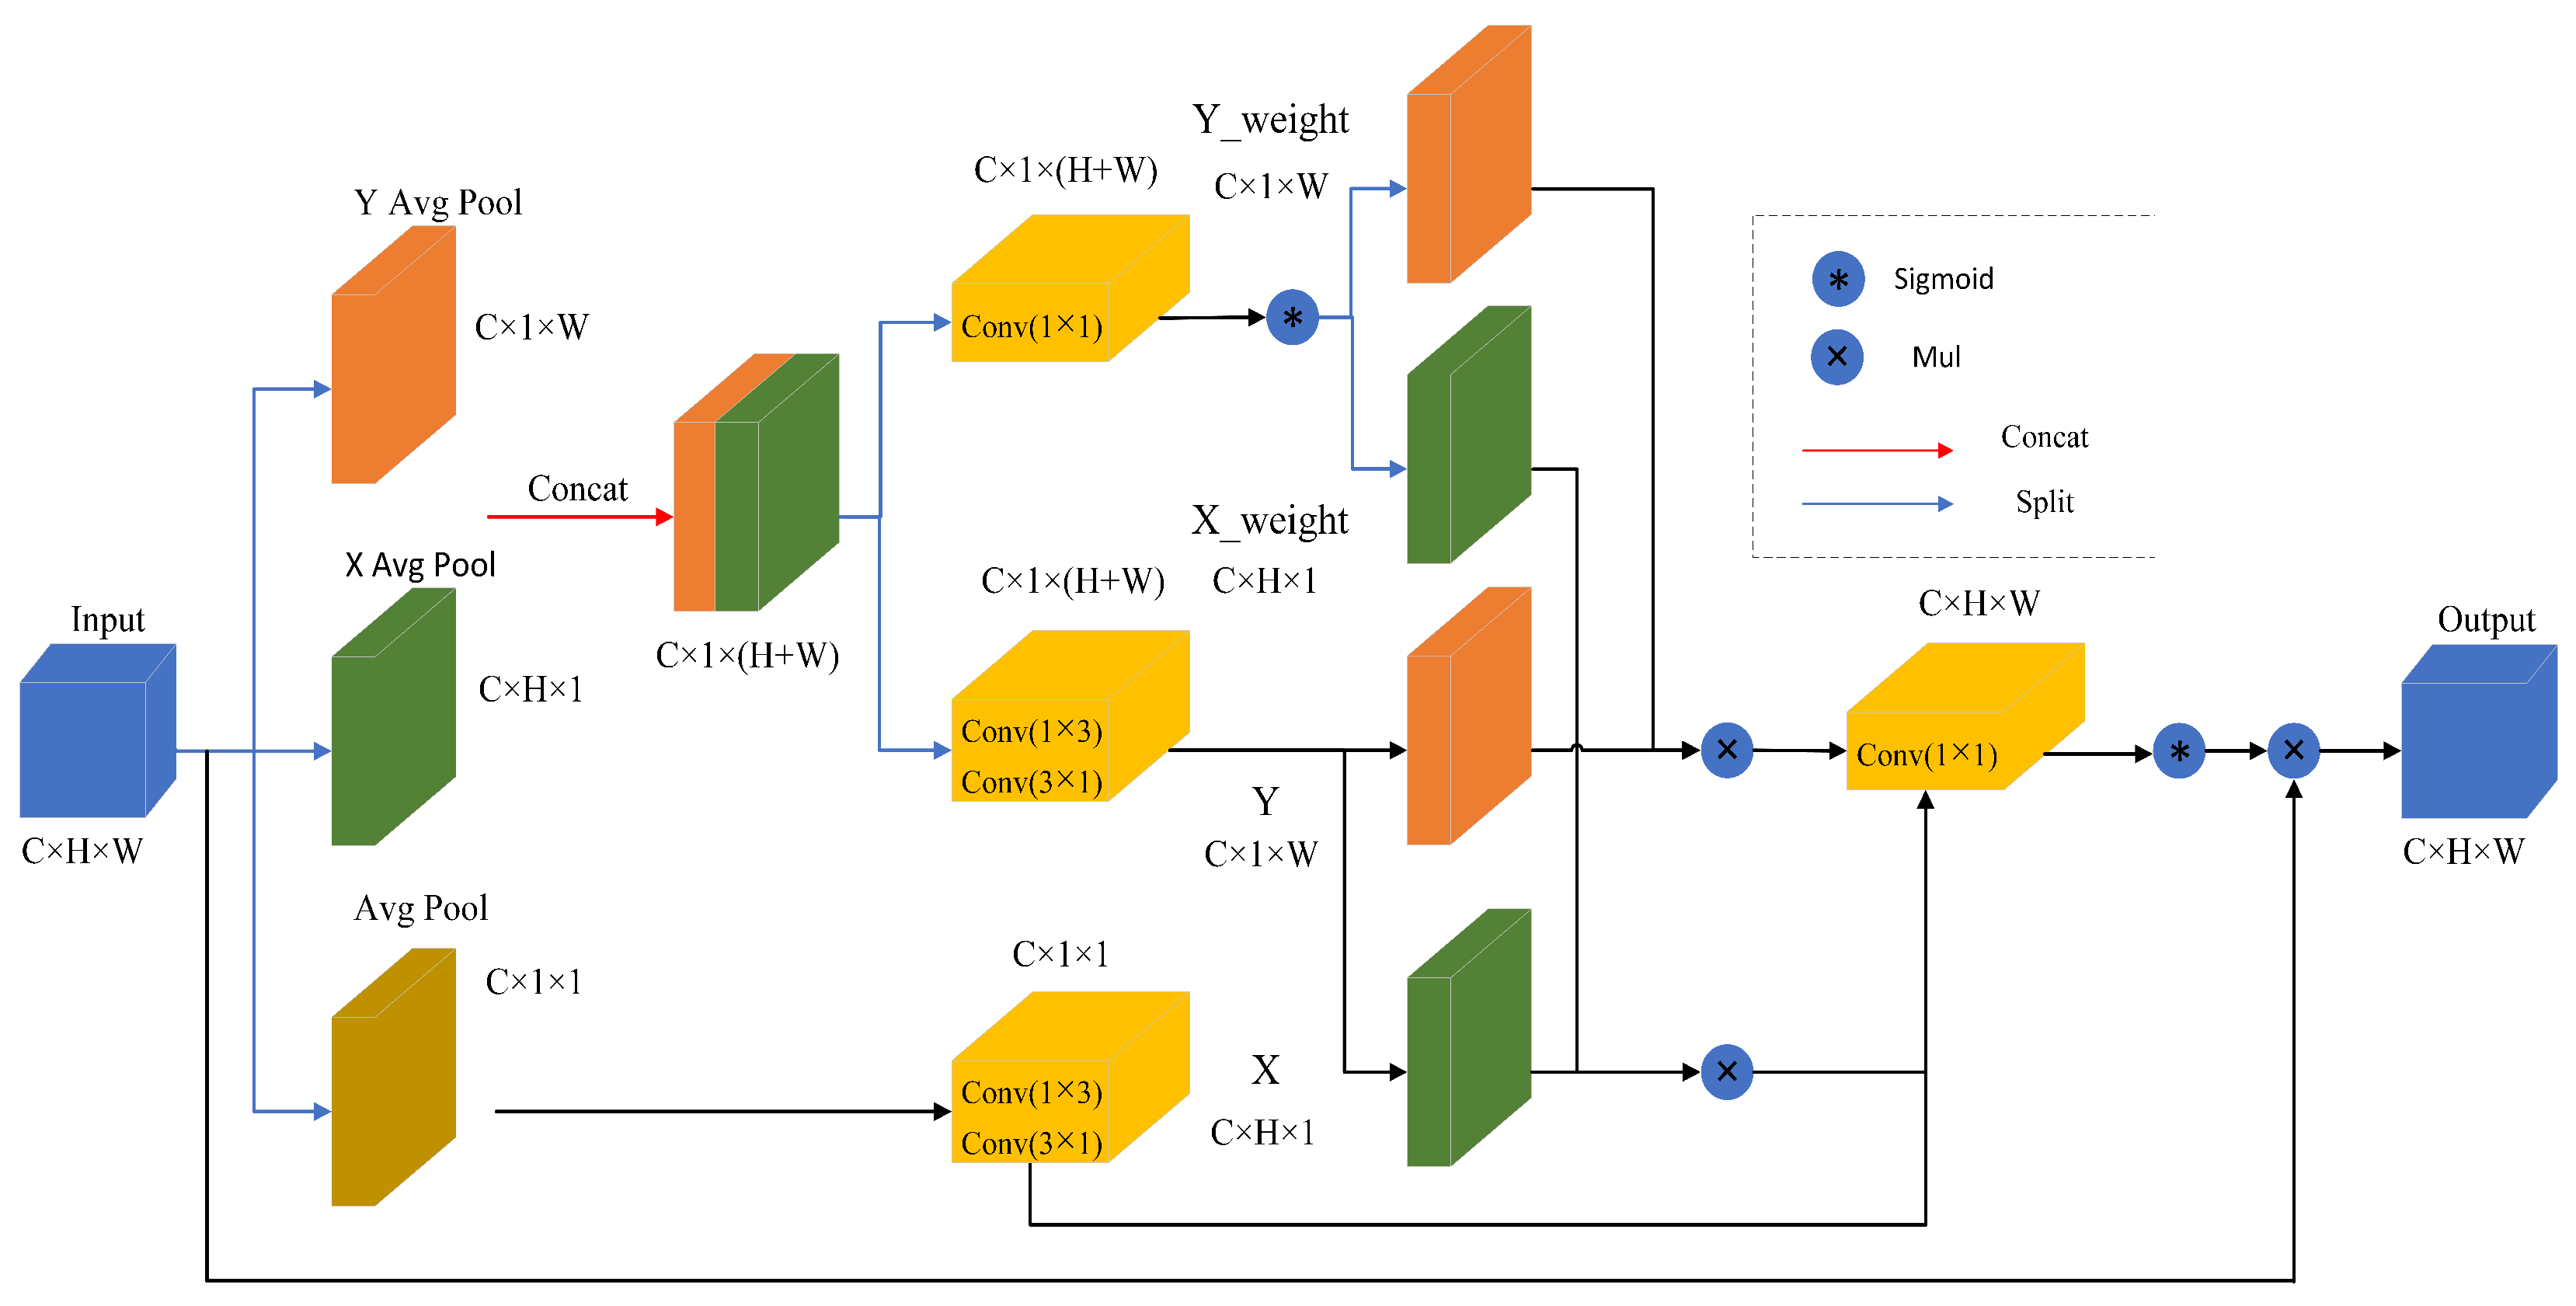
This paper proposes a new Weighted Coordinated Attention (WCA) module, which aims to retain information from each channel while reducing computational costs. It achieves cross-channel dimension aggregation of the output features from three parallel branches, enabling the network to focus on key information of small target objects in complex backgrounds. As shown in Figure 3, the WCA module first decomposes the original input features into a two-dimensional fixed average pooling and two parallel one-dimensional dynamic average pooling to model cross-channel correlation by using spatial position information [26]. Let represent the input feature map, where C denotes the number of input channels, and H and W represent the height and width spatial dimensions of the input features respectively. The two-dimensional fixed average pooling averages the input feature map according to its dimensions independent of the size of the input feature map, which can help to extract the global information and achieve the averaging of each pixel point, so that the output feature maps can better extract the input feature map’s overall information. The two-dimensional fixed average pooling operation is formulated as
where indicates the input feature at the c-th channel, and is the output associated with the c-th channel. The input tensor is pooled into an output with fixed pooling kernels (1,1), and the input feature maps of different sizes are mapped to the same fixed size, enabling the gathering of global information. However, it compresses global spatial information into the channel descriptors, making it difficult to preserve positional information, but the location information is very important to capture the spatial structure in visual tasks. To encourage the attention module to capture long-distance interactions spatially using precise positional information, one of the parallel pathways originates from a one-dimensional dynamic average pool along the horizontal dimension. This can be seen as a collection of positional information along the horizontal dimension. The one-dimensional dynamic average pooling used to collect spatial information along the horizontal dimension of height H can be expressed as
Through such an encoding process, the WCA captures long-range dependencies in the horizontal dimension direction and retains precise positional information in the vertical dimension direction. Similarly, another parallel route utilizes one-dimensional dynamic average pooling along the vertical dimension to capture long-range interactions, enhancing the focus on the spatial region of interest. The output formula of one-dimensional dynamic pooling with the width W is
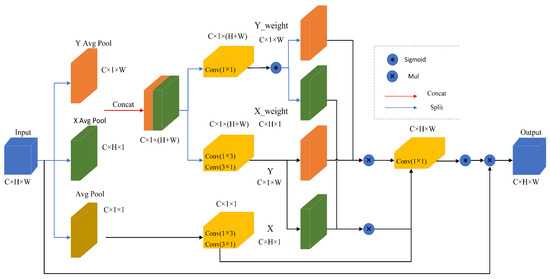
Figure 3.
Illustration of our proposed WCA. “Avg Pool” stands for the two-dimensional fixed average pooling, “X average pool” represents one-dimensional dynamic horizontal global pooling, and “Y average pool” represents one-dimensional vertical global pooling.
The multi-dimensional feature coding vector combination of one two-dimensional fixed feature coding vector and two parallel one-dimensional dynamic feature coding vectors, global information and spatial position information, can be comprehensively utilized so that the long-range interaction and spatial structure in the feature map can be better captured, and the utilization efficiency of global information and positional information in the model can be effectively improved, thus enhancing the model’s attention to the spatial region of interest and improving the performance of visual tasks. Next, two convolution operations are performed on a two-dimensional fixed feature coding vector. The convolution operation in depth direction is performed according to the convolution kernel size of 1 × 3, which realizes feature extraction and compression in the depth direction, helps to extract feature information at different depths, and enables the model to capture the depth features of the input data in a better way. Then, according to the convolution kernel size of 3 × 1, the convolution operation in the width direction is carried out to realize the feature extraction and compression in the width direction, which is also helpful for the model to extract and learn the width features of the input data. The above successive convolution operations take advantage of the different convolution kernel sizes to perform feature extraction and compression of the input data in the depth and width directions, respectively, enabling the model to learn and represent the features of the input data more efficiently and reduce the number of parameters in the depth and width directions. Similarly, cascading two parallel one-dimensional dynamic feature encoder vectors is performed at the convolutional layer , which will share the 1 × 3 convolution and 3 × 1 convolution with dimensionality reduction. The above operation formula is shown in Equations (4) and (5).
The WCA then decomposes the cascaded two parallel one-dimensional dynamic feature encoding vectors, while further sequentially performing 1 × 1 convolution kernel and a non-linear Sigmoid function to achieve the weights for decomposing the two parallel one-dimensional dynamic feature encoding vectors. Naturally, the two parallel one-dimensional dynamic feature coding vectors and their corresponding weights are multiplied to weight different parts of the feature map, thus highlighting important features or suppressing irrelevant features, achieving dynamic adjustment of the feature map. The benefit of this is that it allows the model to learn the features in different regions more flexibly, enabling the model to better adapt to different input situations, improving the model’s generalization ability and performance. Immediately after that, the two-dimensional fixed feature coding vectors and two parallel one-dimensional dynamic feature coding vectors are merged and multiplied, followed by a 1 × 1 convolutional kernel and a non-linear Sigmoid function to obtain the weight matrix. Ultimately, the learned attention map weights are used to aggregate the original intermediate feature maps as the final output loss, and the expression is as shown in Equations (6) and (7).
Up to this point, WCA effectively captures long-range interactions and spatial structure by combining global and spatial location information through a two-dimensional fixed averaging pool and two parallel one-dimensional dynamic averaging pools; its successive convolution operation extracts features in both depth and width directions, and dynamically adapts the feature maps by cascading two parallel one-dimensional dynamic feature encoding vectors for re-decomposition, combined with their weight matrices, to enhance the model’s adaptability and generalization ability.
2.3. Sim-AFPN
A neck section usually consists of multiple bottom–up paths and multiple top–down paths. For instance, FPN uses a top–down approach to transfer high-level features to low-level features so as to realize the fusion of different levels of features. The FPN structure [27] has achieved good results in many classical models, such as Faster RCNN and YOLOv3. However, high-level features are not fused with the low-level features in this process. YOLOv5 and YOLOv8 models adopt the structure of PAN-FPN [28]. By adding a bottom–up path, PAN transfers the accurate positioning information of the low-level feature map to the high-level feature map, thus achieving deeper feature fusion and enabling target detection on multiple scales. This is very beneficial for detecting targets of different sizes, especially for those small targets that are difficult to detect on a single scale. Nevertheless, with the increase or decrease in levels, feature information may be gradually diluted, high-level strong semantic information may be gradually weakened in the process of downward transmission, and low-level precise positioning information may also lose details when it is transmitted upward. BiFPN achieves simple and rapid multi-scale feature fusion through bi-directional cross-scale connectivity, which can help the information flow better between different levels, but it requires a large number of parameters for feature fusion and information transmission, resulting in a large number of model parameters and the need for more data for training.
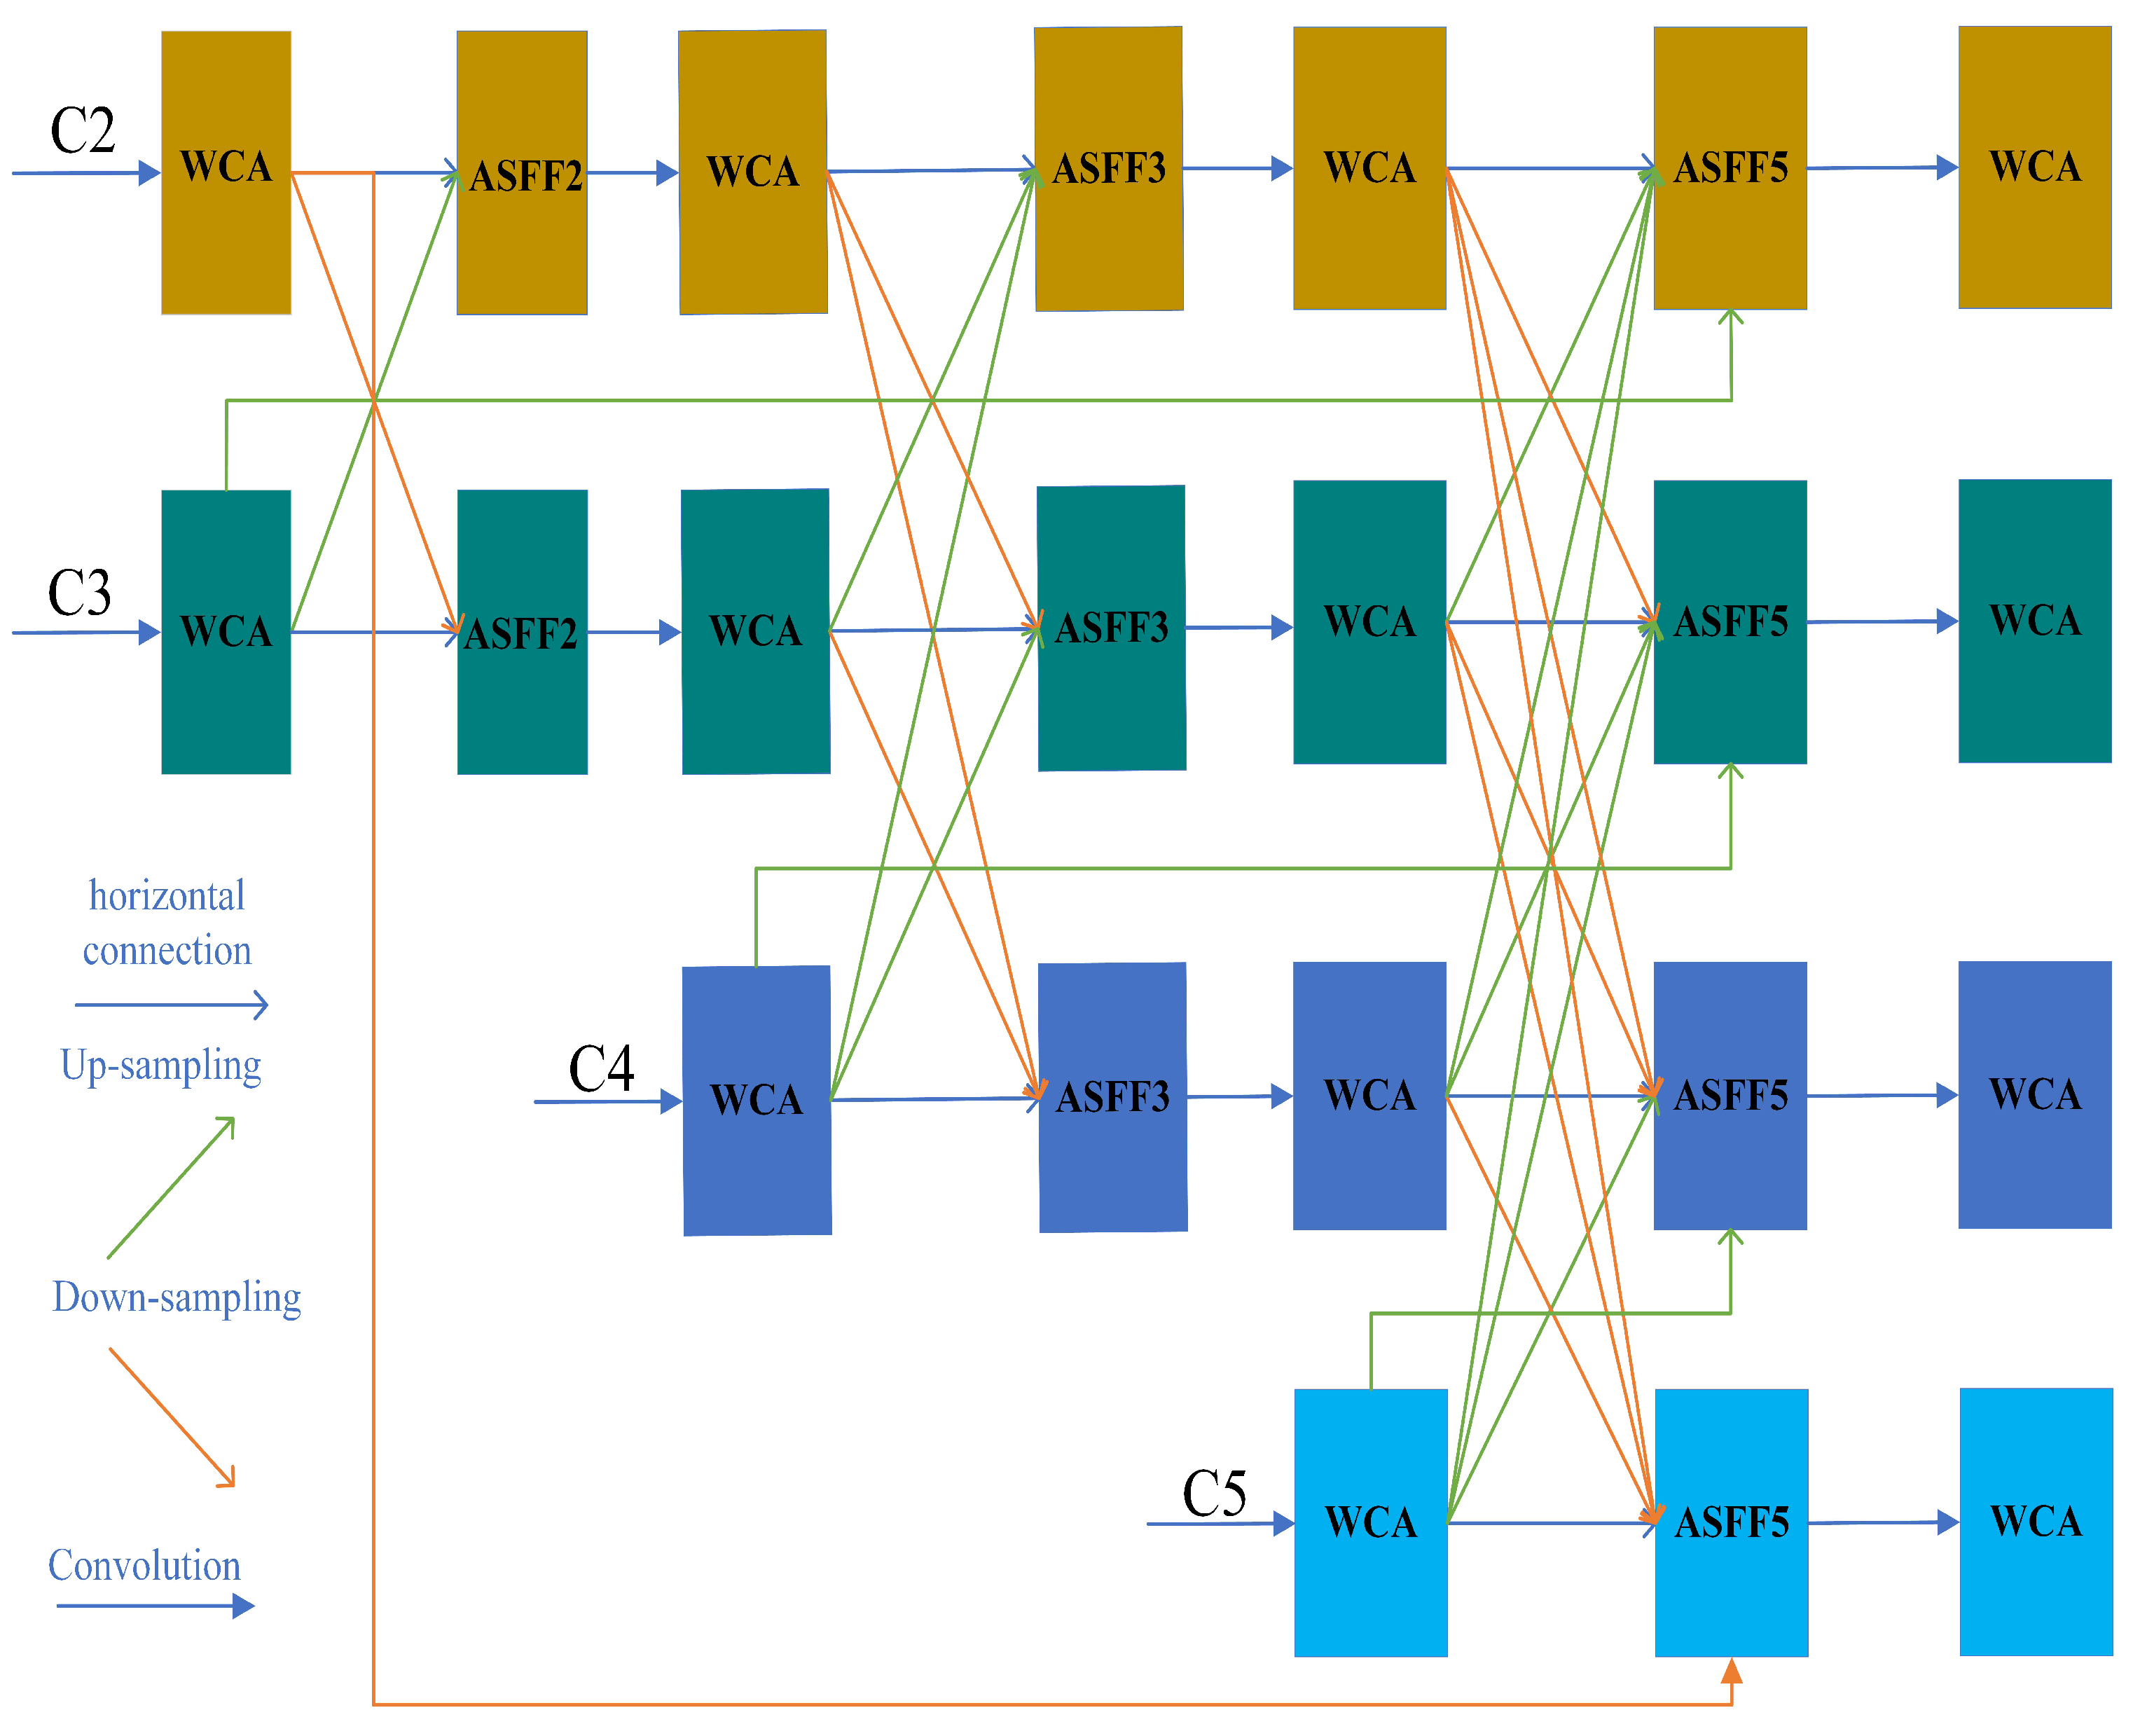
AFPN [29] initiates the fusion process by combining low-level and high-level features with different resolutions, gradually incorporating them into the fusion and ultimately fusing the top-level features of the backbone. This fusion approach avoids semantic gaps between non-adjacent levels and achieves direct interaction between low-level and high-level features, thus avoiding information loss or degradation. However, although the number of parameters of AFPN is already low, the computational workload is relatively large and the effect in detecting small targets is only average. For this reason, we propose Sim-AFPN to address the above dilemma. As shown in Figure 4, we replace the ordinary convolution with the WCA module, which has the same input and output channels, and reduce the number of ordinary convolutions used for the final calculation. Additionally, in order to balance that the features in different layers have different abstraction levels and semantic information, making the feature representation more comprehensive and rich, we reconstruct the AFPN structure by adding the original feature information to the final feature fusion part that has undergone layer-by-layer processing. Specifically, we use ASFF [30] to assign different spatial weights to features at different levels during the final multi-level feature fusion process, which enhances the importance of key levels and reduces the impact of conflicting information from different objects. Let denote the distance from the first Cj level to the Ci feature vector at the layer, and denote the feature vector from the Cj layer to the Ci spatial weights of the feature vectors at the layer, constrained by a weight sum of 1, and obtains the result feature vector representing the Ci layer through the fusion of m-layer features. The basic formula of ASFF is as follows:
where if j = i, then a horizontal connection is made, and if j > i, then up-sampling operation is performed, and vice versa, down-sampling operation is performed. Now each of the Ci layer’s initial features is re-added to the final features for fusion, alleviating the problem that some detail information may be lost as the layers deepen. That is, at the final feature fusion, ASFF fuses five layers of features instead of four, and the improved formula for ASFF5 is as follows:
where denotes the transition from the initial first layer to the Ci layer, the feature vector at the layer, and is its corresponding spatial weight. The original C3 up-sampling is fused into the ASFF5 of C2, aiming at enhancing the context awareness of the high-resolution shallow feature through the semantic information of the middle feature, thus improving the positioning accuracy of small targets. If the original C4 up-sampling is fused to C3, the abstract semantics of the deep feature will guide the middle feature to suppress complex background interference and optimize the recognition robustness of mesoscale targets. The original C5 up-sampling is fused to C4, and the deepest global semantics is used to strengthen the ability of middle-level features to distinguish occluded or overlapping targets. At the same time, the high-resolution original C2 down-sampling is fused to the deep C5, and the shallow details are reversely injected to make up for the lack of sensitivity of small targets caused by low resolution in deep features. This multi-directional cross-layer fusion strategy, through the spatial weight ASFF5, realizes the dynamic coordination of semantics and details on the basis of retaining the unique advantages of the original features of each level.

Figure 4.
Architecture of Sim-AFPN.
2.4. Wise-IoU Loss
The loss function for BBR is essential to object detection. It is used to determine positive and negative samples and to evaluate the distance between the prediction box and the real box. Intersection over Union [31] (IoU) is the ratio of intersection and concatenation between predicted and true frames, effectively mitigating the interference of the bounding box size in proportional form. The model can well balance the learning of large and small objects effectively when using as the BBR loss function, as shown in the following Equations (10) and (11):
where are the centroid coordinates and width and height of the ground truth bounding box, respectively. are the centroid coordinates and width and height of the prediction bounding box, respectively. However, the IoU loss function does not optimize the case where the real and predicted boxes do not intersect, nor does it reflect the problem of how the real and predicted boxes intersect. However, the IoU loss function does not solve the problem that when there is no overlap between the prediction frame and the real frame (IoU = 0), the gradient is zero and the back propagation and update cannot be carried out. It is insensitive to the scale of the prediction frame and the real frame, which may lead to the model paying too much attention to the big target and ignoring the small target in the training process, or causing scale deviation.
Towards the mitigation of these problems, Zheng et al. [32] proposed the current mainstream CIoU loss function. By introducing the penalty terms of center distance and aspect ratio, the position and shape of the prediction frame can be better optimized and the accuracy of target detection can be improved. The CIoU loss function exhibits limitations as it fails to account for the balance between easy and hard samples, potentially leading to suboptimal performance for certain challenging detection tasks. Furthermore, it does not address the issue of gradient vanishing when there is no overlap between the predicted and ground truth boxes, hindering the model’s ability to learn and adapt in such scenarios. In view of the above, we employ an IoU-based loss with a dynamic non-monotonic static focusing mechanism (FM), which is called Wise IoU (WIoU) [33]. WIoU substitutes the traditional IoU with a distance-aware outlierness metric. This metric assesses anchor quality by measuring how much the predicted and ground truth centers deviate from each other, relative to the diagonal of their minimum enclosing rectangle. Additionally, it explicitly accounts for positional accuracy and separates gradient effects from differences in absolute scale. A dynamic non-monotonic focusing mechanism dynamically adjusts gradient contributions based on sample difficulty. By assigning lower weights to high-quality anchors and suppressing gradients from extreme outliers, WIoU prioritizes medium-quality samples that are most informative for model refinement. This contrasts with CIoU uniform weighting, which allows high-quality anchors to dominate updates while amplifying noise from low-quality predictions. The equations for WIoU are shown in the following Equations (12)–(14):
where denotes a normalization coefficient representing the ratio of to its spatial average. quantifies the relative density of values compared with their spatial average. A momentum-based LIoU sliding average stabilizes training by adaptively balancing historical and current loss values, mitigating optimization oscillations caused by imbalanced sample distributions. This ratio enables the model to automatically emphasize regions with sparse predictions ( > 1) or suppress over-dense areas ( < 1), creating an adaptive focus mechanism. Dynamically adjusting weights through improves robustness in complex scenes with occlusions or clustered instances. b denotes the centroid of the prediction box, denotes the centroid of the ground truth box, c denotes the diagonal length of the smallest external rectangle between the ground truth and prediction bounding box, and denotes the Euclidean distance between the two points of the computation. and are scaling exponents modulating the weight distribution, which in this paper are set to = 1.9 and = 3. Power-law scaling through and exponents creates nonlinear relationships between the weight magnitude and the spatial/density characteristics. The (-) exponent in the denominator ensures asymptotic stability when approaches , preventing numerical instability during gradient computation. The differentiable formulation enables end-to-end training with smooth gradients, while the power-law scaling prevents vanishing gradients during backpropagation. The adaptive weighting also accelerates convergence by focusing learning on challenging regions.
3. Experiment Methodology
3.1. HVTA Dataset
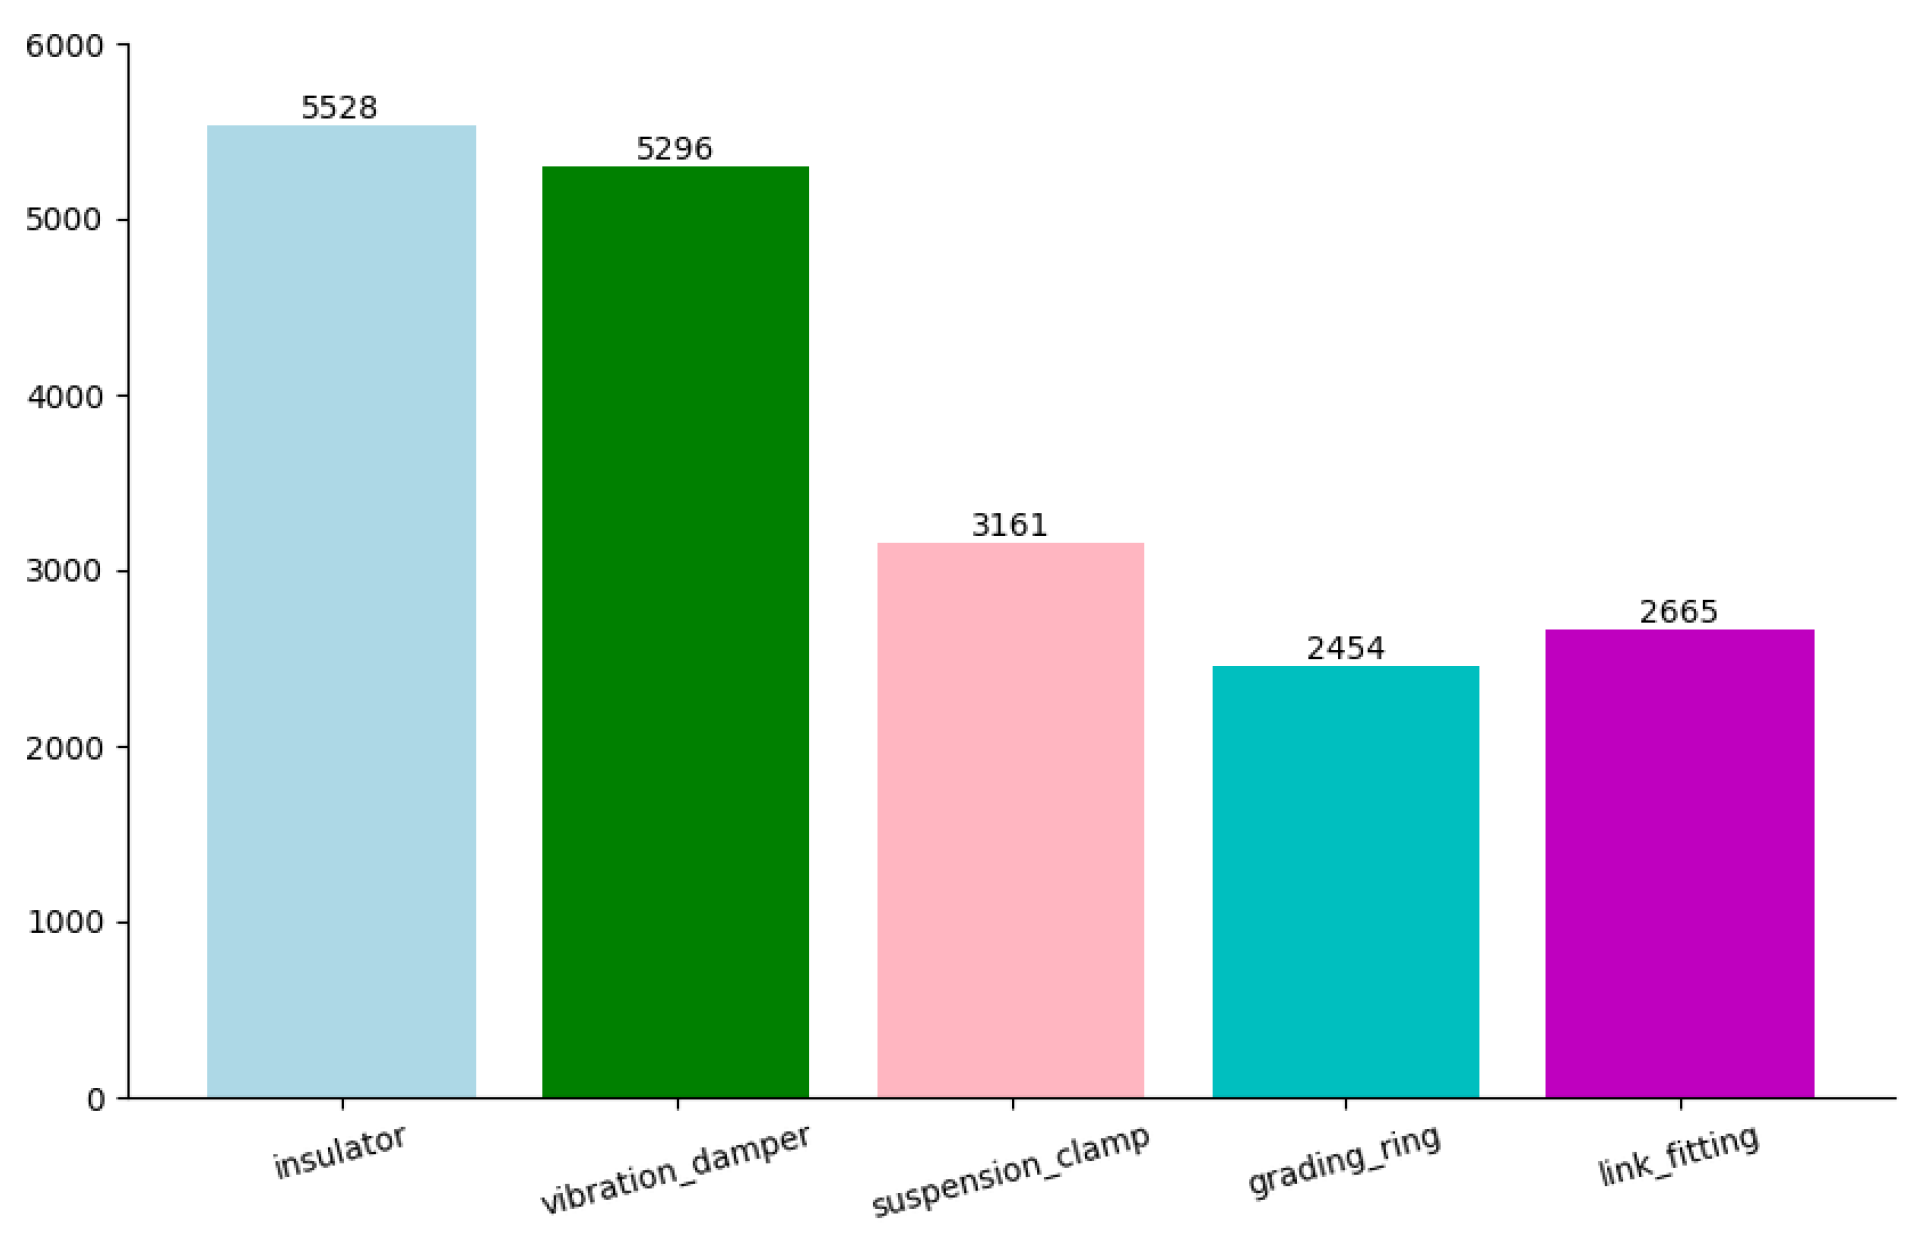
Since a publicly dataset for High-Voltage Transmission Accessories (HVTA) species identification is currently unavailable on the web, and predominantly focused on single-object detection [34,35], we decided to use a self-constructed method for data collection via the web and UAV cameras. The dataset has a total of 2685 images covering five common types of high-voltage transmission accessories, namely, suspension clamp, grading ring, vibration damper, link fitting, and insulator, which is shown in Figure 5. According to the ratio of 8:1:1, the dataset images are randomly divided into training set, verification set and test set. In order to meet the challenges brought by complex scenes in the real world, such as poor light conditions, snowflake interference, and partial occlusion, we have implemented a comprehensive data enhancement strategy, which is especially used to simulate these environmental adversities. In addition to the standard geometric transformations (for example, mirror image, rotation, and cropping), we also combine the synthetic transformation to simulate the night imaging effect by dynamically adjusting the brightness and contrast distribution, which is inspired by the weak light enhancement technology. In order to copy the snow occlusion, we apply random noise injection and the texture coverage algorithm to simulate the light scattering and heat absorption patterns under snowy conditions. In addition, the adaptive random erasure is used to simulate the partial occlusion that is common in on-site inspection. The adaptive random erasure selectively masks the region of interest to train the model on incomplete visual cues. These targeted extensions not only expand the diversity of datasets, but also clearly solve the domain gap between the images collected by the laboratory and the actual deployment environment.
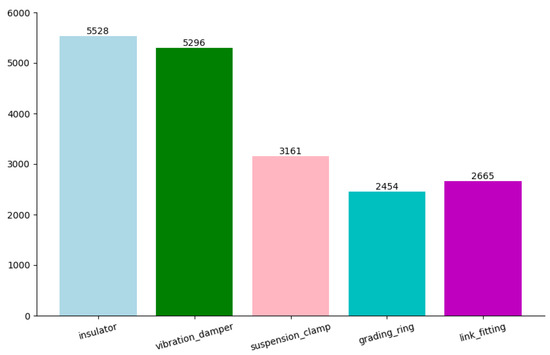
Figure 5.
The label distribution in high-voltage transmission accessories dataset.
3.2. Model Evaluation Metrics
To evaluate the performance of the model, we use Precision (P), Recall (R), and mean Average Precision (mAP) as evaluation metrics. Precision represents the proportion of instances predicted as positive samples that are truly positive, while Recall represents the proportion of instances correctly predicted as positive samples among all instances that are truly positive. AP, calculated as the area under the PR curve, indicates a higher performance with a larger enclosed area. mAP50 is the performance of the average precision when the IoU threshold is 0.5, while mAP95 is the performance of the average precision when the IoU threshold is 0.95. Compared with mAP50, mAP95 puts forward higher requirements for the overlap between the prediction frame and the real frame, and IoU needs to reach or exceed 0.95 to be regarded as an effective detection. Both of them are important indexes used to evaluate the model performance in the field of target detection, and together they constitute a comprehensive evaluation of the model detection ability.The definitions are given by Equations (15) to (18).
For deep learning models, besides the performance-related evaluation indicators, there are also aspects related to model complexity. In this paper, we also choose the number of parameters, network model size (MByte), and FLOPs (floating point operations) as evaluation metrics related to model complexity.
3.3. Training Setting Parameters
The experimental environment of this paper is depicted in Table 1. We choose to conduct comparative experiments on the publicly available VisDrone2019 dataset, VOC2007 dataset, and our HVTA dataset to demonstrate the superiority of our proposed WCA module and Sim-AFPN in detecting dense small-size objects and multi-class detection. The experiment includes adding different attention mechanism modules to the trunk of the popular YOLOv8 and replacing Sim-AFPN in the necks of YOLOv5, YOLOv8, and YOLOv10. Compared with different models, it shows the superiority of WCANet in HVTA datasets. These are all trained from scratch to ensure the fairness and reliability of the comparative experiment. During the training process, we set the input image size to 640 × 640, the number of training iterations to 200, and the batch size to 16, balancing memory constraints and gradient estimation stability. For optimization, we adopted SGD with momentum (0.937), initialized with a learning rate (lr) of 0.01 that linearly decays to 1 × to balance convergence stability and fine-tuning precision. A 3-epoch warmup phase gradually scaled the learning rate from 0.1 × lr to lr while adjusting momentum and bias terms to mitigate early-training instability. Weight decay (5 × ) enforced L2 regularization, complemented by task-specific loss balancing coefficients optimized for small-object sensitivity.

Table 1.
Experimental environment.
4. Results and Analysis
4.1. Comparison of Different Attention Modules and Characteristic Pyramids
As can be seen from the results in Table 2, the modules CBAM [36], CA [37], and SE [38] all improve the baseline performance of target detection except ECA [39]. What deserves attention is that CBAM improves the mAP50 of YOLOv8 by 0.25%, but at the cost of more parameters and calculations than SE. For CA, it obtains almost the same performance as YOLOv8 and exceeds it by 0.09% in terms of mAP95. Additionally, we can see that the proposed WCA module consistently outperforms networks based on adding SimAM [40], CBAM, and other attention modules. In the more challenging object recognition scenario of the VOC2007 dataset presented in Table 3, which requires sophisticated multi-scale detection capabilities and demonstrates limited potential for performance enhancement, conventional attention mechanisms frequently exhibit suboptimal effectiveness or even detrimental impacts. Our proposed WCA demonstrates consistent performance improvements, achieving a precision of 74.12%, alongside attaining mAP50 and mAP95 values of 69.97% and 53.04%, respectively. In conclusion, according to Table 4 of our THVA dataset, all attention modules have shown positive gains, and our WCA continues to be the top performer. These comprehensive experiments substantiate WCA’s exceptional adaptability to diverse object characteristics, establishing it as a versatile solution for addressing scale-variant detection challenges. The statistically significant improvements over baseline models and competing attention architectures underscore the module’s superior feature integration capabilities and architectural efficacy in complex visual recognition tasks.
Table 2.
Comparative results of object detection with different attention methods on the VisDrone2019 test dataset.
Table 3.
Comparative results of object detection with different attention methods on the VOC2007 val dataset.
Table 4.
Comparative results of object detection with different attention methods on the HVTA test dataset.
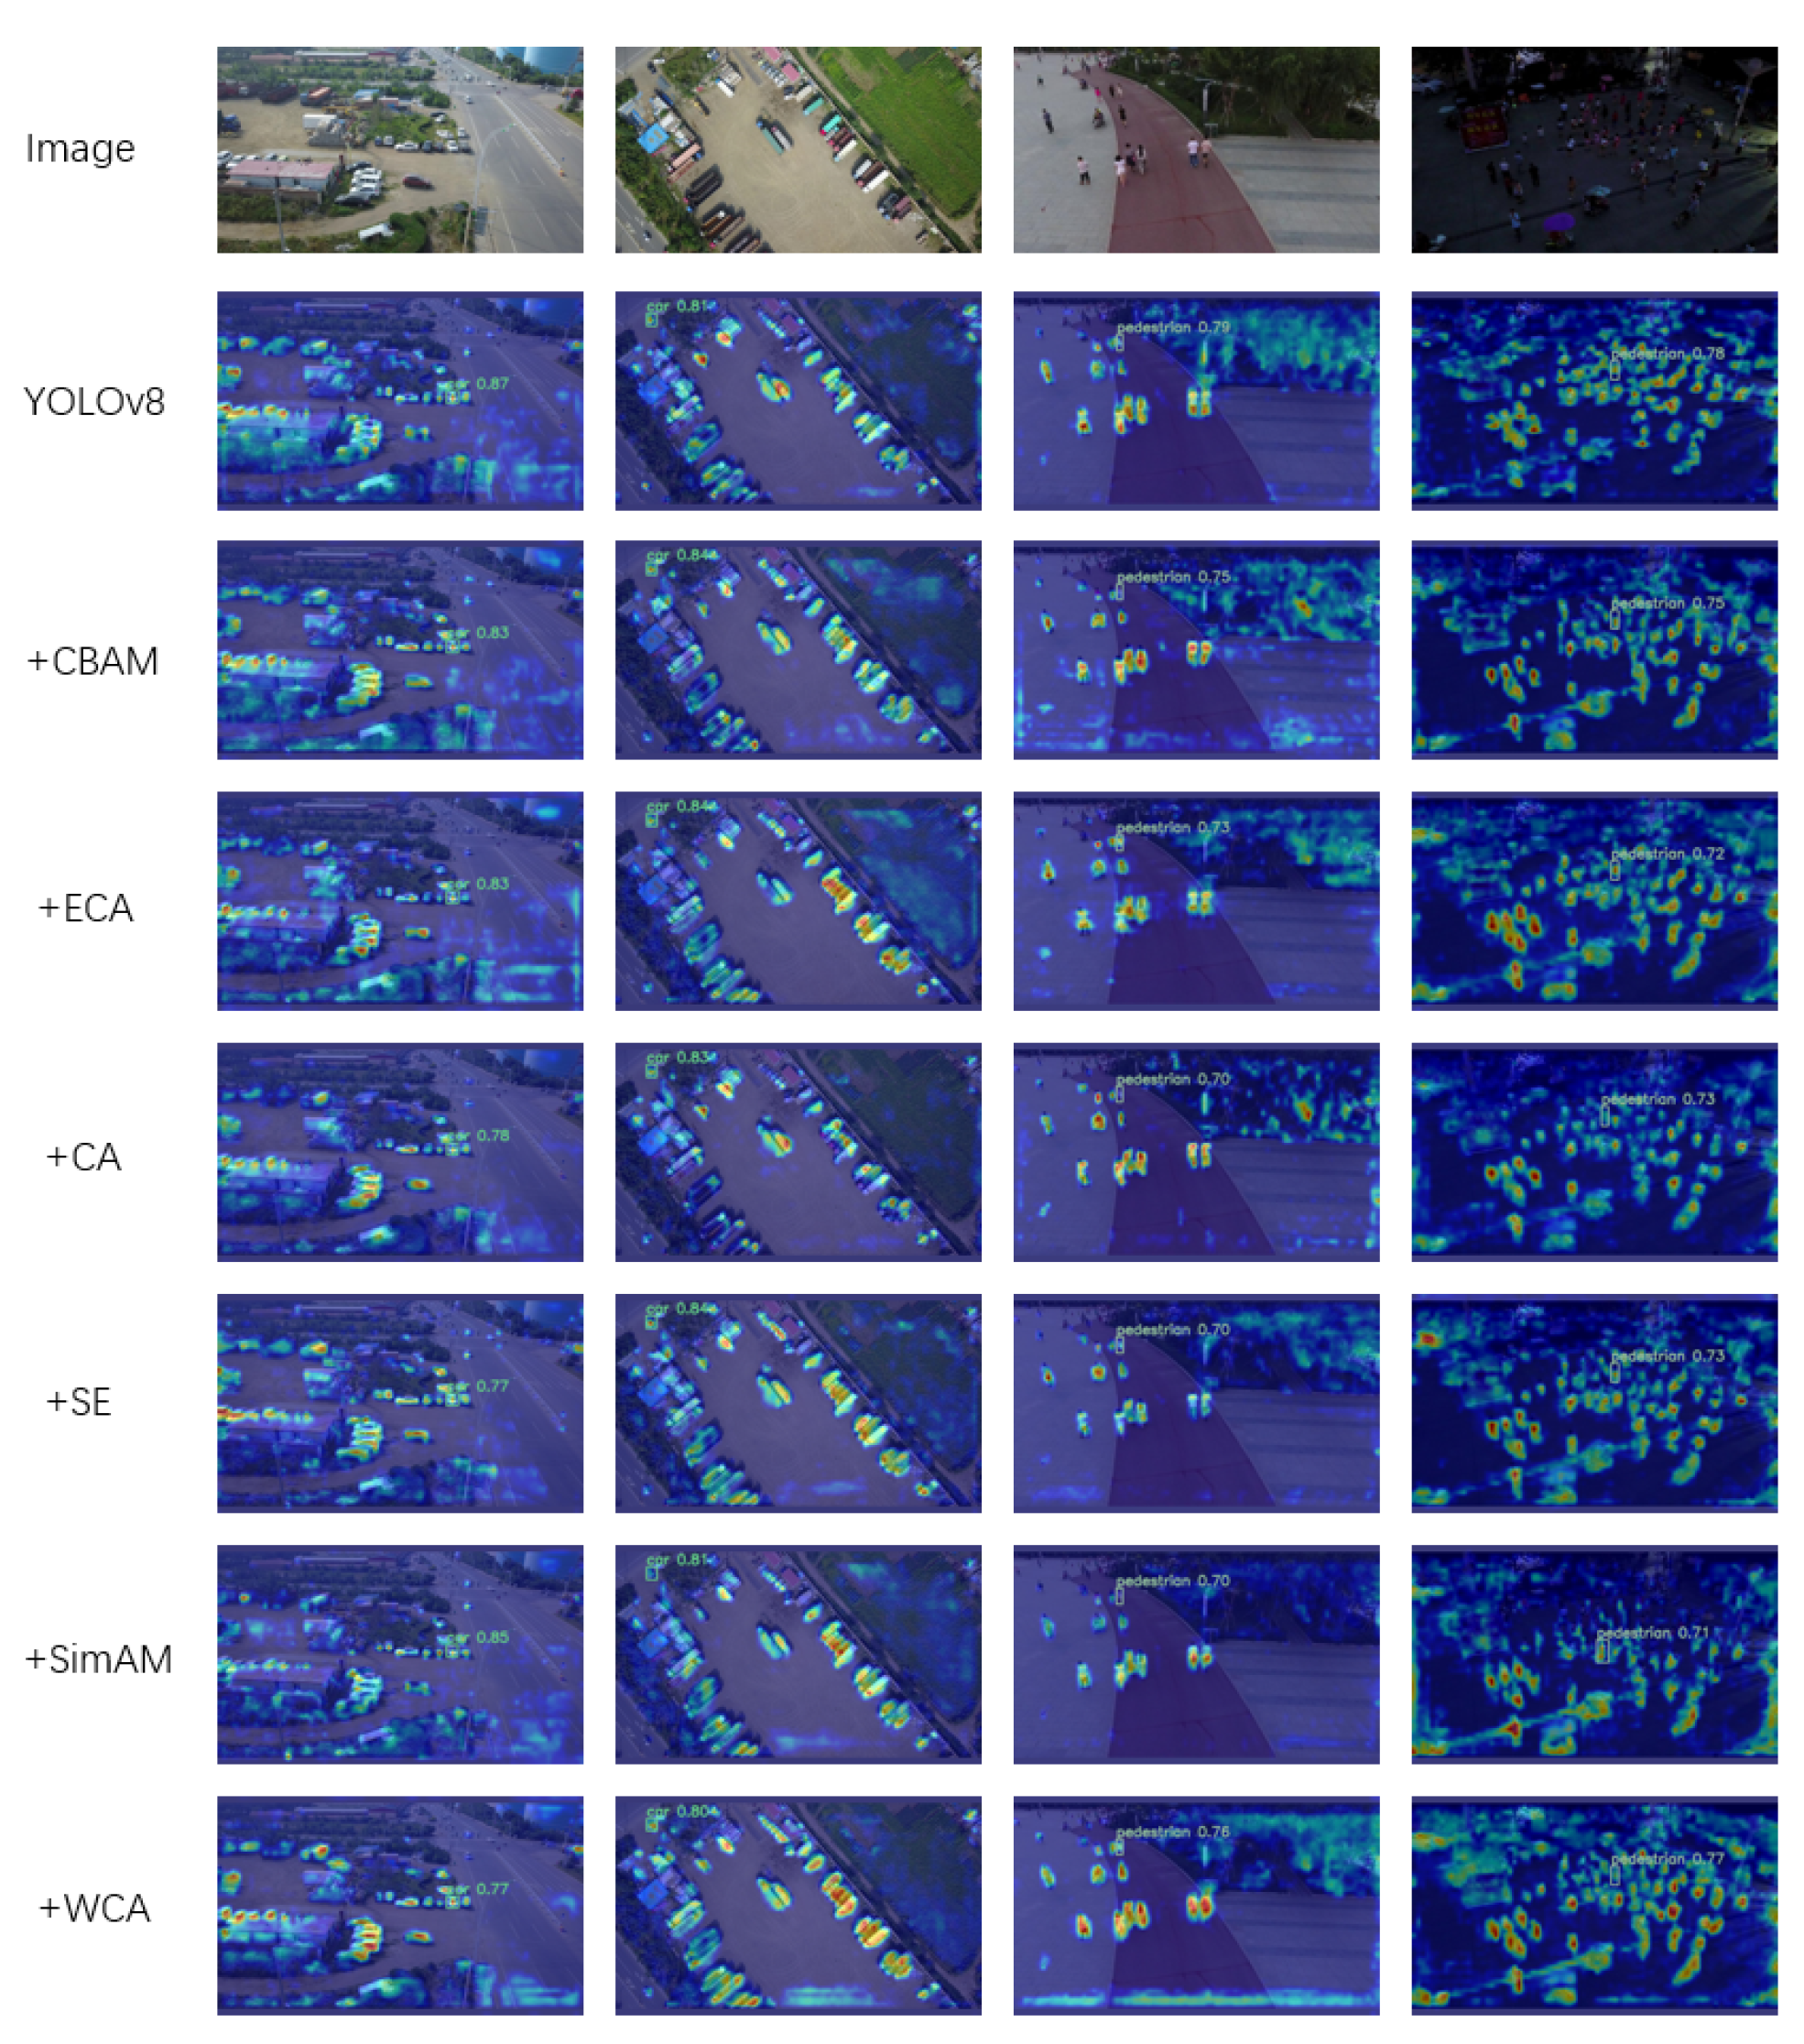
Figure 6 depicts the thermographic analysis of the test images in the YOLOv8 comparative experiment with all attention modules. The heat map was created by Grad CAM (Selvaraju et al. [41]), and the results of the VisDrone2019 dataset were generated in the small target layer. The results show that the proposed attention method WCA is feasible, which can highlight the key information of features and improve the attention of small targets, and is superior to other attention methods in certain situations. Figure 7 presents the detection results of our WCA when integrated into different datasets. For dense object detection, WCA effectively disentangles overlapping features, enabling accurate localization. In dealing with occluded objects, it can capture contextual information to infer the presence of hidden parts. Regarding small-target objects, the module’s adaptive channel-attention mechanism enhances the representation of fine-grained features. Overall, these results highlight the WCA module’s versatility and robustness across diverse datasets, offering a promising solution for complex object detection tasks.
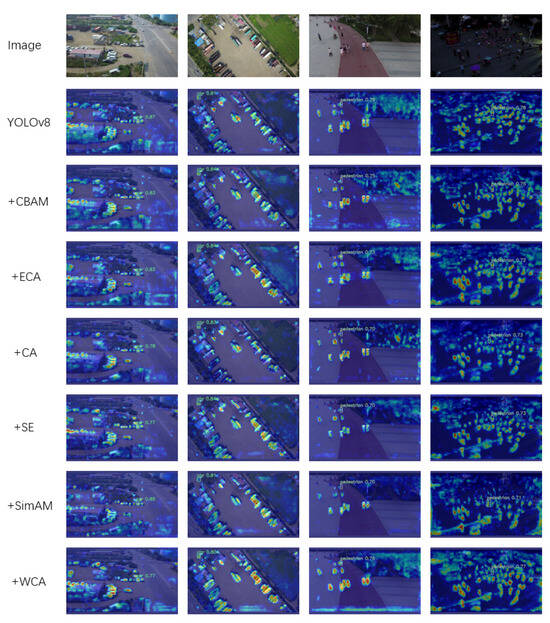
Figure 6.
Comparison of the heat maps after model fusion for each attention module.
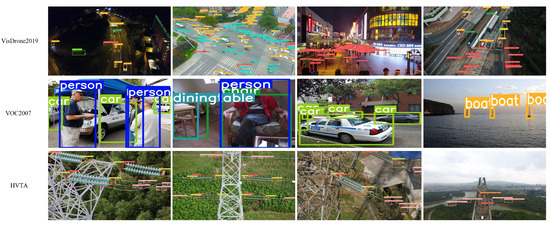
Figure 7.
Our WCA module adds the detection results on a variety of datasets.
The neck of the classic YOLO series used in industry has been replaced with AFPN and Sim-AFPN. The comparison results are shown in Table 5, while AFPN shows good results on the VisDrone2019 dataset, and the number of parameters and the model size are reduced compared with the original YOLOv5 and YOLOv8. The computational complexity is increased significantly. Our proposed Sim-AFPN effectively makes up for the shortcomings of AFPN, not only reducing parameters and the model size compared with YOLOv8 replacing AFPN by 21.8% and 20.8%, but also achieving superior mAP50 and mAP95 performance with a slight increase in computational complexity compared with the base model. Our proposed Sim-AFPN architecture demonstrates state-of-the-art performance on the latest YOLOv10 framework, notably achieving benchmark mAP50 and mAP95 values of 34.38% and 19.61% respectively. Although this implementation did not yield significant optimization in computational and parametric efficiency compared with baseline models, the performance metrics establish a new paradigm for feature pyramid network design. Comparative analysis reveals that conventional AFPN neck replacement architectures exhibit substantial computational and parametric overheads while demonstrating suboptimal performance across all evaluation metrics when benchmarked against YOLOv10. This empirical evidence substantiates that our Sim-AFPN framework delivers consistent performance enhancements across multiple YOLO iterations, suggesting its universal applicability within the YOLO architectural ecosystem. The experimental outcomes particularly highlight Sim-AFPN’s superior feature fusion capabilities without compromising detection accuracy thresholds.
Table 5.
Comparison results of feature pyramid AFPN and Sim-AFPN on the VisDrone2019 test dataset.
4.2. Ablation Study
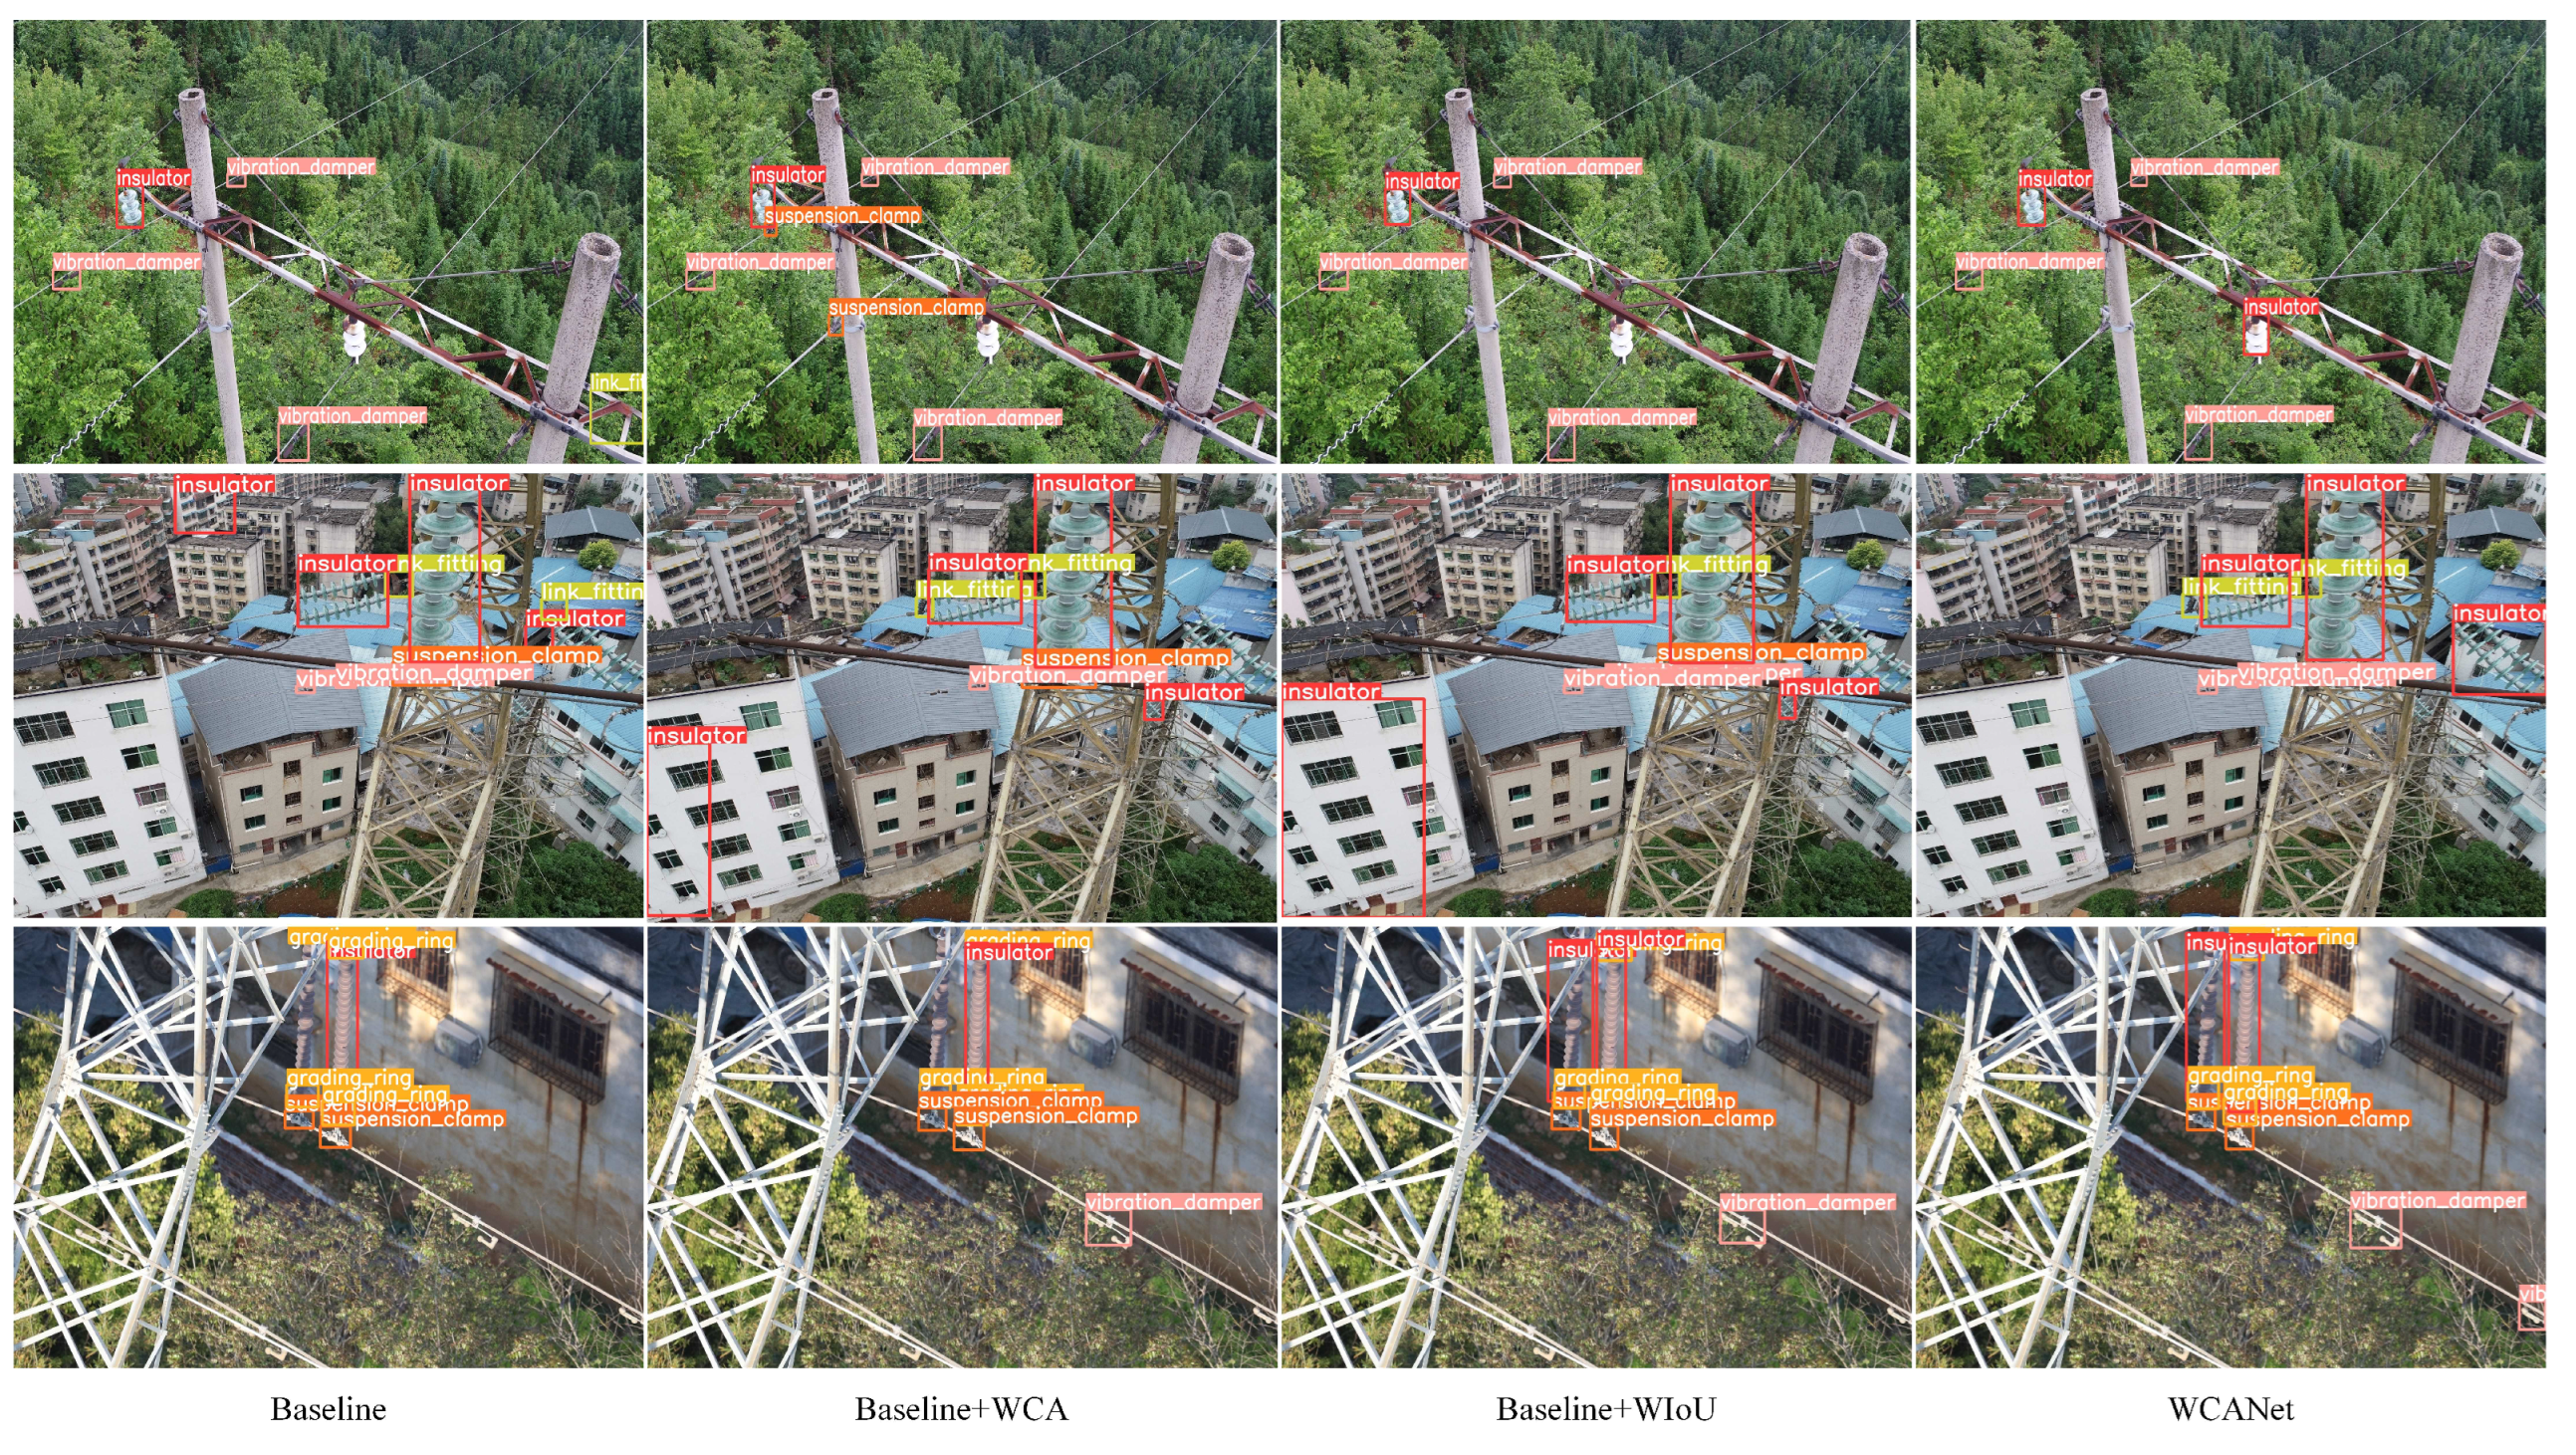
We designed an ablation experiment on the high-voltage transmission accessories dataset; the experiment utilizes a combination of CSPDarkNet, Sim-AFPN, and CIoU loss functions as a baseline to assess the impact of integrating various modules. The data in Table 6 reveals that the addition of the WCA module to the backbone significantly enhances detection accuracy, resulting in a 1.04% increase in mAP50. This demonstrates that integrating the WCA module into the already optimized architecture still yields notable improvements. The improved strategy of introducing WIoU loss function immensely alleviates the inaccuracies in BBR regression and boosts the model’s mAP95 by 0.99%. The WIoU adaptive gradient gain mechanism mitigates localization inaccuracies caused by scale imbalances, particularly for small objects. Statistical analysis reveals a 4.69% reduction in BBR errors for a dense vibration damper, confirming its superiority in precise coordinate prediction. When the two modules are combined, both mAP50 and mAP95 attain their peak values, showcasing respective improvements of 2.23% and 1.01% compared with the original network. This validates that the proposed enhancement strategy in this study effectively elevates the accuracy of detection and identification of high-voltage transmission accessories.
Table 6.
Results of the ablation experiments.
Visual comparisons are illustrated in Figure 8 to demonstrate practical benefits. For instance, due to the ambiguity in depth features, the baseline model often misplaces small components. In the first row of the images, the iron plate is incorrectly identified as a linking accessory by the baseline model, but this issue is resolved when WCA or WIoU is added. Fortunately, WCANet has achieved detection for all categories without any false positives. For the image in the second row, all models except WCANet make poor judgments, mistaking tall buildings for insulators due to the layered shape of insulators. Since the attachments of transmission lines are mixed with the environment and difficult to distinguish, all models fail to detect the suspension clamp in the third row of images. Even the baseline and baseline + WCA models fail to detect the insulator. In contrast, WCANet is valuable because it manages to detect some suspension clamps that are partially cut out from the frame.

Figure 8.
Visual contrast diagrams of different modules were added in the ablation experiment.
4.3. Comparison of Different Object Detection Networks
Through the comparison between the WCANet network and the mainstream object detection networks (including Faster RCNN, RetinaNet, EfficientDet, SSD, and YOLOv5 to YOLO v12), the effectiveness of the WCANet network in detecting a high-voltage transmission accessories dataset is further verified. The comparative experimental results, as shown in Table 7, indicate that although Faster RCNN, EfficientDet, and SSD have both incorporated pre-trained weights, their training performance remains mediocre. Conversely, both the YOLO series and WCANet, which were trained from scratch, have demonstrated excellent results. The proposed WCANet network achieved a mAP50 value of 75.67%, and even the more challenging mAP95 value reached 45.63%, representing a 20.98% improvement over the mAP50 value of EfficientDet with pre-trained weights and a 4.36% improvement over the latest YOLOv8. Even the best-performing YOLOv7 falls short of the WCANet mAP50 by 3.42%. In conclusion, the WCANet network achieves the highest mAP value, and at the same time, our network is lightweight, with 12% fewer parameters than the lightest YOLOv5 in the parameter count comparison, and the model size is basically the same as that of YOLOv5. YOLOv11 and YOLOv12 incorporate sophisticated attention mechanisms, including hybrid transformer-convolution blocks and dynamic spatial sensing attention. However, they attain mAP50 values of only 69.71% and 66.68%, respectively. While these enhancements demonstrate the latest advancements in YOLO variants, the proposed WCANet still outperforms both models, achieving a 5.96% improvement over YOLOv11 and an 8.99% increase compared with YOLOv12. The detailed data of different classes of transmission accessories in Table 8 indicate that WCANet has a good detection performance on the HVTA dataset, particularly in dense scenes dominated by small objects.
Table 7.
Comparison with other methods on the HVTA dataset.
Table 8.
Class performance of WCANet on the high-voltage transmission accessories dataset.
4.4. Visual Analysis of Detection Results
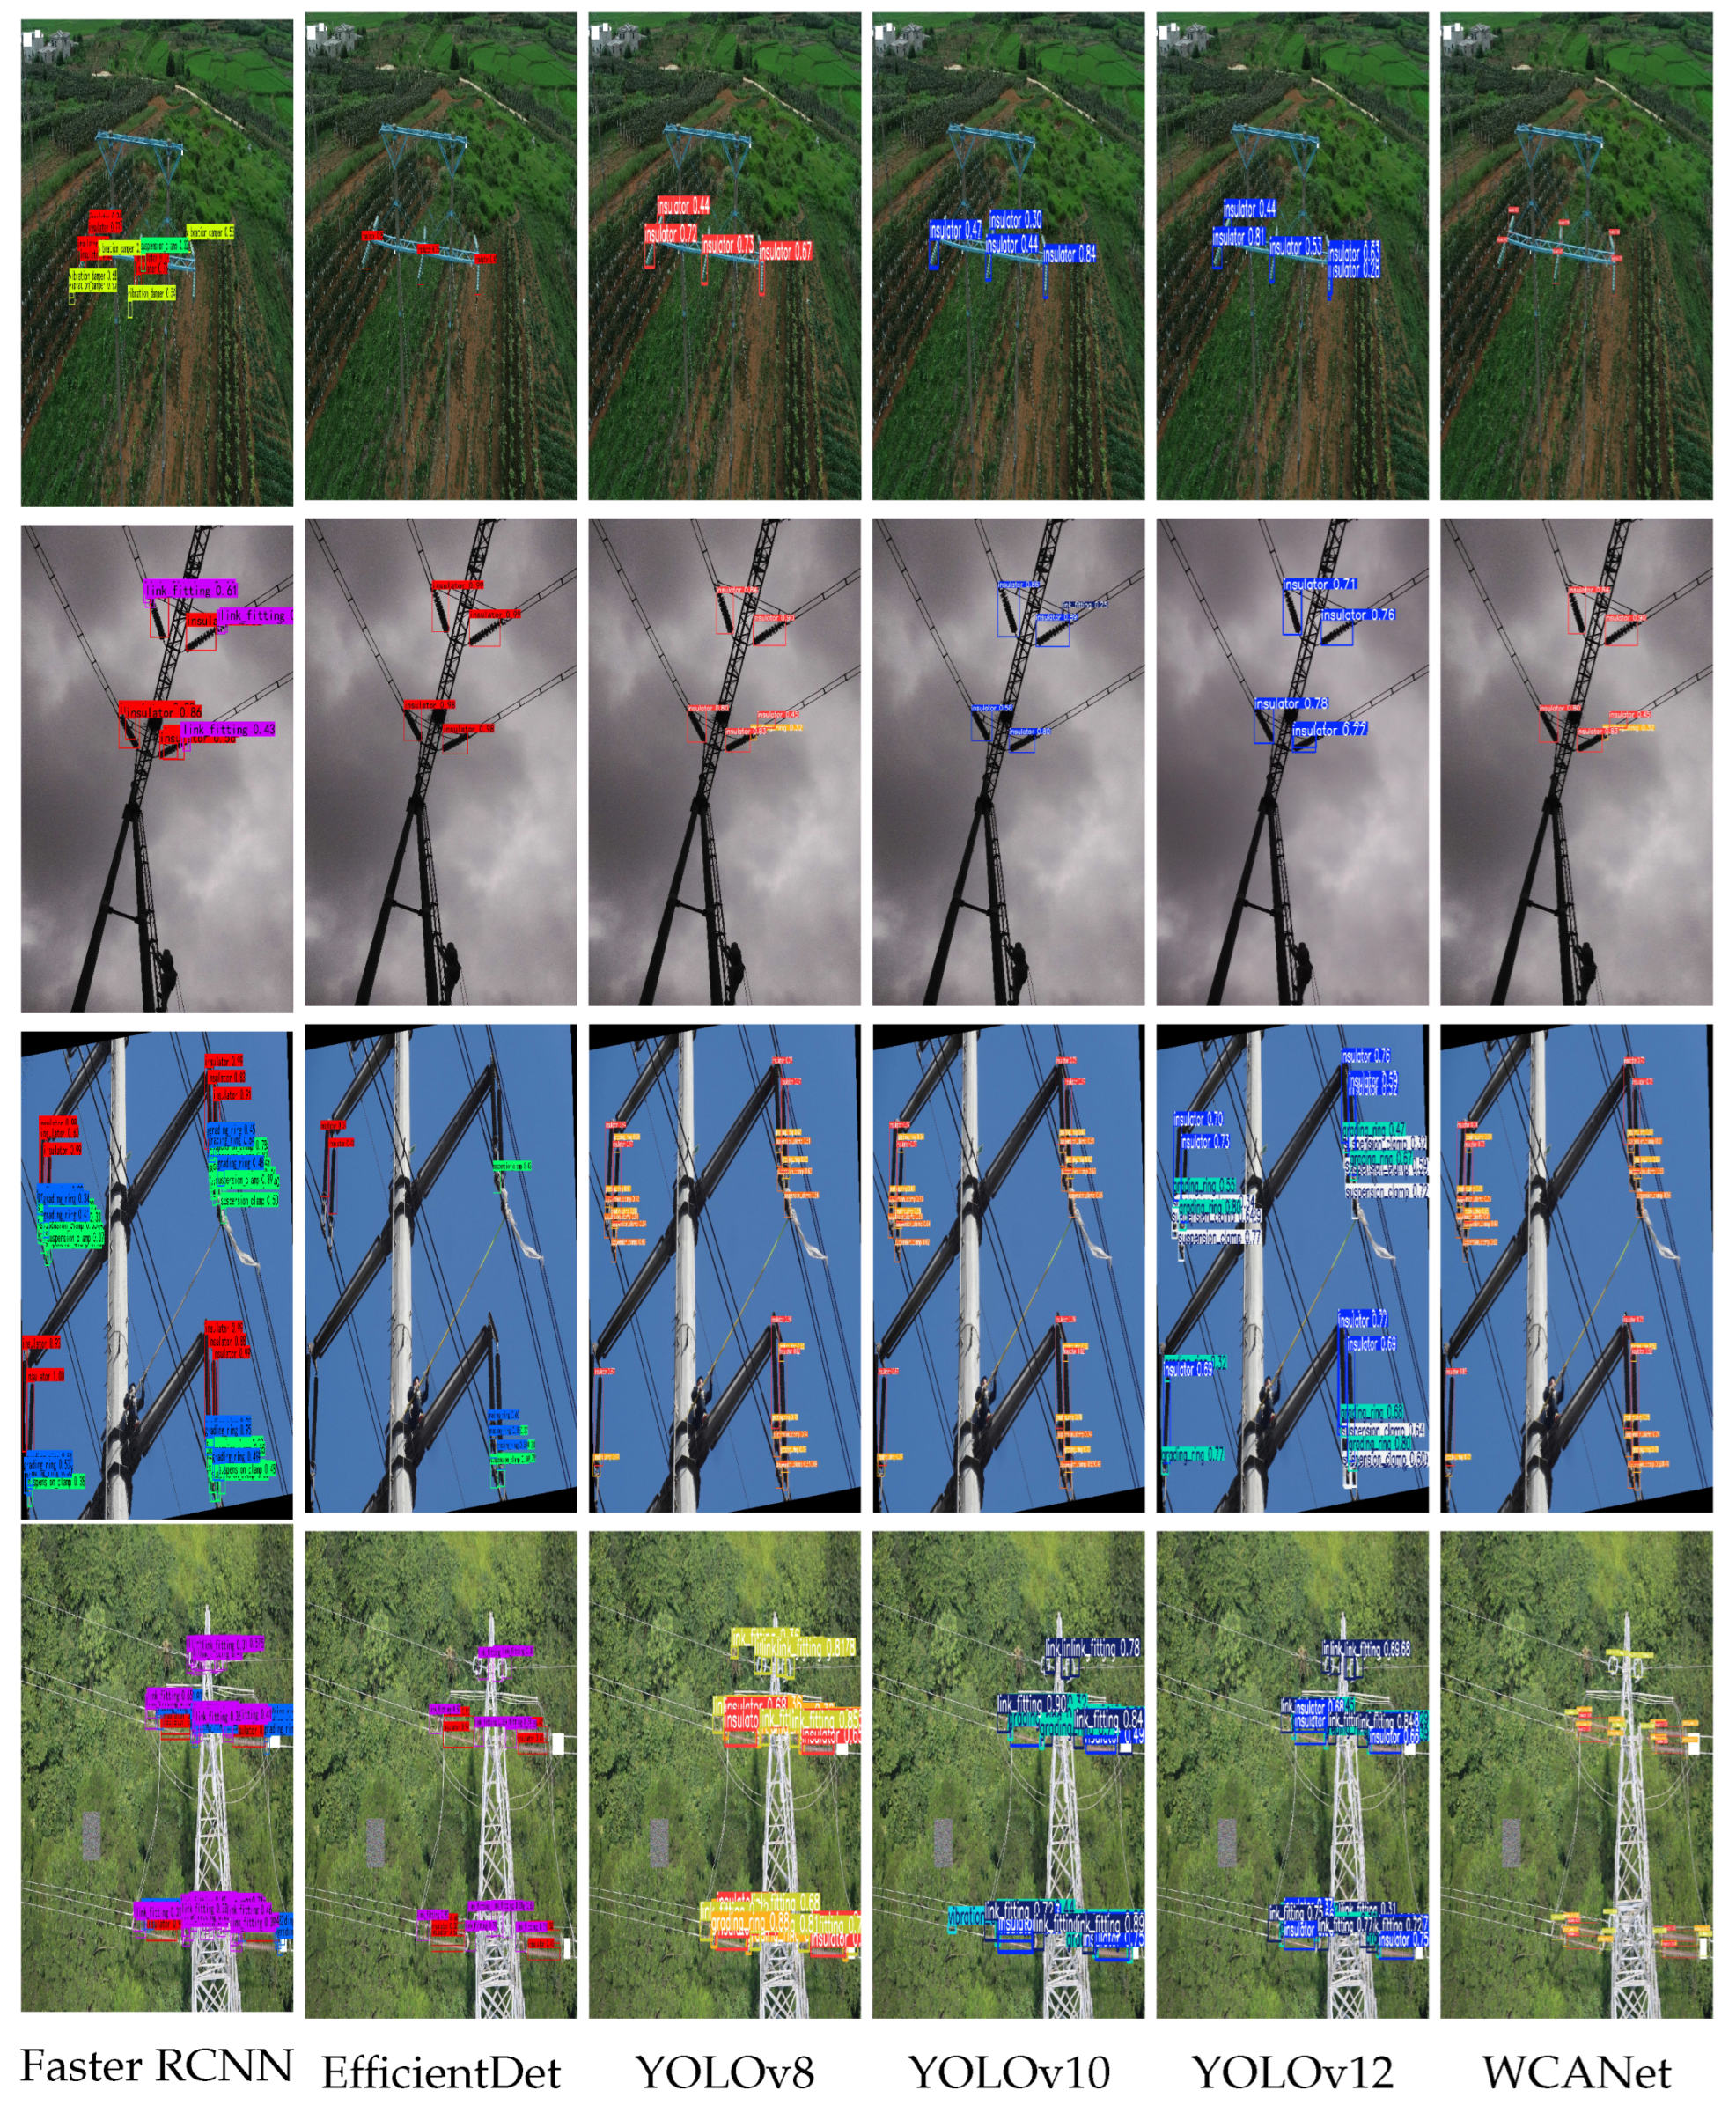
The visual detection results of different methods are shown in Figure 9. From the first row of the figure, it can be intuitively observed that only WCANet detected all the insulators, while other methods exhibited instances of missed detection. It is commendable that Faster RCNN, which belongs to the second stage, can detect a vibration damper, but it always has repeated detection and detection frame dislocation. In the dimly lit environment depicted in the second row, EfficientDet only detected insulators, failing to detect the link fittings. Although the YOLO series detected the link fittings, they also exhibited instances of false detection, whereas WCANet not only avoided false detection but also maximized the detection of multiple categories. In the fourth row, in the face of a complex environment with multiple high-voltage transmission accessories, WCANet achieved the highest number of category detections compared with the third best-performing YOLOv8, without misidentifying other objects as connecting fittings. Experimental results demonstrate that WCANet is capable of detecting objects in images from various domains and perspectives, including complex backgrounds, random orientations, and noise interference. It accurately extracts key features from images and comprehensively detects objects within images, reducing false detection and missed detection rates.

Figure 9.
Comparative detection results of different models. The red box indicates the actual marked bird’s nest. All models can detect the bird’s nest, but none can detect the rusted nut except our model.
5. Conclusions
In this paper, we propose a new efficient lightweight detection framework, WCANet, for improving detection efficiency, accuracy, and cost reduction in high-voltage transmission environments. In this network, the designed plug-and-play WCA module can be easily combined in different computer vision tasks to significantly enhance a small target feature representation. The proposed Sim-AFPN network structure integrates key area features from different layers by connecting and adding initial information layer by layer. A new WIoU loss function is utilized in WCANet to reduce the competitiveness of high-quality anchor boxes and mask the impact of low-quality examples through dynamic non-monotonic FM. Experiments show that, in our construct HVTA dataset, WCANet has significantly reduced the computational complexity; only 2.2 M parameters are about 26% smaller than YOLOv8s, and the model weight of 5.2 MB has achieved the optimal solution. At the same time, it maintains a competitive accuracy of 75.67%. In addition, in the VisDrone2019 benchmark test, Sim-AFPN improves the small target detection AP to 34.38%, and verifies the effectiveness of the WCA module in enhancing the feature representation of small targets. WCANet is superior to other models in the number of parameters, model size, and mAP, making it a competitive object detection network.
Author Contributions
Conceptualization, J.C. and P.S.; methodology, J.C., P.S. and Y.X.; software, P.S. and X.F.; validation, J.Z.; investigation, P.S. and Y.X.; resources, P.S.; writing—original draft preparation, J.C. and M.X.; writing—review and editing, P.S., Y.X. and X.F.; visualization, M.X.; supervision, Y.X. and P.S.; project administration, P.S. and J.Z.; funding acquisition, P.S. All authors have read and agreed to the published version of the manuscript.
Funding
This work was supported in part by the National Key R&D Program of China, Grant/Award Number 2022YFB4703405; in part by the Key Project of Jiangsu Provincial Key Laboratory of Transmission and Distribution Equipment Technology Team (2023JSSPD01); in part by the Open Research Fund of the Hubei Technology Innovation Center for Smart Hydropower (1523020038); and in part by the Jiangsu Province Natural Science Foundation, Grant Number BK20231186.
Data Availability Statement
The original contributions presented in the study are included in the article; further inquiries can be directed to the corresponding author.
Conflicts of Interest
The authors declare no conflicts of interest.
References
- Jenssen, R.; Roverso, D. Automatic autonomous vision-based power line inspection: A review of current status and the potential role of deep learning. Int. J. Electr. Power Energy Syst. 2018, 99, 107–120. [Google Scholar]
- Han, J.; Yang, Z.; Zhang, Q.; Chen, C.; Li, H.; Lai, S.; Hu, G.; Xu, C.; Xu, H.; Wang, D.; et al. A method of insulator faults detection in aerial images for high-voltage transmission lines inspection. Appl. Sci. 2019, 9, 2009. [Google Scholar] [CrossRef]
- Han, J.; Yang, Z.; Xu, H.; Hu, G.; Zhang, C.; Li, H.; Lai, S.; Zeng, H. Search like an eagle: A cascaded model for insulator missing faults detection in aerial images. Energies 2020, 13, 713. [Google Scholar] [CrossRef]
- Wen, Q.; Luo, Z.; Chen, R.; Yang, Y.; Li, G. Deep learning approaches on defect detection in high resolution aerial images of insulators. Sensors 2021, 21, 1033. [Google Scholar] [CrossRef]
- Lu, Y.; Li, D.; Li, D.; Li, X.; Gao, Q.; Yu, X. A Lightweight Insulator Defect Detection Model Based on Drone Images. Drones 2024, 8, 431. [Google Scholar] [CrossRef]
- Cao, P. Application of End-to-End Perception Framework Based on Boosted DETR in UAV Inspection of Overhead Transmission Lines. Drones 2024, 8, 545. [Google Scholar] [CrossRef]
- Li, D.; Zhang, M.; Tong, Z.B. Transmission line insulators detection based on KAZE algorithm. Adv. Mater. Res. 2014, 936, 2184–2189. [Google Scholar] [CrossRef]
- Guo, S.; Bai, Q.; Yue, B.; Li, X.; Zhou, X. Transmission line galloping detection based on SURF feature and FLANN matching algorithm. In Proceedings of the Artificial Intelligence and Security: 6th International Conference, ICAIS 2020, Hohhot, China, 17–20 July 2020; Proceedings, Part II 6; Springer: Berlin/Heidelberg, Germany, 2020; pp. 435–443. [Google Scholar]
- Zhenbing, Z.; Ning, L.; Yapeng, Y. The recognition and localization of insulators based on SIFT and RANSAC. In Proceedings of the 3rd International Conference on Multimedia Technology (ICMT 2013), Guangzhou, China, 29 November–1 December 2013; pp. 692–699. [Google Scholar]
- Wei, Y.; Gao, X. Transmission line galloping prediction based on GA-BP-SVM combined method. IEEE Access 2021, 9, 107680–107687. [Google Scholar] [CrossRef]
- Siddiqui, Z.A.; Park, U. A drone based transmission line components inspection system with deep learning technique. Energies 2020, 13, 3348. [Google Scholar] [CrossRef]
- He, K.; Gkioxari, G.; Dollár, P.; Girshick, R. Mask R-CNN. In Proceedings of the IEEE International Conference on Computer Vision, Venice, Italy, 22–29 October 2017; pp. 2961–2969. [Google Scholar]
- Ren, S.; He, K.; Girshick, R.; Sun, J. Faster R-CNN: Towards real-time object detection with region proposal networks. Adv. Neural Inf. Process. Syst. 2015, 28, 91–99. [Google Scholar] [CrossRef] [PubMed]
- Cai, Z.; Vasconcelos, N. Cascade R-CNN: Delving into high quality object detection. In Proceedings of the IEEE Conference on Computer Vision and Pattern Recognition, Salt Lake City, UT, USA, 18–23 June 2018; pp. 6154–6162. [Google Scholar]
- Lin, T.Y.; Goyal, P.; Girshick, R.; He, K.; Dollár, P. Focal loss for dense object detection. In Proceedings of the IEEE International Conference on Computer Vision, Venice, Italy, 22–29 October 2017; pp. 2980–2988. [Google Scholar]
- Liu, W.; Anguelov, D.; Erhan, D.; Szegedy, C.; Reed, S.; Fu, C.Y.; Berg, A.C. SSD: Single shot multibox detector. In Proceedings of the Computer Vision—ECCV 2016: 14th European Conference, Amsterdam, The Netherlands, 11–14 October 2016; Proceedings, Part I 14; Springer: Berlin/Heidelberg, Germany, 2016; pp. 21–37. [Google Scholar]
- Redmon, J.; Farhadi, A. Yolov3: An incremental improvement. arXiv 2018, arXiv:1804.02767. [Google Scholar]
- Bochkovskiy, A.; Wang, C.Y.; Liao, H.Y.M. Yolov4: Optimal speed and accuracy of object detection. arXiv 2020, arXiv:2004.10934. [Google Scholar]
- Wang, C.Y.; Bochkovskiy, A.; Liao, H.Y.M. YOLOv7: Trainable bag-of-freebies sets new state-of-the-art for real-time object detectors. In Proceedings of the IEEE/CVF Conference on Computer Vision and Pattern Recognition, Vancouver, BC, Canada, 17–24 June 2023; pp. 7464–7475. [Google Scholar]
- Tan, M.; Pang, R.; Le, Q.V. Efficientdet: Scalable and efficient object detection. In Proceedings of the IEEE/CVF Conference on Computer Vision and Pattern Recognition, Seattle, WA, USA, 13–19 June 2020; pp. 10781–10790. [Google Scholar]
- Zhang, J.; Xiao, T.; Li, M.; Zhou, Y. Deep-Learning-Based Detection of Transmission Line Insulators. Energies 2023, 16, 5560. [Google Scholar] [CrossRef]
- Zhao, Z.; Qi, H.; Qi, Y.; Zhang, K.; Zhai, Y.; Zhao, W. Detection Method Based on Automatic Visual Shape Clustering for Pin-Missing Defect in Transmission Lines. IEEE Trans. Instrum. Meas. 2020, 69, 6080–6091. [Google Scholar] [CrossRef]
- Ning, W.; Mu, X.; Zhang, C.; Dai, T.; Qian, S.; Sun, X. Object Detection and Danger Warning of Transmission Channel Based on Improved YOLO Network. In Proceedings of the 2020 IEEE 4th Information Technology, Networking, Electronic and Automation Control Conference (ITNEC), Chongqing, China, 12–14 June 2020; Volume 1, pp. 1089–1093. [Google Scholar] [CrossRef]
- Peng, H.; Liang, M.; Yuan, C.; Ma, Y. EDF-YOLOv5: An Improved Algorithm for Power Transmission Line Defect Detection Based on YOLOv5. Electronics 2024, 13, 148. [Google Scholar] [CrossRef]
- Ge, Z.; Liu, S.; Wang, F.; Li, Z.; Sun, J. Yolox: Exceeding yolo series in 2021. arXiv 2021, arXiv:2107.08430. [Google Scholar]
- Ouyang, D.; He, S.; Zhang, G.; Luo, M.; Guo, H.; Zhan, J.; Huang, Z. Efficient Multi-Scale Attention Module with Cross-Spatial Learning. In Proceedings of the ICASSP 2023—2023 IEEE International Conference on Acoustics, Speech and Signal Processing (ICASSP), Rhodes Island, Greece, 4–10 June 2023; IEEE: Piscataway, NJ, USA, 2023; pp. 1–5. [Google Scholar]
- Lin, T.Y.; Dollár, P.; Girshick, R.; He, K.; Hariharan, B.; Belongie, S. Feature pyramid networks for object detection. In Proceedings of the IEEE Conference on Computer Vision and Pattern Recognition, Honolulu, HI, USA, 21–26 July 2017; pp. 2117–2125. [Google Scholar]
- Liu, S.; Qi, L.; Qin, H.; Shi, J.; Jia, J. Path aggregation network for instance segmentation. In Proceedings of the IEEE Conference on Computer Vision and Pattern Recognition, Salt Lake City, UT, USA, 18–23 June 2018; pp. 8759–8768. [Google Scholar]
- Yang, G.; Lei, J.; Zhu, Z.; Cheng, S.; Feng, Z.; Liang, R. AFPN: Asymptotic feature pyramid network for object detection. arXiv 2023, arXiv:2306.15988. [Google Scholar]
- Liu, S.; Huang, D.; Wang, Y. Learning spatial fusion for single-shot object detection. arXi 2019, arXiv:1911.09516. [Google Scholar]
- Zhang, Y.F.; Ren, W.; Zhang, Z.; Jia, Z.; Wang, L.; Tan, T. Focal and efficient IOU loss for accurate bounding box regression. Neurocomputing 2022, 506, 146–157. [Google Scholar] [CrossRef]
- Zheng, Z.; Wang, P.; Liu, W.; Li, J.; Ye, R.; Ren, D. Distance-IoU loss: Faster and better learning for bounding box regression. In Proceedings of the AAAI Conference on Artificial Intelligence, New York, NY, USA, 7–12 February 2020; Volume 34, pp. 12993–13000. [Google Scholar]
- Tong, Z.; Chen, Y.; Xu, Z.; Yu, R. Wise-IoU: Bounding Box Regression Loss with Dynamic Focusing Mechanism. arXiv 2023, arXiv:2301.10051. [Google Scholar]
- Tao, X.; Zhang, D.; Wang, Z.; Liu, X.; Zhang, H.; Xu, D. Detection of power line insulator defects using aerial images analyzed with convolutional neural networks. IEEE Trans. Syst. Man, Cybern. Syst. 2018, 50, 1486–1498. [Google Scholar] [CrossRef]
- Liu, Z.; Wu, G.; He, W.; Fan, F.; Ye, X. Key target and defect detection of high-voltage power transmission lines with deep learning. International J. Electr. Power Energy Syst. 2022, 142, 108277. [Google Scholar] [CrossRef]
- Woo, S.; Park, J.; Lee, J.Y.; Kweon, I.S. CBAM: Convolutional block attention module. In Proceedings of the European Conference on Computer Vision (ECCV), Munich, Germany, 8–14 September 2018; pp. 3–19. [Google Scholar]
- Hou, Q.; Zhou, D.; Feng, J. Coordinate attention for efficient mobile network design. In Proceedings of the IEEE/CVF Conference on Computer Vision and Pattern Recognition, Nashville, TN, USA, 20–25 June 2021; pp. 13713–13722. [Google Scholar]
- Hu, J.; Shen, L.; Sun, G. Squeeze-and-excitation networks. In Proceedings of the IEEE Conference on Computer Vision and Pattern Recognition, Salt Lake City, UT, USA, 18–23 June 2018; pp. 7132–7141. [Google Scholar]
- Wang, Q.; Wu, B.; Zhu, P.; Li, P.; Zuo, W.; Hu, Q. ECA-Net: Efficient channel attention for deep convolutional neural networks. In Proceedings of the IEEE/CVF Conference on Computer Vision and Pattern Recognition, Seattle, WA, USA, 13–19 June 2020; pp. 11534–11542. [Google Scholar]
- Yang, L.; Zhang, R.Y.; Li, L.; Xie, X. SimAM: A Simple, Parameter-Free Attention Module for Convolutional Neural Networks. In Proceedings of the 38th International Conference on Machine Learning, Virtual, 18–24 July 2021. [Google Scholar]
- Selvaraju, R.R.; Cogswell, M.; Das, A.; Vedantam, R.; Parikh, D.; Batra, D. Grad-cam: Visual explanations from deep networks via gradient-based localization. In Proceedings of the IEEE International Conference on Computer Vision, Venice, Italy, 22–29 October 2017; pp. 618–626. [Google Scholar]

Disclaimer/Publisher’s Note: The statements, opinions and data contained in all publications are solely those of the individual author(s) and contributor(s) and not of MDPI and/or the editor(s). MDPI and/or the editor(s) disclaim responsibility for any injury to people or property resulting from any ideas, methods, instructions or products referred to in the content. |
© 2025 by the authors. Licensee MDPI, Basel, Switzerland. This article is an open access article distributed under the terms and conditions of the Creative Commons Attribution (CC BY) license (https://creativecommons.org/licenses/by/4.0/).