Article

Experimental Study on UAV-Assisted Pollination in Hybrid Rice

1
College of Engineering, Jiangxi Agricultural University, Nanchang 330045, China
2
Jiangxi Provincial Key Laboratory of Modern Agricultural Equipment, Nanchang 330045, China
3
Key Laboratory of Modern Agriculture Equipment and Technology, Jiangsu University, Zhenjiang 212013, China
*
Authors to whom correspondence should be addressed.
These authors contributed equally to this work.
Drones 2025, 9(5), 327; https://doi.org/10.3390/drones9050327
Submission received: 14 March 2025 / Revised: 15 April 2025 / Accepted: 23 April 2025 / Published: 24 April 2025

Abstract

:
To address challenges in hybrid rice seed production—specifically labor dependence, low uniformity of pollen distribution, and low operational efficiency—which collectively drive up large-scale production costs, technological innovations are critical. However, despite the demonstrated potential of UAV-assisted pollination, the quantitative relationships between its operational parameters (altitude, speed, flight patterns) and pollen dispersal dynamics remain poorly understood, impeding standardization efforts. In this study, guided by agronomic pollination requirements, we developed an integrated analytical framework linking “pollen density-yield” dynamics to elucidate the governing mechanisms of flight parameters on pollination quality. A DJI T50 UAV was used to carry out the assisted pollination test on two varieties of hybrid rice, Changtian You 405 and Wanxiang You 377, to explore the effects of different flight speeds, altitudes, and trajectories of the UAV on pollination quality and to evaluate the cost-effectiveness ratio, taking the yield and its composition as the evaluation indexes. The experimental results showed that the UAV flight operation parameters had a significant effect on the pollination quality, and the best pollination quality was obtained when the flight altitude was 4 m and the speed was 3 m/s, achieving yields of 2.64 and 3.15 t/hm2; the average yields of the UAV-assisted pollination were 2.10 and 2.61 t/hm2, and the filled grain percentages were 15.76% and 34.2%, respectively. These increased the yields by 21.4% and 11.06%, respectively, and the filled grain percentages by 8.69% and 3.95%, compared with artificial pollination. The results also showed that the cost-effectiveness ratio of UAV-assisted pollination was 28.11% lower than that of artificial operation. The results indicate that UAVs have great application prospects in hybrid rice pollination.

1. Introduction

Hybrid rice plays a pivotal role in enhancing grain yield and ensuring global food security [1]. As a critical component of hybrid rice seed production, auxiliary pollination directly determines seed yield and production efficiency [2,3]. In China, hybrid rice cultivation has achieved large-scale industrialization. Statistical analyses reveal that hybrid rice occupies approximately 57% of the total rice cultivation area nationwide, exceeding 17 million hectares annually, while the dedicated area for hybrid rice seed production reaches 180,000 hectares [4]. Within this production system, pollination technology is characterized by stringent technical specifications, high precision requirements, and strict operational timeliness [5], with its efficacy being a decisive factor affecting seed yield [6].
Current assisted pollination practices in China predominantly rely on manual methods, where mechanical disturbance of rice parents using ropes or bamboo poles facilitates pollen transfer to maternal spikelets [7]. However, these labor-intensive techniques suffer from low efficiency, failing to meet the demands of modern seed production systems [8]. Moreover, existing mechanical pollination devices often cause plant damage, resulting in limited field applicability and inconsistent pollination performance [9]. These challenges underscore the urgent need for innovative pollination technologies that can simultaneously improve operational efficiency, reduce labor dependency, prevent crop injury, and adapt to complex terrain.
The rapid advancement of unmanned aerial vehicle (UAV) technology has expanded its agricultural applications across diverse domains [10,11,12,13,14,15,16,17,18], including precision field mapping [19], pest-disease surveillance [4], disaster assessment [20], targeted seeding [21], and notably, crop pollination [22]. Successful implementations of UAV-assisted pollination have been documented in crops such as tomatoes [23], jujubes [24], bitter melons [25], and oilseed species [26], with preliminary explorations in hybrid rice systems. Pioneering work by Wang Pei [27] developed a UAV-mounted wireless sensor network to measure wind dynamics within rice canopies. Building on this, Li Jiyu [28] identified that wind velocity components parallel (X-axis) and perpendicular (Y-axis) to UAV flight paths critically influence pollen dispersion. Complementary research by Wang [29] integrated wind field characterization with high-speed imaging, establishing predictive models linking UAV flight speed to pollen distribution through wind tunnel and field experiments. Despite these advancements, systematic evaluations of how UAV operational parameters affect pollination efficacy, cost-efficiency, and economic returns remain scarce. To address this gap, this study employs a DJI T50 multi-rotor UAV to optimize pollination protocols and operational parameters, aiming to advance both theoretical frameworks and practical implementations of UAV-based hybrid rice pollination.
Therefore, this study aims to address three key research objectives, and the specific workflow is shown in Figure 1:
(1)
To compare pollination efficacy and operational efficiency between UAV-assisted and manual pollination, determining the feasibility of UAV technology substitution;
(2)
To establish quantitative relationships between UAV flight parameters (altitude, speed, route patterns) and pollen distribution patterns through field experiments, enabling yield prediction via pollen density analysis for accelerated parameter optimization;
(3)
To identify optimal operational parameters for the DJI T50 multi-rotor UAV in hybrid rice pollination, employing yield components (spikelet fertility, grain weight) as primary evaluation metrics.

2. Materials and Methods

2.1. Experimental Design

The DJI T50 (Shenzhen DJI Technology Co., Ltd., China) unmanned aerial vehicle (UAV) was employed in this experimental investigation. Rated for operation under maximum natural wind speeds of 6 m/s, the system features a 30 Ah battery capacity (it takes 9–12 min to fill up a battery, and a UAV is equipped with two batteries) and delivers 30 min of continuous flight time in no-payload configuration. Key technical specifications are comprehensively summarized in Table 1.

2.2. Test Methods

UAV-assisted pollination was tested in Ningdu County, Ganzhou City, Jiangxi Province. The parents of the seed plots in the experimental area were in the ratio of 1:7 rows. Both parents were artificially transplanted, with the same parent varieties, plant growth status, and synchronized flowering periods. The UAV-assisted pollination test was carried out during the flowering period (10:00–12:00) of the parent every day. During pollination, the UAV’s flight height, speed and trajectory were set by the UAV flight control system. The UAV flew autonomously according to the set parameters, disturbing the pollen through the rotor wind field to make it escape, and assisting the parent to complete pollination. Each experimental plot was pollinated 2–3 times per day during the pollination window.
The suitable wind speed for hybrid rice seed pollination is 2–3 times the pollen suspension speed, i.e., the wind speed of the rice canopy should be 2.5–3.5 m/s [30,31,32]. It is known that DJI T50 meets the pollination wind speed requirement of canopy wind speed of 2.5–3.5 m/s when flying at a height of 3.5–4.5 m from the canopy and at a flight speed of 2–4 m/s, and the width of the wind field at this time is 5–6 m [33]. In order to ensure that there is a confluence of the wind field during the pollination operation of the UAV and to ensure that pollen escaping from the canopy of the rice is perturbed to the maximum extent, the UAV flight is set to be 5 m apart and the trajectory is 5 m apart, and the wind field is set to be 5 m apart. The trajectory spacing is 5 m, and the UAV operates autonomously according to the set flight parameters.
From 19 to 25 August 2024, an auxiliary pollination test was conducted on Changtian You 405 hybrid rice in Ningdu County, Jiangxi Province. The height of both parents was 1.2 m, the planting density of the parents was 22 cm × 30 cm, the planting density of the mothers was 14 cm × 18 cm, and the spacing between the parents was 30 cm. During the pollination period, the weather was predominantly sunny or cloudy, with an average temperature of 38 degrees Celsius, humidity of 24.4%, and wind speeds ranging between 0 and 0.86 m/s.
From 18 to 25 September 2024, an auxiliary pollination test was conducted on Wanxiang You 377 hybrid rice in Ningdu County, Jiangxi Province. The height of the parent was 1.2 m, the height of the female was 1.0 m, the planting density of the parent was 20 cm × 20 cm, the planting density of the female was 16 cm × 20 cm, and the spacing between the parents was 30 cm. During the pollination period, the weather was sunny and less rainy, and the temperature during the pollination period was 31 degrees Celsius, the humidity was 21.5%, and the wind speeds were between 0 and 1.24 m/s.

2.2.1. UAV-Assisted Pollination Field Production Test

To investigate the influence of UAV flight parameters on pollination effectiveness, experiments were conducted to study the effects of different flight speeds, altitudes, and trajectories. Two flight trajectories were set up: one vertical and one parallel to the parent rows. Flight speeds of 2 m/s, 3 m/s, and 4 m/s, and flight heights of 3.5 m, 4 m, and 4.5 m were tested, resulting in a total of 18 flight parameter combinations for full-factorial experiments. Pollination effectiveness was evaluated based on seed yield and yield composition.
Eighteen adjacent fields with similar parent plant growth, better flowering synchronization, and consistent soil conditions were selected for the tests. Additionally, three fields were chosen as controls for artificial pull rope-assisted pollination. The test factors and levels are shown in Table 2.
Before harvesting in the experimental plots, three sampling areas were randomly selected. In each sampling area, one row of maternal spike heads (7–8 plants) was consecutively collected, and the number of effective spikes per hole was recorded. The collected samples were examined for the number of productive panicles per plant, filled grains, unfilled grains, and the thousand-kernel weight of filled grains to evaluate the maternal filled grain percentage.
Filled   Grain   Percentage   =   F i l l e d   g r a i n s T o t a l   n u m b e r   o f   g r a i n s × 100 %
Prior to harvest, experimental plots were bordered and pre-treated with interventions (e.g., weed removal) to mitigate edge effects. Sampling protocols varied based on field size:
  • Fields ≥ 667 m2: three distinct sampling zones were established, with yield measurements repeated triplicate.
  • Fields < 667 m2: sampling areas were partitioned contextually, ensuring each subdivided block exceeded 200 m2.

2.2.2. Field Experiment for Observing the Distribution of Pollen Density

To study the distribution pattern of rice pollen in parent rows under different UAV-assisted pollination parameters, field experiments were also conducted to observe pollen density distribution. In the experimental areas with varying combinations of flight parameters, three areas with normal parent growth and good flowering synchronization were selected as replicates, ensuring minimal overlap of the selected sampling areas. A total of six sampling points were arranged vertically along the UAV’s route, spaced 1 m apart. The lines connecting these sampling points were perpendicular to the UAV’s route and evenly distributed on both sides, numbered from left to right as #1 to #6.
To ensure the accuracy of the experimental data, the field used in the experiment was required to be not less than 667 m2. In each experimental field, three sampling areas were set up, with at least two rows of parent plants spaced within each sampling area to avoid overlapping of the collected pollen. A slide coated with vaseline was fixed onto a 1.5 m long sampling rod using a universal clamp, allowing pollen to be captured through the vaseline. The density of pollen distribution was indicated by the amount of pollen settling on the slide. The position of the gimbal clamp was adjusted according to the height of the rice spike layer to ensure that the sampling point was as close as possible to the height of the maternal spike layer, as shown in Figure 2. Field pollen sampling is shown in Figure 3.
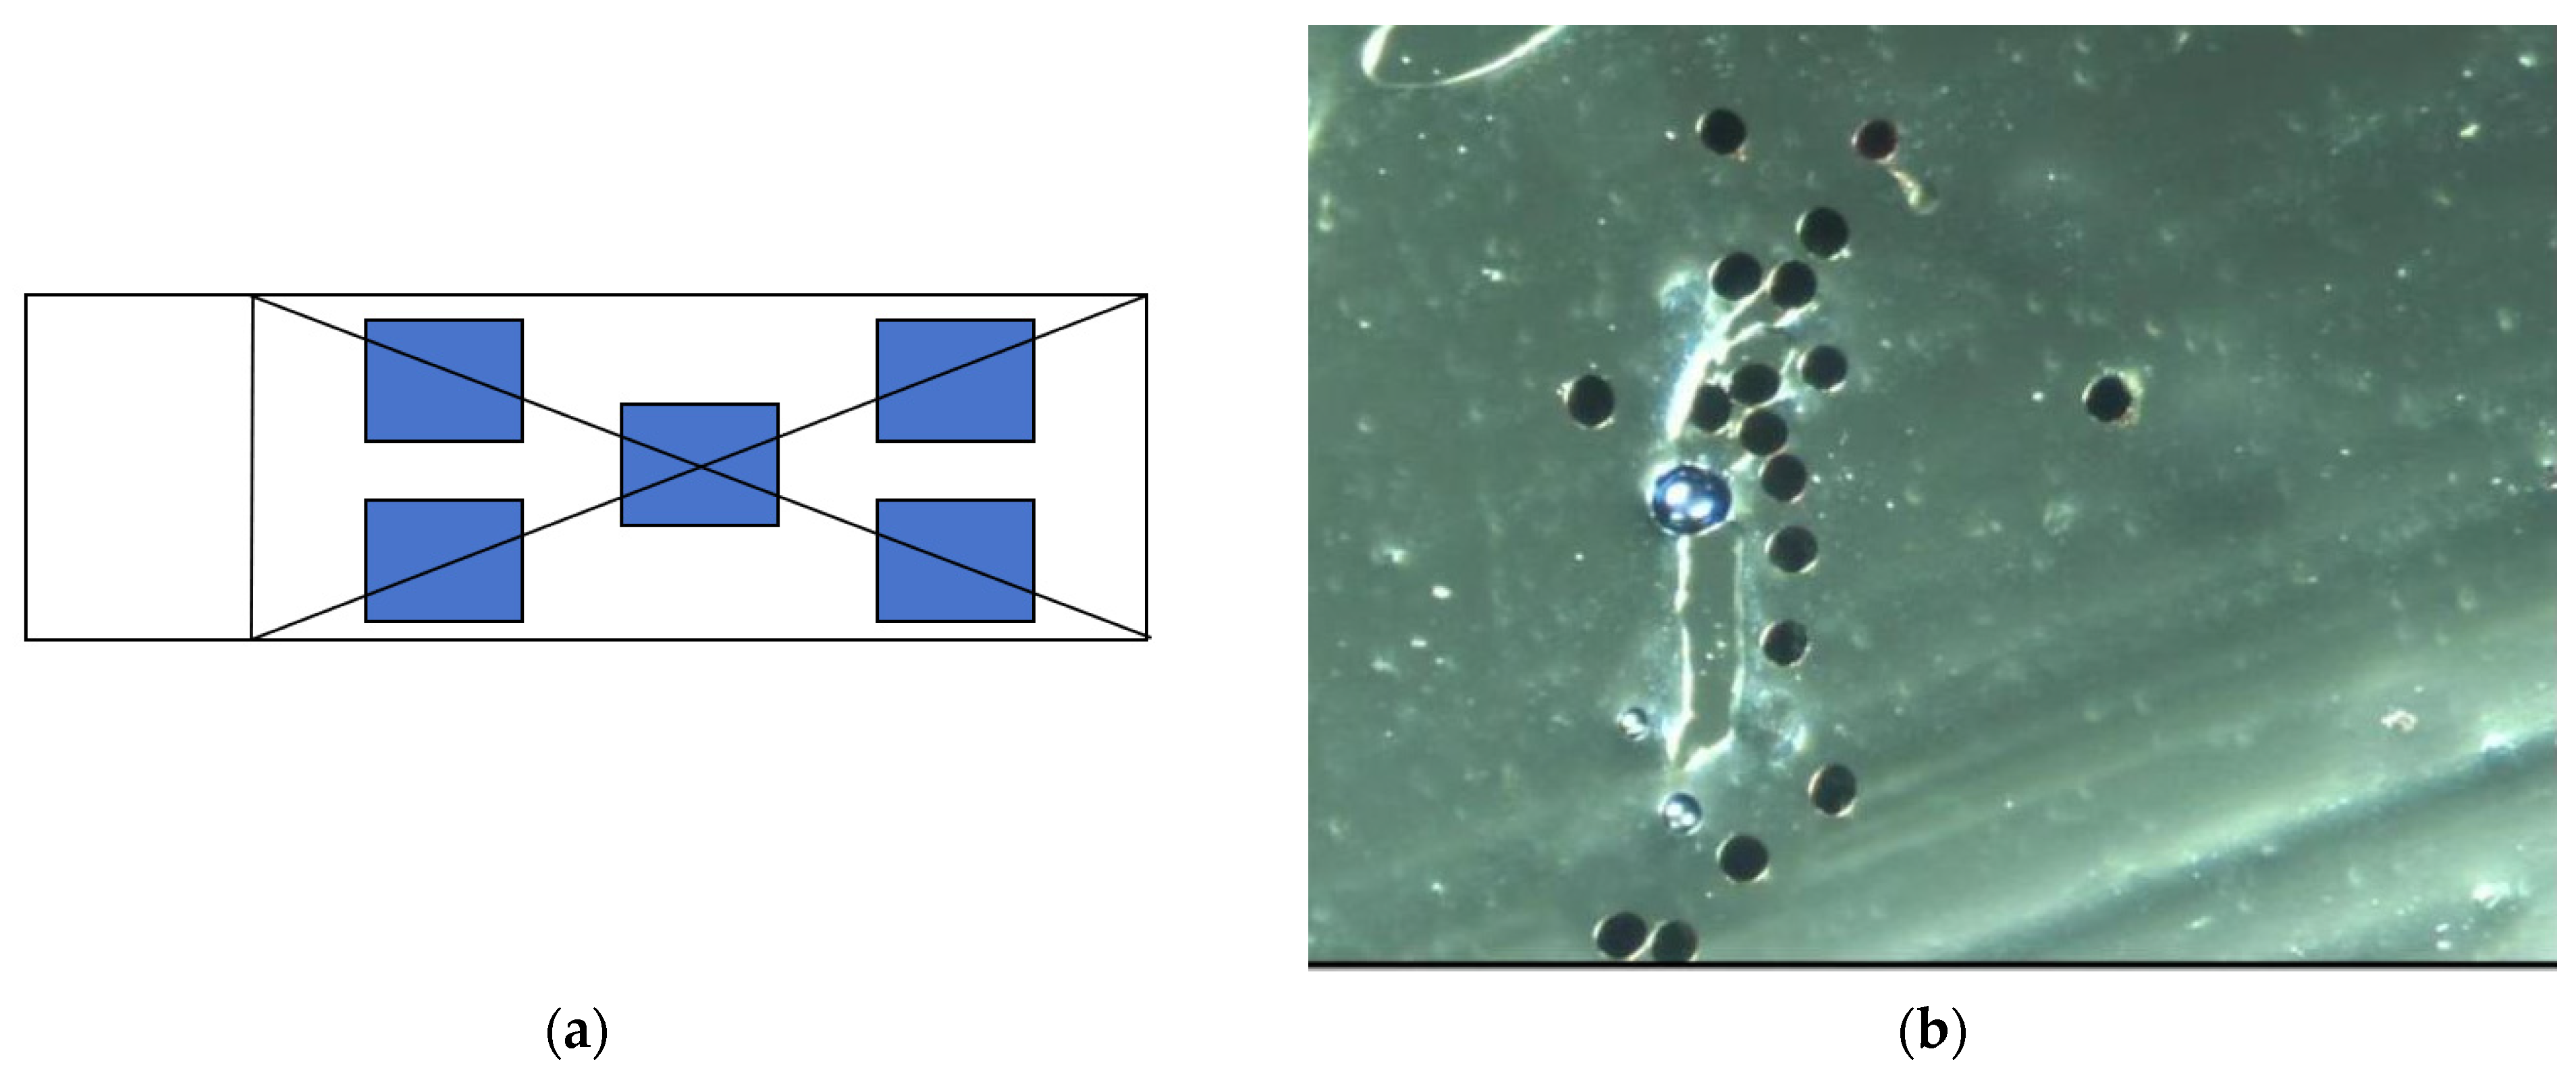
Immediately after the pollination test, the slides from the sampling points in the sampling area were collected. Five observation points were evenly selected on each slide in a plum blossom shape, the sampling method is shown in Figure 4. These observation points were stained with 2% iodide-potassium iodide solution. The stained slides were then placed under an electronic eyepiece with a 4× objective microscope for observation. By moving the slides, the distribution of pollen was observed under different observation points. Random observations were made at each point, and the number of pollen particles was counted in three fields of view per observation point, resulting in a total of 15 effective fields of view. The average number of pollen particles in these 15 fields of view was calculated as the pollen distribution on a single slide [23].

2.3. Statistical Analyses

Statistical analyses were conducted using SPSS 26.0 (IBM Corp.). To evaluate the impact of flight parameters on pollination efficacy, continuous variables (flight speed: 2 m/s, 3 m/s, 4 m/s; flight altitude: 3.5 m, 4.0 m, 4.5 m) were discretized into categorical levels. One-way ANOVA with Tukey’s homogeneity test was initially applied to assess between-group differences, reporting degrees of freedom (df), F-statistics, and exact p-values. When ANOVA indicated significant effects (p < 0.05), post hoc pairwise comparisons were performed using Duncan’s multiple range test. Comparative analysis of pollen density between UAV-assisted pollination (single-parameter cohort) and manual pollination employed independent two-sample t-tests with Welch’s correction for heteroscedasticity. Data visualization was implemented through Origin 2022 (OriginLab) and GraphPad Prism 10.1.2.

3. Results

3.1. Observations on Pollen Density Distribution in the Field

The results of pollen electron microscopy observations under different pollination methods showed that there was a highly significant difference in pollen density between UAV-assisted pollination and artificially assisted pollination (t = 4.593, p < 0.001), as shown in Table 3. The results specifically demonstrate that the pollen density in the UAV-assisted pollination group reached 4.37 grains per field of view, significantly exceeding that of the artificial-assisted pollination group, which stood at 3.68 grains per field of view.

3.2. Effects of Different UAV-Assisted Pollination Parameters on Pollen Distribution Characteristics

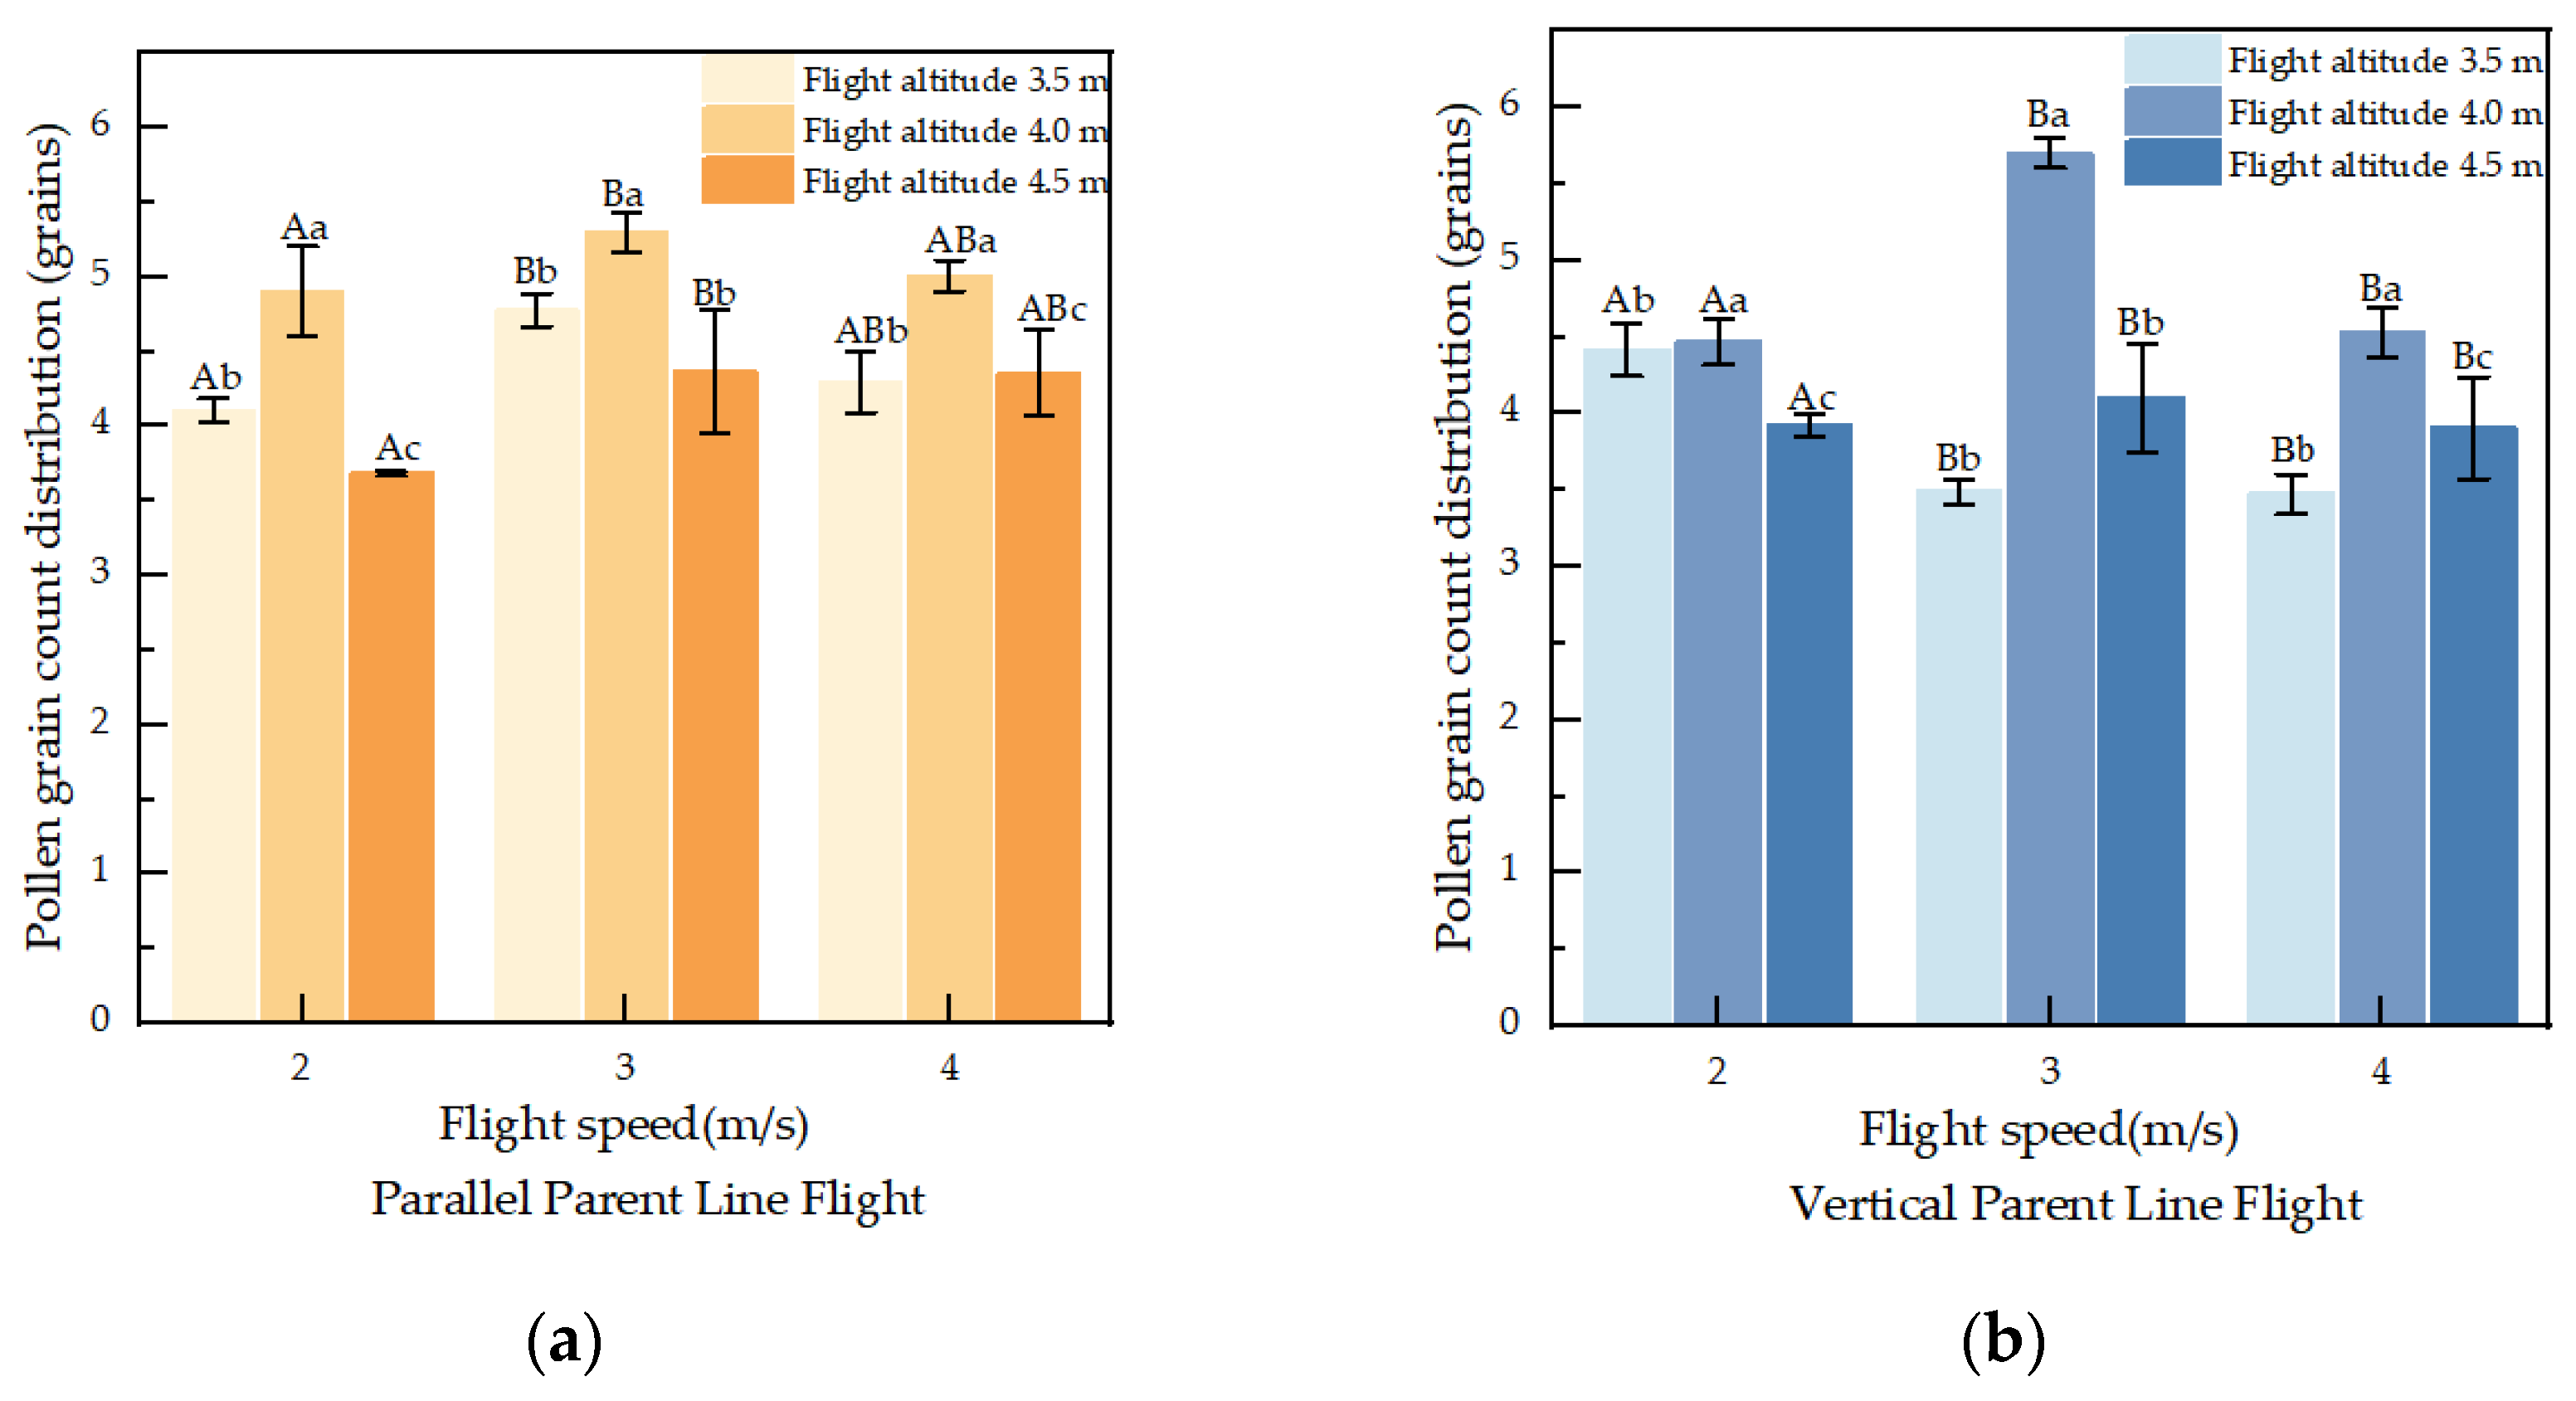
The pollen distribution densities obtained under various UAV flight parameters are displayed in Figure 5. Across all sampling areas, pollen densities varied between 3.23 and 5.30 pollen grains per field of view. Both UAV flight speed and altitude significantly influenced pollen distribution density (p < 0.05).

3.3. Comparison of Seed Production Yield Between UAV-Assisted Pollination and Artificial-Assisted Pollination

As shown in Table 4, for Changtian You 405 hybrid rice, the average yield of UAV-assisted pollination was 2.10 t/hm2, the average number of productive panicles per plant was 21.62, the filled grain percentage was 15.76%, and the average weight of 1000 grains was 21.94 g, while the average yield of artificial-assisted pollination was 1.73, the average number of productive panicles per plant was 17.84, the average filled grain percentage was 14.50%, and the average weight of 1000 grains was 21.71 g. UAV-assisted pollination increased the yield by 21.4% and filled grain percentage by 1.26 percentage points compared with artificial-assisted pollination.
For Wanxiang You 377 hybrid rice, the average yield of UAV-assisted pollination was 2.61 t/hm2, the average number of productive panicles per plant was 20.69, the filled grain percentage was 34.2%, and the average 1000-grain weight was 20.15 g. The average yield of artificially-assisted pollination was 2.35 t/hm2, the average number of productive panicles per plant was 21.15, the filled grain percentage was 32.9%, and the average 1000-grain weight was 20.18 g. The yield of UAV-assisted pollination increased by 11.06% compared with artificial-assisted pollination, which increased by 1.30 percentage points. Compared with the artificially assisted pollination, the yield increased by 11.06% and the filled grain percentage increased by 1.30 percentage points.
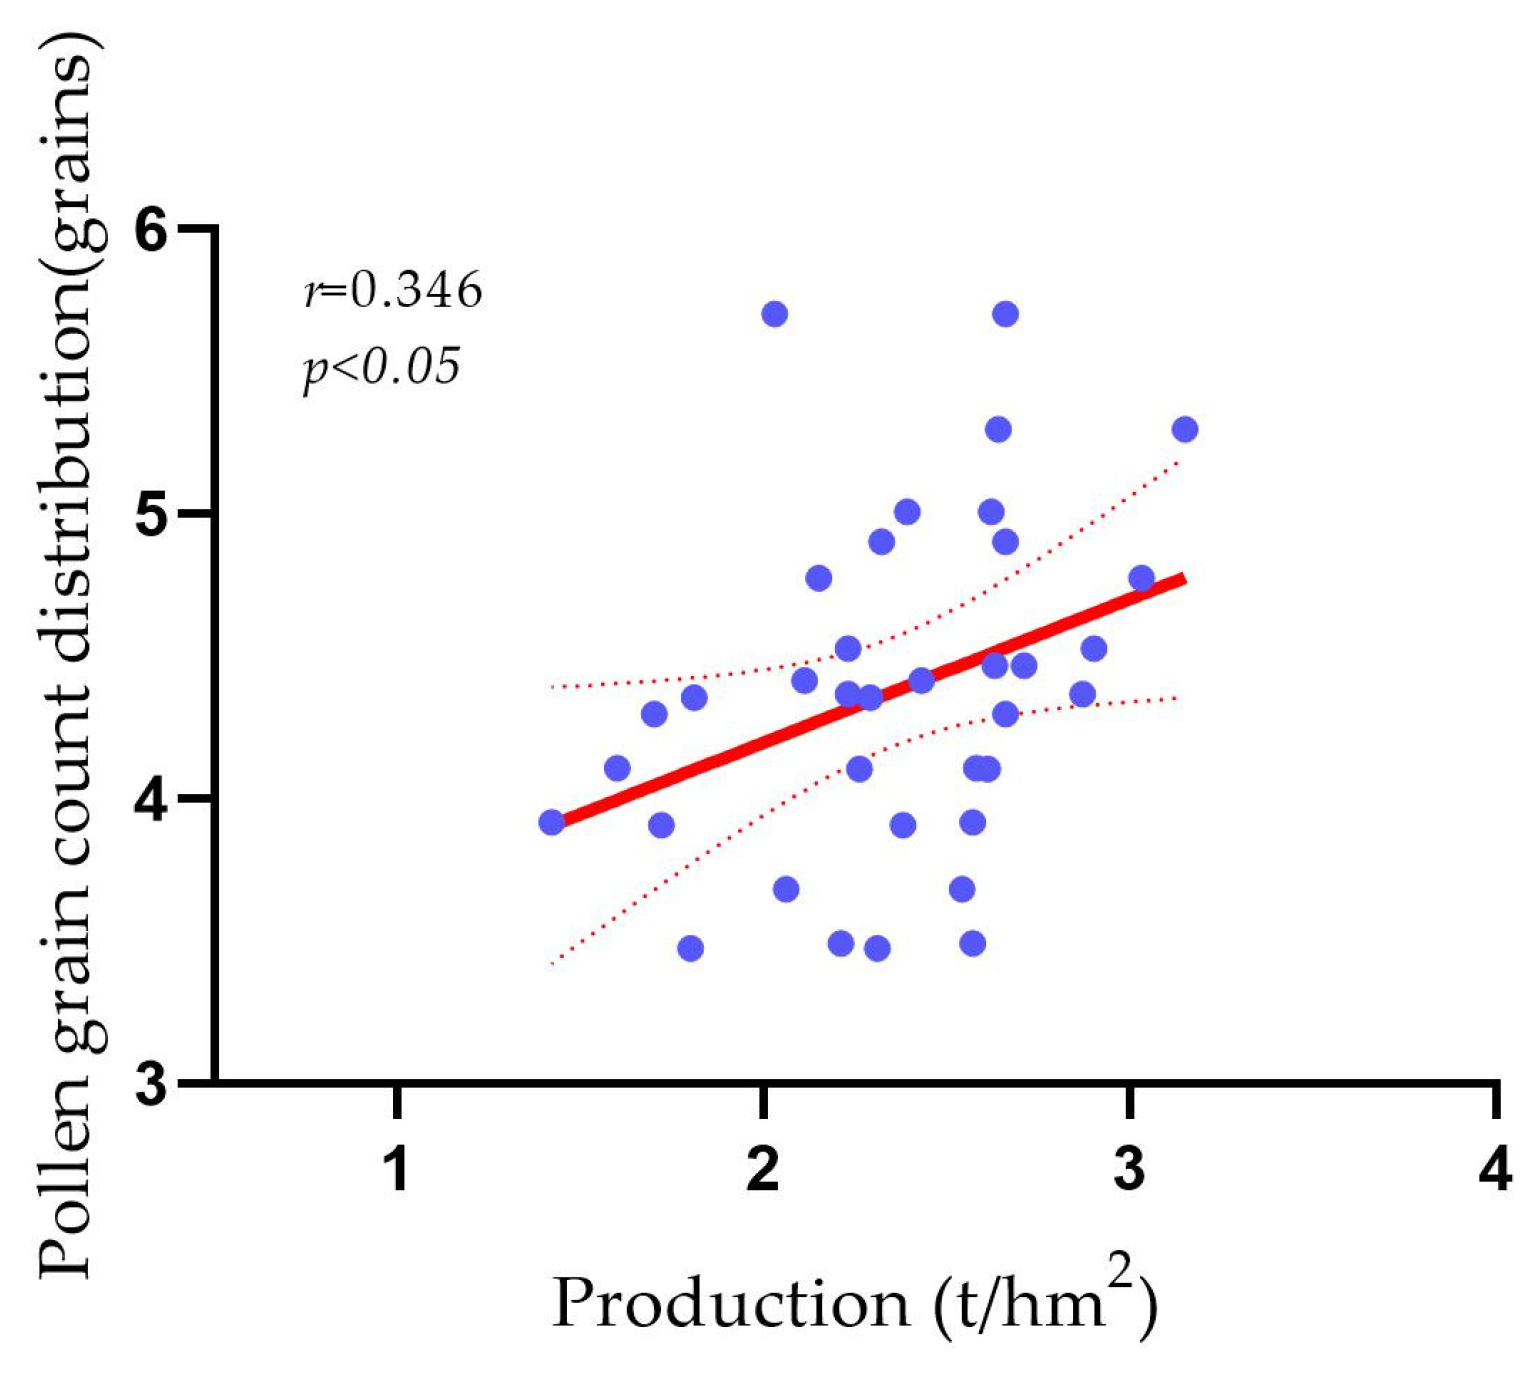
Figure 6 presents the correlation analysis results between pollen distribution density (observed via electron microscopy) and seed production yield across experimental areas. This study revealed a statistically significant positive association between pollen distribution density and rice yield through bivariate Pearson’s correlation analysis (r = 0.346, p < 0.05, two-tailed test). The 95% confidence intervals [0.019, 0.606] calculated via the Bootstrap resampling method (1000 iterations) are demarcated by red dashed lines in the figure, confirming the robustness of the effect size estimates.

3.4. Effect of Different Pollination Parameters on the Yield of Hybrid Rice Seed Production

As shown in Table 5, the average yield of Changtian You 405 hybrid rice was 2.10 t/hm2, the filled grain percentage was 15.76%, the average 1000-grain weight was 21.94 g, and the average number of productive panicles per plant was 21.62 under the effect of different UAV-assisted pollination parameters. The test results showed that the flight height and flight speed had a significant effect on the yield and fruiting rate of hybrid rice seed production. When the flight speed was 3 m/s, the average production was 2.20 t/hm2, the average fruiting rate was 18.44%, the average 1000-grain weight was 21.99 g, and the average number of productive panicles per plant was 21.24; when the flight height was 4 m, the average pollination yield was 2.37 t/hm2, the filled grain percentage was 19.59%, the average 1000-grain weight was 21.97 g, and the average number of productive panicles per plant was 20.81. When the UAV flight speed is 3 m/s and flight height is 4 m, it has the optimal pollination effect, and the final pollination yield is 2.64 t/hm2.
As shown in Table 6, under the action of different UAV-assisted pollination parameters, the hybrid rice of Wanxiang You 377 obtained an average production of 2.61 t/hm2, an average filled grain percentage of 34.2%, an average 1000-grain weight of 20.15 g, and an average number of productive panicles per plant of 20.69. The test results showed that the flight height and flight speed had a significant effect on the yield and fruiting rate of hybrid rice seed production. When the flight speed was 3 m/s, the average pollination yield was 2.82 t/hm2, the average filled grain percentage was 34.93%, the average 1000-grain weight was 20.13 g, and the average number of productive panicles per plant was 22.85; when the flight height was 4 m, the average production was 2.78 t/hm2, the average filled grain percentage was 36.73%, the average 1000-grain weight was 20.16 g, and the average number of productive panicles per plant was 19.76. When the UAV flight speed is 3 m/s and flight height is 4 m, it has the optimal pollination effect, and the final production is 3.15 t/hm2.

3.5. Comparison of Cost and Efficiency of Different Pollination Methods

Under identical operating conditions, a UAV can pollinate 60 acres per hour, while artificial-assisted pollination requires two people to cover 40 acres per hour. Comparative analysis of pollination costs and efficiencies reveals that UAV-assisted pollination reduces per-acre costs by USD 0.55 compared to manual methods. The operational efficiency metrics show UAV-assisted pollination achieves 4 hm2/h versus 0.67 hm2/h for manual methods, indicating a sixfold productivity advantage. This demonstrates drone pollination technology enhances efficiency while reducing labor requirements. Detailed comparative data are presented in Table 7.

4. Discussion

In this study, we systematically analyzed the regulatory mechanism of UAV flight parameters on hybrid rice pollination efficacy and its techno-economic implications. The results demonstrated that UAV flight altitude and speed significantly influenced (p < 0.05) pollen dispersal efficiency, distribution range, and final seed yield by modifying canopy wind field characteristics. Specifically, optimal pollination requires canopy wind speeds 2–3 times the pollen suspension velocity (2.5–3.5 m/s) [30,31,32]. Wind field tests revealed that the DJI T50 UAV generates an X-direction effective wind field width of 5–6 m, sufficient to cover typical parent-row spacing in hybrid rice seed production fields.
Mechanical disturbance intensity induced by UAV wind fields significantly exceeded that of conventional manual rope-pulling pollination [28,29]. Traditional methods involve minimal canopy perturbation through rope pulling, resulting in insufficient pollen release (3.68 grains per field of view) and limited dispersal, particularly affecting distant maternal plants [5,9]. In contrast, UAV-generated turbulence enhanced pollen detachment, increasing escape density to 4.37 grains per field of view. Simultaneously, UAV wind fields promoted long-range pollen transport, benefiting distal parent pollination.
Meanwhile, the UAV-generated wind field enhances pollen dispersal to more distant areas, promoting pollination and fruit set of distal parent plants. Parameter optimization analysis revealed a nonlinear threshold effect on pollination efficiency: when flight height (H) < 4 m or airspeed (V) < 3 m/s, excessive wind shear below the canopy caused pollen deposition losses; when H > 4 m or V > 3 m/s, the effective canopy disturbance area diminished. This threshold pattern significantly correlated with field yield data (p < 0.05). Specifically, UAV-pollinated yields for Changtian Yu 405 and Wanxiang Yu 377 reached 2.10 t/hm2 and 2.61 t/hm2, respectively—representing 21.4% and 11.1% increases over manual pollination. Fruit set rates also improved by 1.26–1.3 percentage points compared to manual methods. Pollen distribution density showed a strong positive association with seed yield (p < 0.05). Ultimately, the experiment identified optimal DJI T50 UAV parameters as 3 m/s airspeed and 4 m flight height for maximal pollination efficacy.
From the perspective of the technological economy, the efficiency of UAV pollination single machine operation reaches 4 hm2/h (0.6 hm2/h for manual pollination), and the cost of 667 m2 is reduced by 0.55 USD. However, the current technology still has limitations: (1) the battery life limits the continuous operation length, resulting in the need to frequently replace the battery when operating in larger seed production fields, which increases the operation time and cost; (2) the insufficient width of the wind field leads to the limited efficiency of the route planning, which affects the pollination area per unit of time. Future research can improve the lateral wind field coverage through aerodynamic structure optimization and expand the row spacing by combining with autonomous navigation algorithms to multiply the pollination area per unit time.

5. Conclusions

This study establishes theoretical and practical foundations for standardizing UAV precision pollination technology in smart agricultural systems. The results demonstrated that UAV pollination achieved a sixfold efficiency improvement compared to manual methods, with a cost reduction of USD 0.55 per 667 m2 (37.5% decrease). A systematic “pollen density-yield” framework (r = 0.345, p < 0.05) was developed, reducing the yield prediction period from 35 to 7 days. While wind-induced lodging effects were not considered in this phase, future research will incorporate a coupled wind field-crop mechanics model. For technological advancement, machine learning-optimized UAV path planning integrated with pollen dispersion dynamics modeling will be implemented to establish an intelligent control system for hybrid rice pollination.

Author Contributions

Conceptualization, L.L., X.C. and P.F.; formal analysis, J.L., M.L. and P.F.; data curation, L.L., X.C., P.F. and M.L.; writing—original draft preparation, L.L., J.L., M.L., X.C., P.F., L.X., Y.Z. and X.D.; writing—review and editing, L.L., J.L., X.C. and P.F.; supervision, J.L., X.C., P.F., M.L. and L.X.; project administration, X.C., J.L., L.X. and M.L.; funding acquisition, X.C., J.L., L.X. and M.L. All authors have read and agreed to the published version of the manuscript.

Funding

This research was funded by Key R&D Program of Jiangxi Province, China: Innovation and Application of Key Technologies and Intelligent Equipment for Mechanized Hybrid Rice Seed Production, grant number 208120297086.

Data Availability Statement

The raw data supporting the conclusions of this article will be made available by the authors on request.

Acknowledgments

We are thankful to Guodong Yu, Zhiheng Zhu, Yihan Zhou, and Zhiguo Da, who have contributed to our data collection.

Conflicts of Interest

The authors declare no conflicts of interest.

References

  1. Yang, X.; Hu, J. Progress in Hybrid Rice Breeding Technology. J. Wuhan Univ. (Nat. Sci. Ed.) 2024, 70, 556–566. [Google Scholar] [CrossRef]
  2. Liu, A.; Xiao, C.; Long, H. Preliminary Progress in the Research on Whole-process Mechanization Technology of Hybrid Rice Seed Production. Hybrid Rice 2014, 29, 6–8. [Google Scholar]
  3. He, W.; Liu, W.; Jiang, R.; Gu, Q.; Huang, J.; Zou, S.; Xu, X.; Zhou, Z. Control system design and experiments of UAV shot seeding device for rice. Trans. Chin. Soc. Agric. Eng. Trans. CSAE 2022, 38, 51–61. [Google Scholar] [CrossRef]
  4. Ingole, R.S.; Ingole, N.S.; Khandelwal, R.R.; Kalambe, J.P. Detection of Crop Disease and Spraying of Pesticides using Drone. In Proceedings of the 2024 IEEE 9th International Conference for Convergence in Technology (I2CT), Pune, India, 5–7 April 2024; pp. 1–5. [Google Scholar] [CrossRef]
  5. Liu, A.; Zhang, H.; Liao, C.; Zhang, Q.; Xiao, C.; He, J.; Zhang, J.O.; He, Y.; Li, J.; Luo, X. Effects of Supplementary Pollination by Single-rotor Agricultural Unmanned Aerial Vehicle in Hybrid Rice Seed Production. Agric. Sci. Technol. 2017, 18, 543–552. [Google Scholar] [CrossRef]
  6. HAshraf, H.; Ghouri, F.; Baloch, F.S.; Nadeem, M.A.; Fu, X.; Shahid, M.Q. Hybrid Rice Production: A Worldwide Review of Floral Traits and Breeding Technology, with Special Emphasis on China. Plants 2024, 13, 578. [Google Scholar] [CrossRef] [PubMed]
  7. Wu, S.; Liu, J.; Lei, X.; Zhao, S.; Lu, J.; Jiang, Y.; Xie, B.; Wang, M. Research Progress on Efficient Pollination Technology of Crops. Agronomy 2022, 12, 2872. [Google Scholar] [CrossRef]
  8. Weng, X.; Xu, J.; Zhao, J.; Huang, Y.; Bian, X.; Wang, J. Study on seed production and pollination of Indica japonica hybrid rice assisted by multi rotor UAV. J. Chin. Agric. Mech. 2022, 43, 24–29. [Google Scholar] [CrossRef]
  9. Jiang, Q.; Wang, Y.; Chen, J.; Wang, J.; Wei, Z.; He, Z. Optimizing the working performance of a pollination machine for hybrid rice. Comput. Electron. Agric. 2021, 187, 106282. [Google Scholar] [CrossRef]
  10. Wang, L.; Huang, X.; Li, W.; Yan, K.; Han, Y.; Zhang, Y.; Pawlowski, L.; Lan, Y. Progress in Agricultural Unmanned Aerial Vehicles (UAVs) Applied in China and Prospects for Poland. Agriculture 2022, 12, 397. [Google Scholar] [CrossRef]
  11. van der Merwe, D.; Burchfield, D.R.; Witt, T.D.; Price, K.P.; Sharda, A. Drones in agriculture. In Advances in Agronomy; Elsevier: Amsterdam, The Netherlands, 2020; Volume 162, pp. 1–30. [Google Scholar] [CrossRef]
  12. Dileep, M.R.; Navaneeth, A.V.; Ullagaddi, S.; Danti, A. A Study and Analysis on Various Types of Agricultural Drones and its Applications. In Proceedings of the 2020 Fifth International Conference on Research in Computational Intelligence and Communication Networks (ICRCICN), Bangalore, India, 26–27 November 2020; pp. 181–185. [Google Scholar] [CrossRef]
  13. Zhang, S.; Xue, X.; Chen, C.; Sun, Z.; Sun, T. Development of a low-cost quadrotor UAV based on ADRC for agricultural remote sensing. Int. J. Agric. Biol. Eng. 2019, 12, 82–87. [Google Scholar] [CrossRef]
  14. Zhu, W.; Feng, Z.; Dai, S.; Zhang, P.; Wei, X. Using UAV Multispectral Remote Sensing with Appropriate Spatial Resolution and Machine Learning to Monitor Wheat Scab. Agriculture 2022, 12, 1785. [Google Scholar] [CrossRef]
  15. Pei, H.; Sun, Y.; Huang, H.; Zhang, W.; Sheng, J.; Zhang, Z. Weed Detection in Maize Fields by UAV Images Based on Crop Row Preprocessing and Improved YOLOv4. Agriculture 2022, 12, 975. [Google Scholar] [CrossRef]
  16. Ahmed, S.; Qiu, B.; Ahmad, F.; Kong, C.W.; Xin, H. A State-of-the-Art Analysis of Obstacle Avoidance Methods from the Perspective of an Agricultural Sprayer UAV’s Operation Scenario. Agronomy 2021, 11, 1069. [Google Scholar] [CrossRef]
  17. Xu, S.; Xu, X.; Zhu, Q.; Meng, Y.; Yang, G.; Feng, H.; Yang, M.; Zhu, Q.; Xue, H.; Wang, B. Monitoring leaf nitrogen content in rice based on information fusion of multi-sensor imagery from UAV. Precis. Agric. 2023, 24, 2327–2349. [Google Scholar] [CrossRef]
  18. Wei, L.; Yang, H.; Niu, Y.; Zhang, Y.; Xu, L.; Chai, X. Wheat biomass, yield, and straw-grain ratio estimation from multi-temporal UAV-based RGB and multispectral images. Biosyst. Eng. 2023, 234, 187–205. [Google Scholar] [CrossRef]
  19. Rachmawati, S.; Putra, A.S.; Priyatama, A.; Parulian, D.; Katarina, D.; Habibie, M.T.; Siahaan, M.; Ningrum, E.P.; Medikano, A.; Valentino, V.H. Application of Drone Technology for Mapping and Monitoring of Corn Agricultural Land. In Proceedings of the 2021 International Conference on ICT for Smart Society (ICISS), Bandung, Indonesia, 2–4 August 2021; pp. 1–5. [Google Scholar] [CrossRef]
  20. Daud, S.M.S.M.; Yusof, M.Y.P.M.; Heo, C.C.; Khoo, L.S.; Singh, M.K.C.; Mahmood, M.S.; Nawawi, H. Applications of drone in disaster management: A scoping review. Sci. Justice 2022, 62, 30–42. [Google Scholar] [CrossRef]
  21. Worakuldumrongdej, P.; Maneewam, T.; Ruangwiset, A. Rice Seed Sowing Drone for Agriculture. In Proceedings of the 2019 19th International Conference on Control, Automation and Systems (ICCAS), Jeju, Republic of Korea, 15–18 October 2019; pp. 980–985. [Google Scholar] [CrossRef]
  22. Guzman, S.D.; Henspeter, D.; Taylor, M.; Duan, S. Drone Pollination of Flowering Vegetation for Agricultural Applications. In Proceedings of the Volume 4: Advances in Aerospace Technology, Virtual, Online, 16–19 November 2021; p. V004T04A023. [Google Scholar] [CrossRef]
  23. Shi, Q.; Liu, D.; Mao, H.; Shen, B.; Liu, X.; Ou, M. Study on Assistant Pollination of Facility Tomato by UAV. In Proceedings of the 2019 ASABE Annual International Meeting, Boston, MA, USA, 7–10 July 2019. [Google Scholar] [CrossRef]
  24. Alyafei, M.A.; Al Dakheel, A.; Almoosa, M.; Ahmed, Z.F. Innovative and Effective Spray Method for Artificial Pollination of Date Palm Using Drone. HortScience 2022, 57, 1298–1305. [Google Scholar] [CrossRef]
  25. Wang, Y.; Bai, R.; Lu, X.; Quan, S.; Liu, Y.; Lin, C.; Wei, J.; Su, Y.; Yao, R. Pollination Parameter Optimization and Field Verification of UAV-Based Pollination of ‘Kuerle Xiangli’. Agronomy 2022, 12, 2561. [Google Scholar] [CrossRef]
  26. Hu, S.; Cao, X.; Demg, Y. Impact of Plant Protection Drone Flight Parameters on Droplet Distribution for Camellia Pollination and Fruit-Setting Rate. Trans. Chin. Soc. Agric. Eng. Trans. CSAE 2023, 39, 92–100. [Google Scholar] [CrossRef]
  27. Wang, P.; Hu, L.; Zhou, Z.; Yang, W.; Luo, X.; Xue, X.; He, J. Wind field measurement for supplementary pollination in hybrid rice breeding using unmanned gasoline engine single-rotor helicopter. Trans. Chin. Soc. Agric. Eng. Trans. CSAE 2013, 29, 54–61. [Google Scholar]
  28. Li, J.; Zhou, Z.; Lan, Y.; Hu, L.; Zang, Y.; Liu, A.; Luo, X.; Zhang, T. Distribution of canopy wind field produced by rotor unmanned aerial vehicle pollination operation. Trans. Chin. Soc. Agric. Eng. Trans. CSAE 2015, 31, 77–89. [Google Scholar]
  29. Jiyu, L.; Lan, Y.; Jianwei, W.; Shengde, C.; Cong, H.; Qi, L.; Qiuping, L. Rice pollen distribution pattern based on small unmanned aerial vehicle wind field. China Agric. Dig. Agric. Eng. 2018, 31, 19–23. [Google Scholar] [CrossRef]
  30. Li, J.; Zhou, Z.; Hu, L.; Zang, Y.; Yan, M.; Liu, A.; Luo, X.; Zhang, T. Optimization of operation parameters for supplementary pollination in hybrid rice breeding using uniaxial single-rotor electric unmanned helicopter. Trans. Chin. Soc. Agric. Eng. Trans. CSAE 2014, 30, 10–17. [Google Scholar] [CrossRef]
  31. Shi, Q.; Liu, D.; Mao, H.; Shen, B.; Li, M. Wind-induced response of rice under the action of the downwash flow field of a multi-rotor UAV. Biosyst. Eng. 2021, 203, 60–69. [Google Scholar] [CrossRef]
  32. Shi, Q.; Pan, Y.; He, B.; Zhu, H.; Liu, D.; Shen, B.; Mao, H. The Airflow Field Characteristics of UAV Flight in a Greenhouse. Agriculture 2021, 11, 634. [Google Scholar] [CrossRef]
  33. Shi, Q.; Mao, H.; Guan, X. Numerical Simulation and Experimental Verification of the Deposition Concentration of an Unmanned Aerial Vehicle. Appl. Eng. Agric. 2019, 35, 367–376. [Google Scholar] [CrossRef]
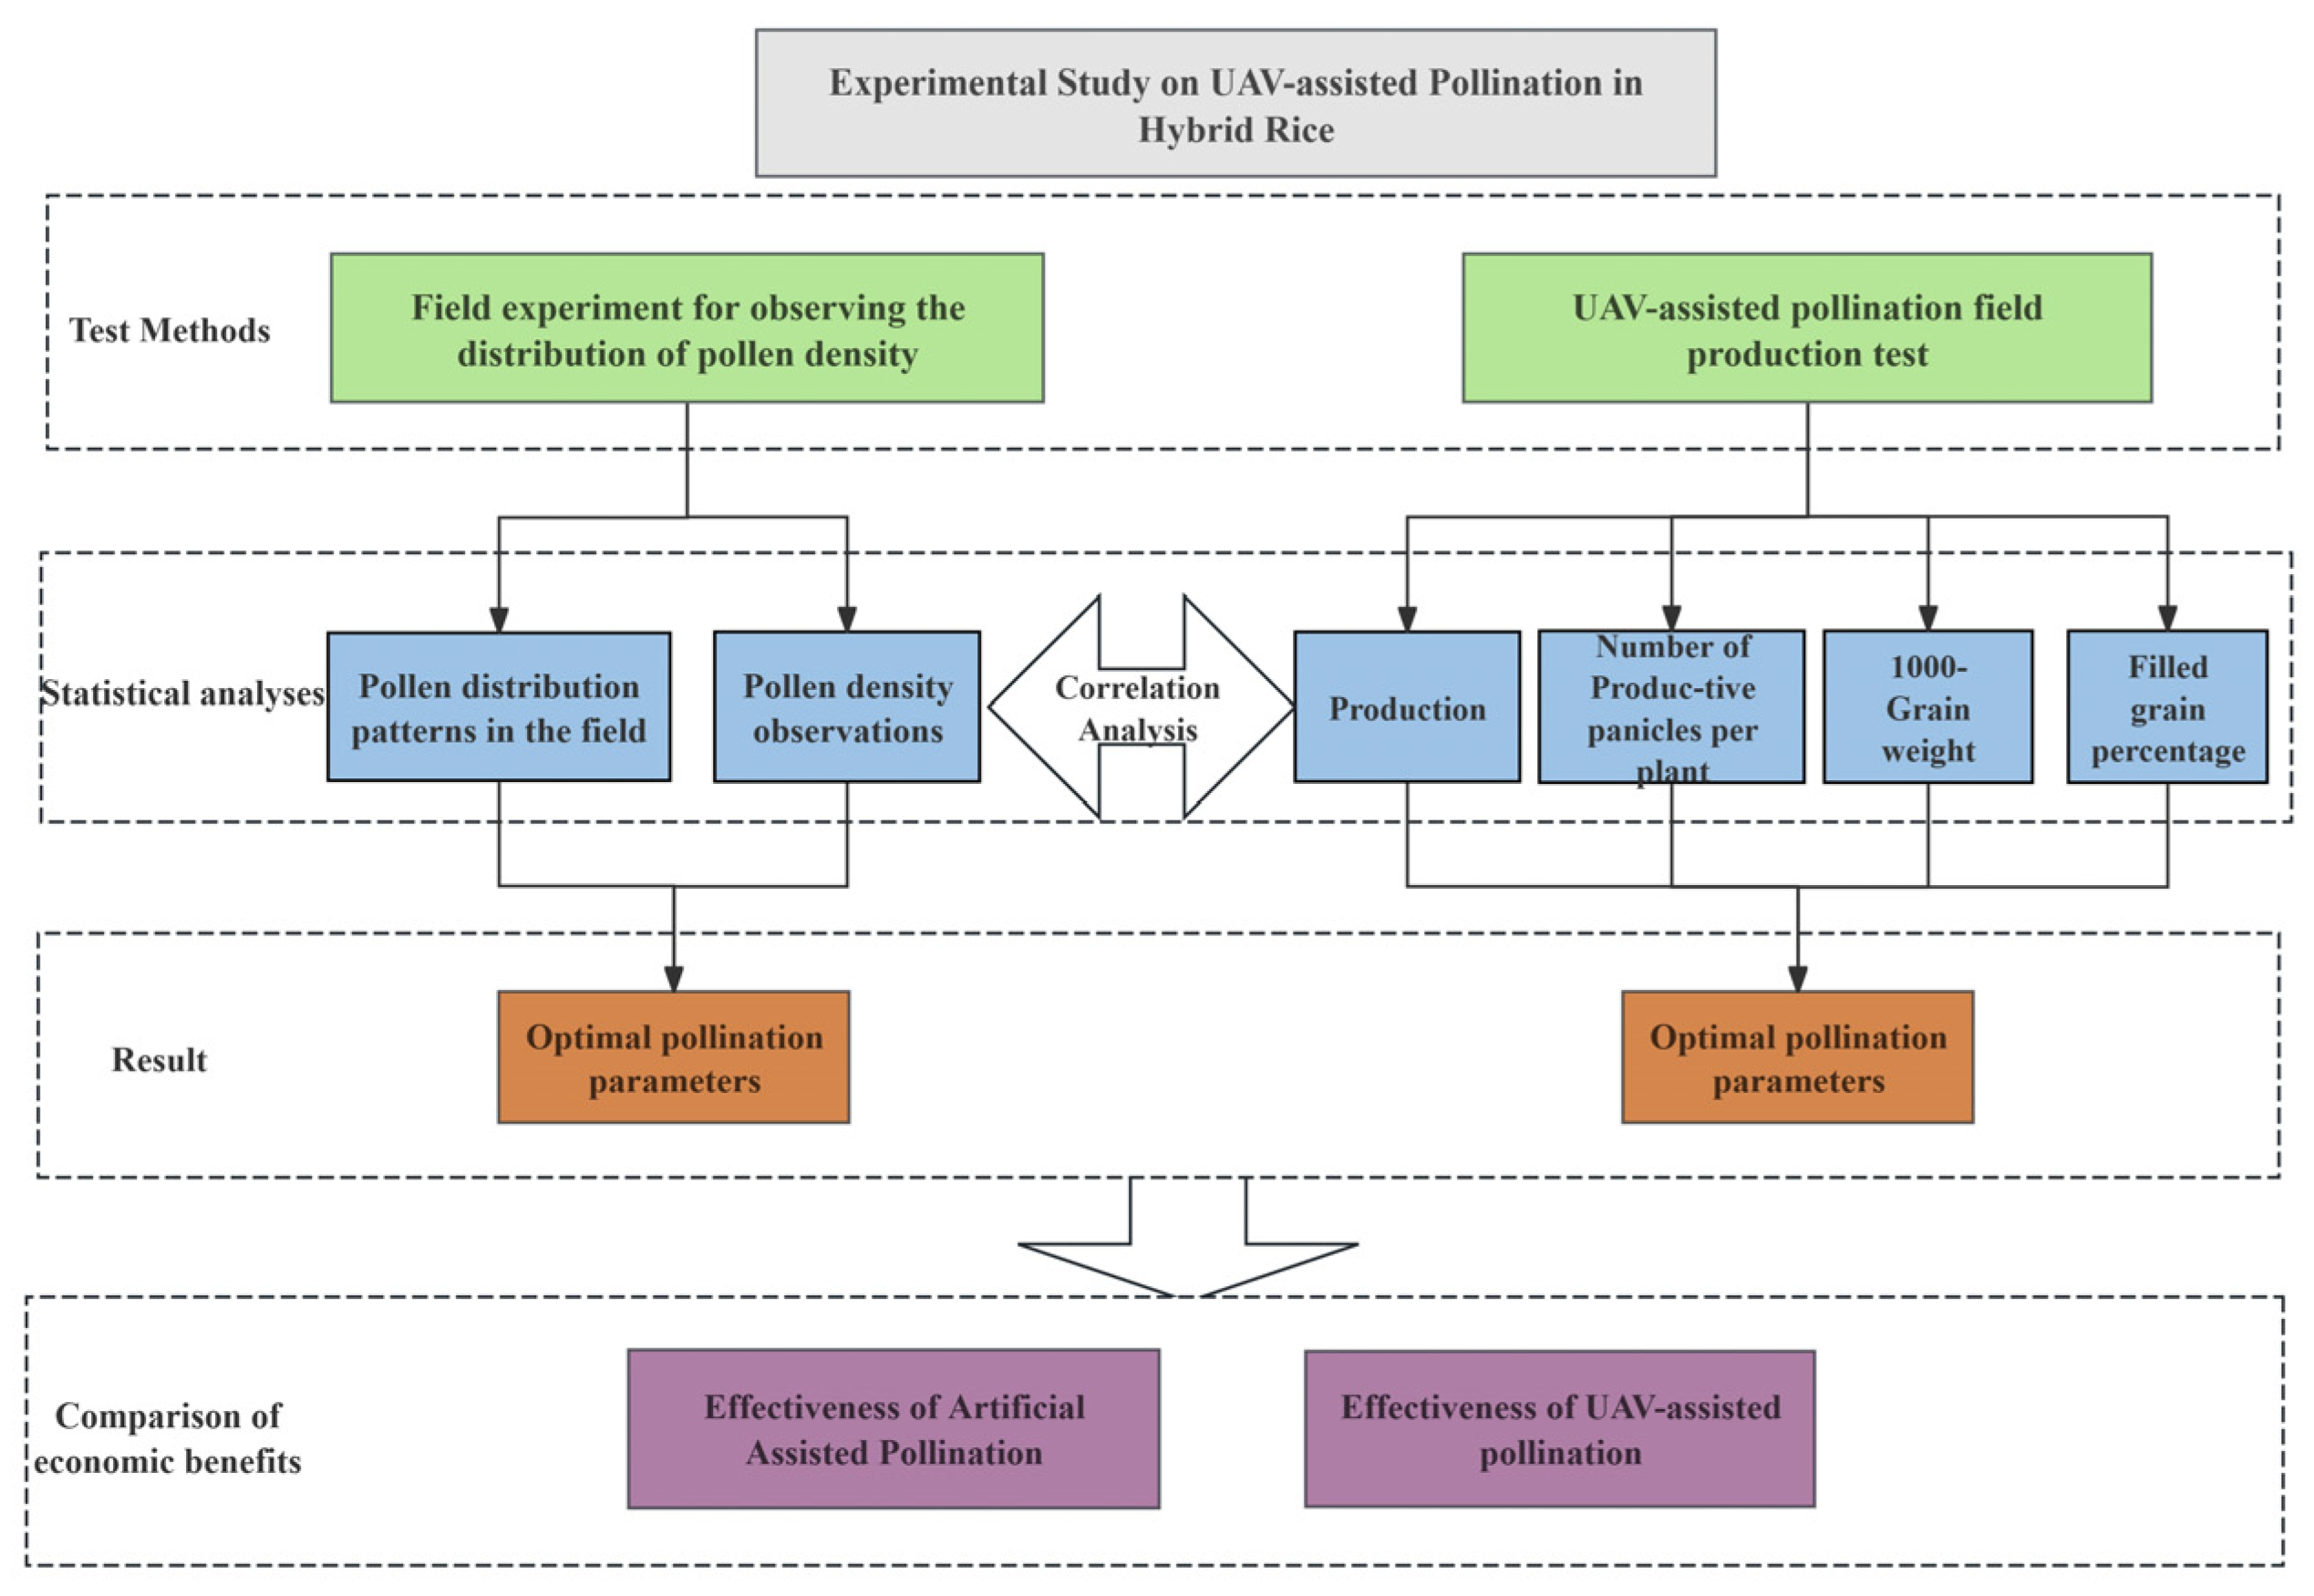
Figure 1. Workflow diagram.
Drones 09 00327 g001
Figure 2. Pollen collection test arrangement. (a) Schematic diagram of the pollen collection device combination; (b) schematic diagram of the field release to the pollen collection device. (c) Schematic diagram of the auxiliary pollination path and sampling point arrangement by a UAV in a parallel parent row; (d) schematic diagram of the auxiliary pollination path and sampling points arranged by the UAV in a vertical parent row.
Drones 09 00327 g002
Figure 3. Field pollen sampling test situation. (a) Schematic diagram of field sampling point arrangement; (b) schematic diagram of UAV field-assisted pollination.
Drones 09 00327 g003
Figure 4. Schematic diagram of slide handling methods and observations. (a) Schematic diagram of plum-shaped sampling method; (b) Schematic diagram of pollen distribution in a single field of view.
Drones 09 00327 g004
Figure 5. Pollen collection test results and analysis. (a) Comparison of different flight parameters on pollen distribution density in parallel parent rows; (b) comparison of different flight parameters on pollen distribution density in vertical parent rows. Note: different capital letters in the figure indicate that the effects of different flight speeds on the number of pollen distributions are significant at the p = 0.05 level under the condition of the same flight altitude; different lowercase letters in the table indicate that the effects of different flight altitudes on the number of pollen distributions are significant at the p = 0.05 level under the condition of the same flight speed.
Drones 09 00327 g005
Figure 6. Correlation analysis between pollen distribution density and yield.
Drones 09 00327 g006
Table 1. DJI T50 UAV main performance indexes.
Main Performance IndexesNumerical Value
Whole machine size2800 × 3085 × 820 mm
Battery capacity30 Ah
Net weight of whole machine39.9 kg
Maximum take-off weight52 kg
Operational flight speed1–10 m/s
Maximum wind speed6 m/s
Table 2. Experimental factors and levels.
LevelElement AElement BElement C
RouteHeight/(m)Speed/(m/s)
113.52
2243
3 4.54
Table 3. Pollen density statistics under UAV and artificial-assisted pollination methods.
Group (Mean ± Standard Deviation)tp
UAV-Assisted PollinationArtificial-Assisted Pollination
Pollen density (grains/field)4.37 ± 0.593.68 ± 0.684.593<0.001
Table 4. Yield and its components under different pollination methods.
VarietyPollination MethodsNumber of Productive Panicles per PlantFilled Grain Percentage (%)1000-Grain Weight (g)Production (t/hm2)
Changtian You 405UAV-assisted pollination21.6215.7621.942.10
Artificial-assisted pollination17.8514.5021.711.73
Wanxiang You 377UAV-assisted pollination20.6934.2020.152.61
Artificial-assisted pollination21.1532.9020.182.35
Table 5. Effect of different flight parameters on yield and its composition of Changtian You 405 hybrid rice.
RouteFlight Speed (m/s)Flying Height (m)Test Area
(m2)
Number of Productive Panicles per PlantFilled Grain Per-Centage ± Standard Deviation (%)1000-Grain Weight (g)Production ± Standard Deviation (t/hm2)
Parallel Parentage23.5106719.1113.04 ± 2.20 Bb21.801.60 ± 0.16 Bb
4.066722.0019.43 ± 6.40 Ba22.012.32 ± 0.29 Ba
4.5146721.7811.08 ± 0.49 Bb22.072.06 ± 0.08 Bb
33.566719.2817.89 ± 2.82 Ab22.242.15 ± 0.00 Ab
4.066718.1122.21 ± 7.11 Aa21.882.64 ± 0.00 Aa
4.5106728.7220.25 ± 0.44 Ab22.162.23 ± 0.37 Ab
43.5186824.7813.51 ± 6.83 Bb22.131.70 ± 0.00 Bb
4.0106719.6718.94 ± 3.45 Ba22.672.39 ± 0.38 Ba
4.586719.6714.89 ± 2.86 Bb22.061.81 ± 0.10 Bb
Vertical parentage23.593422.7816.03 ± 0.34 Bb21.801.80 ± 0.36 Bb
4.073417.7820.20 ± 1.60 Ba21.942.23 ± 0.60 Ba
4.5113420.569.35 ± 3.69 Bb21.702.38 ± 0.67 Bb
33.573420.2813.84 ± 2.48 Ab21.522.11 ± 0.00 Ab
4.073421.5619.11 ± 3.51 Aa21.552.63 ± 0.12 Aa
4.586719.5017.36 ± 0.80 Ab22.591.42 ± 0.27 Ab
43.5273524.6110.19 ± 0.75 Bb21.162.21 ± 0.46 Bb
4.0126725.7217.67 ± 0.33 Ba21.762.03 ± 0.03 Ba
4.5120123.2814.50 ± 3.53 Bb21.802.26 ± 0.03 Bb
Note: Different capital letters in the figure indicate that the effects of different flight speeds on the number of pollen distributions are significant at the p = 0.05 level under the condition of the same flight altitude; different lowercase letters in the table indicate that the effects of different flight altitudes on the number of pollen distributions are significant at the p = 0.05 level under the condition of the same flight speed.
Table 6. Effect of different flight parameters on yield and its composition of Vientiane Superior 377 hybrid rice.
RouteFlight Speed (m/s)Flying Height (m)Test Area
(m2)
Number of Productive Panicles per PlantFilled Grain Per-Centage ± Standard Deviation(%)1000-Grain Weight (g)Production ± Standard Deviation (t/hm2)
Parallel Parentage23.5220118.67 34.55 ± 6.09 Ab20.532.58 ± 0.08 Bb
4.0133416.78 32.24 ± 0.48 Aa20.002.66 ± 0.17 Ba
4.5133414.33 37.26 ± 8.25 Ab20.112.54 ± 0.02 Bc
33.586719.11 30.69 ± 3.05 Ab20.003.03 ± 0.07 Ab
4.093417.00 39.01 ± 4.10 Aa19.483.15 ± 0.11 Aa
4.5240116.89 31.33 ± 2.51 Ab20.492.87 ± 0.03 Ac
43.5220120.44 33.27 ± 1.31 Bb20.442.66 ± 0.06 Cb
4.0220122.67 38.26 ± 1.90 Ba20.862.62 ± 0.11 Ca
4.5220122.22 31.13 ± 8.85 Bb19.972.29 ± 0.09 Cc
Vertical parentage23.5233520.44 30.65 ± 1.68 Ab20.682.43 ± 0.01 Bb
4.0133418.44 40.24 ± 5.20 Aa20.092.71 ± 0.28 Ba
4.593417.00 34.93 ± 2.95 Ab20.272.57 ± 0.17 Bc
33.5180128.89 41.10 ± 3.02 Ab20.472.57 ± 0.08 Ab
4.0186825.22 34.39 ± 1.57 Aa20.242.66 ± 0.20 Aa
4.5200130.00 33.09 ± 4.20 Ab20.112.61 ± 0.03 Ac
43.5193418.67 28.24 ± 7.65 Bb19.752.31 ± 0.23 Cb
4.0160118.44 36.24 ± 1.42 Ba20.262.90 ± 0.25 Ca
4.5120127.11 30.89 ± 2.63 Bb19.021.72 ± 0.07 Cc
Note: Different capital letters in the figure indicate that the effects of different flight speeds on the number of pollen distributions are significant at the p = 0.05 level under the condition of the same flight altitude; different lowercase letters in the table indicate that the effects of different flight altitudes on the number of pollen distributions are significant at the p = 0.05 level under the condition of the same flight speed.
Table 7. Analysis of pollination cost and efficiency of different pollination methods.
PollinationCost
(USD/667 m2)
Work Efficiency
(hm2/h)
UAV-assisted pollination2.214.00
Artificial-assisted pollination2.760.67
Disclaimer/Publisher’s Note: The statements, opinions and data contained in all publications are solely those of the individual author(s) and contributor(s) and not of MDPI and/or the editor(s). MDPI and/or the editor(s) disclaim responsibility for any injury to people or property resulting from any ideas, methods, instructions or products referred to in the content.