Article

Response Surface Methodology and Artificial Neural Network-Based Models for Predicting Performance of Wire Electrical Discharge Machining of Inconel 718 Alloy

by
Vishal Lalwani
1,
Priyaranjan Sharma
2,
Catalin Iulian Pruncu
3,4,* and
Deepak Rajendra Unune
1,5
1
Department of Mechanical-Mechatronics Engineering, The LNM Institute of Information Technology, Jaipur-302031, India
2
Department of Mechanical Engineering, National Institute of Technology, Karnataka, Surathkal-575025, India
3
Mechanical Engineering, Imperial College London, Exhibition Rd., London SW7 2AZ, UK
4
Mechanical Engineering, School of Engineering, University of Birmingham, Birmingham B15 2TT, UK
5
Department of Materials Science and Engineering, INSIGNEO Institute of in silico Medicine, University of Sheffield, Sir Robert Hadfield Building, Mappin Street, Sheffield S1 3JD, UK
*
Author to whom correspondence should be addressed.
J. Manuf. Mater. Process. 2020, 4(2), 44; https://doi.org/10.3390/jmmp4020044
Submission received: 7 April 2020 / Revised: 29 April 2020 / Accepted: 1 May 2020 / Published: 6 May 2020

Abstract

:
This paper deals with the development and comparison of prediction models established using response surface methodology (RSM) and artificial neural network (ANN) for a wire electrical discharge machining (WEDM) process. The WEDM experiments were designed using central composite design (CCD) for machining of Inconel 718 superalloy. During experimentation, the pulse-on-time (TON), pulse-off-time (TOFF), servo-voltage (SV), peak current (IP), and wire tension (WT) were chosen as control factors, whereas, the kerf width (Kf), surface roughness (Ra), and materials removal rate (MRR) were selected as performance attributes. The analysis of variance tests was performed to identify the control factors that significantly affect the performance attributes. The double hidden layer ANN model was developed using a back-propagation ANN algorithm, trained by the experimental results. The prediction accuracy of the established ANN model was found to be superior to the RSM model. Finally, the Non-Dominated Sorting Genetic Algorithm-II (NSGA- II) was implemented to determine the optimum WEDM conditions from multiple objectives.

1. Introduction

For the past few decades, Inconel 718 alloy has been widely employed for the manufacturing of critical aircraft components owing to its high strength at elevated temperature, good corrosion resistance, and excellent fatigue resistance [1,2]. Due to superior thermal, chemical, and mechanical properties, the traditional machining of Inconel 718 typically results in the formation of built-up-edge at elevated temperature. It weakens the degradation of the machining performances, thereby the literature has endorsed it as a difficult-to-cut material [1,2]. The problems of machining of difficult- to-cut materials can be minimised by using the non-traditional machining techniques. Wire electrical discharge machining (WEDM) can be effectively used for the machining of difficult-to-cut materials and has the ability to produce accurate, precise, and complex surfaces with the help of very thin wires [3,4]. However, the selection of the proper machining parameters to achieve the desired machining performance has always been a challenging task for industry [5].
WEDM is an electro-thermal machining process in which a rapid cyclic spark yields a temperature around 10,000 °C. It is discharged in the gap between an electrically conductive wire electrode and the work piece that further leads to material removal through melting and evaporation [6]. This process is governed by several direct and indirect parameters such as pulse-on-time, pulse- off-time, peak current, wire tension, gap voltage, frequency of discharge, mechanical and thermal properties of wire electrode, and work piece, etc. Most researchers have presented their studies on the influence of input parameters of WEDM on various responses including and materials removal rate (MRR), kerf width, and surface roughness, etc. Tosun et al. [7] applied Taguchi’s approach to perform experiments during the machining of AISI4140 steel to investigate the impact of pulse duration, open circuit voltage, wire speed, and dielectric flushing pressure on MRR and kerf width. They concluded that the open circuit voltage and pulse duration have a significant impact on MRR and kerf width in the WEDM process. Hewidy et.al. [8] applied the response surface methodology (RSM) approach during the machining of Inconel 601, where they highlighted the impact of peak current, duty factor, wire tension, and water pressure on the MRR, wear ratio and surface roughness. It has been reported that peak current increases the MRR and wear ratio while decreasing the surface finish owing to increased discharge energy. In [9], the authors used the Genetic Algorithm (GA) for multipurpose optimization of WEDM and examined the effects of different process parameters like discharge current, pulse duration, pulse frequency, wire speeds, wire tension, and dielectric flow rate on MRR, surface roughness (Ra), and kerf width (Kf). Further, Kumar and Agarwal [10] applied the NSGA-II optimization method to optimize WEDM input parameters for multi-objective optimization of surface integrity and MRR while performing high speed machining of steel with the help of zinc coated wire. The literature survey shows that many studies have already reported on WEDM processes for the machining of titanium alloys. Constrained and Pareto optimization techniques were used for the optimization of WEDM for various process parameters like dimensional deviation, cutting speed, and surface integrity during the machining of c-titanium aluminide alloy by Sarkar et al. [11]. In other study, Kuriakose et al. [12] used zinc coated brass wire for the machining of titanium alloy (Ti-6Al-4V). They further studied the effects of numerous process variables using the machine learning based data mining method on cutting speed and surface integrity. Manna and Bhattacharyya [13] used the Gauss elimination dual response technique in order to find the optimum machining conditions for WEDM during the machining of aluminium reinforced silicon carbide metal matrix composites. WEDM for the machining of Armor materials was presented by Bobbili et al. [14] to machine RHA steel and aluminium alloy 7017. They concluded that an increase in pulse-on-time increases MRR and surface roughness. Patil and Brahmankar [15] investigated the effects of various WEDM process parameters on surface quality, kerf width, and cutting speed using brass wire material with a zinc coating. They applied Taguchi’s approach for the machining of alumina particulate reinforced aluminium matrix composites (Al/Al2O3p). They recommended that current, and pulse-on-time have substantial influence on cutting rate, surface finish, and kerf width.
It was found that designing a mathematical relationship between the input process parameters and the output responses is extremely difficult in WEDM because of the inherent nonlinear nature of these process parameters [16]. In order to find the responses for a given set of process parameters and to optimize them, the modelling of a complex system is crucial for reducing the manufacturing costs. From the literature survey, we found that artificial neural network (ANN) is a widely used technique for process modelling and optimization. This is because of its ability to form non-linear relations between various inputs and output parameters. Further, it can be easily applied for modelling complex problems owing to its powerful data-driven, self-adaptive, flexible computational capabilities, unlike mathematical models. Moreover, ANN can handle large quantity of data sets for training and has the ability to implicitly detect complex nonlinear relationships between dependent and independent variables. The research work conducted by Samantha et al. [17] investigated the predicted values for both ANN and the regression model. The performance of these two approaches was compared and ANN was found to be more efficient. Biswas et al. [18] found that ANN architecture is a unique, flexible, and powerful method of modelling for the laser micro-drilling process on titanium nitride/alumina composites. Table 1 presents a comprehensive review of the literature on the application of ANN for modelling of the WEDM process.
From Table 1, it can be seen that most of the work carried out in the past did not consider the superalloys, especially, Inconel 718, as the work piece. The kerf width is a critical response parameter for the WEDM process which influences the accuracy of the WEDM operation, but was not considered in previous studies while modelling the WEDM process. That apart, most of the work used single hidden based ANN architecture and the prediction accuracy of the developed model has not been critically examined.
Therefore, the aim of this work was to perform a systematic investigation while machining Inconel 718 using WEDM operation and to establish an accurate ANN-based prediction model for the process. MRR, Ra, and kerf width were selected as performance measures for the varying input parameters, viz., pulse-on-time (TON), pulse-off-time (TOFF), servo-voltage (SV), peak current (IP), and wire tension (WT). Moreover, the performance of the established ANN model was compared with the traditional RSM model. Initially, the central composite design (CCD) approach was used to develop the experimental plan. Then, based on the experimental results, the ANN and RSM models were established and their performance compared. Further, the machining characteristics were evaluated using the established ANN model. Finally, The Non-dominated Sorting Genetic Algorithm (NSGA-II) was applied for optimisation of WEDM process performance.

2. Experimentation

2.1. Workpiece Material

The work piece specimens of size 50   mm   ( length ) × 12   mm ( width ) × 2.5   mm ( height ) were prepared from commercial Inconel 718 material with the help of an abrasive cutter (Isomet-4000, Buehler, Lake Bluff, IL, USA). To obtain a uniform surface finish, the specimens were finished using a semi-automatic polishing-machine (MetaServ-250, Buehler, Lake Bluff, IL, USA). The composition of the work piece was investigated using a glow discharge spectrometer (GDS-500A, LECO, Saint Joseph, MI, USA) and the results are shown in Table 2.

2.2. Experimental Setup

The experimental layout is shown in Figure 1. The experiments were conducted using a CNC Wire-EDM machine (Ecocut, Electronica, Pune, India). A cylindrical brass wire (Ø 250 µm) was used as a wire electrode with negative polarity and deionized water was used as the dielectric fluid. Both electrodes were kept immersed in dielectric without any external flushing while performing experiments.
For WEDM operation, the important variables having significant impact on the response variable are the electrical parameters, diameter and tension of wire, electrical and physical properties of the wire, and work piece materials. For this research, the aim was to analyse the effect of electrical parameters for selected brass wire (Ø 250 µm) and Inconel 718 work piece alloy so that industry can select suitable machining parameters to achieve the desired performance. Therefore, the pulse- on- time (TON), pulse-off-time (TOFF), servo-voltage (SV), peak current (IP), and wire tension (WT) were selected as the input machining parameters. The input parameters and their levels are shown in Table 3. The current levels of input parameter were chosen based on the literature review, trial runs, mechanism competence, and machine constraints.
In WEDM technology, each pulse is associated with on-time and off-time expressed in microseconds (μs). Upon dielectric breakdown, current commences flowing and the period for which current flows to the end of the discharge is known as pulse-on-time (TON). The period between two consecutive pulses is generally known as pulse-off-time (TOFF). This period is time lapsed from the end of a discharge to the start of consecutive discharge. During pulse-off-time, WEDM remains at momentary rest and deionization of plasma resulting from previous discharge takes place [30]. The servo motion of EDM is controlled harmony with gap-voltage fluctuation relative to SV. The wire electrode advances in the machining direction when the gap voltage is higher than SV or else the wire electrode is retracted backwards. The maximum current accessible for each pulse during a spark that is applied between both electrodes is known as the peak current. It is an important parameter that is widely considered in EDM technology. Apart from the above mentioned electrical parameters, the wire tension is considered a crucial parameter which can affect cutting accuracy and profile shape [31].
The kerf width (Kf), surface roughness (Ra), and material removal rate (MRR) were chosen as the response variables. An optical microscope (AxioCam AX10, Zeiss, Germany) was used for the measurement of kerf width at five different locations along the length of the microchannel (as shown in Figure 2) and then the average of these measurements was considered as Kf of the microchannel. Ra was measured at three different locations on the same surface using a surface roughness tester (SJ210, Mitutoyo, Japan) which has a conformance standard of ISO 1997 and the corresponding mean value was considered as the net Ra value. The cut-off length (λc) of 0.8 mm and the number of sampling (λ) of five (traverse length is 0.8 × 5 = 4 mm) were used in the measurements. Furthermore, the surface quality was investigated by analysing the surface morphology with the help of field emission electron scanning microscopic (FESEM) images taken by Nova NanoSEM 450® (FEI, Hillsboro, OR, USA).

2.3. Response Surface Methodology (RSM)

RSM is a combination of statistical and mathematical methods for prediction and optimization of response parameters which include quantifiable independent variables [32]. The WEDM system is described by a second order (quadratic) polynomial model:
Y = α 0 + i = 1 n α i X i + i = 1 n α i i X i 2 + i = 1 n   j = 1 n α i j X i X j
where Y represents the predicted response variable, α 0 ,   α i ,   and   α i i represent constant term, linear coefficients and quadratic coefficients, respectively. The cross-product coefficients are represented by α i j , the total number of factors and input parameters are represented by n and X , respectively.
In the current study, the experiments were planned on the basis of central composite design (CCD) which is a well-known design methodology within response surface methodology. The CCD technique reduces the total number of experimental trials essential to evaluate the effects of each parameter and its interactions [33]. The face-cantered design with eight centre points was selected for investigation and measured response values are shown in Table 4.

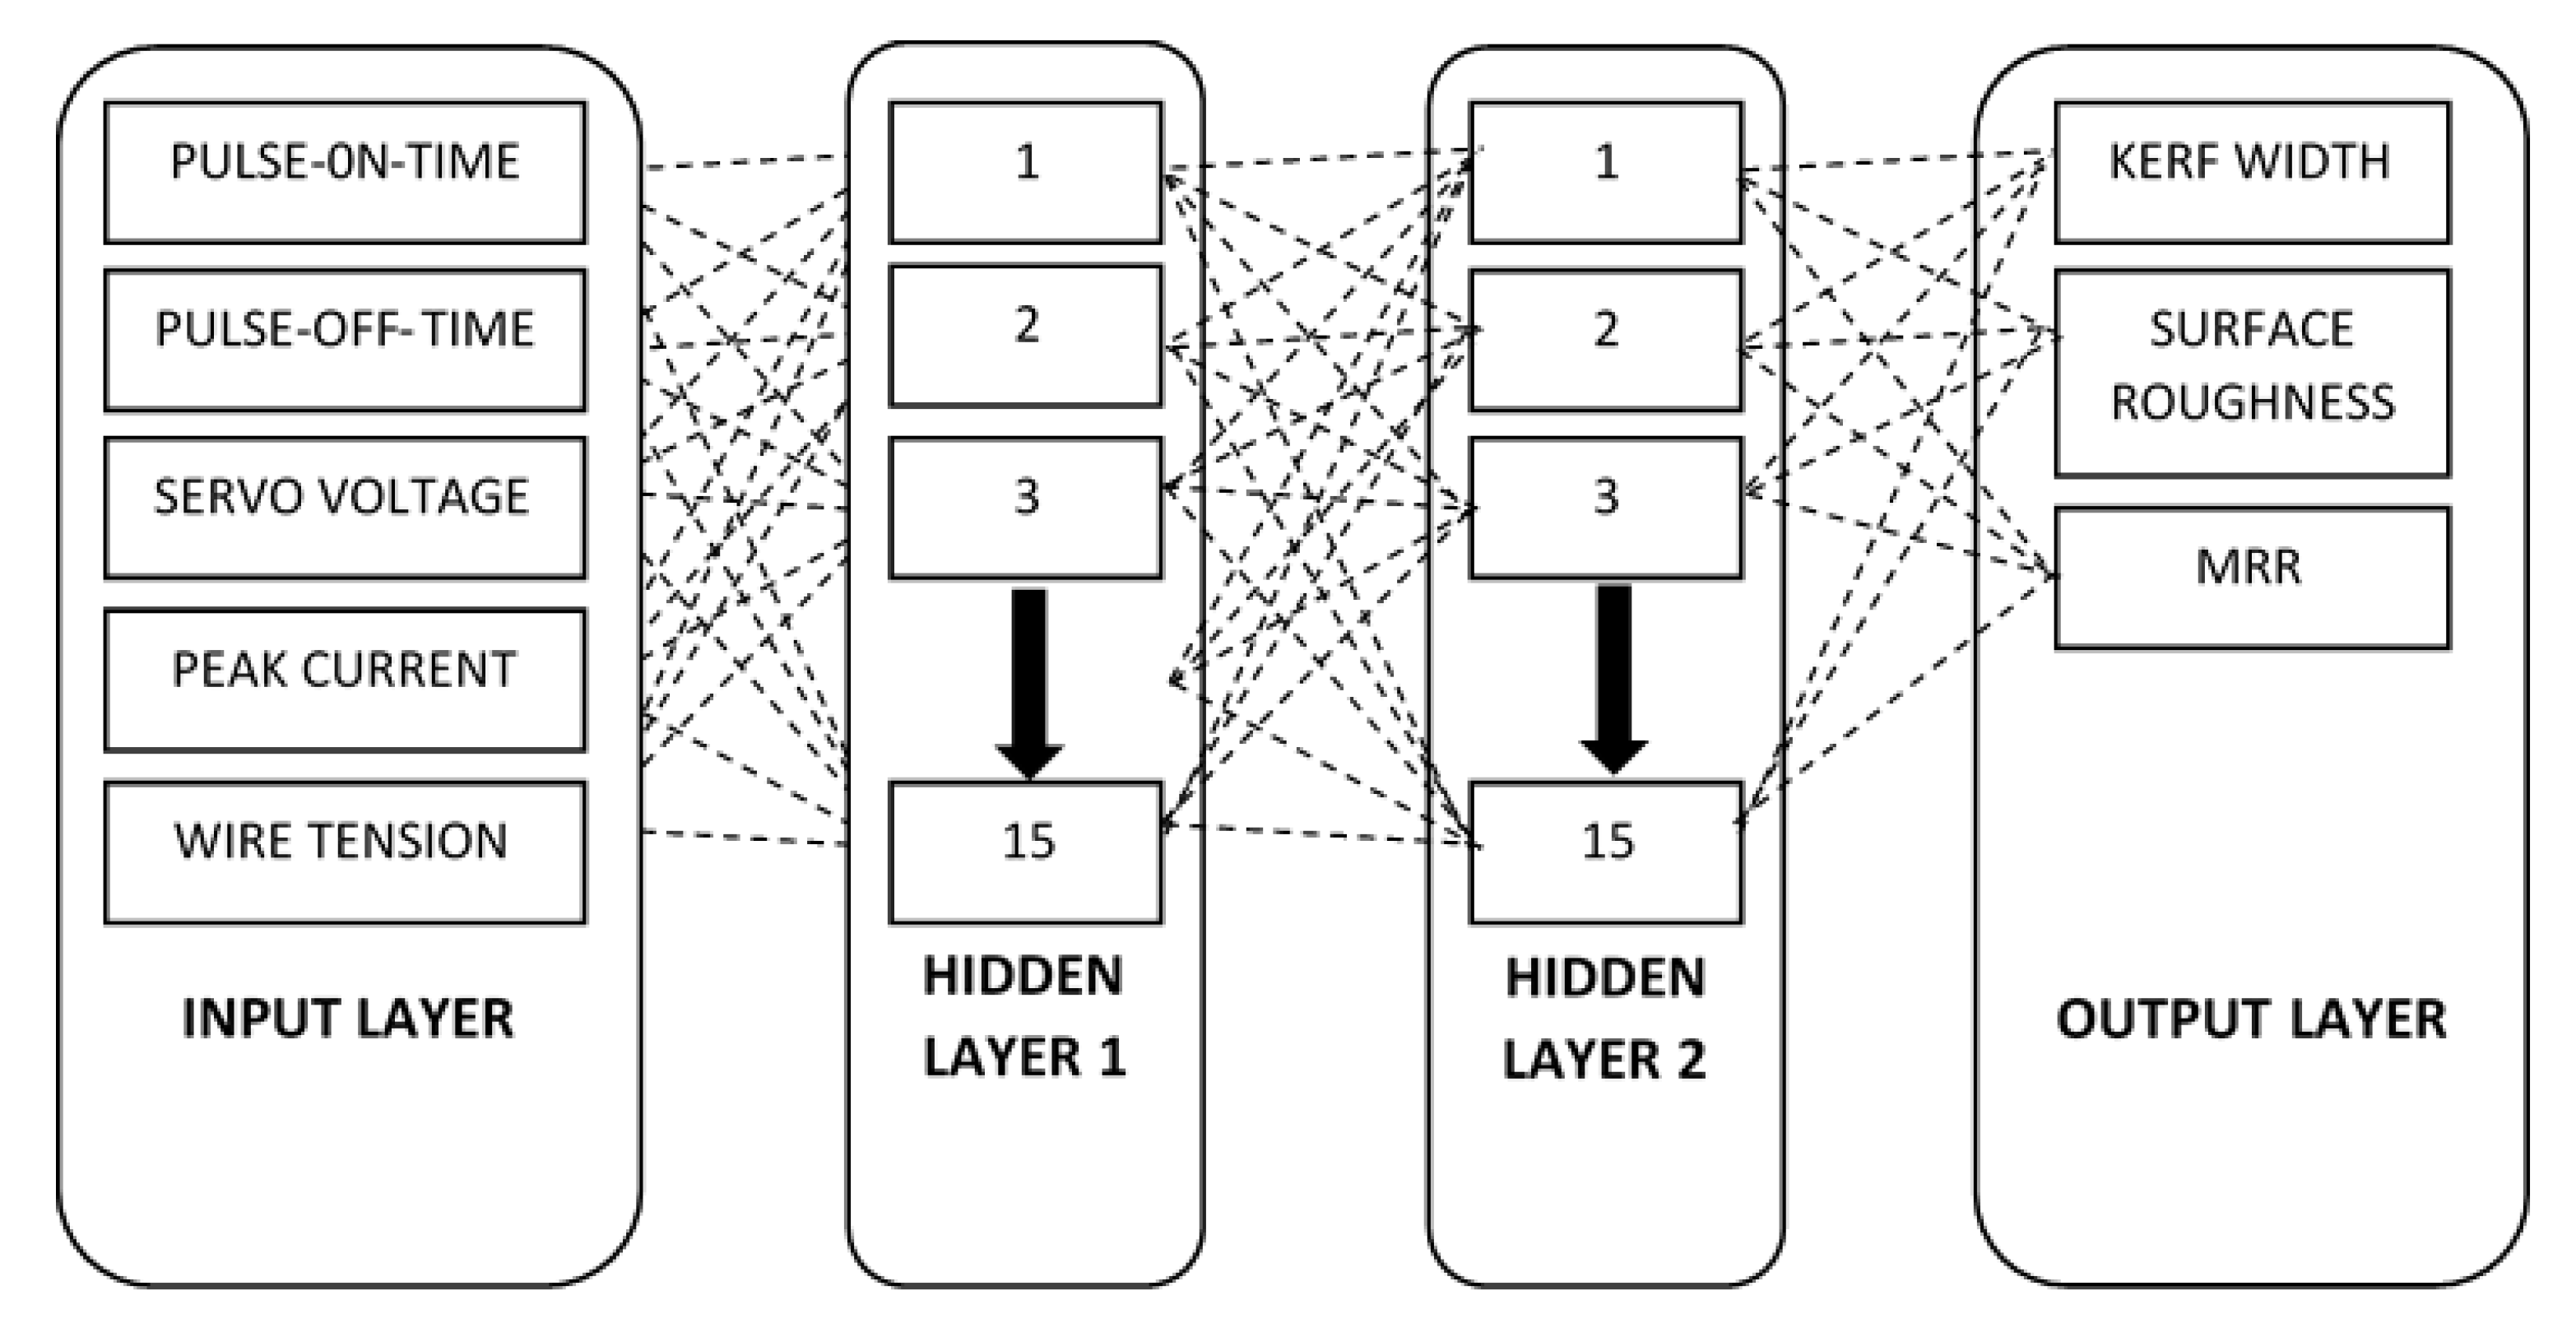
2.4. Artificial Neural Network (ANN)

ANN is an intelligent computational system able to fit complex functions. It was successfully used for solving numerous problems in various fields such as diagnosing of faults, identification of the process, property estimation, smoothing of data, and error filtering, designing and development of a product, optimization of processes, and estimation of activity coefficients [34,35]. The neural network is based on the idea of biological neural networks, and can be defined as a vastly parallel distributed processing technique. It is formed by neurons that have the capability to acquire, to learn, and to adapt to the information, in order to make it available for future use [36,37]. Thus, by taking the computational capability of a multi-layered neural network into account, we adopted it for the modelling of the WEDM process to predict the response variables Kf, Ra, and MRR involved in the machining of Inconel 718.

2.5. Non-Dominated Sorting Genetic Algorithm (NSGA-II)

The NSGA-II was chosen to optimize WEDM using the developed mathematical models. The reason is linked to the complexity nature of the WEDM process because it assumes three objectives to be solved all together. Thus, it can be extremely difficult to determine the optimal solution for the WEDM. In single-objective optimization, the best decision is usually obtained by determining the global maxima/global minima depending on the nature of the optimization problem. While in the case of multiple objectives optimization, there exists more than one solution. There are a number of classical techniques available to determine the solutions of a multi-objective problem such as min– max, distance function, and weighted sum techniques. However, these methods have several disadvantages like weighing of objectives based on their relative importance. The authors must have complete knowledge of the ranking of objective functions while using conventional optimization methods. While using Genetic Algorithm based techniques, users do not require any gradient information and inherent parallelism in searching the design space, thus making it a robust adaptive optimization technique. NSGA-II was designed based on the Pareto methodology and it has been established as a competent algorithm for cracking any multiple optimization problem [38]. The fast, non-dominated sorting, fast crowded distance estimation, and simple crowded comparison operator make NSGA-II an efficient optimization technique. Basic definitions and the flow chart of NSGA-II are available in [39,40] and have not been described in this paper.

3. Results and Discussion

3.1. ANOVA Simulation

Minitab 16 software was used to execute the ANOVA for investigating the adequacy of thedeveloped models, and the results of response surface model are given in Table 5, Table 6 and Table 7 for Kf, Ra, and MRR, respectively. The backward elimination technique was used to remove the model terms which are insignificant. In the present study, all the adequacy measures, R2, adjusted R2, and predicted R2, were found to be closer to one, which implies adequacy and fit of models. The values of R2 of 92.31% for Kf, 95.85% for Ra, and 96.30% for MRR indicate that only less than 7.59%, 4.25%, and 3.70% of the total variations in K, Ra, and MRR, respectively, were not explained by the models. The high values of the adjusted R2 i.e., 90.57% for Kf, 94.78% for Ra and 95.10% for MRR further confirm the validity of these models. Both predicted R2 and adjusted R2 were found to be in conformity with each other. Lack of fit was obtained to be non-significant for each of the cases as required. The smaller value of the coefficient of variation (CV) indicates improved accuracy and consistency of the experiments performed [41].
The significant machining parameters that affect the response variables i.e., Kf, Ra, and MRR were determined at 95% confidence level. It can be observed that the pulse-on-time (TON) is the key factor having the highest impact on Kf, Ra, and MRR, contributing 73.07% on K, 90.31% on Ra, and 46.99% on MRR, respectively. In summary, a high pulse-on-time yields a faster erosion of the material due to high values of associated discharge energy, hence a considerable increase in MRR may be observed [42].

3.2. Regression Equations

The relationships among the response characteristics (Kf, Ra, and MRR) and the input process parameters (TON, TOFF, SV, IP, and WT) were expressed by the following second-order polynomial equations in terms of actual factors.
For kerf width-
K = 0.83891 + 0.017139 × T O N + 1.14203 × 10 3 × T OFF 2.21967 × 10 3 × SV + 1.27766 × 10 3 × I P + 0.13001 × WT + 3.48662 × 10 5 × T ON × SV 3.39838 × 10 5 × T OFF × SV 8.03813 × 10 4 × I P × WT 7.51065 × 10 5 × T OFF 2
For surface roughness-
R a = 0.35667 + 0.053372 × T ON + 0.58558 × T OFF 0.69528   V 0.018477 × I P 2.51114 × WT + 8.40625 × 10 4 × T ON × T OFF + 5.89375 × 10 4 × T OFF × SV + 0.016146 × I P × WT 6.94078 × 10 3 × T OFF 2 + 6.67422 × 10 3 × S V 2   .  
For MRR-
MRR = 158.77725 + 3.54861 × T ON 0.15766 × T OFF 1.16912   S V + 0.24375 × I P   37.05428 × WT + 4.03094 × 10 3 × T ON × SV + 1.44031 × 10 3 × T OFF × V + 0.025620 × I P × WT 0.016321 × T ON 2 + 7.68448 × 10 3 × S V 2 9.07836 × 10 4 I P 2 + 12.97369 × W T 2

3.3. ANN Performance

A total of fifty input–output patterns were investigated through the NN toolbox available in the MATLAB software. In general, the ANN model is supposed to be of the form: X N1 N2 Y, where X is the number of neurons in the input layer, N1 is the number of neurons in the first hidden layer, N2 is the number of neurons in the second hidden layer, and Y represents the number of neurons in the output layer. Moreover, noise was added to the weights in order to encourage the stability of the NN structure that is to be optimized. The Levenberg–Marquardt (LM) training algorithm was used to train the feed forward back propagation network with the help of the tansig function. The tansig function used for training this neural network is given by tansig (n) = 2 ÷ ( 1 + e 2 n ) 1 . In this work, we chose five neurons in the input layer that corresponds to TON, TOFF, SV, IP, and WT and three neurons in the output layer corresponding to Kf, Ra, and MRR, as shown in Figure 3.
The performance of the network was judged on the basis of the Mean Square Error (MSE) which is given by the following equation.
MSE = 1 M × N j = 1 N   i = 1 M ( Y i   Y i )   2
where Y i is the experimental output of the ith neuron, Y i is the predicted output of the ith neuron, N is the total number of training patterns, and M is the total number of neurons in the output layer [43].
Numerous trails were conducted by varying the number of neurons in the first layer to optimize the 5-N1-3 NN structure. Based on the performance the number of neurons in the N1 layer was finalised and then the neurons in the second hidden layer were varied from one to fifteen in order to optimize 5-13-N2-3. This methodology was adopted to reduce the number of total combinations of neurons on both hidden layers by a significant amount from 225 to 30. For the first step, the performance of the 5-13-3 structure was found as optimum with 4.74% MSE. Then, while varying the neurons in the second hidden layer, the performance of the 5-13-15-3 structure was found as optimum with 1.49% MSE. The NN structure was trained more than once with minimal variation in weights in order to avoid the problems of local minima. Therefore, the 5-13-15-3 structure was selected for the prediction of the WEDM process performance in later sections. Data on the sensitivity of ANN’s response to the number of neurons are presented in Table 8.

3.4. Validation Experiments

Six additional experiments were performed using settings of input parameters that are different from the settings used in Table 4. Results of the validation experiments are presented in Table 9.
The predicted outcomes of these validation experiments obtained using RSM and ANN models were found to be in good agreement suggesting that the developed model can reliably be used for representing the experimental results. Moreover, MSE for prediction is also given in Table 8 and the ANN model outperformed the RSM model with a lower MSE of 1.41% than that of 6.33% of the RSM model.

3.5. Parametric Study Using the Developed ANN Model

The developed 5-13-15-3 ANN model was used to determine the effect of input process parameters on the response variables. While plotting the graphs for each individual parameter, other parameters were kept constant at zero level (see, Table 3).

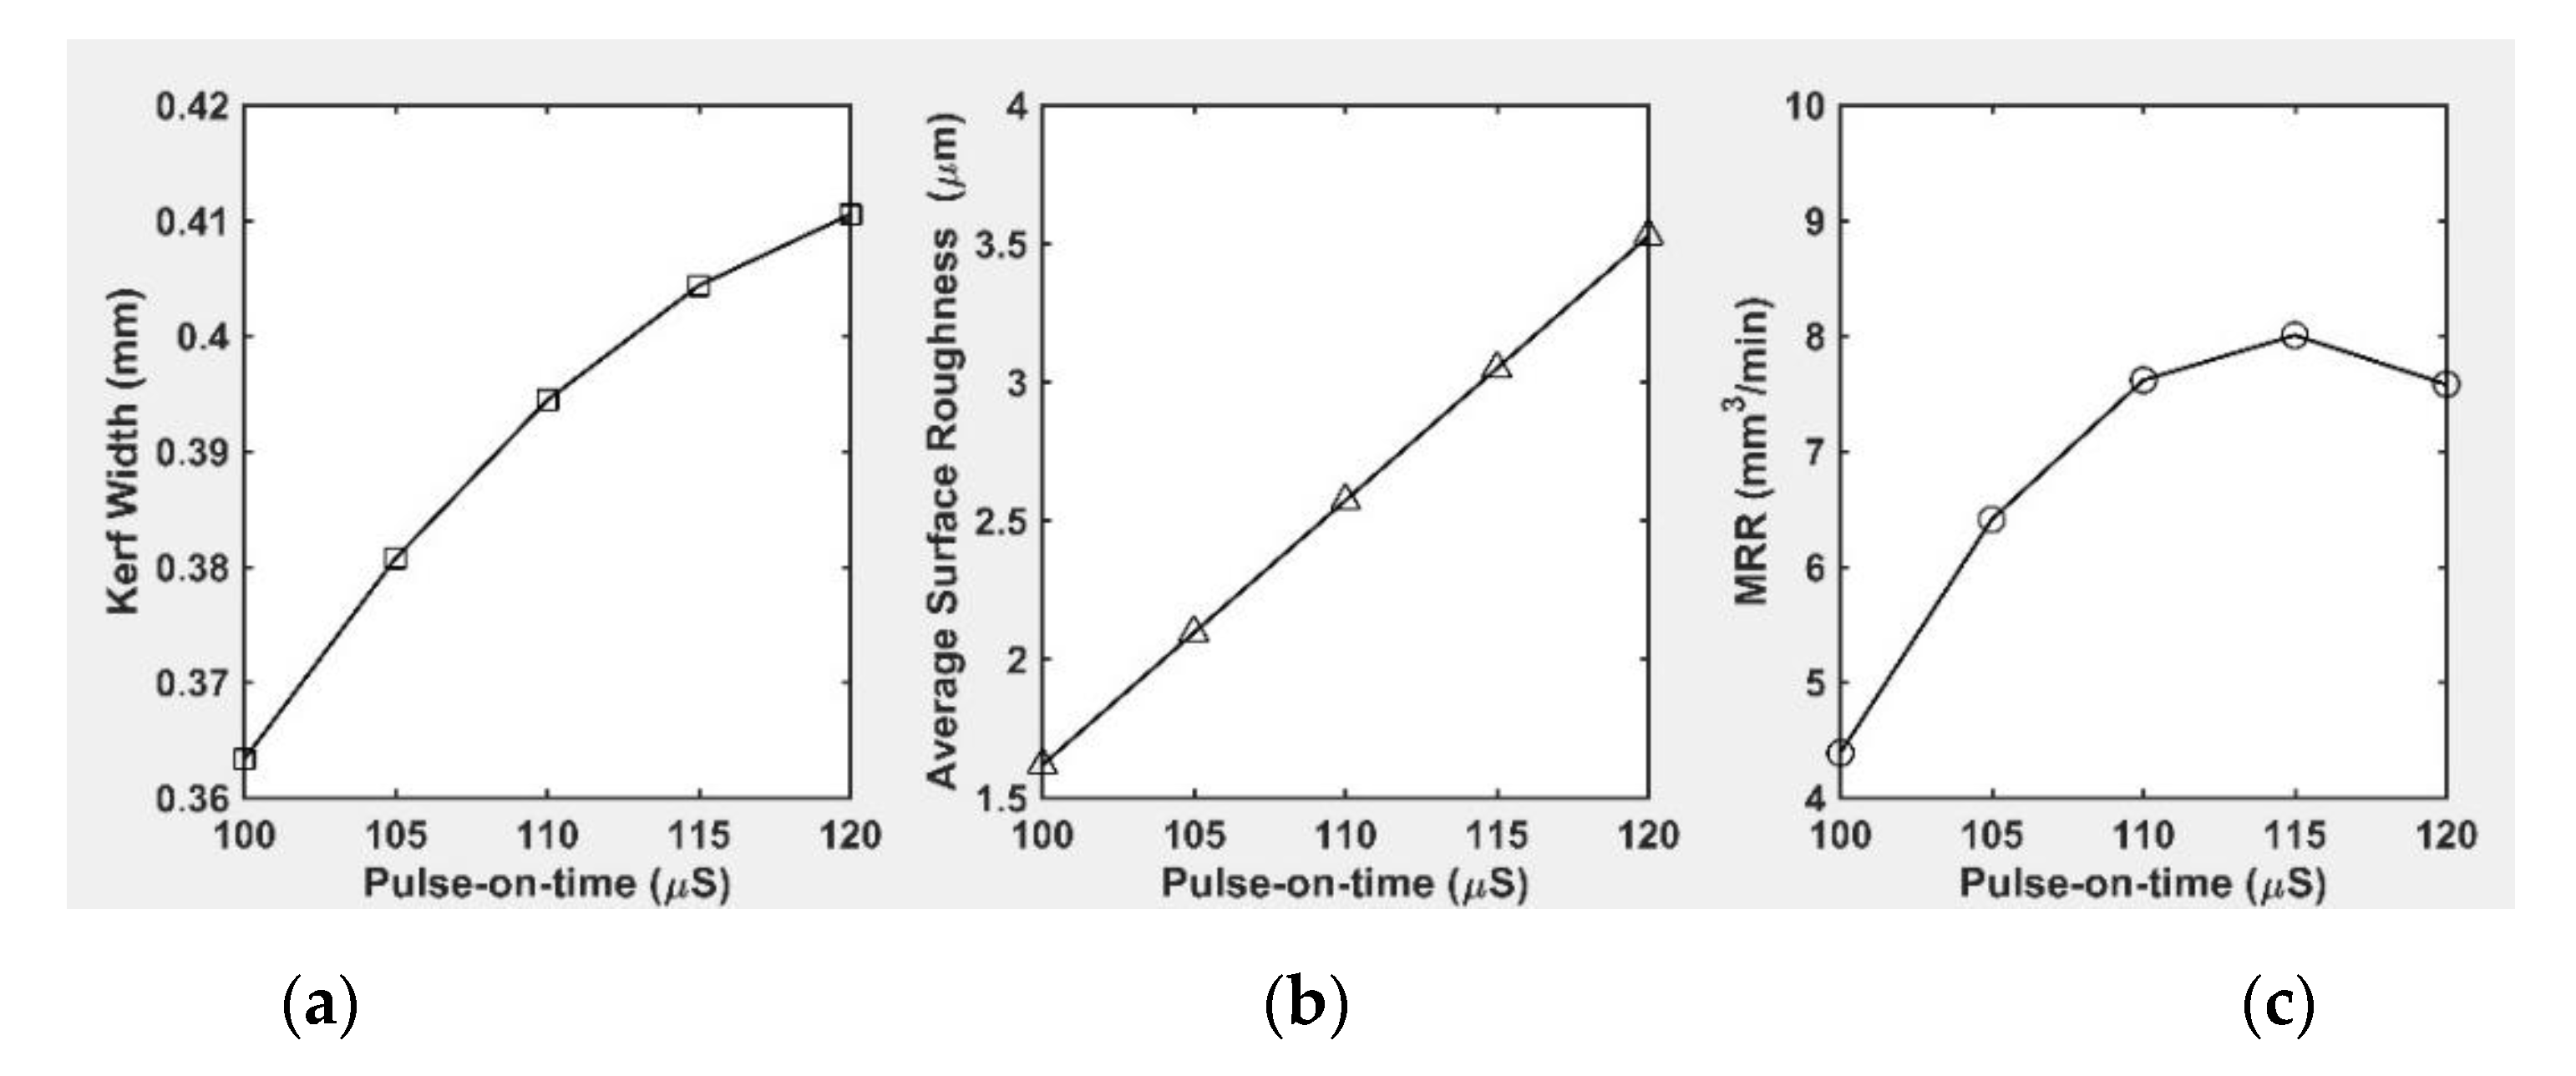
3.5.1. Effect of Pulse-On-Time

From Figure 4a, it was observed that the Kf, Ra and MRR values increase with an increase in pulse-on-time value. An increase in Ton leads to an increase in the discharge energy melting more material from the work piece and thus increasing the Kf, Ra and MRR values [44]. In Figure 4b plotted between TON and Ra, it was observed that the surface roughness increases from 0.36 μ m to 0.41 μ m when the pulse-on-time increases from 100 μ s to 120 μ s . The increase in pulse-on-time also increases the crater size on the machine surface due to increased spark intensity thus leading to poor surface quality [45]. As shown in Figure 4c, the MRR increases with the increase in pulse-on-time till a pulse- on-time value of 115 μ s and then slightly decreases at pulse-on-time value of 120 μ s . The increase of MRR with increase of the pulse-on-time values is due to the higher thermal energy of the spark which melts and vaporizes consequently a larger amount of material from the plasma channel, hence leading to an increase in MRR [46].

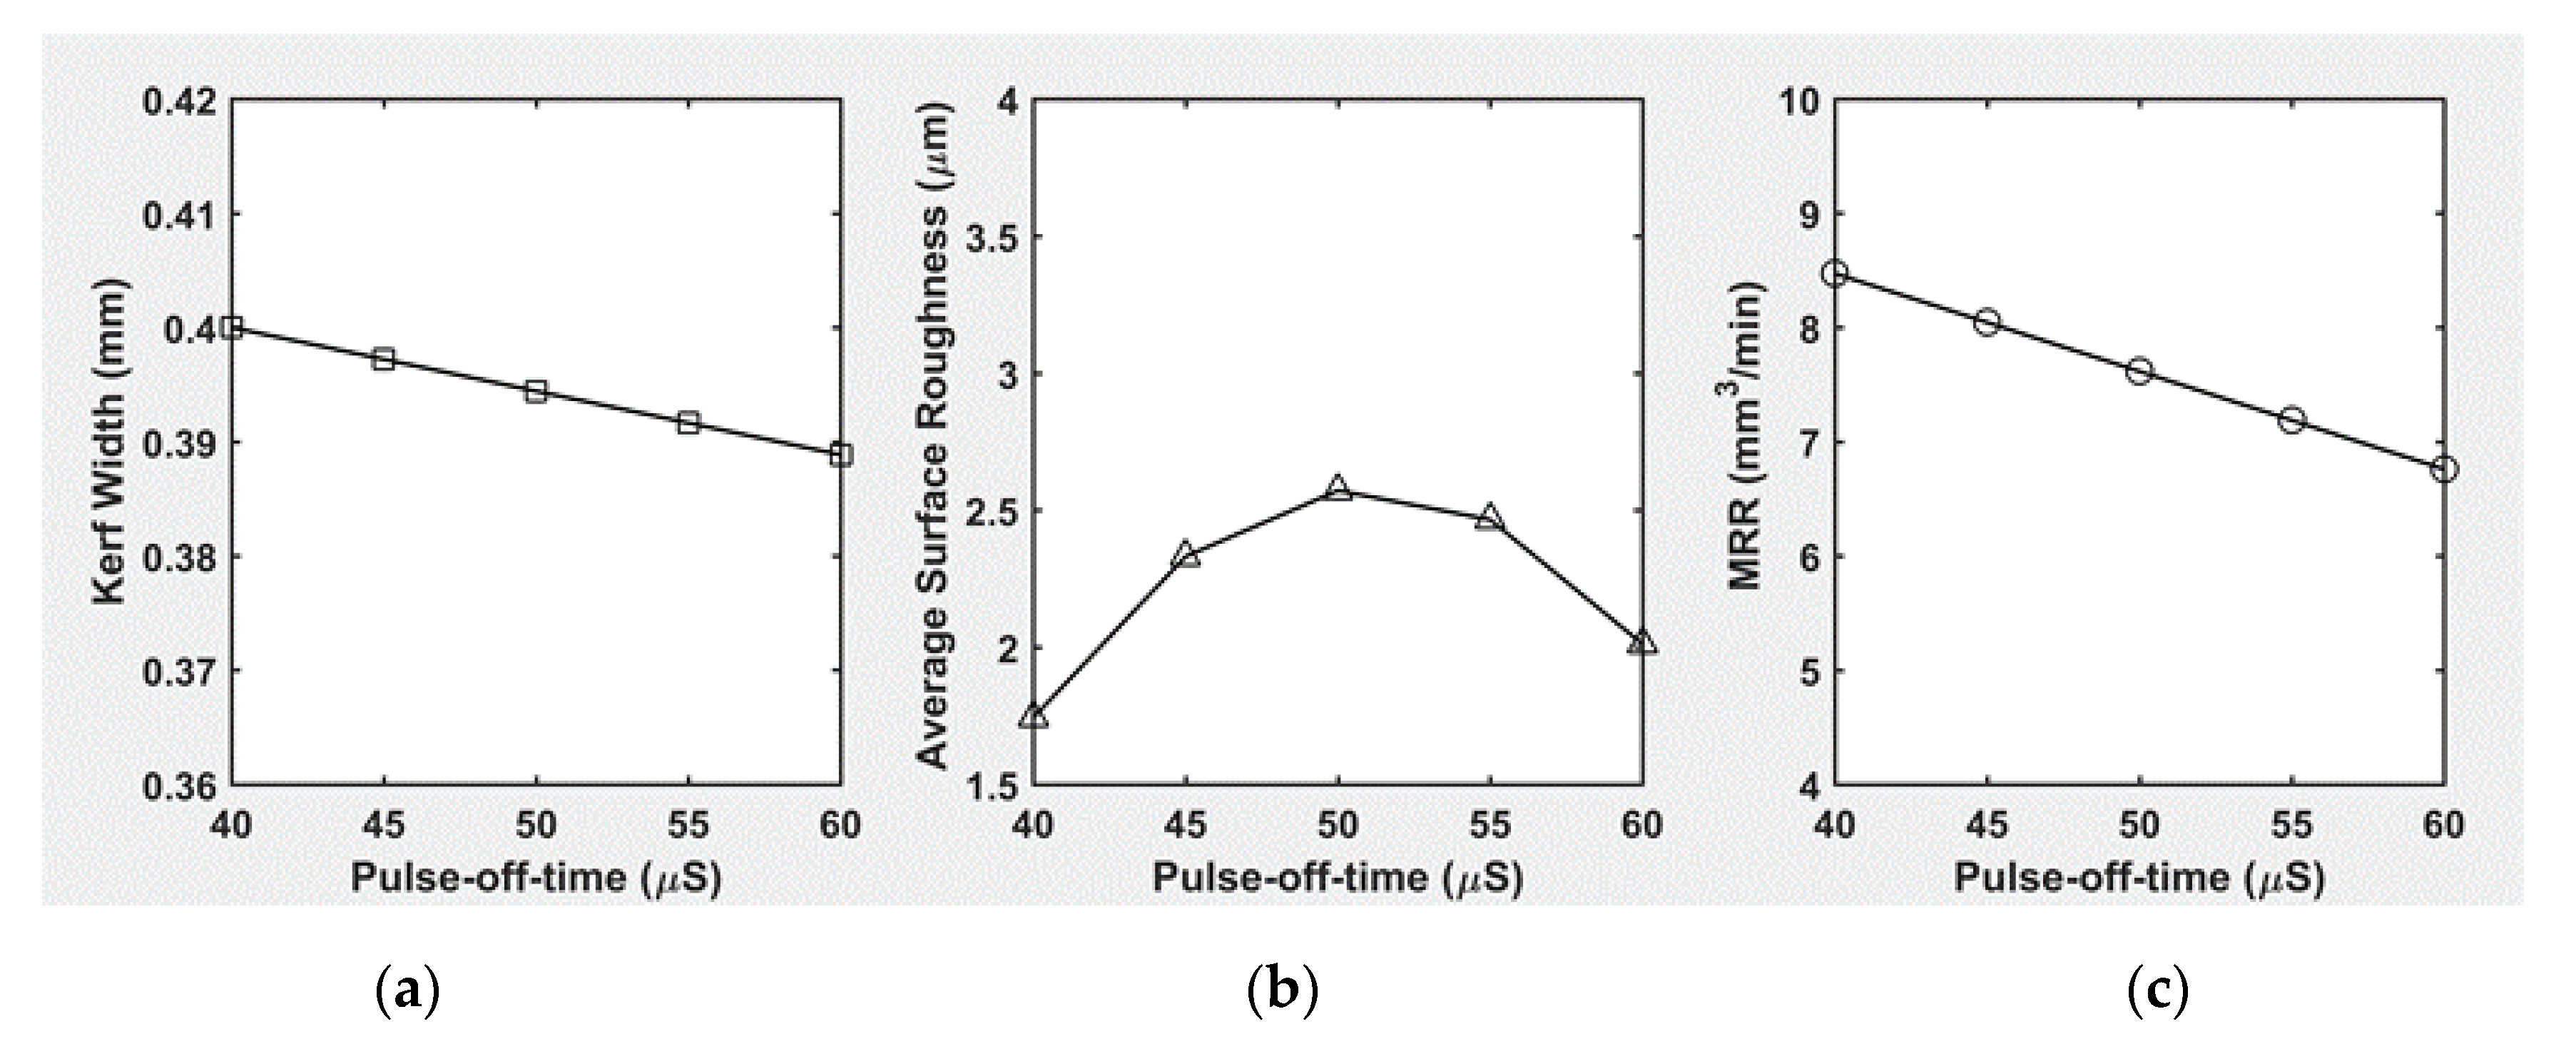
3.5.2. Effect of Pulse-Off-Time

From the graph plotted in Figure 5a amid TOFF and Kf, it appears that TOFF has a negative impact on Kf i.e., Kf increases with the decrease in TOFF and vice versa. Figure 5b shows a direct positive impact between TOFF and Ra. As TOFF increases, the flushing of the molten material significantly improves due to the increased time interval between two consecutive electrical discharges, thus improving the surface quality [44]. However, MRR decreases due to the reduced spark intensity at high TOFF. Conversely, smaller TOFF values tend to increase the spark intensity which melts and vaporizes a larger amount of material in the machining zone, thus increasing the MRR [47]. However, there is a critical value of TOFF characterized by insufficient flushing of the molten material. This causes the formation of craters and micro-flaws on the machined surface thus increasing the surface roughness Ra.

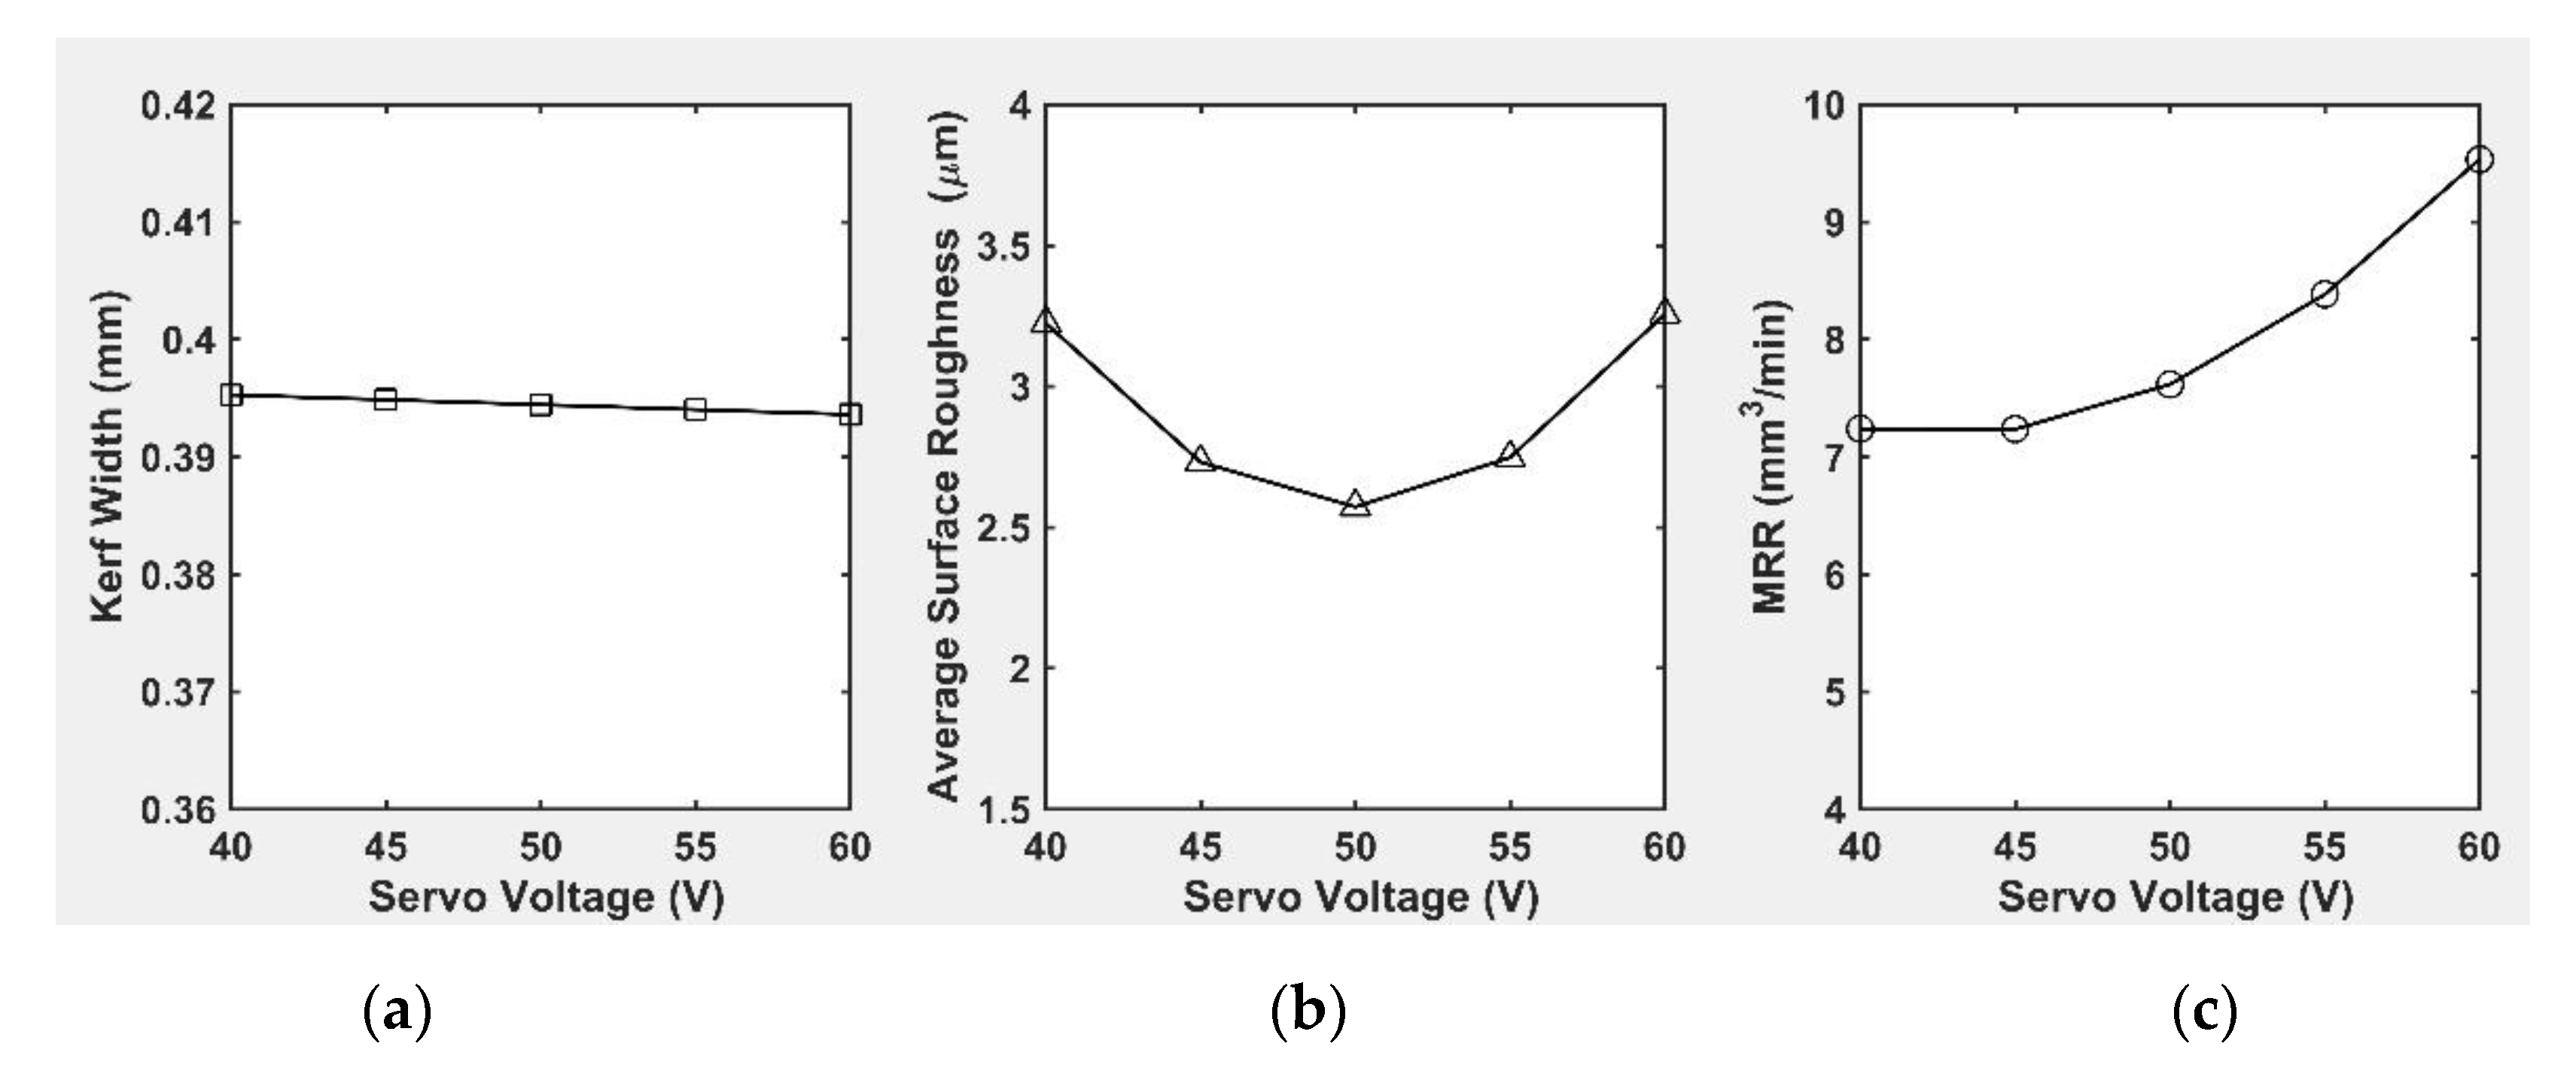
3.5.3. Effect of Servo-Voltage

The effect of servo-voltage on kerf width, Ra and MRR is shown in Figure 6a–c, respectively. The kerf width was not much influenced by the servo-voltage as seen from Figure 6a. It is apparent from Figure 6b that the Ra value initially decreases with increase in servo voltage up to a servo voltage value of 50 V and then increases with further increase in servo voltage. An increase in servo-voltage leads to higher values of MRR. It is known that higher voltages increase the spark discharge energy. This results in energy suspension amid the wire and work piece [46]. The higher evaporation rate is related to the larger discharge force exerted on the work piece area [48]. Thus, such energy dissolution leads to enhancement of the MRR and also contributes to decoration of the machined surface finish.

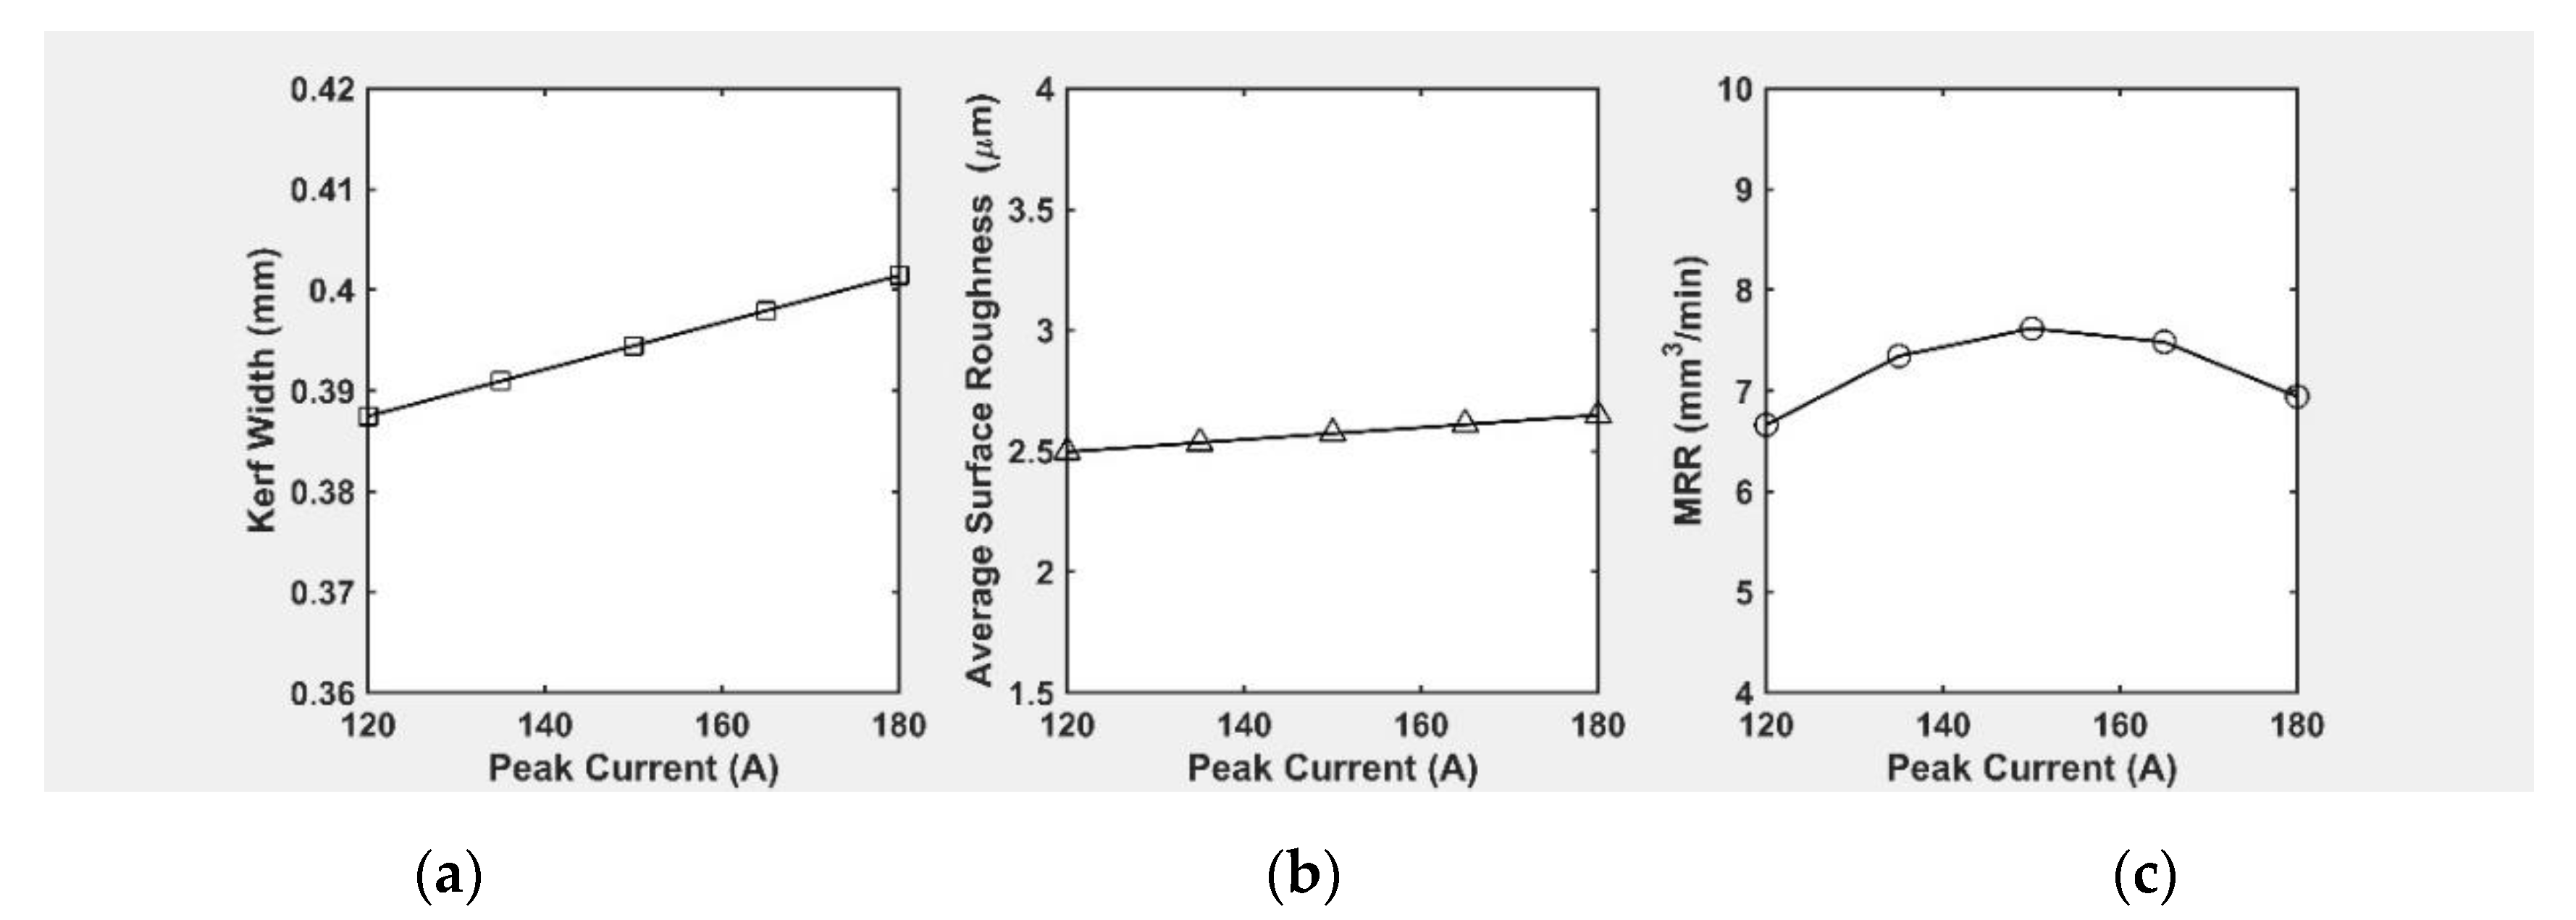
3.5.4. Effect of Peak Current

The graph plotted in Figure 7b between IP and Ra shows that the surface roughness increases from 2.4 µm to 2.7 µm with the increase in peak current value due to the increase in discharge energy. It is known that the discharge energy is proportional to the peak current [49]. At high values of peak current, continuous sparking occurs and hence MRR increases. This increase in discharge energy in turn leads to the melting of larger amounts of material and to increased kerf width, as can be seen from Figure 7a. The MRR was found to increase initially with an increase in peak current value till 150 A then tapers off.

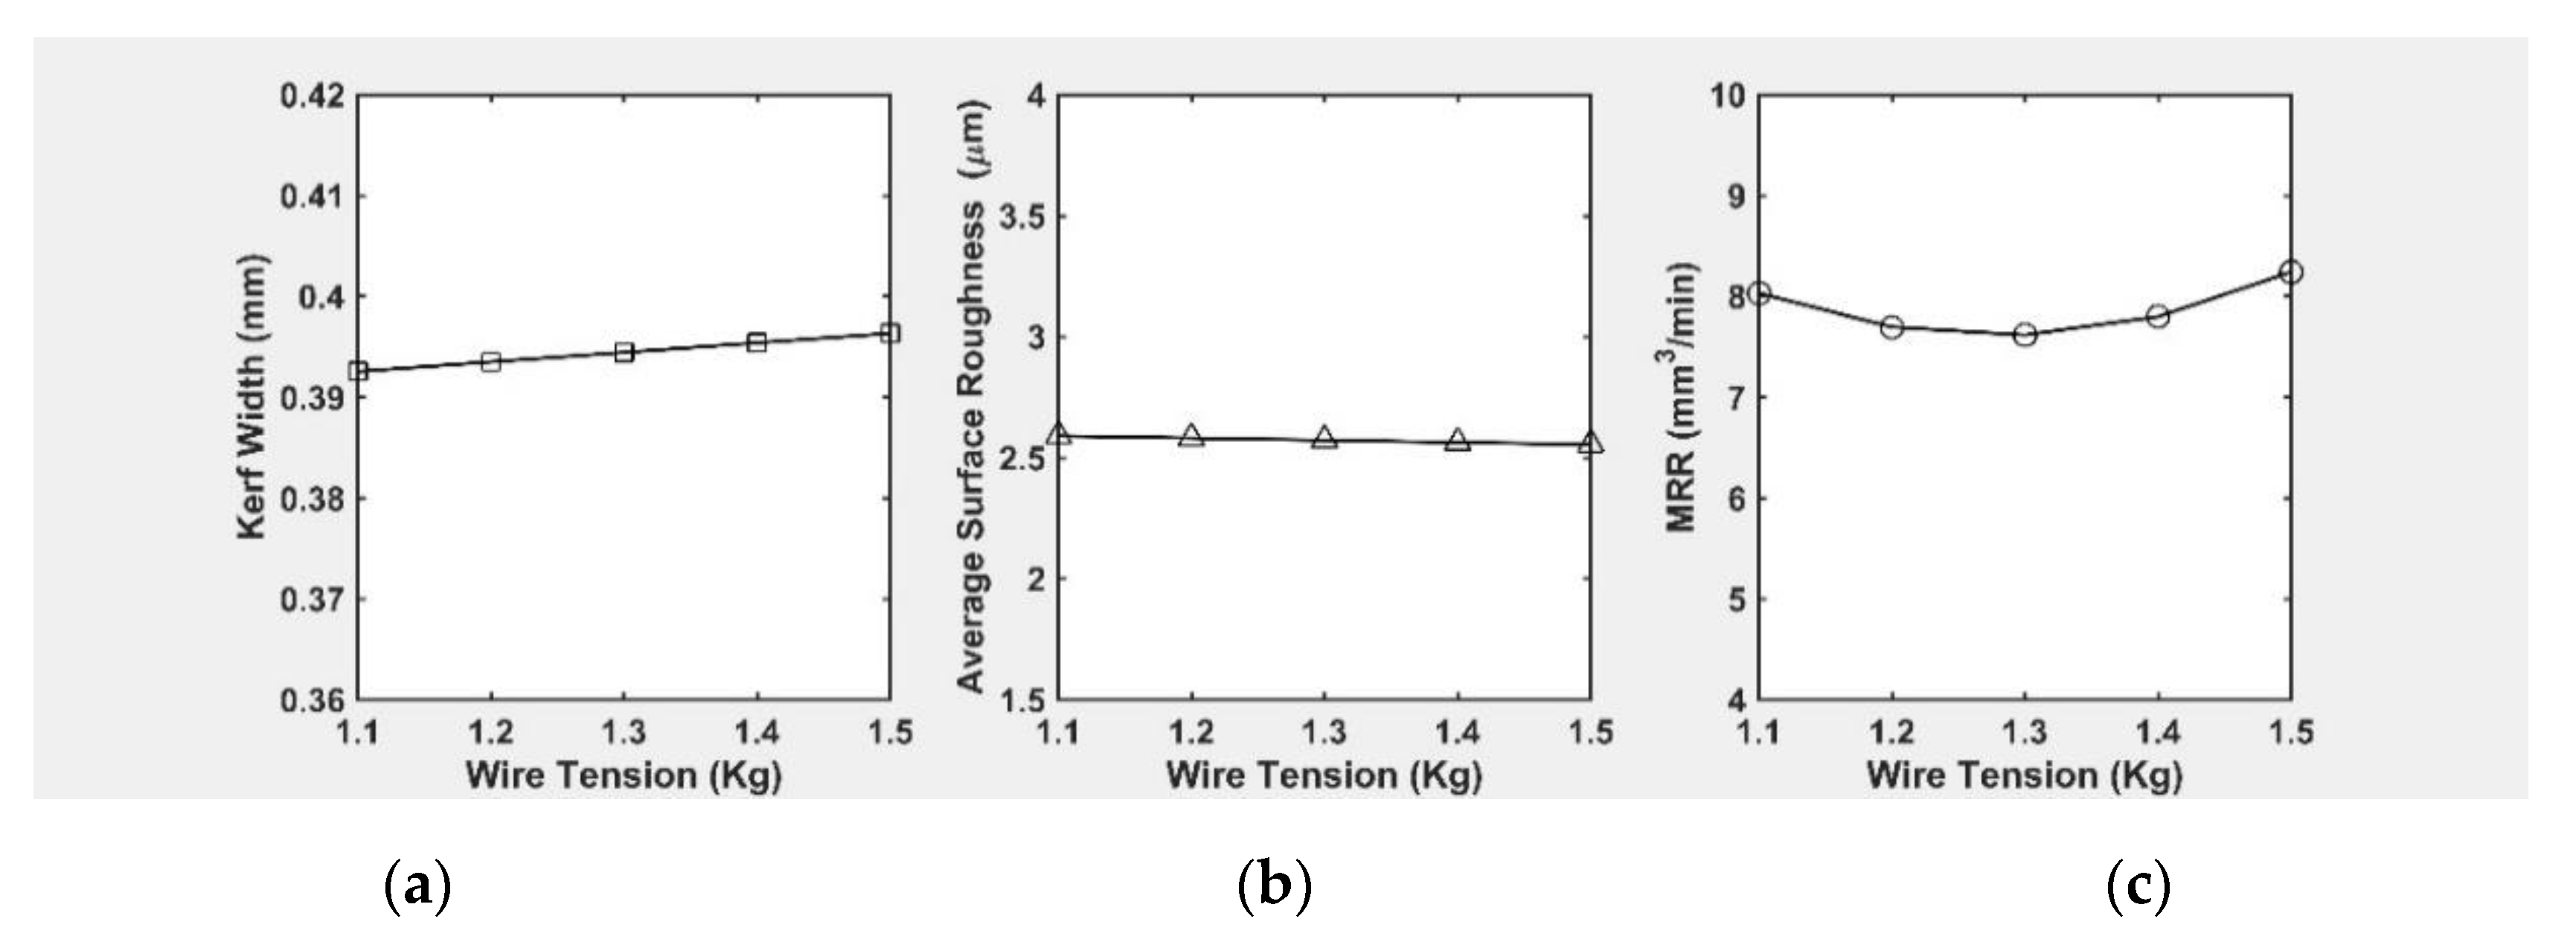
3.5.5. Effect of Wire Tension

Figure 8a shows a graph plotted between WT and Kf. It was found that wire tension has a negligible impact on kerf width. Figure 8b shows that the effect of wire tension on surface quality is even less marked than the effect on kerf width. However, increasing wire tension allows mechanical vibrations to be reduced and thus wire deflection from its straight path to be minimized. Hence, the wire electrode keeps closer to its nominal (i.e., mean) position throughout the machining process. This contributes to enhance the MRR parameter (see Figure 8c).

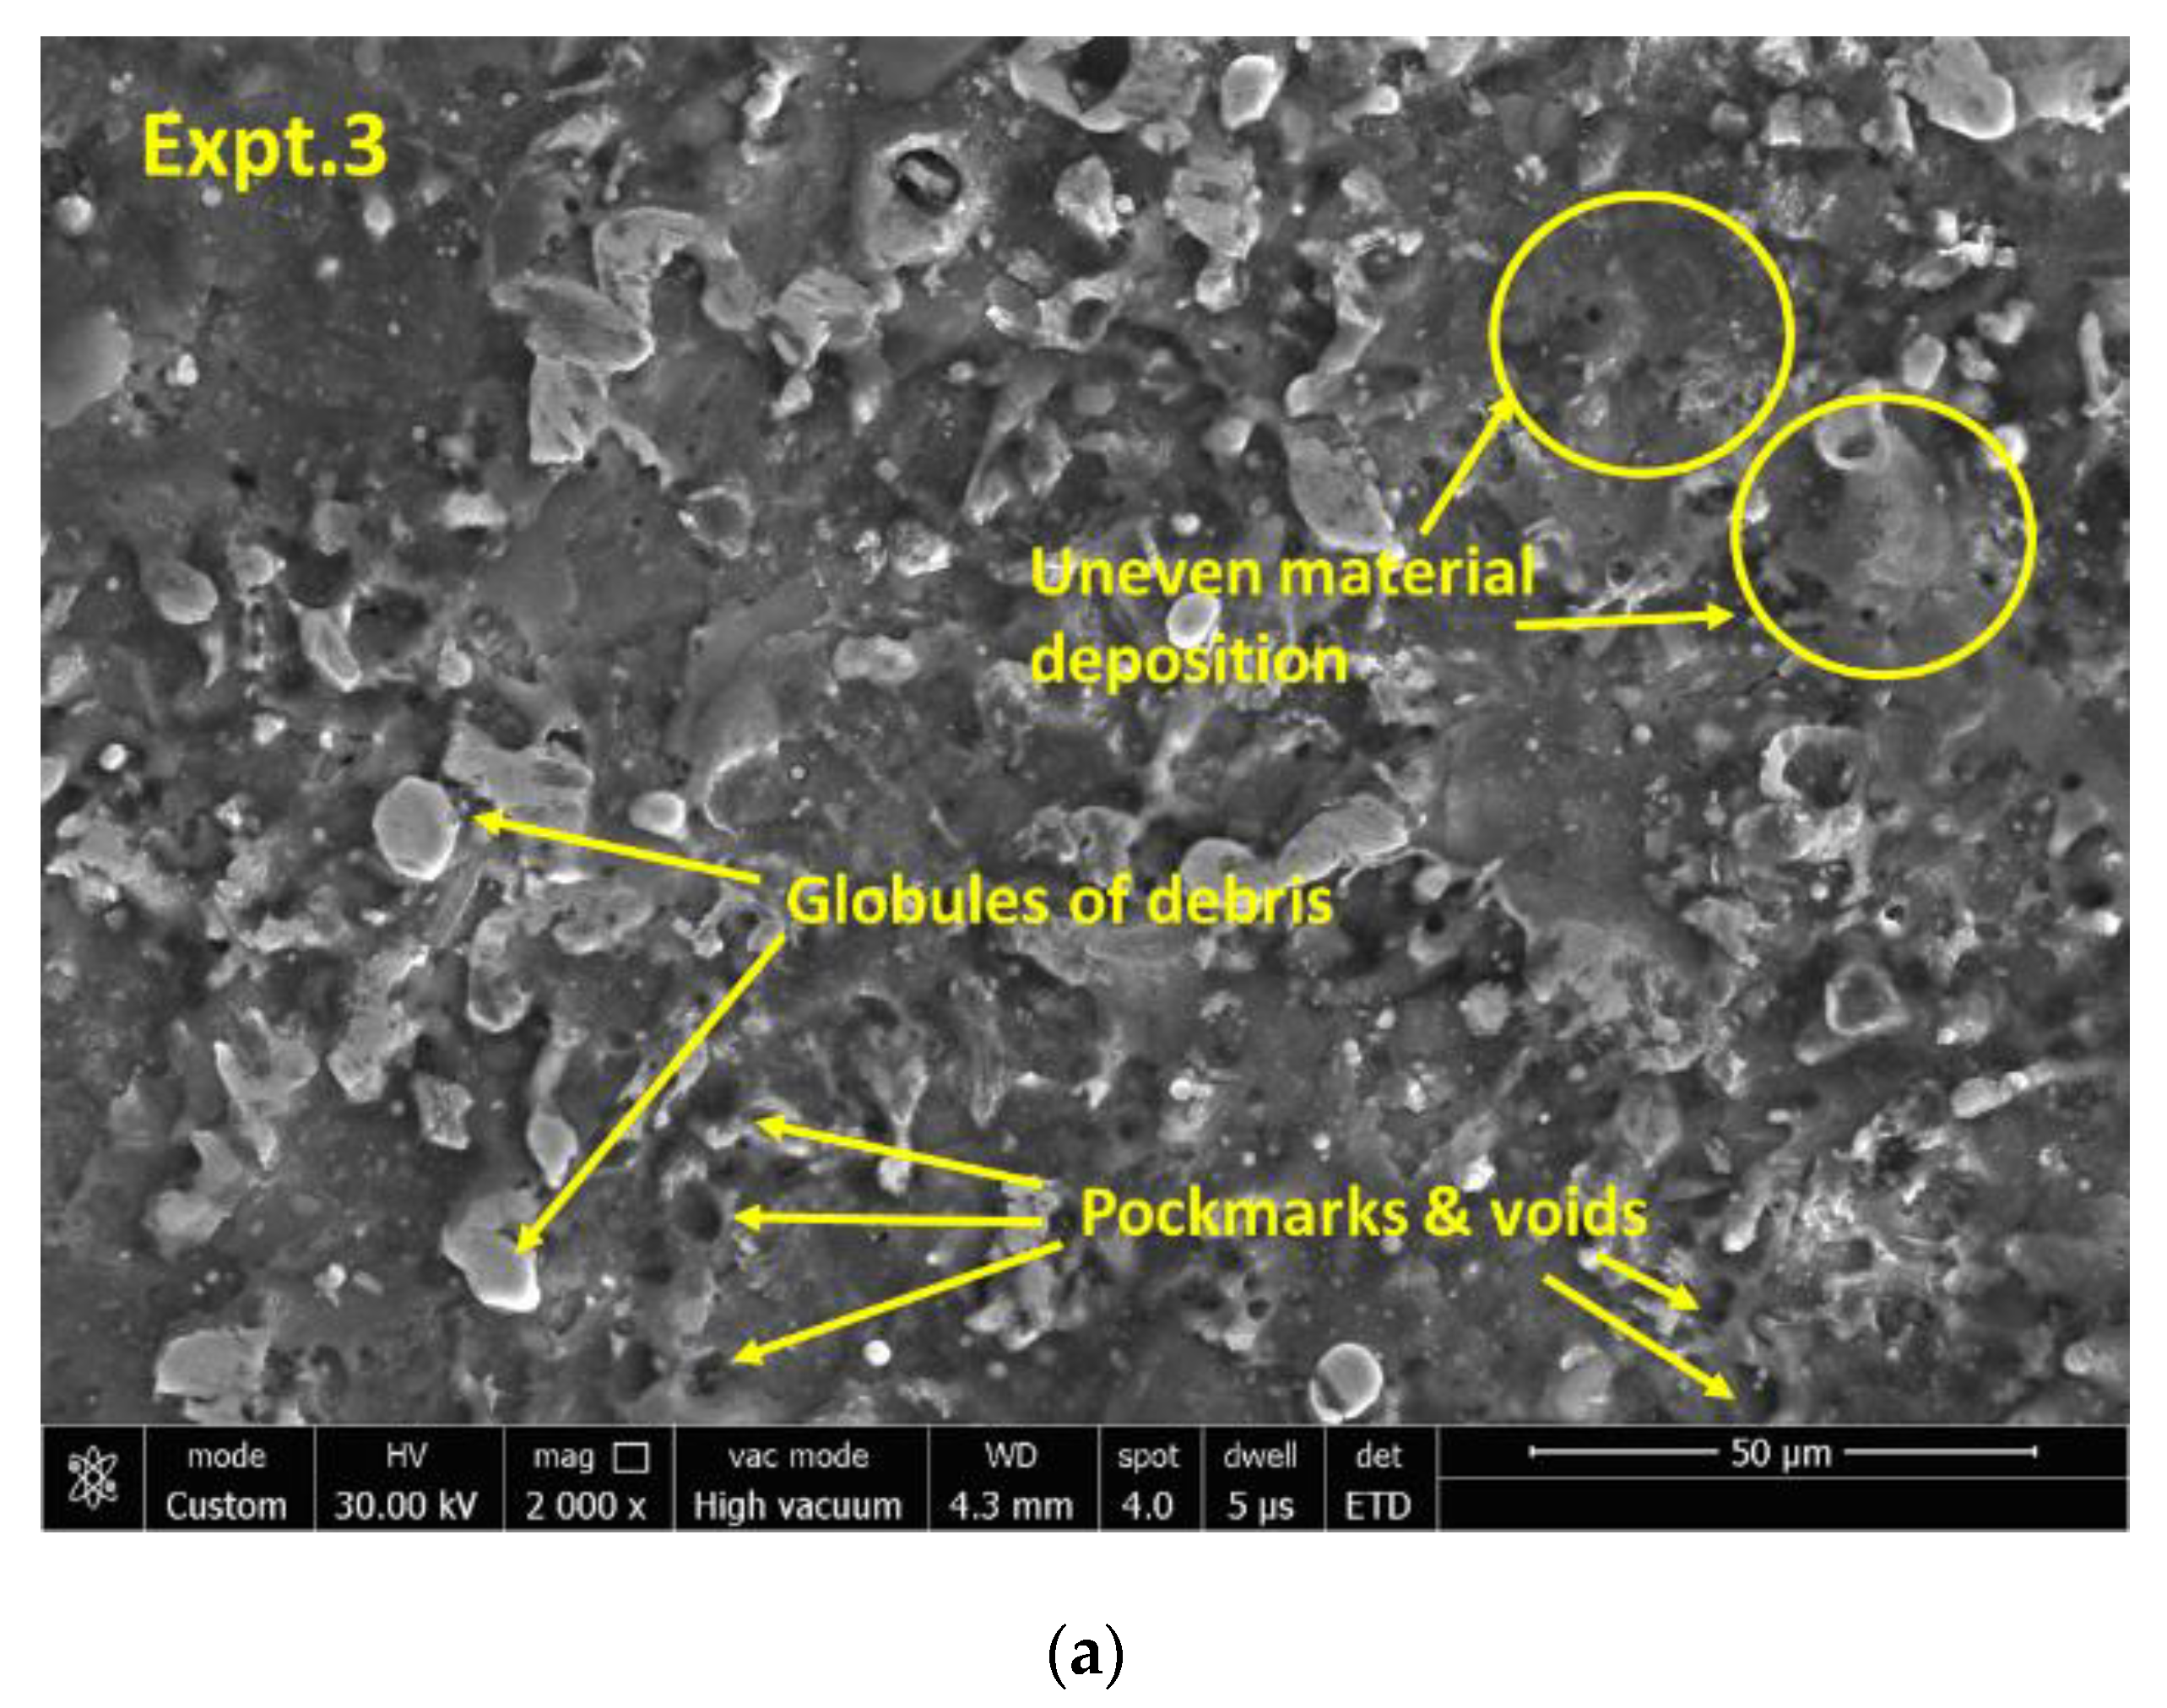
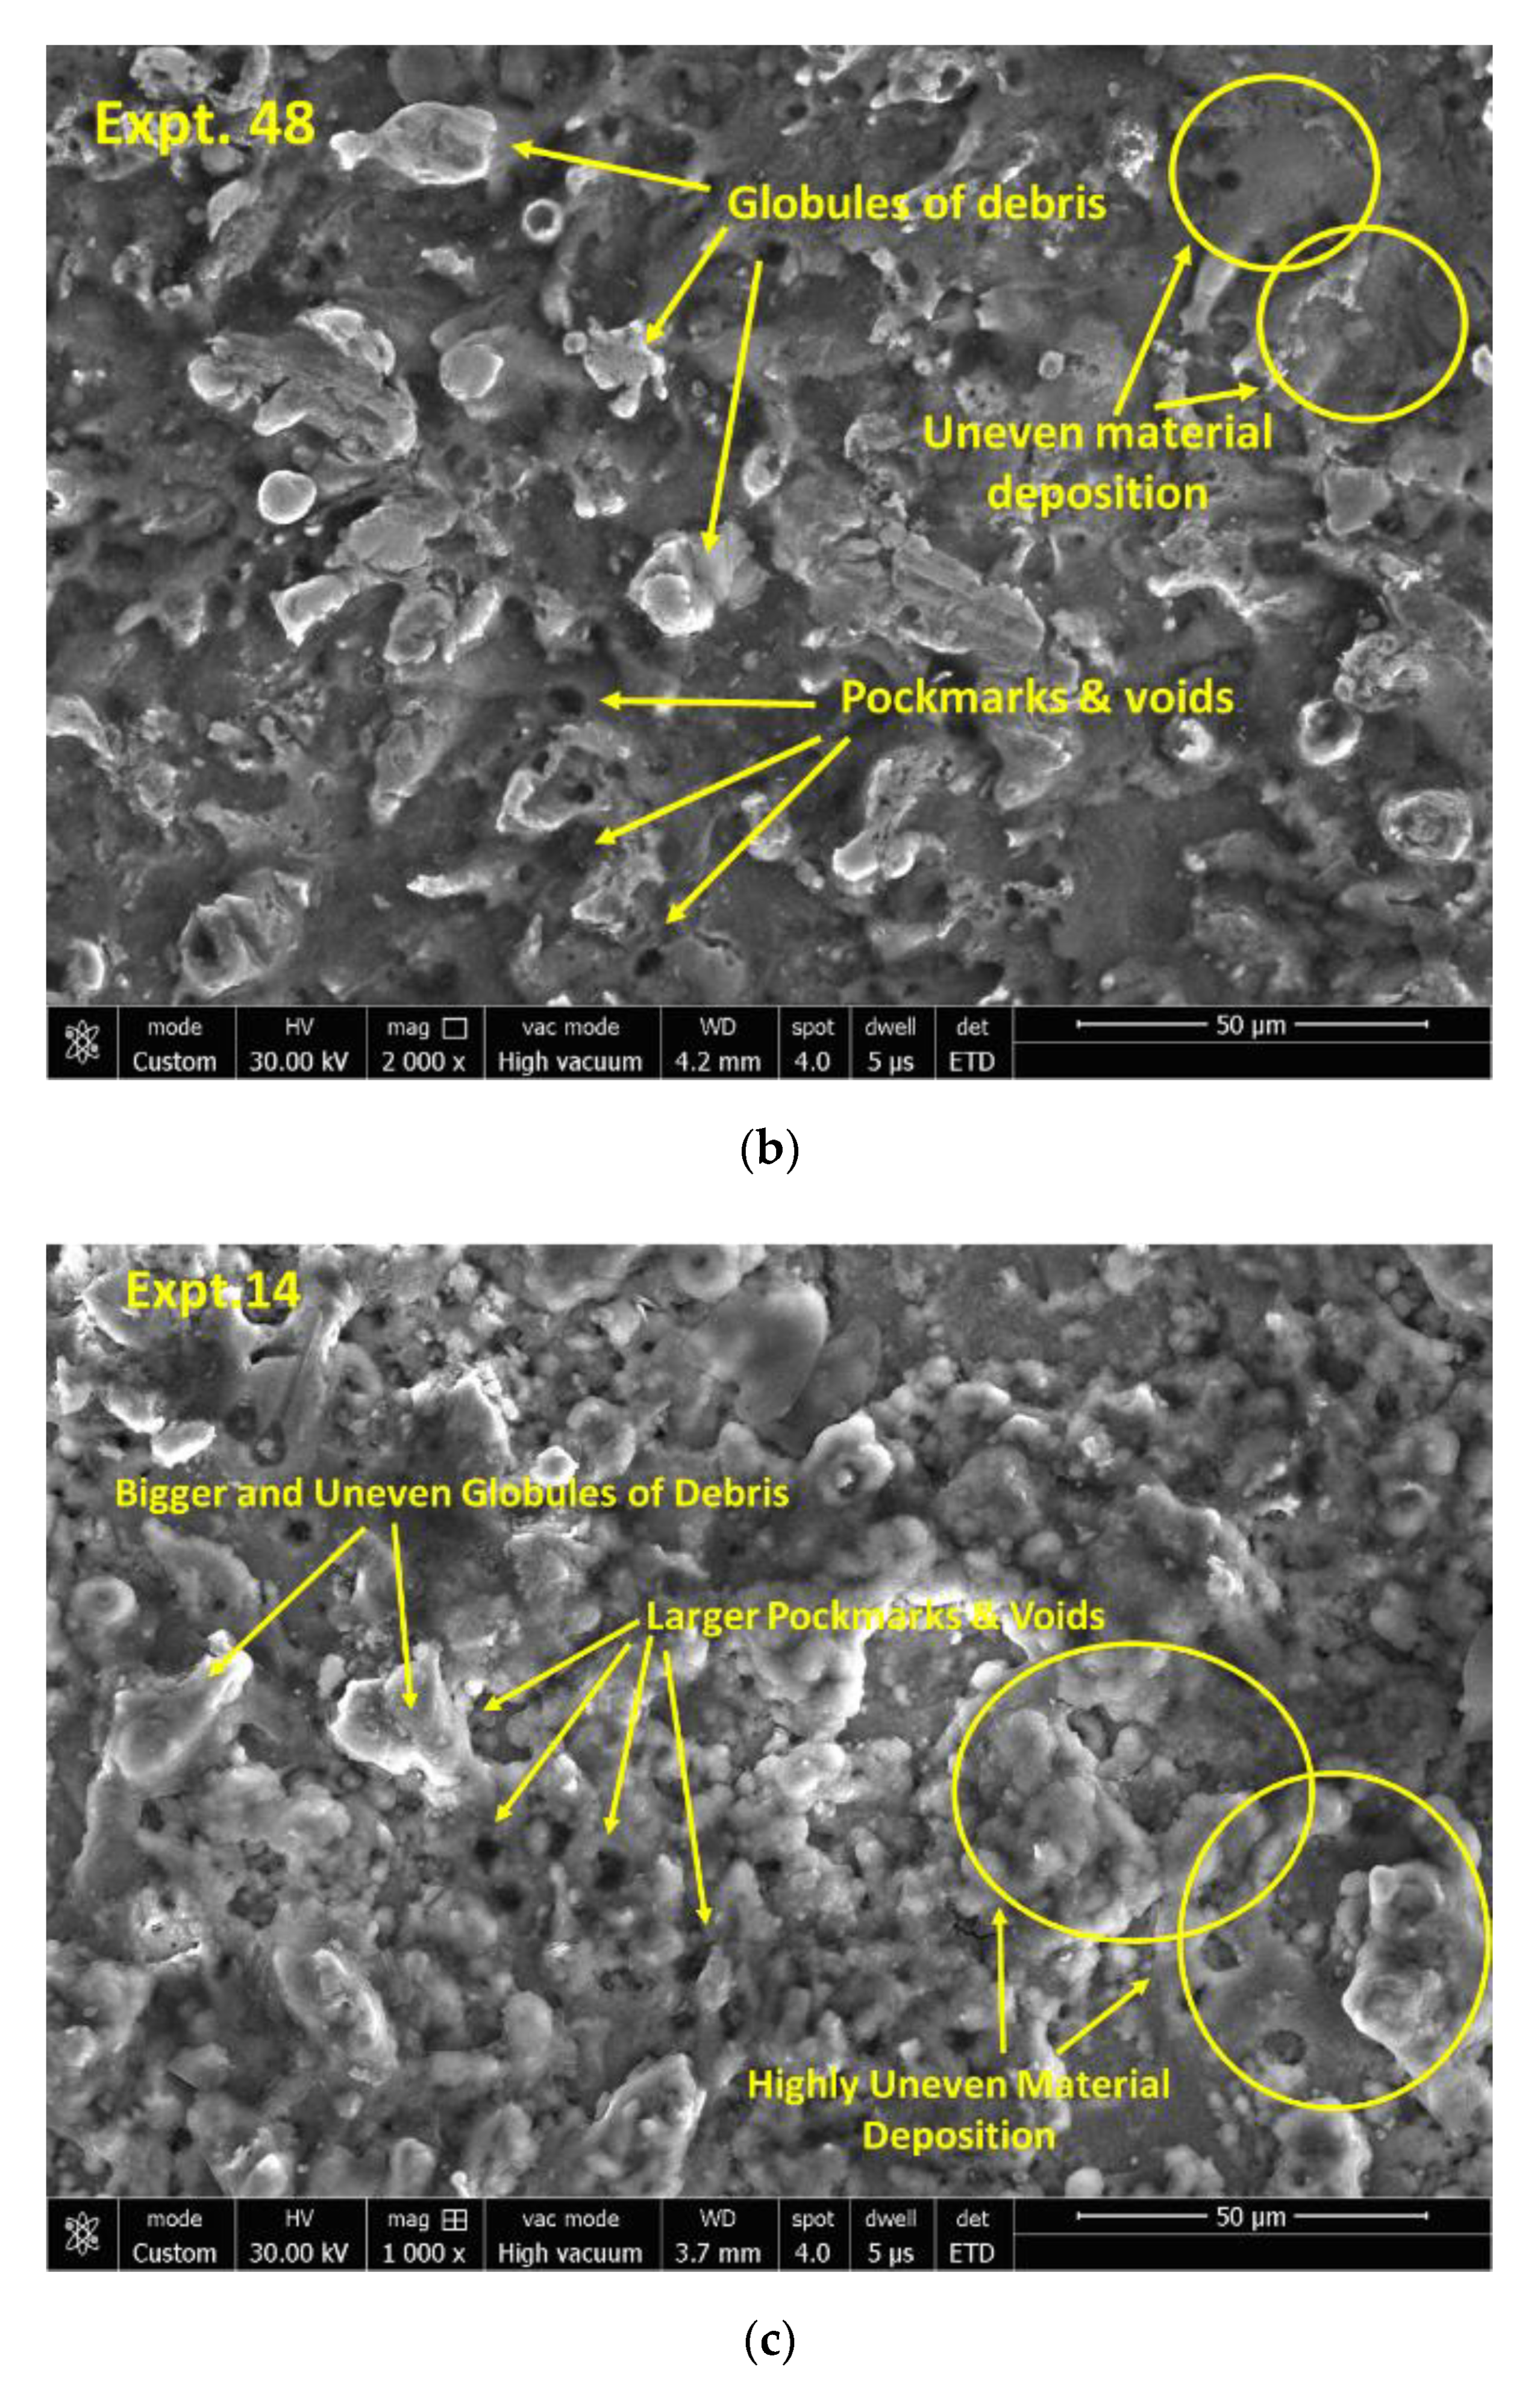
3.6. Surface Morphology of the Wed Machined Specimens

The literature reports that the discharge energy mainly produces changes in the surface texture during the WEDM process. Hence, the surface quality of specimens machined using WEDM for different parametric settings was investigated (Figure 9). The material characterization depicts an uneven material deposition, presence of pockmarks and voids, globules of debris, and white layer formation. However, no surface cracking was witnessed. These patterns of machined specimens were obtained for different settings of parameters in such a manner as to detect the effect of pulse-on-time, sparking voltage, and pulse-off-time. The selected specimens were (i) Specimen of Experiment 3 (Figure 9a); (ii) Specimen of Experiment 48 (Figure 9b) and (iii) Specimen of Experiment 14 (Figure 9c).
From Figure 9a,b, it can be observed that the increase in pulse-on-time from 100 µs to 110 µs, sparking voltage from 40 V to 50 V, and peak current from 120 to 150 A, resulted in enlargement of the size of globules of debris, bigger pockmarks and voids, and further uneven deposition of layers. Moreover, with increase in pulse-on-time, sparking voltage, and peak current, the discharge energy released per spark increases significantly. The increased discharge energy melts and vaporizes a larger amount of material from the plasma channel which helps in the formation of larger and deeper craters due to increased spark intensity [50]. A part of the melted materials is flushed away by pressurized dielectric fluid. However, the remaining molten material re-solidifies and forms globules of debris and pockmarks on the machined surface. It is suspected that the molten materials elemental composition has been altered during EDM action. Such phenomenon may occur when there is a high level of energy but not enough time to cool the surface and to remove the debris [51]. From Figure 9c, it is evident that for the largest values of pulse-on-time that is 120 µs, sparking voltage of 60 V, and peak current of 180 A, there is a significant increase in the size of globules of debris, pockmarks and voids, and further uneven deposition of layers due to increase in the thermal energy of the spark. It is evident from Figure 9a–c that a lower amount of globules, voids and pockmarks of smaller size form when the discharge energy is low. This is directly related to the crater size and amount of metal removed at low discharge energy. The size and number of globules, voids and pockmarks increase at higher discharge energy. The WEDM also attributes to modified surface layers of machined work pieces. These surface layers consist of a white layer (also known as the recast layer), heat affected zone and chemically affected zone with changes in the average chemical composition and possible phase changes. Typically, hardness of the white layer is higher than the bulk material due to the presence of oxides. However, this work did not study the influence of WEDM parameters on these surface layers of Inconel 718 and further study is required for such investigations.

3.7. NSGA-II Optimisation

The optimization problem was formulated with objectives to minimize the Kf and Ra and to maximize MRR. These goals are contradictory to each other and the function of pulse-on-time (TON), pulse-off-time (TOFF), servo-voltage (SV), peak current (IP) and wire tension (WT) were considered.
minimise   K f = f ( T on , T off , SV ,   I p ,   WT ) minimise   R a = f ( T on , T off , SV ,   I p ,   WT ) maximise   MRR = minimise   MRR = f ( T on , T off , SV ,   I p ,   WT )
Subjected to constraints:
100 < T on < 120
40 < T off < 60
40 < V < 60
120 < I p < 180
1.1 < W T < 1.5
The selected NSGA-II variables were identified on the basis of the literature and the characteristics of the current optimization problem to obtain optimal solutions with low computational effort: Maximum Number of Generations = 100, Total Population Size = 50, Mutation Probability = 0.25, Crossover Probability = 0.8. To determine the Total Population Size, sufficient optimization runs were conducted. After analyzing the results, it is found that the value of the objective functions attains its maximum value for a total population size of 50. Furthermore, it was observed that there was no appreciable change in the objective function value with further increase in total population size. Therefore, we selected a total population size of 50 for this research work. Crossover Probability for this research work is taken as 0.8, as it was observed that faster initial convergence was obtained for the value of 0.8 after testing eight different values varying from 0.1 to 0.9. The Mutation Probability needs to be kept low in order to avoid random searches, but too low a mutation probability results in a local minimum/maximum. Therefore, a mutation probability of 0.25 was selected in this study so that the genetic algorithm avoids stopping at a local minimum/maximum. Figure 10 shows the Pareto front of the results in the exploration space for the optimization results. The NSGA-II yielded 18 optimal solutions which are listed in Table 10. Furthermore, it was also observed that there was a trade-off between MRR, kerf width, and surface roughness. i.e., no solution is better than any other solution and the decision maker will have to choose from the optimum results on the basis of particular requirements.

4. Conclusions

This work aimed to establish a predictive model for the wire electrical discharge machining process for machining Inconel 718. The experiments were performed using central composite design based on RSM to analyze the effects of various input parameter on the response variables. The ANN and RSM models were established to predict the process performance. The process optimization was further verified by applying the Non-dominated Sorting Genetic Algorithm (NSGA-II). The following conclusions were drawn based on the results obtained in this work.
  • ANOVA results indicate that TON has the highest impact on the machining of Inconel 718 by the WEDM process. Here, the percentage contributions of TON on Kf, Ra, and MRR were found to be 73.07%, 90.31%, and 46.99%, respectively. With an incrase in TON, the Kf, Ra, and MRR were found to increase due to the increase of discharge energy.
  • The results of ANOVA and analysis of experimental data indicate that the RSM models for Kf, Ra, and MRR are well fitted with the experimental values having a prediction error less than ±12%.
  • A robust process model was developed on the basis of a feed-forward back propagation neural network structure with 5-13-15-3 structure with minimum prediction MSE.
  • The confirmation experiments performed for the validation of both RSM and ANN models show that ANN, owing to its better modelling ability, is superior in giving appropriate and reliable predictions of Kf, Ra, and MRR compared to that of RSM models. The lower value of MSE for ANN (1.49%) than MSE for RSM (5.71%) further validates the better fitting of the neural network.
  • The surface morphology of WEDM machined samples shows the presence of a larger size of globules of debris, bigger pockmarks and voids, and further uneven deposition of layers for high discharge energy settings.

Author Contributions

Conceptualization, V.L.; Formal analysis, P.S., V.L.; Methodology, P.S.; Writing—original draft, V.S., D.R.U.; Writing—review, & editing, C.I.P. All authors have read and agreed to the published version of the manuscript.

Funding

This research received no external funding.

Conflicts of Interest

The authors declare no conflict of interest.

References

  1. Venkatesan, K. The study on force, surface integrity, tool life and chip on laser assisted machining of inconel 718 using Nd:YAG laser source. J. Adv. Res. 2017, 8, 407–423. [Google Scholar] [CrossRef] [PubMed]
  2. Nalbant, M.; Altın, A.; Gökkaya, H. The effect of cutting speed and cutting tool geometry on machinability properties of nickel-base Inconel 718 super alloys. Mater. Des. 2007, 28, 1334–1338. [Google Scholar] [CrossRef]
  3. Chalisgaonkar, R.; Kumar, J. Multi-response optimization and modeling of trim cut WEDM operation of commercially pure titanium (CPTi) considering multiple user’s preferences. Eng. Sci. Technol. Int. J. 2015, 18, 125–134. [Google Scholar] [CrossRef] [Green Version]
  4. Sharma, N.; Khanna, R.; Gupta, R.D. WEDM process variables investigation for HSLA by response surface methodology and genetic algorithm. Eng. Sci. Technol. Int. J. 2015, 18, 171–177. [Google Scholar] [CrossRef] [Green Version]
  5. Najafi, F.T. The computer in the construction industry. Comput. Struct. 1991, 41, 1125–1132. [Google Scholar] [CrossRef]
  6. Tilekar, S.; Das, S.S.; Patowari, P.K. Process Parameter Optimization of Wire EDM on Aluminum and Mild Steel by Using Taguchi Method. Procedia Mater. Sci. 2014, 5, 2577–2584. [Google Scholar] [CrossRef]
  7. Tosun, N.; Cogun, C.; Tosun, G. A study on kerf and material removal rate in wire electrical discharge machining based on Taguchi method. J. Mater. Process. Technol. 2004, 152, 316–322. [Google Scholar] [CrossRef]
  8. Hewidy, M.S.; El-Taweel, T.A.; El-Safty, M.F. Modelling the machining parameters of wire electrical discharge machining of Inconel 601 using RSM. J. Mater. Process. Technol. 2005, 169, 328–336. [Google Scholar] [CrossRef]
  9. Mahapatra, S.S.; Patnaik, A. Optimization of wire electrical discharge machining (WEDM) process parameters using Taguchi method. Int. J. Adv. Manuf. Technol. 2006, 34, 911–925. [Google Scholar] [CrossRef]
  10. Kumar, K.; Agarwal, S. Multi-objective parametric optimization on machining with wire electric discharge machining. Int. J. Adv. Manuf. Technol. 2011, 62, 617–633. [Google Scholar] [CrossRef]
  11. Sarkar, S.; Mitra, S.; Bhattacharyya, B. Parametric analysis and optimization of wire electrical discharge machining of γ-titanium aluminide alloy. J. Mater. Process. Technol. 2005, 159, 286–294. [Google Scholar] [CrossRef]
  12. Kuriakose, S.; Mohan, K.; Shunmugam, M.S. Data mining applied to wire-EDM process. J. Mater. Process. Technol. 2003, 142, 182–189. [Google Scholar] [CrossRef]
  13. Manna, A.; Bhattacharyya, B. Taguchi and Gauss elimination method: A dual response approach for parametric optimization of CNC wire cut EDM of PRAlSiCMMC. Int. J. Adv. Manuf. Technol. 2005, 28, 67–75. [Google Scholar] [CrossRef]
  14. Bobbili, R.; Madhu, V.; Gogia, A.K. Modelling and analysis of material removal rate and surface roughness in wire-cut EDM of armour materials. Eng. Sci. Technol. Int. J. 2015, 18, 664–668. [Google Scholar] [CrossRef] [Green Version]
  15. Patil, N.G.; Brahmankar, P.K. Some studies into wire electro-discharge machining of alumina particulate-reinforced aluminum matrix composites. Int. J. Adv. Manuf. Technol. 2009, 48, 537–555. [Google Scholar] [CrossRef]
  16. Yadav, R.N.; Yadava, V. Multiobjective optimization of slotted electrical discharge abrasive grinding of metal matrix composite using artificial neural network and nondominated sorting genetic algorithm. Proc. Inst. Mech. Eng. Part B: J. Eng. Manuf. 2013, 227, 1442–1452. [Google Scholar] [CrossRef]
  17. Samanta, B.; Erevelles, W.; Omurtag, Y. Prediction of workpiece surface roughness using soft computing. Proc. Inst. Mech. Eng. Part B: J. Eng. Manuf. 2008, 222, 1221–1232. [Google Scholar] [CrossRef]
  18. Biswas, R.; Kuar, A.S.; Biswas, S.K.; Mitra, S. Artificial neural network modelling of Nd:YAG laser microdrilling on titanium nitride—Alumina composite. Proc. Inst. Mech. Eng. Part B: J. Eng. Manuf. 2009, 224, 473–482. [Google Scholar] [CrossRef]
  19. Ramakrishnan, R.; Karunamoorthy, L. Modeling and multi-response optimization of Inconel 718 on machining of CNC WEDM process. J. Mater. Process. Technol. 2008, 207, 343–349. [Google Scholar] [CrossRef]
  20. Saha, P.; Singha, A.; Pal, S.K.; Saha, P. Soft computing models based prediction of cutting speed and surface roughness in wire electro-discharge machining of tungsten carbide cobalt composite. Int. J. Adv. Manuf. Technol. 2007, 39, 74–84. [Google Scholar] [CrossRef]
  21. Khan, I.A.; Rajput, T.S. Modeling of wire electrical discharge machining of alloy steel (HCHCr). Int. J. Precis. Eng. Manuf. 2012, 13, 1989–1995. [Google Scholar] [CrossRef]
  22. Shandilya, P.; Jain, P.K.; Jain, N.K. Prediction of surface roughness during wire electrical discharge machining of SiCp/6061 Al metal matrix composite. Int. J. Ind. Syst. Eng. 2012, 12. [Google Scholar] [CrossRef]
  23. Zhang, G.; Zhang, Z.; Guo, J.; Ming, W.; Li, M.; Huang, Y. Modeling and Optimization of Medium-Speed WEDM Process Parameters for Machining SKD11. Mater. Manuf. Process. 2013, 28, 1124–1132. [Google Scholar] [CrossRef]
  24. Ugrasen, G.; Ravindra, H.V.; Prakash, G.V.N.; Keshavamurthy, R. Process Optimization and Estimation of Machining Performances Using Artificial Neural Network in Wire EDM. Procedia Mater. Sci. 2014, 6, 1752–1760. [Google Scholar] [CrossRef] [Green Version]
  25. Vates, U.K.; Singh, N.K.; Singh, R.V. Modelling of Process Parameters on D2 Steel using Wire Electrical Discharge Machining with combined approach of RSM and ANN. Int. J. Sci. Eng. Res. 2014, 8, 2026–2035. [Google Scholar]
  26. Shakeri, S.; Ghassemi, A.; Hassani, M.; Hajian, A. Investigation of material removal rate and surface roughness in wire electrical discharge machining process for cementation alloy steel using artificial neural network. Int. J. Adv. Manuf. Technol. 2015, 82, 549–557. [Google Scholar] [CrossRef]
  27. Jafari, R.; Kahya, M.; Oliaei, S.N.B.; Ünver, H.Ö.; Özyurt, T.O. Modeling and analysis of surface roughness of microchannels produced by μ-WEDM using an ANN and Taguchi method. J. Mech. Sci. Technol. 2017, 31, 5447–5457. [Google Scholar] [CrossRef]
  28. Singh, B.; Misra, J.P. Surface finish analysis of wire electric discharge machined specimens by RSM and ANN modeling. Measurement 2019, 137, 225–237. [Google Scholar] [CrossRef]
  29. Mukhopadhyay, A.; Barman, T.; Sahoo, P.; Davim, J. Modeling and Optimization of Fractal Dimension in Wire Electrical Discharge Machining of EN 31 Steel Using the ANN-GA Approach. Materials 2019, 12, 454. [Google Scholar] [CrossRef] [Green Version]
  30. Khan, M.A.R.; Rahman, M.M.; Kadirgama, K. An experimental investigation on surface finish in die-sinking EDM of Ti-5Al-2.5Sn. Int. J. Adv. Manuf. Technol. 2015, 77, 1727–1740. [Google Scholar] [CrossRef]
  31. Chaudhary, T.; Siddiquee, A.N.; Chanda, A.K. Effect of wire tension on different output responses during wire electric discharge machining on AISI 304 stainless steel. Def. Technol. 2019, 15, 541–544. [Google Scholar] [CrossRef]
  32. Unune, D.R.; Mali, H.S. Artificial neural network–based and response surface methodology–based predictive models for material removal rate and surface roughness during electro-discharge diamond grinding of Inconel 718. Proc. Inst. Mech. Eng. Part B: J. Eng. Manuf. 2016, 230, 2082–2091. [Google Scholar] [CrossRef]
  33. Mazaheri, H.; Ghaedi, M.; Ahmadi Azqhandi, M.H.; Asfaram, A. Application of machine/statistical learning, artificial intelligence and statistical experimental design for the modeling and optimization of methylene blue and Cd(ii) removal from a binary aqueous solution by natural walnut carbon. Phys. Chem. Chem. Phys. 2017, 19, 11299–11317. [Google Scholar] [CrossRef] [PubMed]
  34. Ranganathan, S.; Senthilvelan, T.; Sriram, G. Evaluation of Machining Parameters of Hot Turning of Stainless Steel (Type 316) by Applying ANN and RSM. Mater. Manuf. Process. 2010, 25, 1131–1141. [Google Scholar] [CrossRef]
  35. Zopf, C.; Kaliske, M. Numerical characterisation of uncured elastomers by a neural network based approach. Comput. Struct. 2017, 182, 504–525. [Google Scholar] [CrossRef]
  36. Pradhan, B.B.; Bhattacharyya, B. Modelling of micro-electrodischarge machining during machining of titanium alloy Ti-6Al-4V using response surface methodology and artificial neural network algorithm. Proc. Inst. Mech. Eng. Part B: J. Eng. Manuf. 2009, 223, 683–693. [Google Scholar] [CrossRef]
  37. Chokshi, P.; Dashwood, R.; Hughes, D.J. Artificial Neural Network (ANN) based microstructural prediction model for 22MnB5 boron steel during tailored hot stamping. Comput. Struct. 2017, 190, 162–172. [Google Scholar] [CrossRef] [Green Version]
  38. Unune, D.R.; Nirala, C.K.; Mali, H.S. ANN-NSGA-II dual approach for modeling and optimization in abrasive mixed electro discharge diamond grinding of Monel K-500. Eng. Sci. Technol. Int. J. 2018, 21, 322–329. [Google Scholar] [CrossRef]
  39. Deb, K.; Pratap, A.; Agarwal, S.; Meyarivan, T. A fast and elitist multiobjective genetic algorithm: NSGA-II. Ieee Trans. Evol. Comput. 2002, 6, 182–197. [Google Scholar] [CrossRef] [Green Version]
  40. Niu, X.; Wang, H.; Hu, S.; Yang, C.; Wang, Y. Multi-objective online optimization of a marine diesel engine using NSGA-II coupled with enhancing trained support vector machine. Appl. Therm. Eng. 2018, 137, 218–227. [Google Scholar] [CrossRef]
  41. Unune, D.R.; Mali, H.S. Parametric modeling and optimization for abrasive mixed surface electro discharge diamond grinding of Inconel 718 using response surface methodology. Int. J. Adv. Manuf. Technol. 2017, 93, 3859–3872. [Google Scholar] [CrossRef]
  42. Dabade, U.A.; Karidkar, S.S. Analysis of Response Variables in WEDM of Inconel 718 Using Taguchi Technique. Procedia Cirp 2016, 41, 886–891. [Google Scholar] [CrossRef] [Green Version]
  43. Youssefi, S.; Emam-Djomeh, Z.; Mousavi, S.M. Comparison of Artificial Neural Network (ANN) and Response Surface Methodology (RSM) in the Prediction of Quality Parameters of Spray-Dried Pomegranate Juice. Dry. Technol. 2009, 27, 910–917. [Google Scholar] [CrossRef]
  44. Singh, V.; Bhandari, R.; Yadav, V.K. An experimental investigation on machining parameters of AISI D2 steel using WEDM. Int. J. Adv. Manuf. Technol. 2017, 93, 203–214. [Google Scholar] [CrossRef]
  45. Raju, P.; Sarcar, M.M.M.; Satyanarayana, B. Optimization of Wire Electric Discharge Machining Parameters for Surface Roughness on 316 L Stainless Steel Using Full Factorial Experimental Design. Procedia Mater. Sci. 2014, 5, 1670–1676. [Google Scholar] [CrossRef] [Green Version]
  46. Vijayabhaskar, S.; Rajmohan, T. Experimental Investigation and Optimization of Machining Parameters in WEDM of Nano-SiC Particles Reinforced Magnesium Matrix Composites. Silicon 2018. [Google Scholar] [CrossRef]
  47. Kumar, H.; Manna, A.; Kumar, R. Modeling of Process Parameters for Surface Roughness and Analysis of Machined Surface in WEDM of Al/SiC-MMC. Trans. Indian Inst. Met. 2018, 71, 231–244. [Google Scholar] [CrossRef]
  48. Kung, K.-Y.; Chiang, K.-T. Modeling and Analysis of Machinability Evaluation in the Wire Electrical Discharge Machining (WEDM) Process of Aluminum Oxide-Based Ceramic. Mater. Manuf. Process. 2008, 23, 241–250. [Google Scholar] [CrossRef]
  49. Sreenivasa Rao, M.; Venkaiah, N. Experimental investigations on surface integrity issues of Inconel-690 during wire-cut electrical discharge machining process. Proc. Inst. Mech. Eng. Part B: J. Eng. Manuf. 2016, 232, 731–741. [Google Scholar] [CrossRef]
  50. Unune, D.R.; Mali, H.S. Experimental investigation on low-frequency vibration-assisted µ-ED milling of Inconel 718. Mater. Manuf. Process. 2018, 33, 964–976. [Google Scholar] [CrossRef]
  51. Torres, A.; Puertas, I.; Luis, C.J. Modelling of surface finish, electrode wear and material removal rate in electrical discharge machining of hard-to-machine alloys. Precis. Eng. 2015, 40, 33–45. [Google Scholar] [CrossRef]
Figure 1. Schematic diagram of the wire electrode discharge machining (WEDM).
Jmmp 04 00044 g001
Figure 2. Kerf width measurement using an optical microscope.
Jmmp 04 00044 g002
Figure 3. Artificial Neural Network architecture (5-N1-N2-3).
Jmmp 04 00044 g003
Figure 4. Effects of pulse-on-time (TON) on (a) kerf width, (b) surface roughness and (c) MRR.
Jmmp 04 00044 g004
Figure 5. Effects of pulse-off-time (TOFF) on (a) kerf width, (b) surface roughness and (c) MRR.
Jmmp 04 00044 g005
Figure 6. Effects of servo-voltage (SV) on (a) kerf width, (b) surface roughness, and (c) MRR.
Jmmp 04 00044 g006
Figure 7. Effects of peak current (IP) on (a) kerf width, (b) surface roughness, and (c) MRR.
Jmmp 04 00044 g007
Figure 8. Effects of wire tension (WT) on (a) kerf width, (b) surface roughness, and (c) MRR.
Jmmp 04 00044 g008
Figure 9. FESEM micrographs showing surface morphology of WEDM samples for different parametric settings. (a) Experiment 3: TON = 100 µs, TOFF = 60 µs, SV = 40 V, IP = 120 Amp, and WT = 1.1 kg. (b) Experiment 48: TON = 110 µs, TOFF = 50 µs, SV = 50 V, IP = 150 Amp, and WT = 1.1 kg. (c) Experiment 14: TON = 120 µs, TOFF = 40 µs, SV = 60 V, IP = 180 Amp, WT = 1.1 kg.
Jmmp 04 00044 g009aJmmp 04 00044 g009b
Figure 10. Pareto front of non-dominated solutions.
Jmmp 04 00044 g010
Table 1. Previous research on application of ANN in modelling WEDM.
Author(s)Prediction ModelTraining MethodWork PieceMachining ParametersResponse VariablesSummary
Ramakrishnan and Karunamoorthy [19]feedforward neural network-Inconel 601TON, delay time, wire feed rate, ignition currentMRR, RaTON found to be most imfluecing factor for MRR.
Saha et al. [20]feed-forward back-propagation neural network with 1-hidden layer-tungsten carbide-cobalt (WC-Co) compositeTON, TOFF, IP, capacitanceCutting speed, RaANN predicts MRR & Ra with 3.29% overall mean prediction error.
Khan and Rajput [21]feed-forward back-propagation neural network-Alloy Steel (HCHCr)TON, TOFF, IP, average gap voltage, WT, Wire feedCutting speed, RaHigher cutting speed degrades surface finish.
Shandilya and Jain [22]Back-propagation neural network with 1-hidden layer-SiCp/6061 Al metal matrix compositeTON, TOFF, voltage, wire feedSurface roughnessANN model outperforms RSM model prediction.
Zhang et al. [23]BPNN with 2-hidden layers-SKD11 steelTON, TOFF, IP, wire speed, tracking coefficientCutting speed, Ra, MRRTON, TOFF are significant factors for Ra.
Ugrasen et al. [24]BPNN with 1-hidden layerLevenberg-Marquardt-TON, pulse-off-time, IP, bed speedVMRR, accuracy, RaANN model with 70% training data gave best prediction as that of model with 50% or 60% training data.
Vates et al. [25]ANN with 1-hidden layer-D2 Steelgap voltage, flush rate, TON, TOFF, wire feed, and WTRa, MRRBest surface finish achieved at lower MRR values.
Shakeri et al. [26]Feedforward backpropagation neural networkLevenberg-Marquardtcementation alloy steelwire speed, servo speed, frequency, IPRa, MRRANN model outperformed Regression models prediction.
Jafari et al. [27]ANN with 1-hidden layerBayesian regularizationCopperTON, TOFF, IP, spark gap voltage, wire speedRaIP had most significant effect of Ra followed by TON.
Singh and Mishra [28]BPNN with 1-hidden layerLevenberg-MarquardtNimonic 263TON, TOFF, IP, spark gap voltageRa, recast layer thickness
Mukhopadhyay et al. [29]feedforward neural networkLevenberg-MarquardtEN 31 tool steelDischarge current, SV, TON, TOFFfractal dimension
Table 2. Chemical composition of our work piece material (Inconel 718).
ComponentNiCSiMnPCrFeMo
Weight %55.4000.0300.0800.0400.0123.8003.7013.30
ComponentVNbWCoTiAlZr
Weight %00.0902.7800.2600.2600.8100.1900.08
Table 3. Independent control factors, and their levels.
Input ParameterSymbolUnitLevel
−101
pulse-on-timeTONµs100110120
pulse-off-timeTOFFµs405060
servo-voltageSVV405060
peak currentIPA120150180
wire tensionWTkg1.11.31.5
Table 4. Experimental plan with chosen input machining parameters and measured response variables.
S. No.Input Machining ParametersResponse Variables
Pulse on Time (µs)Pulse off Time (µs)Servo Voltage (V)Peak current (A)Wire Tension (kg)Kerf Width (mm)Average Surface Roughness (µm)MRR (mm3/min)
112040601201.10.4023.7110.53
210040401801.10.3821.7105.28
310060401201.10.3501.5202.39
412060601201.10.3853.7709.04
511040501501.30.3991.5108.34
612060601201.50.4043.5808.18
712050501501.30.4163.5108.19
810040401201.10.3561.7504.64
912060401801.50.4043.8105.85
1011050501501.50.3952.8607.91
1110040601201.50.3691.2706.53
1212060401201.50.4113.3805.58
1312060401201.10.3913.5505.38
1412040601801.10.4333.0910.22
1510060601801.10.3611.7405.14
1611050501201.30.3862.2706.68
1710050501501.30.3651.6104.19
1812040601201.50.4332.8710.36
1912040401201.10.3973.3507.38
2011050501501.30.3922.6007.96
2111050501501.30.3782.5207.54
2210060601201.10.3501.7004.91
2310060601201.50.3371.5104.78
2412040401801.50.4113.5107.78
2510040401201.50.3661.5504.94
2610040601201.10.3491.4806.36
2712040601801.50.4263.3010.80
2812060601801.50.4074.0008.85
2910060401801.10.3681.5403.47
3010060401201.50.3601.3202.69
3111050501501.30.3922.5907.35
3212060601801.10.4143.8008.95
3311050501801.30.4022.4907.33
3410040601801.10.3811.5305.19
3510060601801.50.3591.9105.64
3611050501501.30.3912.5907.44
3711050501501.30.3852.9107.96
3811060501501.30.3872.2806.41
3911050501501.30.3922.6407.41
4010040601801.50.3661.9106.79
4110040401801.50.3701.2005.38
4212040401201.50.4073.1407.33
4311050501501.30.4022.5907.16
4411050601501.30.3943.0008.92
4512040401801.10.4193.3607.18
4611050501501.30.3922.5607.40
4712060401801.10.4103.6904.82
4811050501501.10.3922.1508.77
4910060401801.50.3781.7103.83
5011050401501.30.4203.5108.26
Table 5. Results of ANOVA analysis for the kerf width (Kf).
SourceSum of SquareDegree of freedomMean SquareF Valuep-Value Prob > F Percentage Contribution
Model0.024092.655 × 10−3053.32<0.0001significant
A-Pulse-on-time0.019010.019379.94<0.0001 73.07%
B-Pulse-off-time1.055 × 10−4011.055 × 10−3021.20<0.0001 00.40%
C-Servo Voltage2.375 × 10−5012.375 × 10−5000.480.4938 00.09%
D-Peak Current1.657 × 10−3011.657 × 10−3033.28<0.0001 06.37%
E-Wire Tension1.210 × 10−4011.210 × 10−4002.430.1269 00.46%
AC3.890 × 10−4013.890 × 10−4007.810.0079 01.49%
BC3.696 × 10−4013.696 × 10−4007.420.0095 01.42%
DE7.443 × 10−4017.443 × 10−4014.950.0004 02.86%
A26.137 × 10−4016.137 × 10−4012.330.0011 02.36%
Residual1.992 × 10−3404.979 × 10−5
Lack of Fit1.654 × 10−3335.014 × 10−5001.040.5246not significant
Pure Error3.371 × 10−4074.816 × 10−5
Cor Total0.02649
  σ 7.056 × 10⁻³R200.923
Mean0.39Adjusted R200.905
C.V. %1.81Predicted R200.884
PS2.986 × 10−3Adequacy Precision30.326
Table 6. Results of ANOVA analysis for the surface roughness (Ra).
SourceSum of SquareDegree of FreedomMean SquareF Valuep-Value Prob > F Percentage Contribution
Model34.271003.43090.04<0.0001Significant
A-Pulse-on-time30.950130.95813.04<0.0001 90.31%
B-Pulse-off-time00.610100.61016.130.0003 01.77%
C-Servo Voltage8.768 × 10−3018.768 × 10−3000.230.6339 00.02%
D-Peak Current00.190100.19005.080.0300 00.55%
E-Wire Tension00.010100.01000.280.5967 00.03%
AB00.230100.23005.940.0195 00.67%
BC00.110100.11002.920.0954 00.32%
DE00.300100.30007.890.0077 00.87%
B201.750101.75045.97<0.0001 05.10%
C201.620101.62042.51<0.0001 04.67%
Residual01.483900.03
Lack of Fit01.393200.04003.110.0613not significant
Cor Total35.7649
σ 0.20R200.958
Mean2.55Adjusted R200.947
C.V. %7.64Predicted R200.929
(PS)2.52Adequacy Precision28.842
Table 7. Results of ANOVA analysis for the material removal rate (MRR).
SourceSum of SquareDegree of FreedomMean SquareF Valuep-Value Prob > F Percentage Contribution
Model184.381215.37080.17<0.0001significant
A-Pulse-on-time086.650186.65452.11<0.0001 46.99%
B-Pulse-off-time024.940124.94130.11<0.0001 13.52%
C-Servo Voltage044.770144.77233.57<0.0001 24.28%
D-Peak Current000.680100.68003.540.0678 00.36%
E-Wire Tension000.370100.37001.920.1740 00.20%
AC005.200105.20027.13<0.0001 02.82%
BC000.660100.66003.460.0707 00.35%
DE000.760100.76003.950.0544 00.01%
A2006.980106.98036.41<0.0001 03.78%
C2001.550101.55008.070.0073 00.84%
D2001.750101.75009.130.0046 00.94%
E2000.710100.71003.680.0628 00.38%
Residual007.093700.19
Lack of Fit006.513000.22002.620.0939not significant
Pure Error000.580700.08
Cor Total191.4849
σ 00.44R200.963
Mean06.83Adjusted R200.951
C.V. %06.41Predicted R200.914
PS16.36Adequacy Precision34.899
Table 8. ANN architecture performance while varying the number of neurons.
For hidden Layer = 1For Hidden Layer = 2
No. of NeuronsMSENo. of Neurons in the 1st LayerNo. of Neurons in the 2nd LayerMSE
11.1036451310.986389
20.3375751321.619909
30.2196541330.401487
40.1463871340.154014
50.1245941350.270056
60.1504871360.070328
70.1456201370.138533
80.0776981380.445419
90.0496781391.158510
100.08855013100.150517
110.09063013110.328056
122.44805013120.081355
130.04743813120.191720
140.15583413140.203620
154.10033113150.014916
Table 9. Comparison of predicted WEDM output parameters by RSM and ANN with experimental results, including absolute and percent errors.
S. No.Input ParametersResponse VariablesPredicted ValuesAbsolute ErrorPercentage Error
RSMANNRSMANNRSMANN
TONTOFFVIPTKfRaMRRKfRaMRRKfRaMRRKfRaMRRKfRaMRRKfRaMRRKfRaMRR
110050601501.30.3382.125.500.3592.305.900.3432.175.600.0200.1800.3990.0040.0510.1046.08.47.21.42.41.8
211050401801.10.3782.976.330.4053.216.820.3833.036.430.0260.2410.4890.0040.0560.1057.18.17.71.21.81.6
312040401501.50.3813.067.820.4113.308.420.3863.127.940.0300.2400.5970.0050.0590.1237.97.87.61.31.91.5
410540501201.30.3491.135.830.3791.236.300.3591.165.970.0300.0960.4770.0090.0230.1468.68.48.12.82.12.5
511060601401.50.3552.478.570.3852.679.250.3622.528.730.0290.2010.6820.0060.0430.1658.38.17.91.91.71.9
612060501801.40.3682.865.730.4103.166.300.3802.965.890.0420.3000.5650.0110.1020.15611.410..49.83.13.52.7
Table 10. Optimal combinations of WEDM parameters and non-dominated solutions.
S. No.Optimum Combination of ParametersPredicted Optimal Responses
Pulse on Time (µs)Pulse off Time (µs)Servo Voltage (V)Peak Current (A)Wire Tension (kg)Kerf Width (mm)Average Surface Roughness (µm)MRR (mm3/min)
1115.741.347958.9851145.62581.50.41152.903211.0445
2116.197651.022758.8759140.25821.0020.40073.745510.081
3115.736148.60958.4004140.91271.14990.4033.57089.9281
4111.847153.36957.6318139.70521.18460.39123.13998.982
5106.229343.357555.8224138.03021.46650.38861.97398.3452
6109.075651.250954.952135.54421.15570.38432.67458.0852
7107.629954.334356.1504137.65181.17920.37892.54727.7192
8103.810855.796655.6415136.72051.17330.36532.04216.2681
9103.50958.585556.0647131.16381.13260.3591.81435.9988
10102.586359.239756.1829129.35321.11860.35411.66255.5898
11100.601240.201849.5448125.18711.49910.37120.79835.3027
12103.634858.654853.2785125.48581.2450.36231.57384.9978
13100.482341.011249.6387126.03151.26190.36361.01464.7551
14100.830458.352954.7529134.72871.17890.35241.44514.5571
15100.105859.799354.683127.4791.10170.3441.22614.1407
16100.106459.699853.5976126.82431.1160.34491.16673.9059
17100.119459.785251.1414127.1041.26120.35110.99253.1583
18100.188459.720349.7307123.90731.30320.35290.96212.8823

