Abstract
Anisotropic mechanical properties are a well-known issue in selective laser melted parts. The microstructure produced by selective laser melting (SLM) is directional, including the solidified melt pool structures and grains. This work investigates the melt pool boundary’s effects on 304L stainless steel’s compressive properties. 304L stainless steel solid cylinders were built using a pulse laser SLM machine in four directions using three hatch angle rotations: 0°, 67°, and 105°. The twelve samples were compression tested, and the results were analyzed. Numerical models were also created with the different hatch angles and directions. The melt pool boundary network (MPBN) in each build was tracked using the model across multiple planes. Results showed that both the hatch angle and build orientation influenced the concentration of melt pool boundaries present in the manufactured samples. A weak negative correlation of compressive strength to the melt pool boundaries’ concentration was also observed, indicating that the melt pool boundary concentration negatively affected the material’s strength. Local anisotropic plastic deformation was also observed in some of the compressed samples. In those samples, it was observed that directions that plastically deformed more also contained higher concentration of the melt pool boundaries.
1. Introduction
Additive manufacturing (AM) has continued to gain increasing interest over the past few years. This is because AM processes are exceptionally efficient in fabricating low-volume, high-value components and are valuable methods for fabricating components with complex internal features [1,2,3,4]. One popular AM technique for manufacturing complex metallic components is selective laser melting (SLM) [4]. SLM involves manufacturing a fully dense part in a layer-by-layer manner through the selective melting of a metallic powder bed. In SLM, as the laser melts the powder, a melt pool is created. The combination of heat from the laser and the material’s thermal properties adjusts the size and shape of the melt pool in addition to the phases formed in the melt pool [5,6]. The formed melt pool is usually curved due to the Gaussian laser beam distribution and surface tension [7,8]. Often, the grain will grow epitaxially in the build direction through several melt pools [7,9,10]. These grains often have the same crystallographic orientation [11]. The overlapping of individual melt pools creates a fully dense part with a distinctive fish-scale patterned microstructure [11,12,13].
The relationship between the SLM process, the microstructure, and part properties is complex and has been the subject of many investigations [7,9,11,14]. Anisotropy, in particular, has been recorded in strength and fatigue, amongst other mechanical properties of SLM parts [7,9,15,16,17,18,19]. The build orientation and the laser scan pattern are notable process parameters that influence anisotropic properties. This is due to the influence these process parameters have on the microstructure of SLM materials [7,9]. The laser scan pattern, the path the laser takes in each layer, in many cases, is repeated in each layer, as much as the shape of the part allows, only rotated in each subsequent layer to reduce periodicity. In contrast, the build orientation, the orientation of the part on the build plate, is usually changed between parts. These parameters determine the melt pool patterns formed in the manufactured material. In a review of anisotropy in AM materials, Kok et al. [15] concluded that three microstructural factors, crystallographic texture, lack-of-fusion porosity, and columnar grains, influence anisotropy in SLM materials. With the possible exception of crystallographic texture, these features can be controlled by varying the build parameters. Lack-of-fusion can be reduced by changing hatch spacing and by increasing melt pool depth. The grain size is controllable by varying laser power and scan speed [15,20]. On the other hand, Wen et al. [12] and Xiong et al. [21] concluded that the melt pool boundary (MPB) was the primary factor influencing anisotropy in AM parts. The MPBs allow for preferential slip during deformation due to their low dislocation density [22]. This theory is supported by Mower and Long [23]. Mower and Long concluded that the low fatigue strength and planar fracture of their 316L samples was a result of the weak ‘build plane.’ This theory was used to explain the fracture behavior seen by Wen et al. [12] as the crack path appeared to follow the MPBs, rather than the grain boundaries.
The current work investigates the effects of the melt pool boundary on anisotropy in SLM 304L cylinders. 304L stainless steel solid cylinders were additively manufactured using an SLM machine in four directions using three hatch angles: 0°, 67°, and 105°. Numerical models were also developed using Blender commercial software to estimate each sample’s melt pool boundaries concentration. The twelve samples were compression-tested, and the results were analyzed. The relationship between the melt pool boundary concentration, the compressive yield strength, and plastic deformation was estimated using the experimental results and the numerical predictions.
2. Manufacturing and Experimental Testing
The procedure used to manufacture the test specimens is similar to what is detailed in Fashanu et al.’s [24] work. 304L cylinders were manufactured using a Renishaw AM250 (provided by Honeywell Federal Manufacturing and Technology, Kansas City, MO, USA) and argon-gas atomized powder sourced from Carpenter Technology Corporation, Philadelphia, PA, USA (formerly LPW Technology). The scan pattern used was a border scan followed by the stripes scan pattern. The machine parameters used during this study are shown in Table 1. Octagonal prisms with a height of 27.8 mm and a side length of 3.84 mm were printed in four build orientations using three hatch angles. Three replications were manufactured for each sample. The test matrix used during this study is shown in Table 2. Figure 1 shows the four build orientations as they appear on the build plate. The hatch angles were 0°, 67°, and 105° rotation between layers. The prisms were removed from the build plate with wire electron discharge machining (EDM). They were then machined into cylinders with a diameter of 6.35 mm and a height of 6.35 mm. Before compression testing was carried out, hardness and density measurements were carried out. The Vicker’s hardness measurements were carried out at 9.81 N for 10 s at three positions near the center of the machined top surface of the cylinders. Archimedes’ density method with water (as the liquid medium) and the vacuum method (to remove gas bubbles) were used to measure the density of the specimens.

Table 1.
SLM machine parameters.
Table 2.
The test matrix for each sample, where the orientation is listed, shows the plane normal to the compression direction. The notation for the orientation is hatch angle–rotation direction–rotation degree.
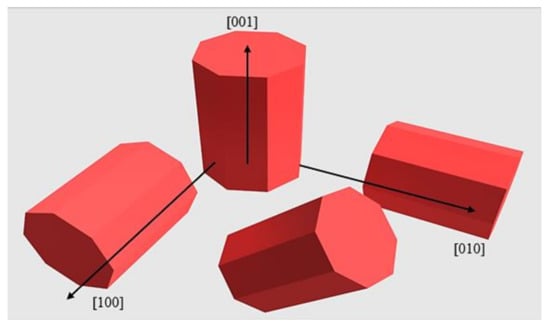
Figure 1.
The four build orientations investigated.
Compression testing was done as described in ASTM E3 using self-aligning platens. The samples were loaded at a strain rate of 5 × 10⁻³ per min. The cylinders were compressed to well past the yield point. After compression testing, only two values, the yield strength and aspect ratio, were estimated and used for the anisotropy investigation. The yield strength was estimated at 0.2% offset, while the aspect ratio was estimated from the final specimen geometry. A macro lens camera was used to take close-up images of the top and sides of each specimen, where the top surface images were converted to binary (the top surface was black and the background white). FIJI software was used to estimate the aspect ratio of the specimens using the Feret diameters. After the Feret measurements, the samples were prepared for metallography. They were mounted in bakelite and polished to 0.05 microns in colloidal silica. The samples were electrolytically etched in a 60:40 nitric acid for optical microscopy (water solution at 6 volts for approximately 5 s). Vicker’s hardness measurements were again taken along the top surface of a tested specimen to map the hardness across the deformed specimen to track the local magnitude of plastic deformation.
3. Results and Discussion
3.1. Experiments
The points of interest from the compression tests are shown in Table 3. The Archimedes results were not tabulated as no significant difference was observed with respect to changes to the hatch angle and build orientation. On average, the samples were about 98% ± 1.0% dense. In Table 3, the maximum yield strength and the lowest aspect ratio for each hatch angle are in bold fonts. The samples built either in the [100] or [010] direction for each hatch angle had the highest yield strength. The aspect ratio results showed that the build direction with the lowest aspect ratio varied depending on the hatch angle. For example, samples built with hatch angle 67° in the [001] direction had the lowest aspect ratio, while samples built with hatch angle 105°in the [010] direction had the lowest aspect ratio. An aspect ratio greater than 1 indicates that anisotropic plastic deformation occurred in the samples. This can occur if the test is performed improperly or if non-articulating platens are used. The articulating platens were used in this case, and the samples were sufficiently lubricated to reduce horizontal friction. Further, the degree of anisotropy varied with orientation and rotation, even among specimens with similar strengths, but was consistent for replicates of the same specimen type. The aspect ratio of the compression surface was not the only anisotropic plastic deformation observed. Figure 2 shows the view of a compressed sample from the top. The shearing of the cylinders is made evident in the figures by the black arrows. The shearing was most prominent in the 0° hatch angle specimens, and it seemed to be perpendicular to the longest width of the compressed specimen. All specimens experienced this shearing behavior, though it was less apparent in the samples with low aspect ratios. These results are similar to what was presented by Fashanu et al. [24]. The 0°–[010]–45° sample was notably different from the other 0° hatch angle samples in that the (001) plane did not deform into a cylinder but instead became rounded boxes, as shown in Figure 3. Despite the low aspect ratio, the anisotropic plastic deformation was still prevalent in this sample.
Table 3.
Compression test results (yield strength and aspect ratio).

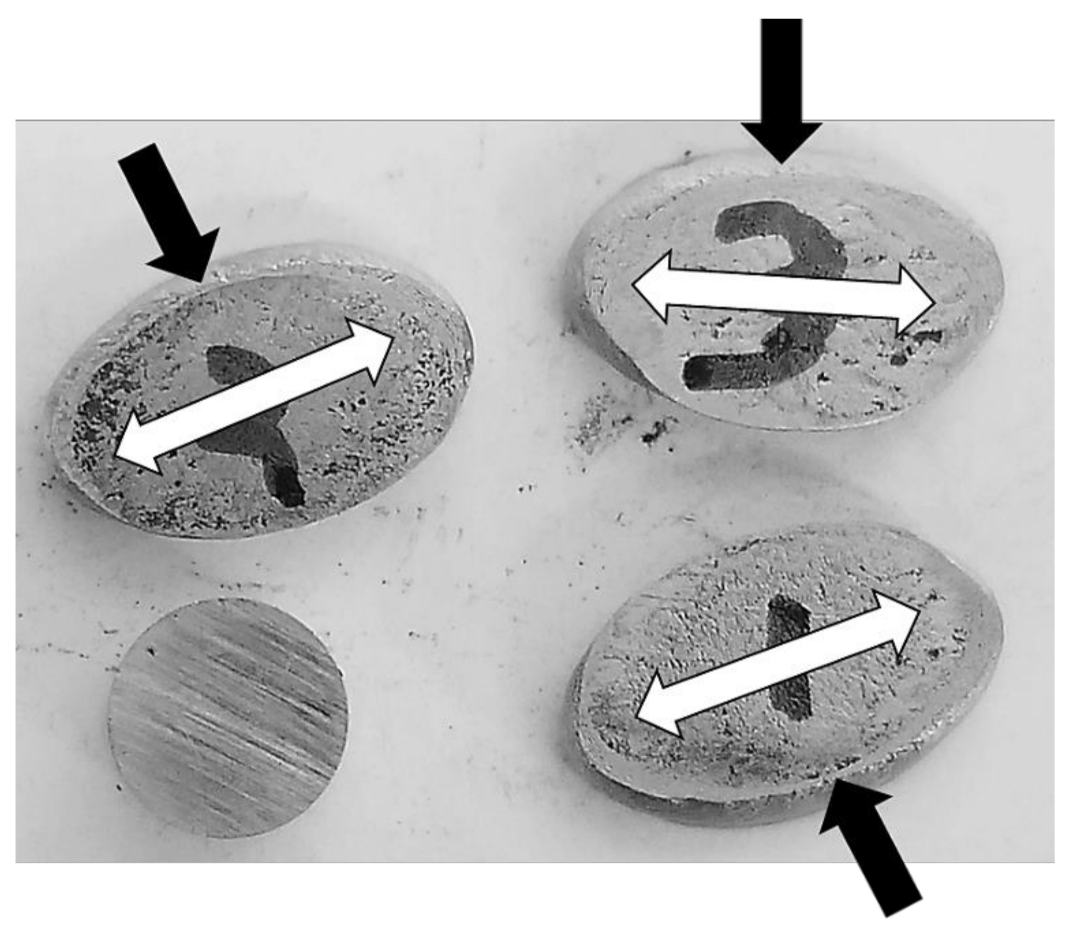
Figure 2.
0°–[100]–0° specimens after compression testing (black arrows indicate the direction of shear plastic deformation, and the white arrows indicate the maximum width). Lower left is untested specimen.
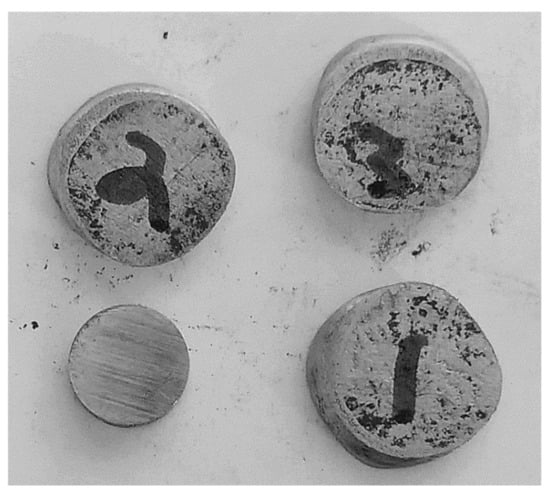
Figure 3.
0°–[010]–45° specimens after compression.
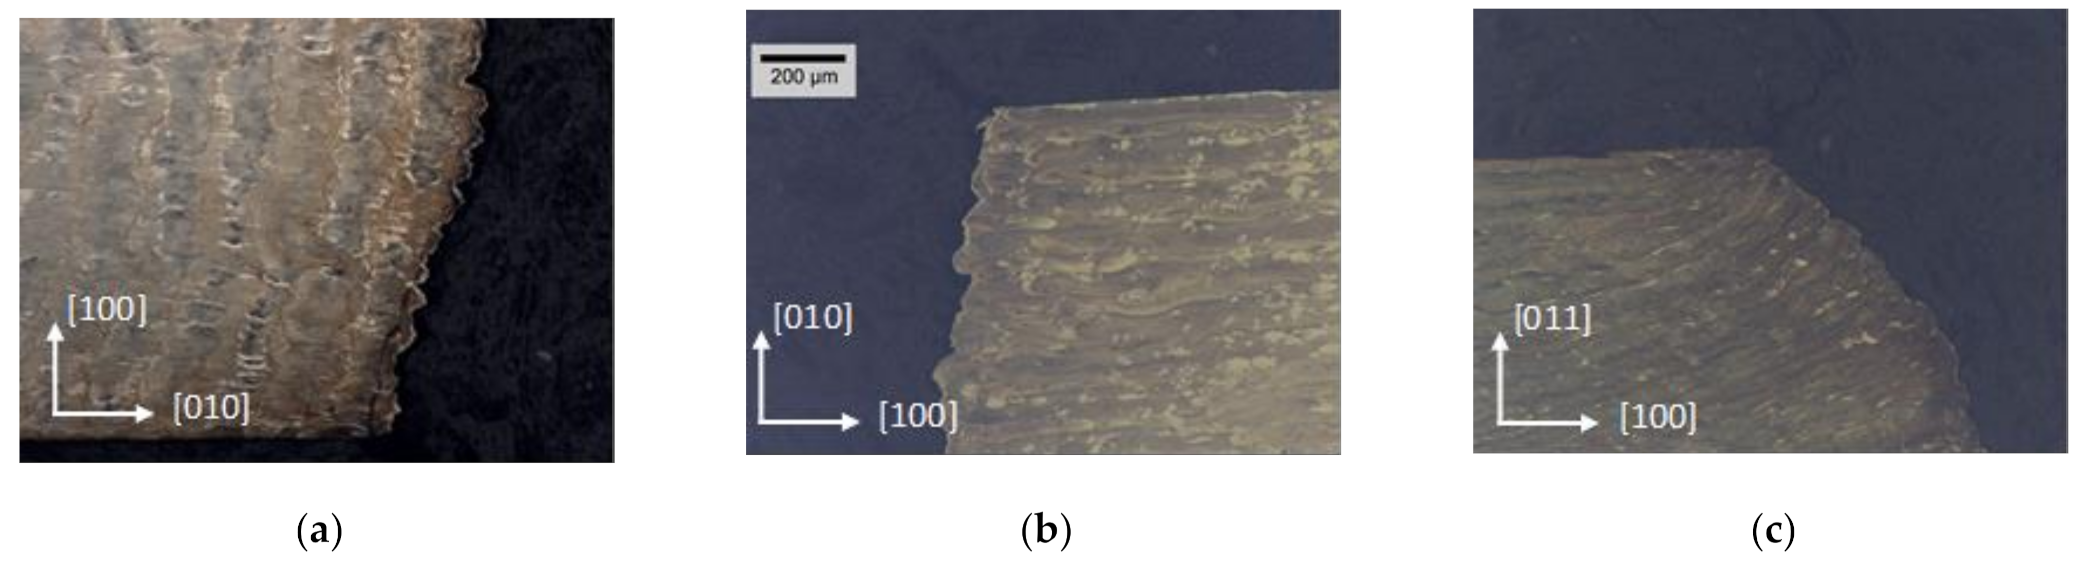
After compression, it was observed that the MPBN was distorted at the edges of the cylinder. This was easiest to see in the 0° hatch angle samples as the melt pool boundary network was stacked in parallel lines due to the non-rotating scan pattern. The cylinders barreled out non-uniformly as previously described, and the previously smooth cylindrical edge became rippled (Figure 4). In Figure 4b,c, the rippling roughly corresponds to the melt pool tracks in a single layer (Figure 4b) and the layers (Figure 4c), as if the features were compressed independently of the other layers. The rippling also appeared along the melt pool track (Figure 4c), possibly corresponding to individual melt pools. This phenomenon was not limited to the edges of the cylinder; however, it was easiest to see there.
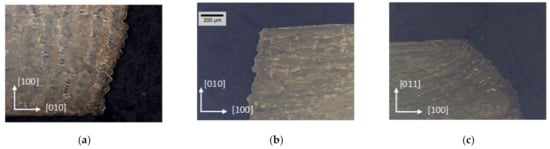
Figure 4.
Rippled cylinders after compression (a) 0°–[010]–90°, (b) 0°–[100]–90°, and (c) 0°–[100]–0°.
The measured Vicker’s hardness results of the undeformed samples were similar (about 216 ± 6 HV), with no statistical difference observed with respect to changes in hatch angle or build orientation. According to the ASM specification [25], for austenitic 304L steel, the Vicker’s hardness value should be 159 HV. The elevated hardness in the structure before testing supports the evidence that the additively manufactured properties of the 304L material are significantly different from traditionally manufactured material. After the compression test, the hardness was also tracked on the compression surface of each specimen type. The map of the hardness measurements is shown in Figure 5. From this figure, it can be observed that the sheared area of the specimen (noted in the figure) was significantly harder than the compression surface.
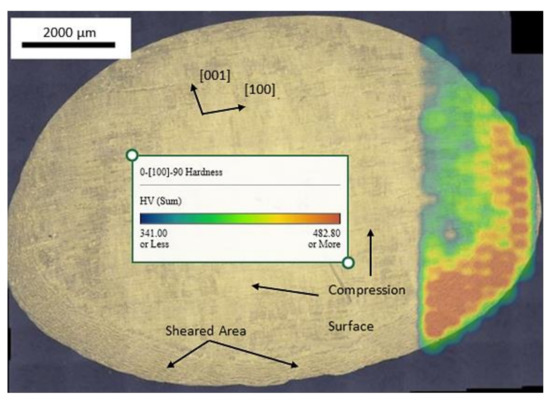
Figure 5.
Hardness map of the 0°–[100]–90° specimen after compression.
3.2. Modeling of the MPBN
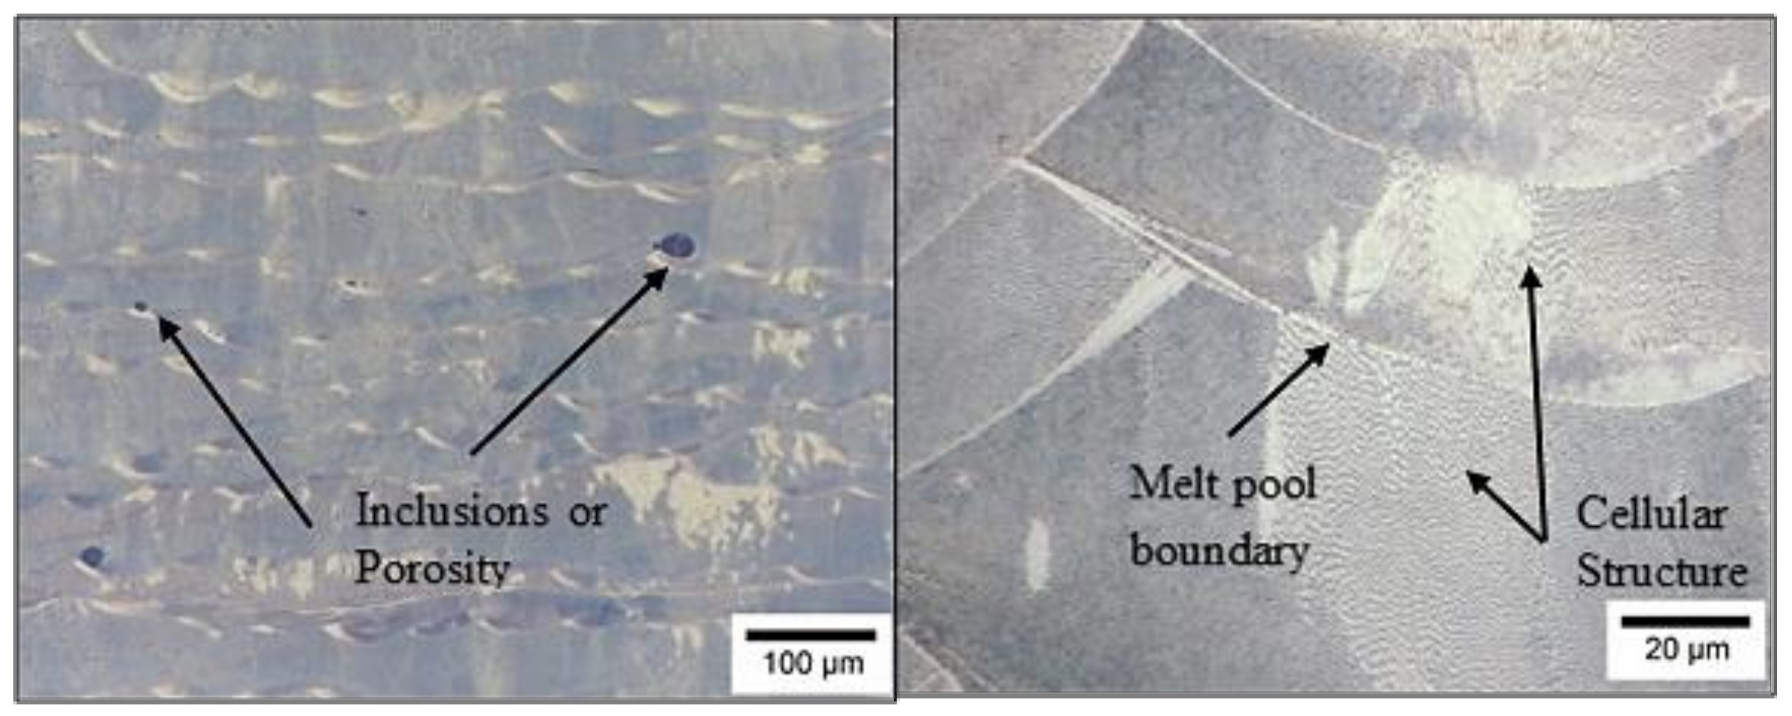
The melt pool boundary network (MPBN) was modeled using Blender software. This software was chosen due to its easy-to-use interface and ability to create and modify complex meshes. The MPBN depends on the laser scan pattern used during part manufacture. The Renishaw AM 250 machine used in the experimental part of this study uses a pulsed laser rather than the more common continuous laser. The laser turns on and ramps to the correct wattage, holds in place for the specified exposure time, and then turns off. It then moves to the next position at a set speed and turns on again. This means that the melt pool that forms under the laser is not necessarily continuous. The melt pool shape changes depending on the scan pattern used by the laser. In this study, the scan pattern was stripes. Figure 6 shows an example of the stripes scan pattern. This figure also shows the spacing between laser points and the hatch spacing between rows in a single layer. The hatch spacing in this experiment was 85 microns, the point distance was 60 microns, and the layer thickness was 50 microns. The orientation of the developed models was based on the Renishaw AM 250 builds. The scan pattern of the laser always started the build by moving in the x or [100] direction, and the [001] direction is the build direction or vertical axis. Each model was built with this orientation. When planes or directions are mentioned, these are considered global axes tied to the build plate. So, the build direction is always the [001] axis, and the layers are in-plane with the (001) plane. The melt pool shape used in the models after solidification was based on etched images of a 304L stainless steel (ss) specimen shown in Figure 7. The idea to model the melt pool using this approach came from Li et al. [6]. They modeled melt pools’ thermal history and size change using different input parameters on the same machine and material as used here. The model boundary was given a thickness to simulate the actual melt pool boundary. The melt pool boundary is the material that solidifies first at the edges of the melt pool. In this work, the thickness was set to a single width of 0.1 microns. The representative melt pool used in this model does not consider melt pool size and shape variations.
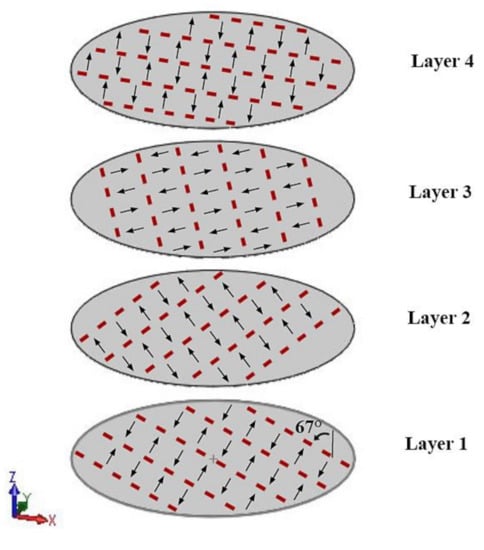
Figure 6.
Stripes scan pattern (67°–hatch angle).
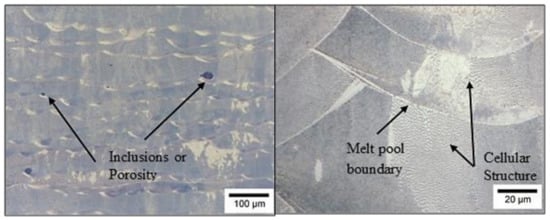
Figure 7.
Optical images of SLM 304L in two magnifications etched with a 60:40 water: nitric acid electrolytic etchant.
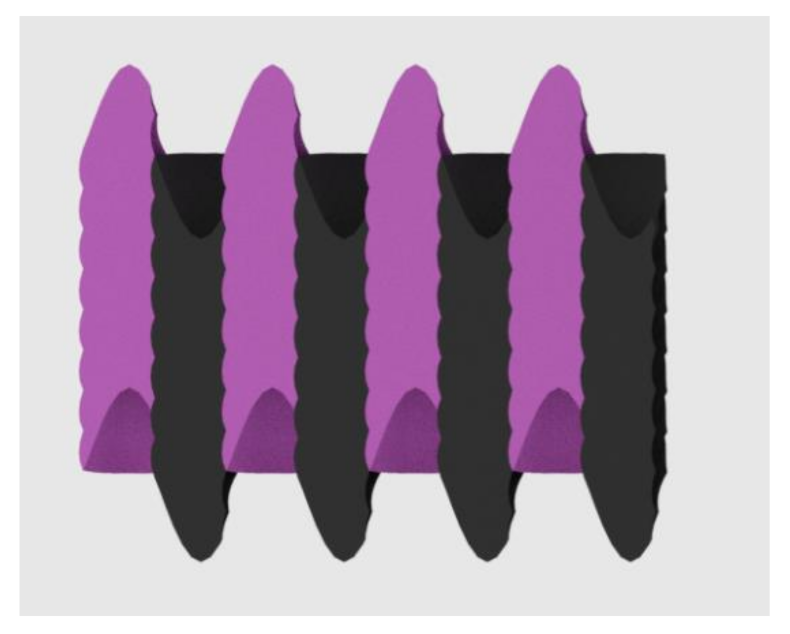
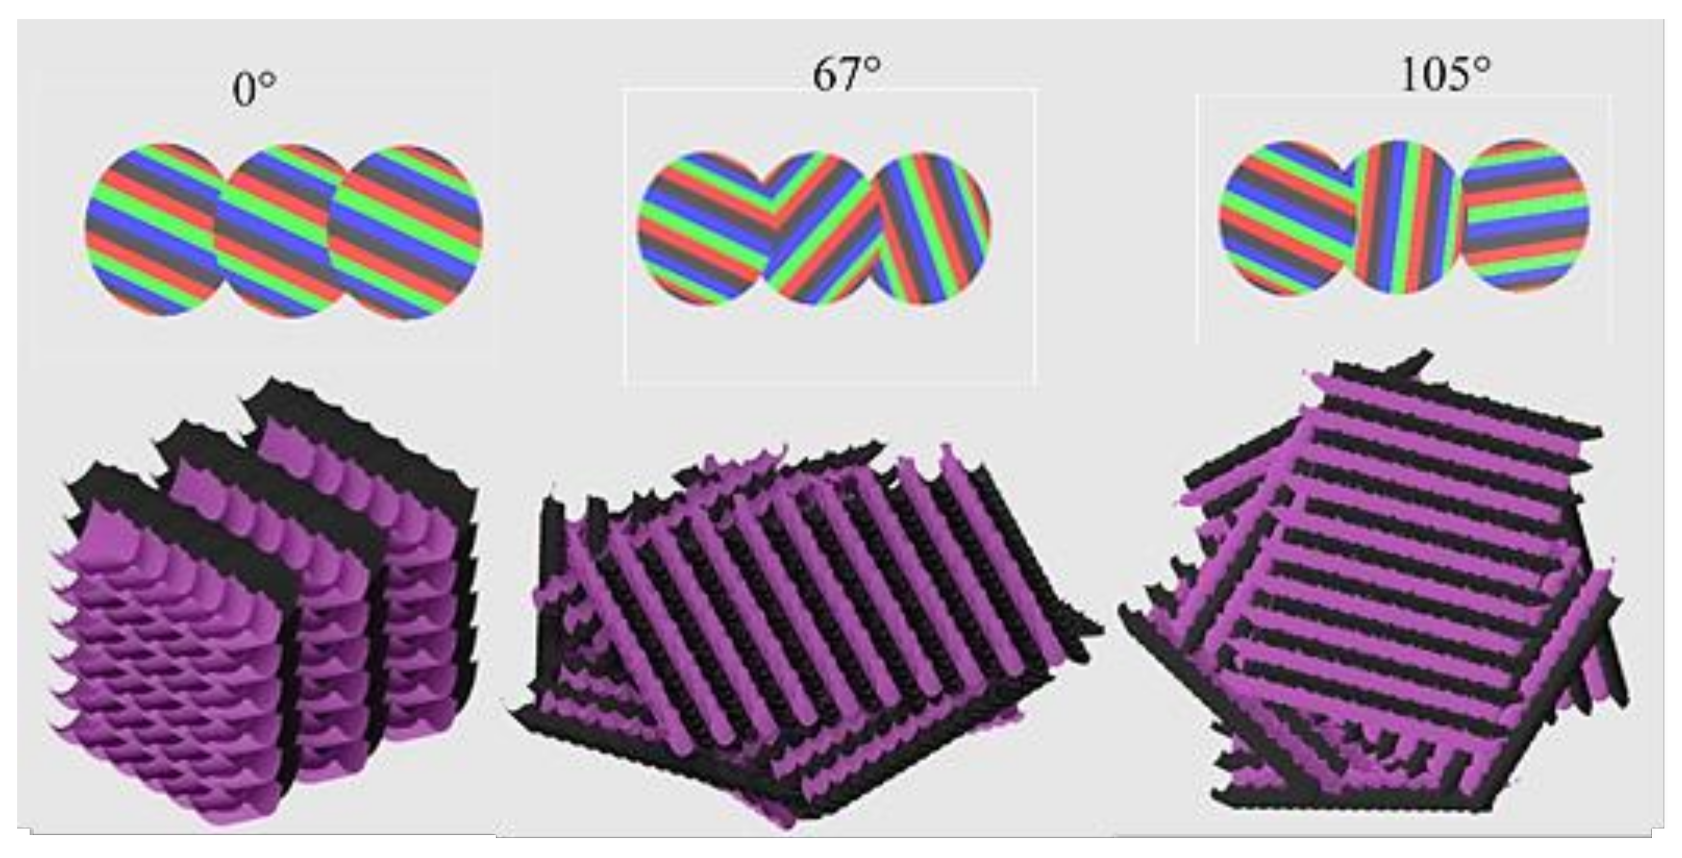
The first step of developing the model was creating the model of a single melt pool. The second step was to create the first layer of the part, which was done by arranging single melt pools in a single plane to mimic the laser scan pattern. Each subsequent melt pool annihilates any overlapping area with previous melt pools. This simulates the re-melting that occurs. Figure 8 shows a single layer and the scan pattern that was mimicked to create that layer. The alternating colors indicate the alternating direction the laser was moving when that row was created. The third step was to create multiple layers. Typically, the scan pattern is rotated between layers. The rotation increases the ‘randomness’ of the structure. In this work, three models were developed with different rotation angles: 0° (or non-rotating), 67°, and 105°. Figure 9 shows each scan pattern and the corresponding model. Six layers were created for each model type.

Figure 8.
The model of a single layer (colors indicate the change in laser direction).
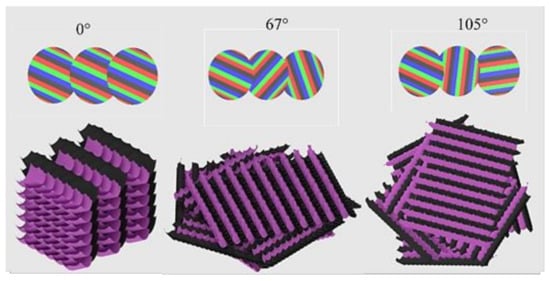
Figure 9.
(Top) scan pattern rotation, (bottom) developed model.
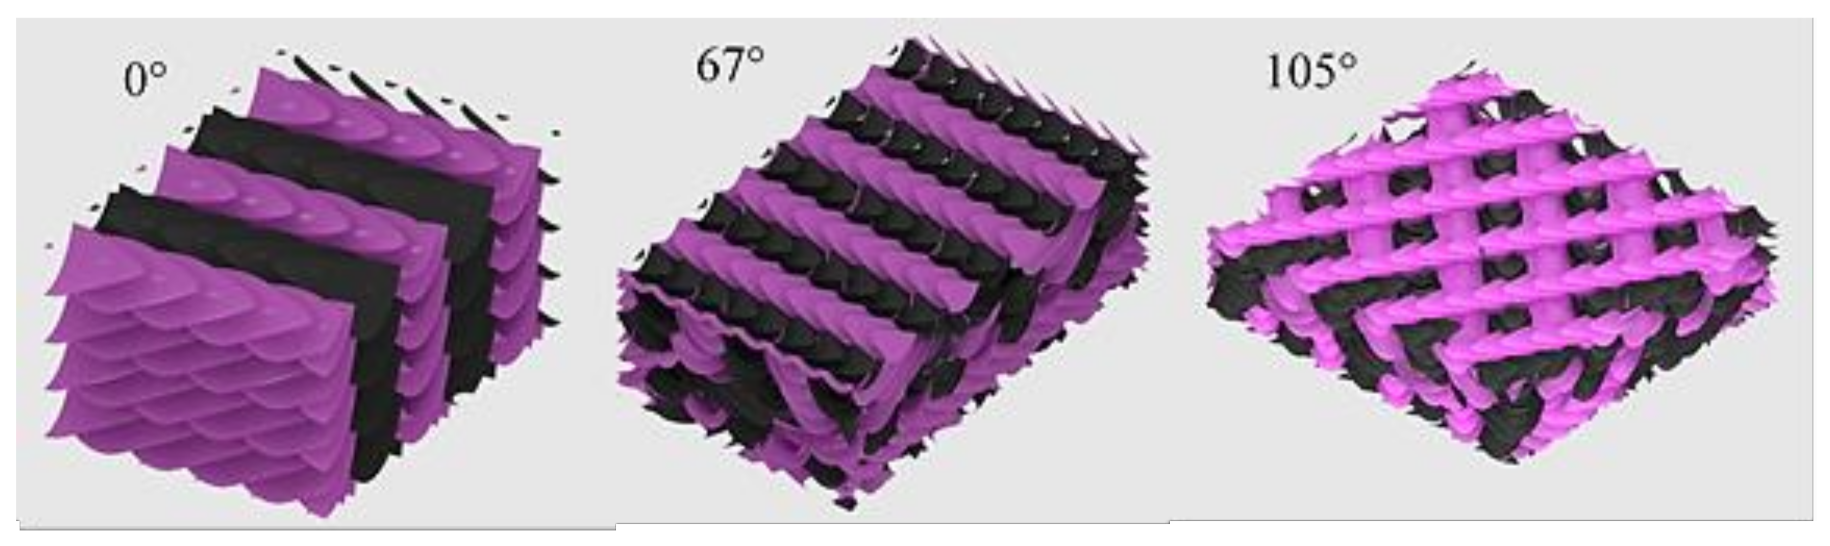
Once each model of the MPBN was created, it could then be analyzed. In this work, the concentration of the MPBN was analyzed through the structure. This was done by slicing each model in the (001) plane in increments along the [001] direction. Each model was sliced 60 times at regular intervals. Before slicing, the model itself was cut down into a representative volume element (RVE). This RVE contained only overlapping melt pools and eliminated any melt pools along the model’s edges. Figure 10 shows each of the RVE models. The concentration of MPBN in each slice when the model is oriented with the build direction parallel to the [001] axis only shows the concentration of MPBN along that plane. Other orientations have other MPBN concentrations. To track this, the model was tilted around the [100] and [010] directions at 5° increments from 0° to 90°. Figure 11 shows examples of the tilted model. Each tilted model was sliced and imaged in the same manner as the 0° model. When rotated around the [100] direction by 90°, the model was sliced along the (010) plane. When it was rotated around the [010] direction by 90°, it was sliced along the (100) plane. Each image was fed into FIJI software. This software is capable of measuring the color data in each pixel of an image. This was done to each of the image slices. The background color of the images was separated from the MPBN color of the images, and the total number of MPBN pixels was found for each image. This number was then divided by the total number of pixels in the model at that slice to get the concentration as a percentage.
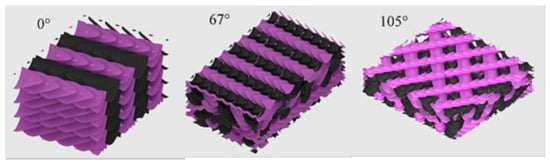
Figure 10.
The three RVE models after the boundaries were removed.
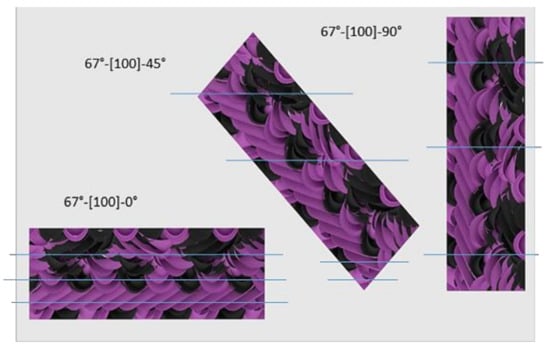
Figure 11.
The 67° hatch angle model rotated around the [100] direction by 0°, 45°, and 90°, where the lines are example slices through the models.
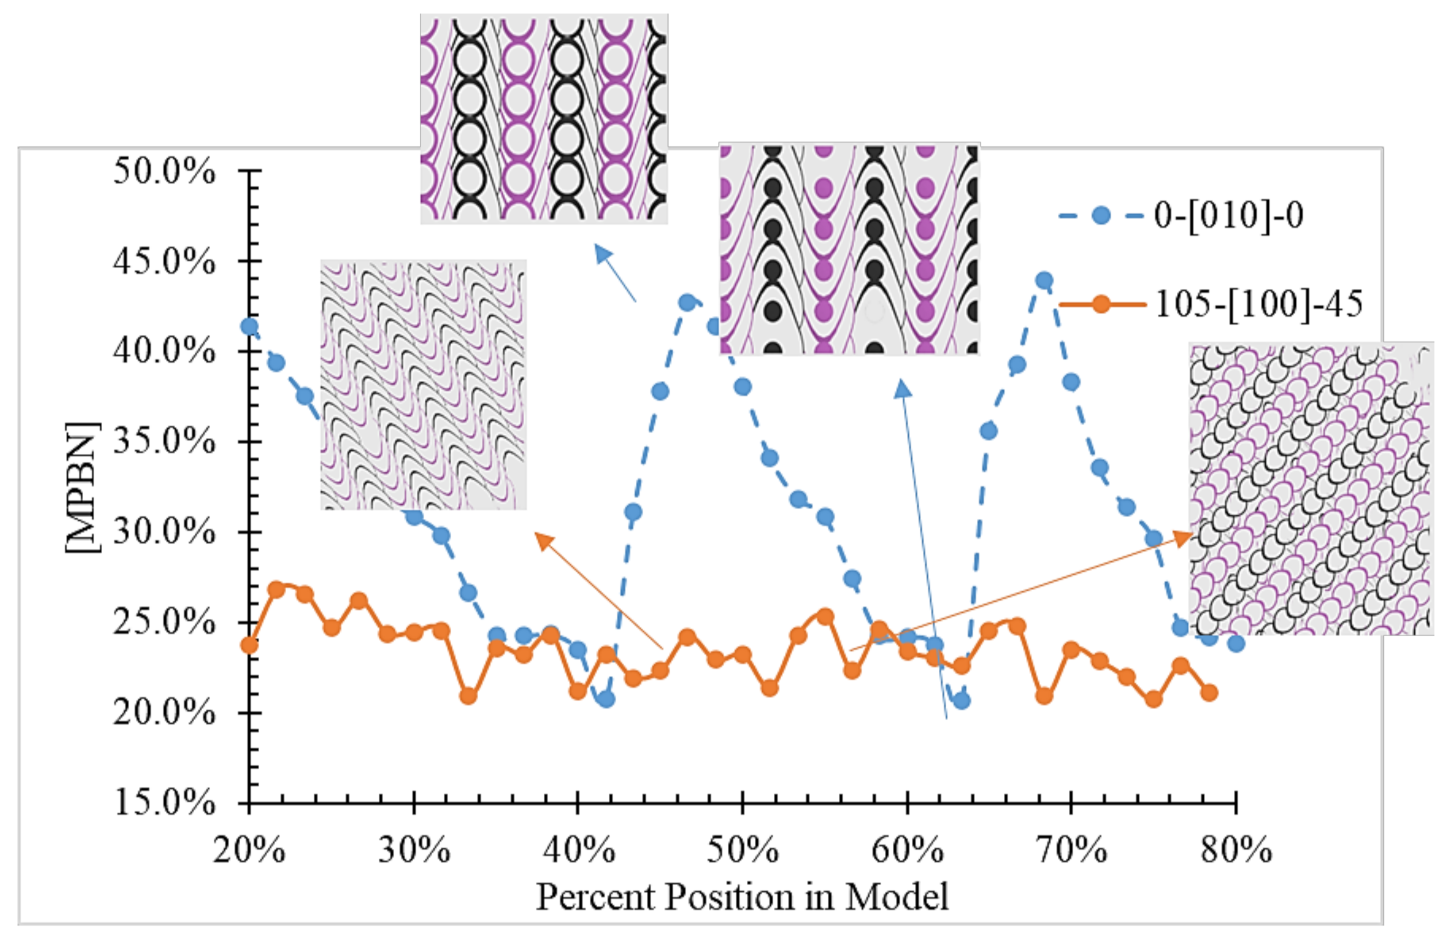
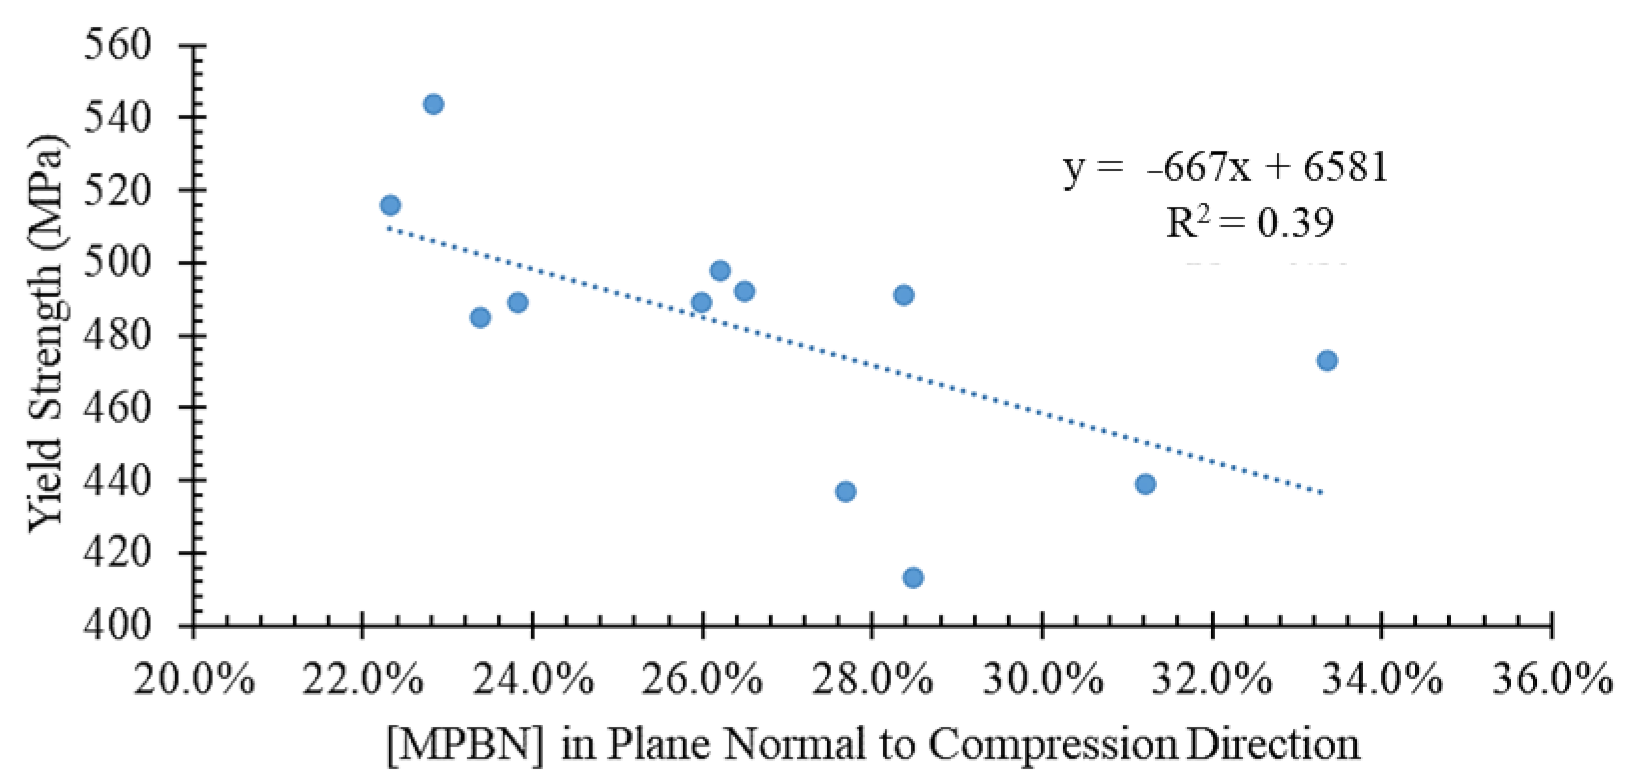
When the percent MPBN per slice was plotted over the length of the model, two different types of lines were observed (Figure 12); ‘type one’ was a pseudo-sinusoidal increase and decrease, while ‘type two’ was a relatively flat line. The flat line indicates that the MPBN concentration was relatively constant along this direction, while the pseudo-sinusoidal increase and decrease line indicated an increase and decrease in the MPBN concentration along this direction. In all three hatch angles, it was observed that at least one orientation, the orientation parallel with the build direction, was guaranteed to produce a ‘type one’ line. The presence of this sinusoidal MPBN concentration between layers is suspected of causing structures leading to anisotropy. The microstructure of SLM parts is characterized by a distinctive fish-scale pattern [11,12,13]. In steel alloys, this fish-scale-like pattern appears as a thin band around the edge of the melt pool, known as the melt pool boundary (MPB). The interior of the melt pool often solidifies into a cellular structure [7,11]. To further investigate the effects of the MPBN, the concentration of MPBN was plotted against the measured yield strength. Since the samples in this study were compressed uniaxially, the plane normal to the compression direction was of interest. Figure 13 shows the relationship between the yield strength and the concentration of the melt pool boundaries through the plane normal to the compression direction. This figure shows a weak negative linear correlation (R2-value of only 0.39) between the yield strength and the melt pool boundary concentration, indicating other factors influence anisotropy in SLM. However, the negative correlation does lend some veracity to the theory presented here.
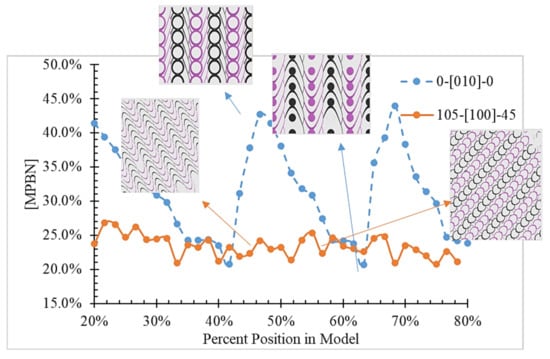
Figure 12.
Plot of MPBN concentration over the length of the model.

Figure 13.
Plot of yield strength vs. concentration of the MPBN in the plane normal to the compression direction.
For the 0°–[100]–0° cylinder, the direction of greatest width was parallel to the [100] direction, and the direction of the lowest width was the [010] direction. The 0°–[100]–0° sample had the highest aspect ratio. For the 0°–[100]–90° specimen, the largest and smallest widths were the [100] and [001] directions, respectively, while for the 0°–[010]–90° specimen, the largest and smallest widths were the [001] and [010] directions, respectively. In conjunction with the aspect ratio data, these results can be used to determine a ranking for these directions. The directions that caused the most to the least plastic deformation were [100], [001], and [010]. This behavior correlates to the pseudo-sinusoidal behavior of the MPBN in those directions. Table 4 shows the maximum and minimum peaks of the MPBN in those three directions for the 0° hatch angle samples. The difference between the maximum and minimum MPBN in the planes equates to the rank-ordered directions. The other hatch angles did not experience the anisotropic behavior to the same degree as the 0° hatch angle samples. For the 67° hatch angle samples, the three planes of interest had a low difference between the peaks, which may explain why they did not experience much of an aspect ratio difference. For the 105° hatch angle samples, very few planes exhibited pseudo-sinusoidal behavior. The maximum amplitude of the pseudo-sinusoidal behavior seems to be correlated with the deformation in that direction.
Table 4.
The maximum, minimum, and difference between the pseudo-sinusoidal peaks for the three directions of interest.
4. Conclusions
In this work, anisotropic behavior in SLM 304L was investigated, focusing on the melt pool boundary as the root cause. The melt pool boundary network (MPBN) was modeled using a representative volume element containing six layers of material. Three models were created with different hatch angles of 0°, 67°, and 105°. The concentration of the MPBN in each model was tracked across multiple planes. Experimental specimens were additively manufactured using the same three hatch angles in four build directions. The specimens were tested in compression. The compression results showed that both the hatch angle and build orientation influenced the measured yield strength. Depending on the hatch angle, the build orientations with the highest yield strengths were either built in the [100] or [010] direction. The yield strength of the samples was correlated to the concentration of the MPBN normal to the compression direction. A linearly negative correlation was found with an R2 value of 0.39, indicating that the melt pool boundary concentration negatively affected the material’s strength. The MPBN concentration exhibited a pseudo-sinusoidal behavior in the planes related to this anisotropic deformation. The amplitude of the pseudo-sinusoidal curve seems to be related to the extent of the deformation experienced by the specimens in that direction. It is clear from the literature that the mechanical properties of SLM parts depend on the process parameters used. The mechanical property results of this study support that. These results also support the theory that the MPB plays a role in controlling the anisotropic behavior in stainless steel SLM parts. There are, of course, other microstructural features that also impact the anisotropy, such as grain size, crystallographic orientation, and porosity distribution. These features are slowly becoming well-documented in the literature.
Author Contributions
Conceptualization, J.W.N., K.C., M.S. and O.F.; methodology, M.S. and O.F.; formal analysis, M.S. and O.F.; investigation, M.S., O.F., J.W.N. and K.C.; resources, J.W.N. and K.C.; writing—original draft preparation, M.S., O.F., J.W.N. and K.C.; writing—review and editing, M.S., O.F., K.C. and J.W.N.; visualization, M.S. and O.F.; supervision, J.W.N. and K.C.; project administration, J.W.N. All authors have read and agreed to the published version of the manuscript.
Funding
This research received no external funding.
Acknowledgments
The authors would like to acknowledge Honeywell Federal Manufacturing and Technology for use of the Renishaw machine.
Conflicts of Interest
The authors declare no conflict of interest.
References
- Levy, G.N.; Schindel, R.; Kruth, J.P. Rapid Manufacturing and Rapid Tooling with Layer Manufacturing (Lm) Technologies, State of the Art and Future Perspectives. CIRP Ann.-Manuf. Technol. 2003, 52, 589–609. [Google Scholar] [CrossRef]
- Huang, R.; Riddle, M.; Graziano, D.; Warren, J.; Das, S.; Nimbalkar, S.; Cresko, J.; Masanet, E. Energy and emissions saving potential of additive manufacturing: The case of lightweight aircraft components. J. Clean. Prod. 2016, 135, 1559–1570. [Google Scholar] [CrossRef] [Green Version]
- Murr, L.E.; Martinez, E.; Amato, K.; Gaytan, S.M.; Hernandez, J.; Ramirez, D.A.; Shindo, P.W.; Medina, F.; Wicker, R.B. Fabrication of Metal and Alloy Components by Additive Manufacturing: Examples of 3D Materials Science. J. Mater. Res. Technol. 2012, 1, 42–54. [Google Scholar] [CrossRef] [Green Version]
- Frazier, W.E. Metal Additive Manufacturing: A Review. J. Mater. Eng. Perform. 2014, 23, 1917–1928. [Google Scholar] [CrossRef]
- Khairallah, S.A.; Anderson, A.T.; Rubenchik, A.; King, W.E. Laser powder-bed fusion additive manufacturing: Physics of complex melt flow and formation mechanisms of pores, spatter, and denudation zones. Acta Mater. 2016, 108, 36–45. [Google Scholar] [CrossRef] [Green Version]
- Li, L.; Lough, C.; Replogle, A.; Bristow, D.; Landers, R.; Kinzel, E. Thermal Modeling of 304L Stainless Steel Selective Laser Melting. In Proceedings of the 28th Annual International Solid Freeform Fabrication Symposium—An Additive Manufacturing Conference, Austin, TX, USA, 7–9 August 2017; pp. 1068–1081. [Google Scholar]
- Pham, M.-S.; Dovgyy, B.; Hooper, P. Twinning induced plasticity in austenitic stainless steel 316L made by additive manufacturing. Mater. Sci. Eng. A 2017, 704, 102–111. [Google Scholar] [CrossRef]
- Guo, P.; Zou, B.; Huang, C.; Gao, H. Study on microstructure, mechanical properties and machinability of efficiently additive manufactured AISI 316L stainless steel by high-power direct laser deposition. J. Mater. Process. Technol. 2017, 240, 12–22. [Google Scholar] [CrossRef]
- Vilaro, T.; Colin, C.; Bartout, J.-D. As-Fabricated and Heat-Treated Microstructures of the Ti-6Al-4V Alloy Processed by Selective Laser Melting. Met. Mater. Trans. A 2011, 42, 3190–3199. [Google Scholar] [CrossRef]
- Thijs, L.; Verhaeghe, F.; Craeghs, T.; van Humbeeck, J.; Kruth, J.-P. A study of the microstructural evolution during selective laser melting of Ti–6Al–4V. Acta Mater. 2010, 58, 3303–3312. [Google Scholar] [CrossRef]
- Köhnen, P.; Haase, C.; Bültmann, J.; Ziegler, S.; Schleifenbaum, J.H.; Bleck, W. Mechanical properties and deformation behavior of additively manufactured lattice structures of stainless steel. Mater. Des. 2018, 145, 205–217. [Google Scholar] [CrossRef]
- Wen, S.F.; Li, S.; Wei, Q.S.; Yan, C.Z.; Zhang, S.; Shi, Y.S. Effect of molten pool boundaries on the mechanical properties of selective laser melting parts. J. Mater. Process. Technol. 2014, 214, 2660–2667. [Google Scholar] [CrossRef]
- Wang, D.; Song, C.; Yang, Y.; Bai, Y. Investigation of crystal growth mechanism during selective laser melting and mechanical property characterization of 316L stainless steel parts. Mater. Des. 2016, 100, 291–299. [Google Scholar] [CrossRef]
- Wang, X.; Keya, T.; Chou, K. Build Height Effect on the Inconel 718 Parts Fabricated by Selective Laser Melting. Procedia Manuf. 2016, 5, 1006–1017. [Google Scholar] [CrossRef] [Green Version]
- Kok, Y.; Tan, X.P.; Wang, P.; Nai, M.L.S.; Loh, N.H.; Liu, E.; Tor, S.B. Anisotropy and heterogeneity of microstructure and mechanical properties in metal additive manufacturing: A critical review. Mater. Des. 2018, 139, 565–586. [Google Scholar] [CrossRef]
- DebRoy, T.; Wei, H.L.; Zuback, J.S.; Mukherjee, T.; Elmer, J.W.; Milewski, J.O.; Beese, A.M.; Wilson-Heid, A.; De, A.; Zhang, W. Additive manufacturing of metallic components—Process, structure and properties. Prog. Mater. Sci. 2018, 92, 112–224. [Google Scholar] [CrossRef]
- Carroll, B.E.; Palmer, T.A.; Beese, A. Anisotropic tensile behavior of Ti–6Al–4V components fabricated with directed energy deposition additive manufacturing. Acta Mater. 2015, 87, 309–320. [Google Scholar] [CrossRef]
- Maamoun, A.H.; Elbestawi, M.; Dosbaeva, G.K.; Veldhuis, S.C. Thermal post-processing of AlSi10Mg parts produced by Selective Laser Melting using recycled powder. Addit. Manuf. 2018, 21, 234–247. [Google Scholar] [CrossRef]
- Liverani, E.; Toschi, S.; Ceschini, L.; Fortunato, A. Effect of selective laser melting (SLM) process parameters on micro-structure and mechanical properties of 316L austenitic stainless steel. J. Mater. Process. Technol. 2017, 249, 255–263. [Google Scholar] [CrossRef]
- Wang, Z.; Palmer, T.A.; Beese, A. Effect of processing parameters on microstructure and tensile properties of austenitic stainless steel 304L made by directed energy deposition additive manufacturing. Acta Mater. 2016, 110, 226–235. [Google Scholar] [CrossRef] [Green Version]
- Xiong, Z.H.; Liu, S.L.; Li, S.F.; Shi, Y.; Yang, Y.F.; Misra, R.D.K. Role of melt pool boundary condition in determining the mechanical properties of selective laser melting AlSi10Mg alloy. Mater. Sci. Eng. A 2019, 740–741, 148–156. [Google Scholar] [CrossRef]
- Wang, Y.M.; Voisin, T.; McKeown, J.; Ye, J.; Calta, N.; Li, Z.; Zeng, Z.; Zhang, Y.; Chen, W.; Roehling, T.T.; et al. Additively manufactured hierarchical stainless steels with high strength and ductility. Nat. Mater. 2018, 17, 63–71. [Google Scholar] [CrossRef] [PubMed] [Green Version]
- Mower, T.M.; Long, M.J. Mechanical behavior of additive manufactured, powder-bed laser-fused materials. Mater. Sci. Eng. A 2016, 651, 198–213. [Google Scholar] [CrossRef]
- Fashanu, O.; Buchely, M.F.; Spratt, M.; Newkirk, J.; Chandrashekhara, K.; Misak, H.; Walker, M. Effect of SLM Build Parameters on the Compressive Properties of 304L Stainless Steel. J. Manuf. Mater. Process. 2019, 3, 43. [Google Scholar] [CrossRef] [Green Version]
- ASM Aerospace Specification Metals Inc, “AISI Type 304L Stainless Steel,” ASM Material Data Sheet. Available online: http://asm.matweb.com/search/SpecificMaterial.asp?bassnum=MQ304L (accessed on 3 January 2019).


Publisher’s Note: MDPI stays neutral with regard to jurisdictional claims in published maps and institutional affiliations. |
© 2021 by the authors. Licensee MDPI, Basel, Switzerland. This article is an open access article distributed under the terms and conditions of the Creative Commons Attribution (CC BY) license (https://creativecommons.org/licenses/by/4.0/).