Communication

Build Surface Roughness and Internal Oxide Concentration for Laser Powder Bed Fusion of IN718

by
Lonnie A. Smith
and
Petrus Christiaan Pistorius
*
Department of Materials Science and Engineering, Carnegie Mellon University, Pittsburgh, PA 15213, USA
*
Author to whom correspondence should be addressed.
J. Manuf. Mater. Process. 2022, 6(1), 25; https://doi.org/10.3390/jmmp6010025
Submission received: 16 January 2022 / Revised: 5 February 2022 / Accepted: 11 February 2022 / Published: 16 February 2022
(This article belongs to the Special Issue Frontiers in Digital Manufacturing)

Abstract

:
Oxidation of hot spatter during laser powder bed fusion results in the deposition of oxides on the build surface. In the case of IN718—as studied in this work—the oxide is alumina. While some of this surface oxide may be incorporated in the build, an oxygen mass balance indicates some oxygen removal during the building process. This work tested an expected effect of the roughness of the build surface on the concentration of micron-sized oxide inclusions that are incorporated in test coupons during building. The roughness of the build surface responded to changes in hatch spacing, in line with a simple geometric model of the overlap between adjacent beads. Samples with deeper grooves retained more oxide, resulting in a much larger concentration of oxide inclusions within the samples. The conclusion is that parts with lower inclusion concentrations can be produced by decreasing the hatch spacing, at the cost of a lower build rate.

1. Introduction

Additive manufacturing by laser powder bed fusion (LPBF) uses a laser that melts metal powder to build up a three-dimensional part. The part is built from layers with a fixed thickness (typically around 40 µm). To deposit each layer, the laser scans across the build surface; the distance between adjacent laser passes in each layer is termed the hatch spacing (H).
Various defects can form during LPBF, including solidification cracks and pores [1]. This work considers the concentration of oxide inclusions in IN718 parts produced by laser powder bed fusion. Oxide inclusions form by reaction of oxygen with dissolved aluminum in the alloy; the sources of oxygen are the passive film on the unmelted powder, larger oxides on reused powder, and gaseous oxidation in the build chamber [2,3]. The main mechanism by which oxygen is transferred from the chamber to the built part is by oxidation of hot spatter: liquid metal droplets that are ejected from the melt pool, oxidized, and fall back onto the build surface [2]. The size and concentration of the resulting oxide inclusions affect the fatigue resistance of LPBF products [4,5].
Examination of the build surface of LPBF products shows substantial coverage by deposited aluminum oxide, typically covering 5–10% of the surface (Figure 1), with an average oxide thickness of approximately 0.5 µm [2]. If all of this deposited alumina were to be incorporated into the build upon deposition of subsequent layers, the resulting increase in oxygen content in the build would be some 300 ppm (parts per million, by mass)—in addition to the 100–200 ppm oxygen contributed by the powder [2]. In fact, the total oxygen content of LPBF builds of IN718 is typically around 200 ppm [2]; in some cases, the oxygen content of build coupons is even lower than in the powder [6]. From these observations, the final oxygen concentration (and oxide inclusions content) in built parts is the result of opposing effects: oxygen pick-up by oxidation and deposition of spatter, and oxygen removal.
One possible oxide removal mechanism is by interaction of the recoater bar with the build surface: the recoater is known to remove adherent powder particles [7] and may similarly remove oxides. The work presented here tested whether the roughness of the build surface has the expected effect on oxide removal.
The experimental work involved building coupons with different hatch spacings, and then measuring the concentrations of oxides on the build surface (examples are shown in Figure 1), and within the coupons. Two possible opposing effects of hatch spacing were identified, as follows:
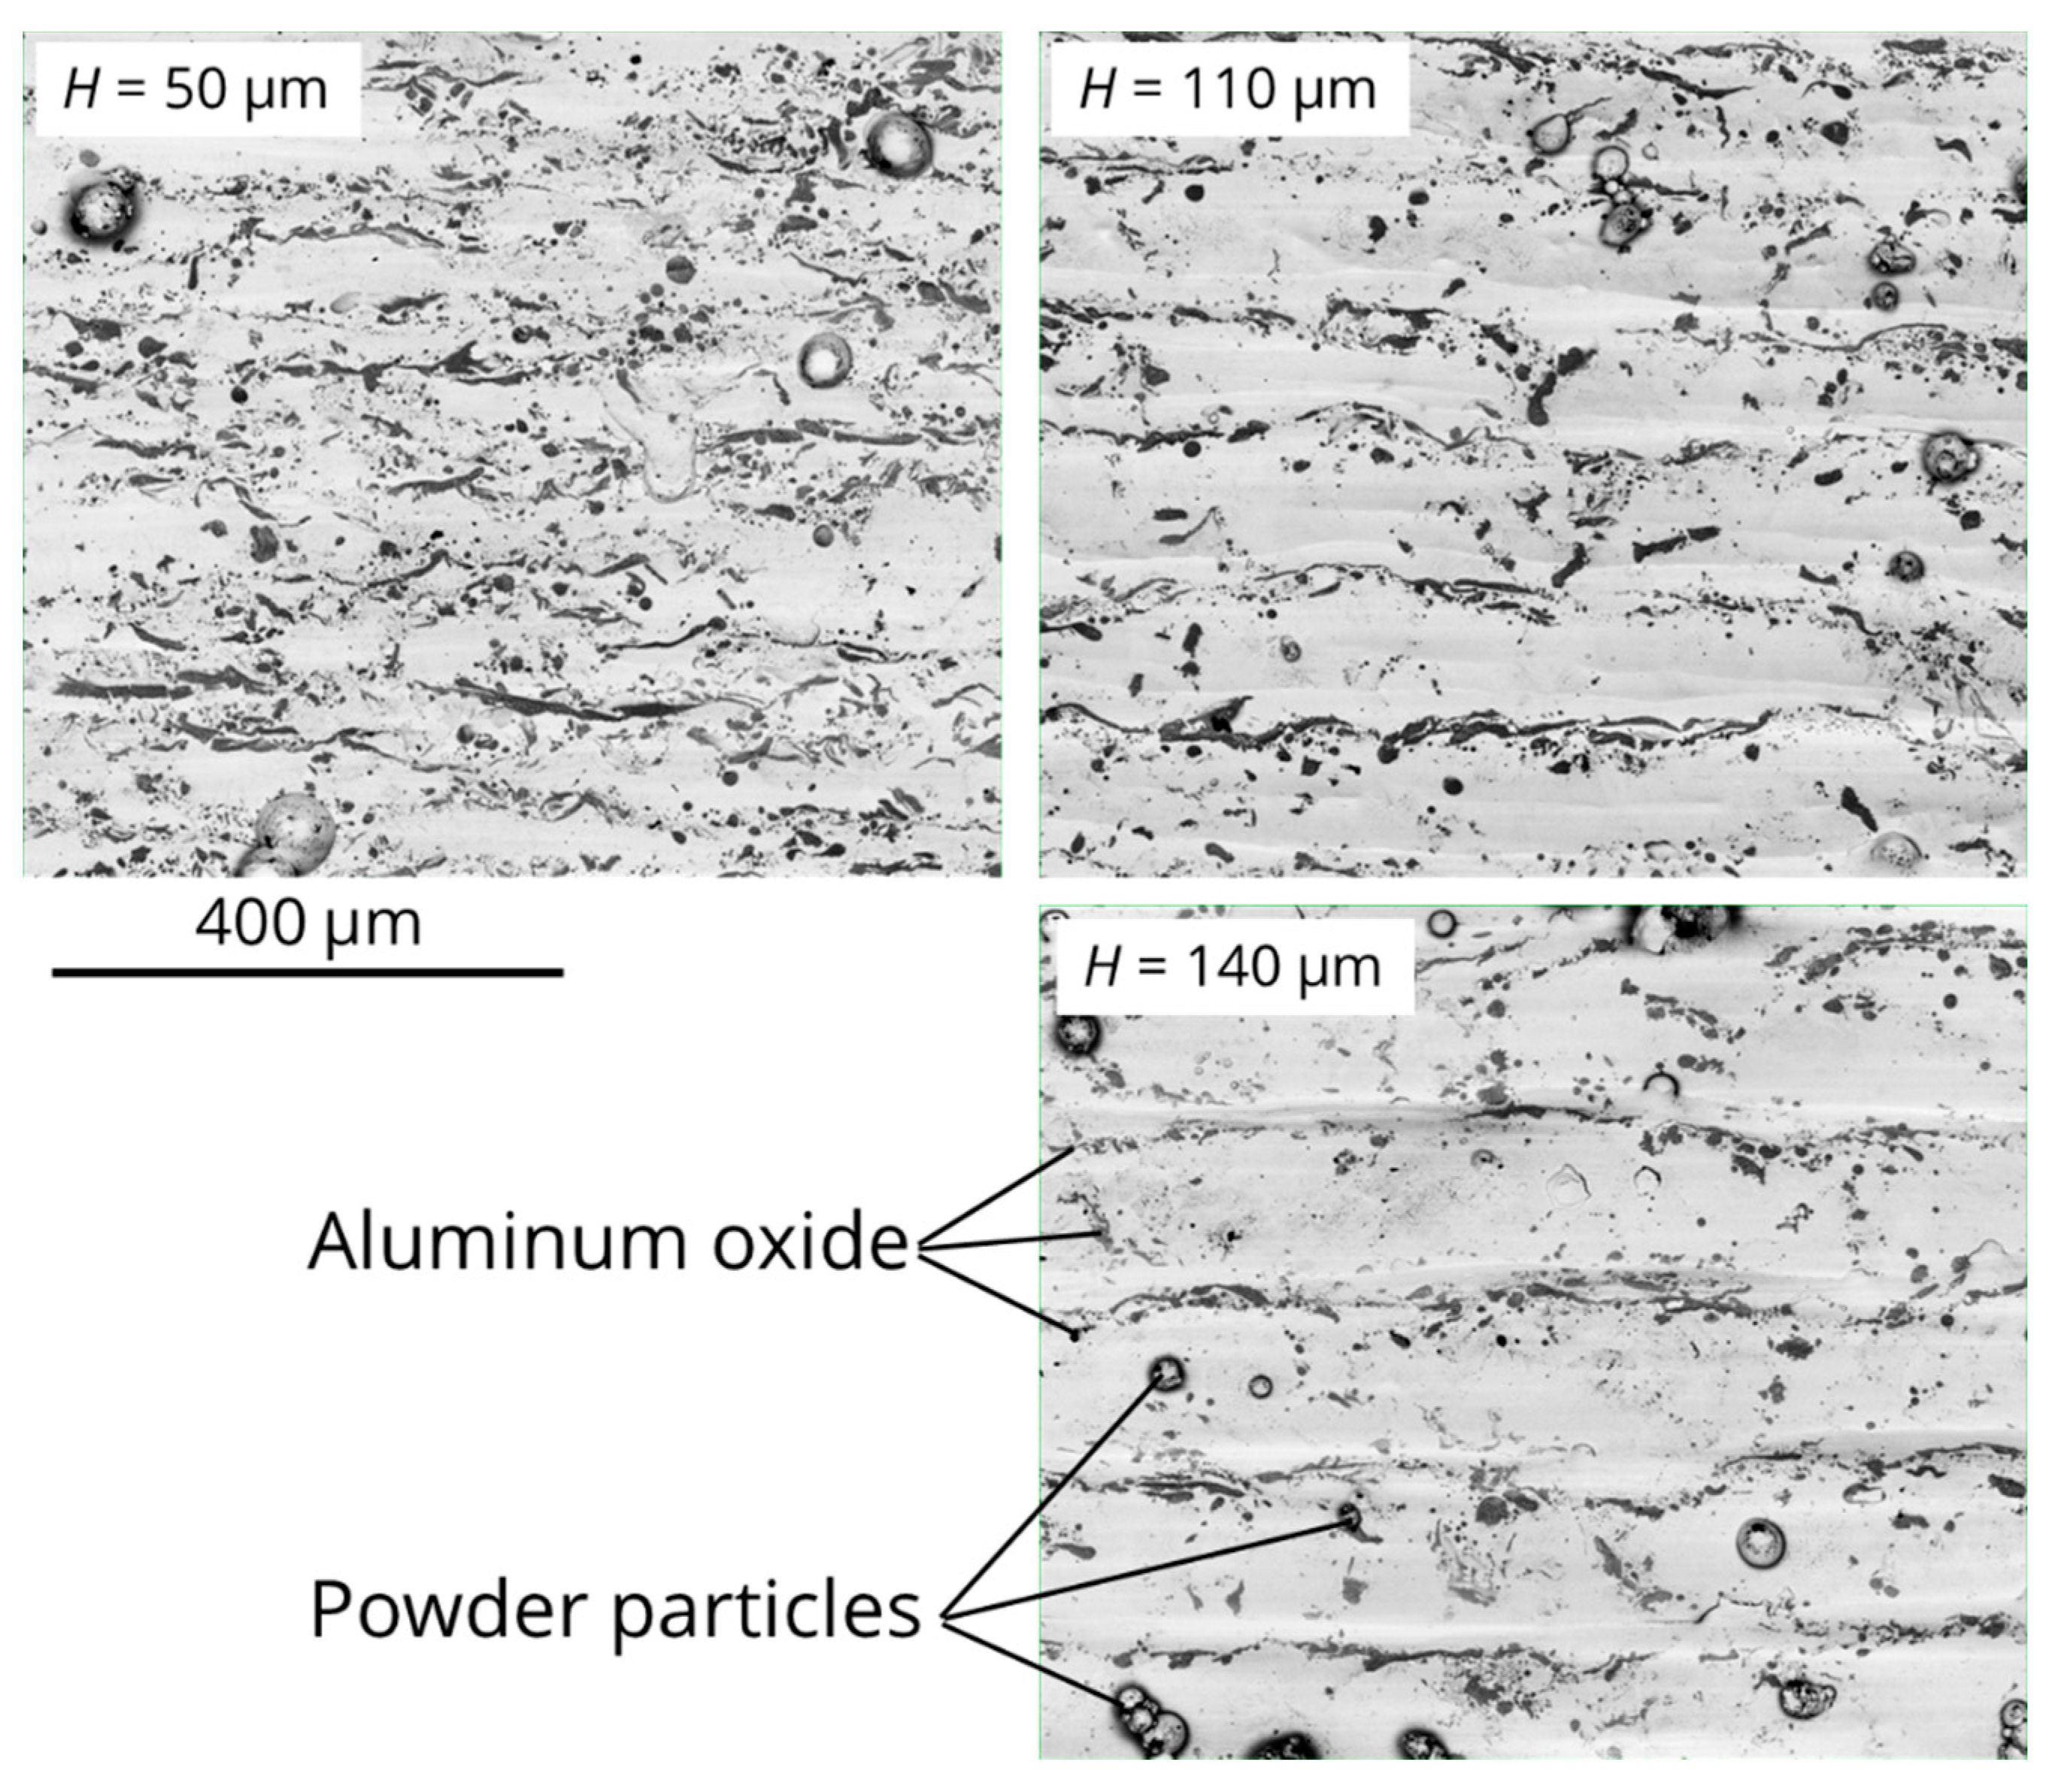
  • If the hatch spacing is smaller, more laser-melted beads cover the surface of the part. This would result in more spatters being produced (for a given amount of material deposited). This effect is evident in Figure 1 (and quantified later).
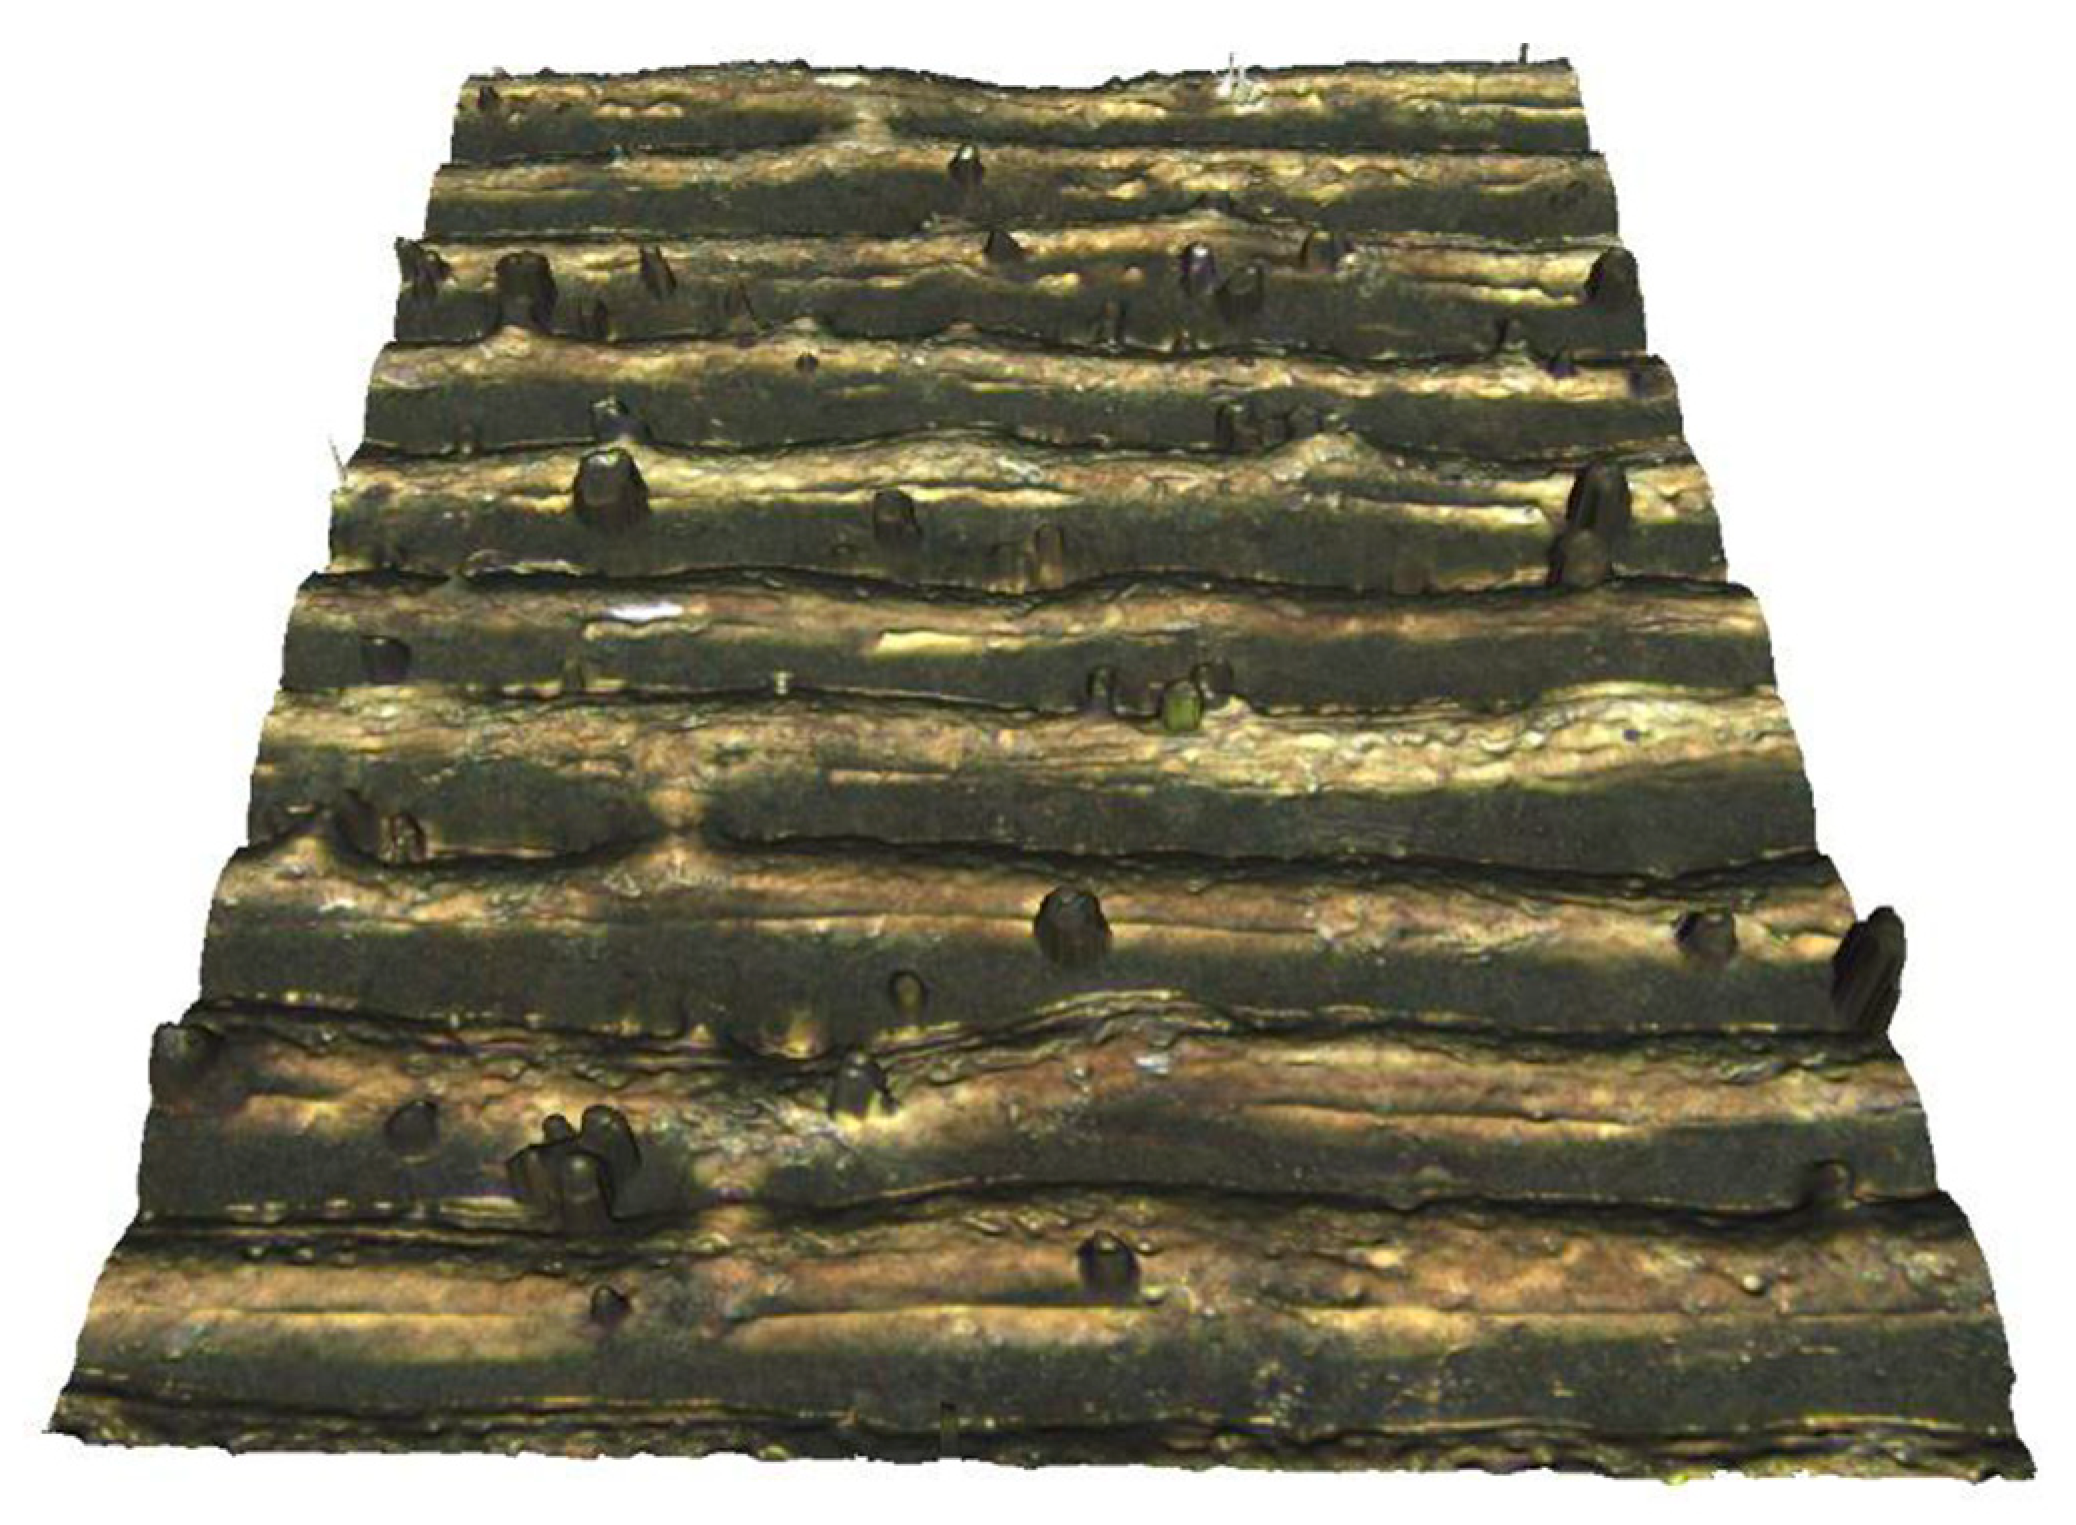
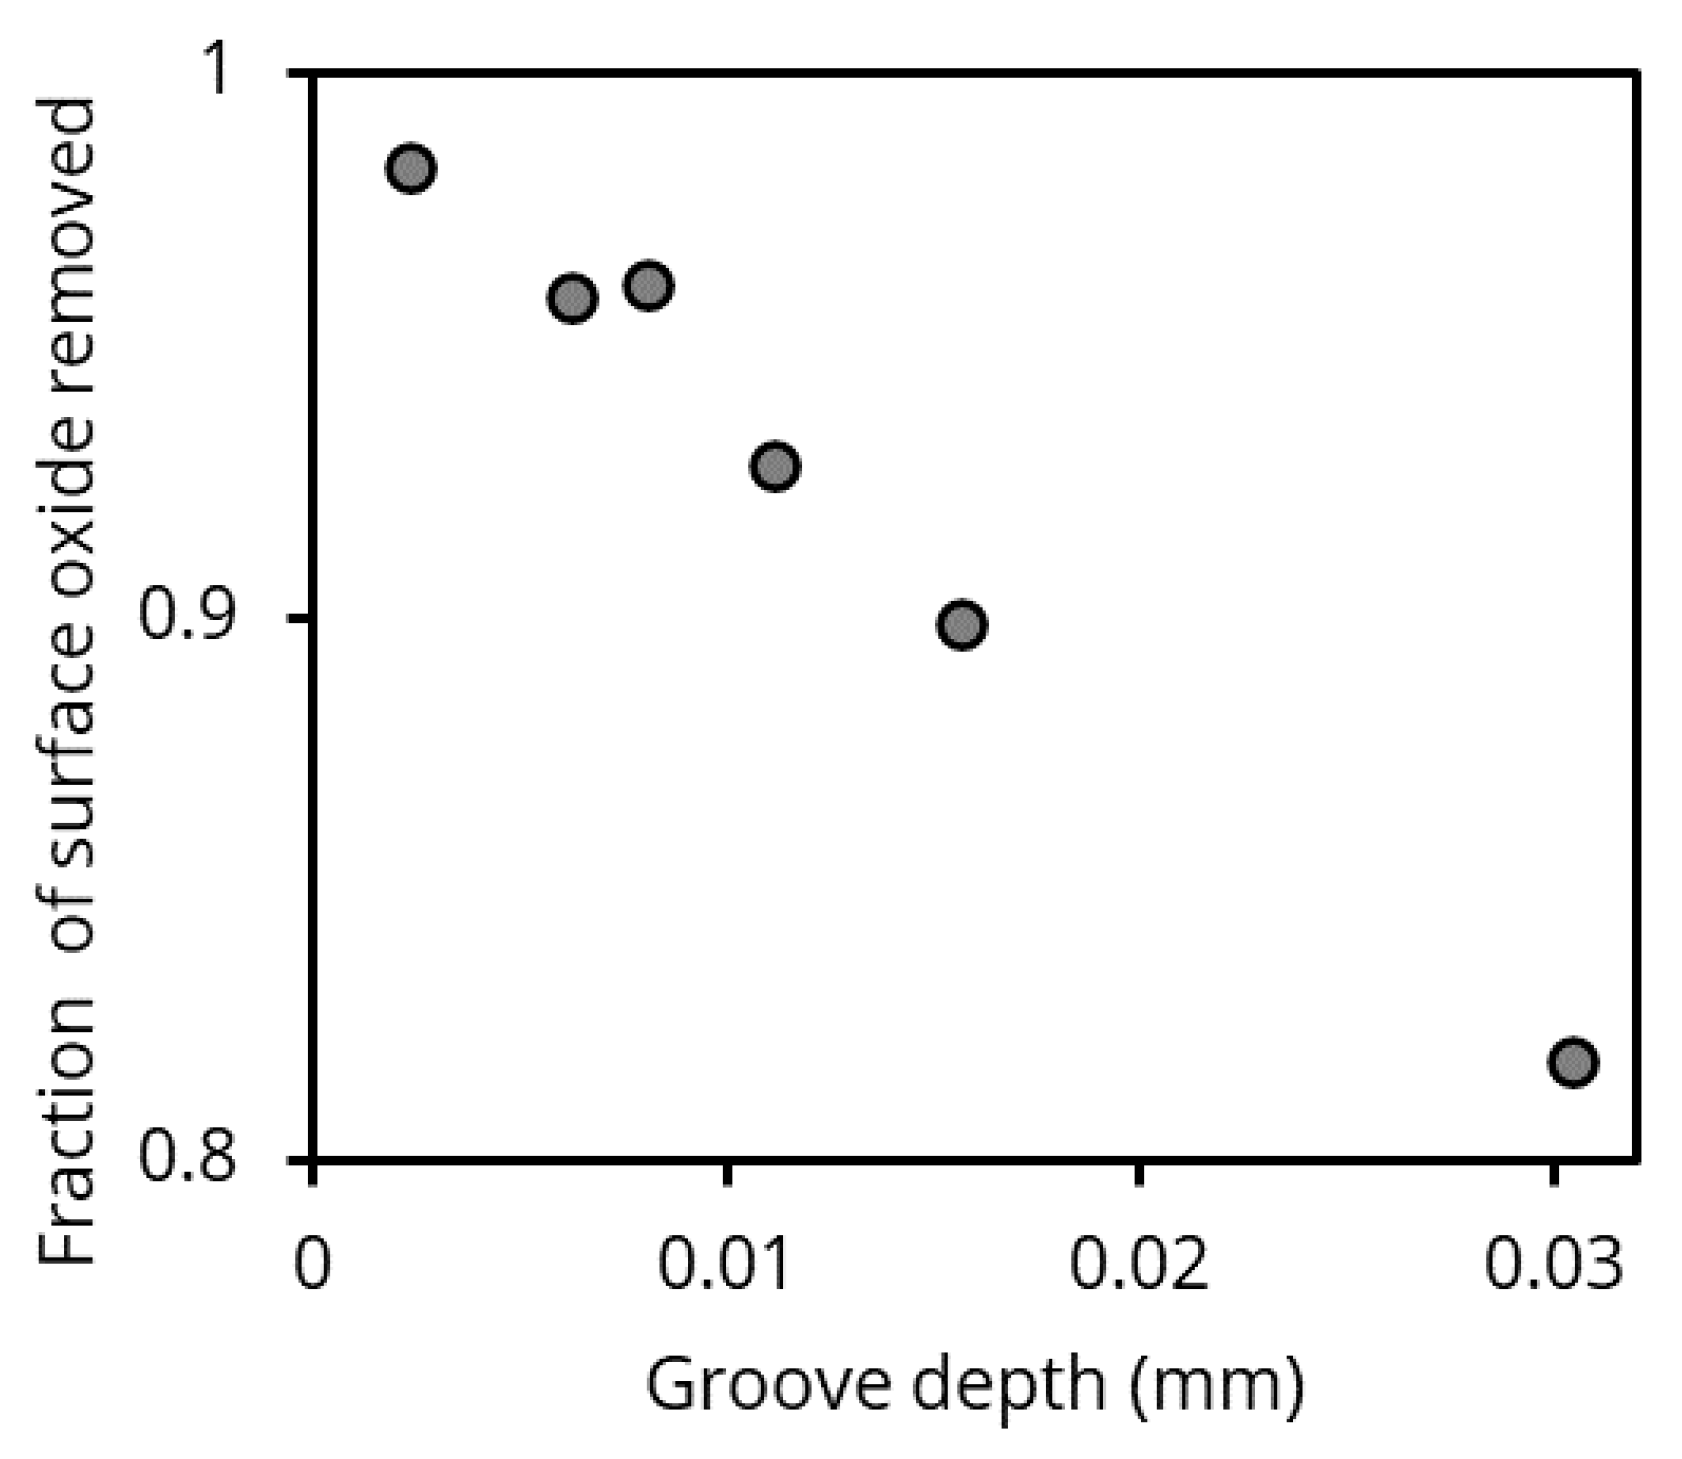
  • Smaller hatch spacings also result in a smoother build surface, with shallower grooves between adjacent beads. As noted above, recoating has been shown to remove particles from the build surface. In this work, we tested the idea that a smoother surface would promote removal of oxide from the build surface during recoating.
The contribution of this work is that both build surface oxides and internal oxides were measured, quantifying the extent to which build surface oxides were incorporated during part building. These measurements were performed on samples built with several different hatch spacings, allowing the opposing effects of decreased hatch spacing to be evaluated. The aim of the work is to improve understanding of the quantitative link between building conditions and the oxide concentration in LPBF parts, to be able to improve the internal quality of parts.

2. Materials and Methods

2.1. Sample Builds and Characterization

Test coupons were cubes with 10 mm side lengths, built with an EOS M290 using standard parameters (laser scan speed 960 mm/s, laser power 285 W, and layer thickness 40 µm), except that the hatch spacing was varied from 50 µm to 140 µm (standard is 110 µm). Laser scans were parallel to the cube sides, and rotated by 90° between layers. An image of the IN718 powder is shown in Figure 2. The composition (major elements) of a sample built in this way is given in Table 1.
After the build, test coupons were cut from the base plate using electrical discharge machining (EDM).
The top surface of the build was imaged using backscattered electron imaging (as the example in Figure 1), and the surface concentration of (dark) aluminum oxide was found by image analysis of the electron images. The surface profile was measured with a Keyence VR-5000 or Alicona InfiniteFocus optical profilometer; an example is given in Figure 3. The surface profile was used to determine the groove depth between adjacent laser passes; at least 25 grooves were measured for each build condition.
The coupons were subsequently cut in half vertically (parallel to the build direction) by EDM, mounted in bakelite resin and metallographically polished to a 1 µm finish using diamond suspension.
Automated inclusion analysis was performed on the polished surfaces using a TESCAN MIRA3 scanning electron microscope with Oxford INCA Feature software, locating inclusions by backscattered electron imaging, followed by energy-dispersive X-ray microanalysis (EDX). Details of the approach have been reported elsewhere [8]. Analyses were performed at 20 kV accelerating voltage. For locating possible features, the magnification was 800×, using an image of 512 × 512 pixels. For each sample, an area of 3 × 3 mm2 was analyzed, located at the center of the polished section. The smallest inclusion that could be detected by this method had an area of 0.26 µm2 (equivalent circle diameter 0.58 µm) on the polished plane.
The melt pool size was measured on the last layer (at the top of the sample) after electrolytic etching of the polished section (electrolyte: 10% oxalic acid in water). For all the hatch spacings, the overlap between melt pools was sufficient to ensure complete melting (no unfused regions remained) [9].
Some samples were deep etched to reveal the three-dimensional shape of oxide inclusions (etched at approximately 1 A/cm2 for 90 s in anhydrous methanol containing 10% acetylacetone and 1% tetramethylammonium chloride).

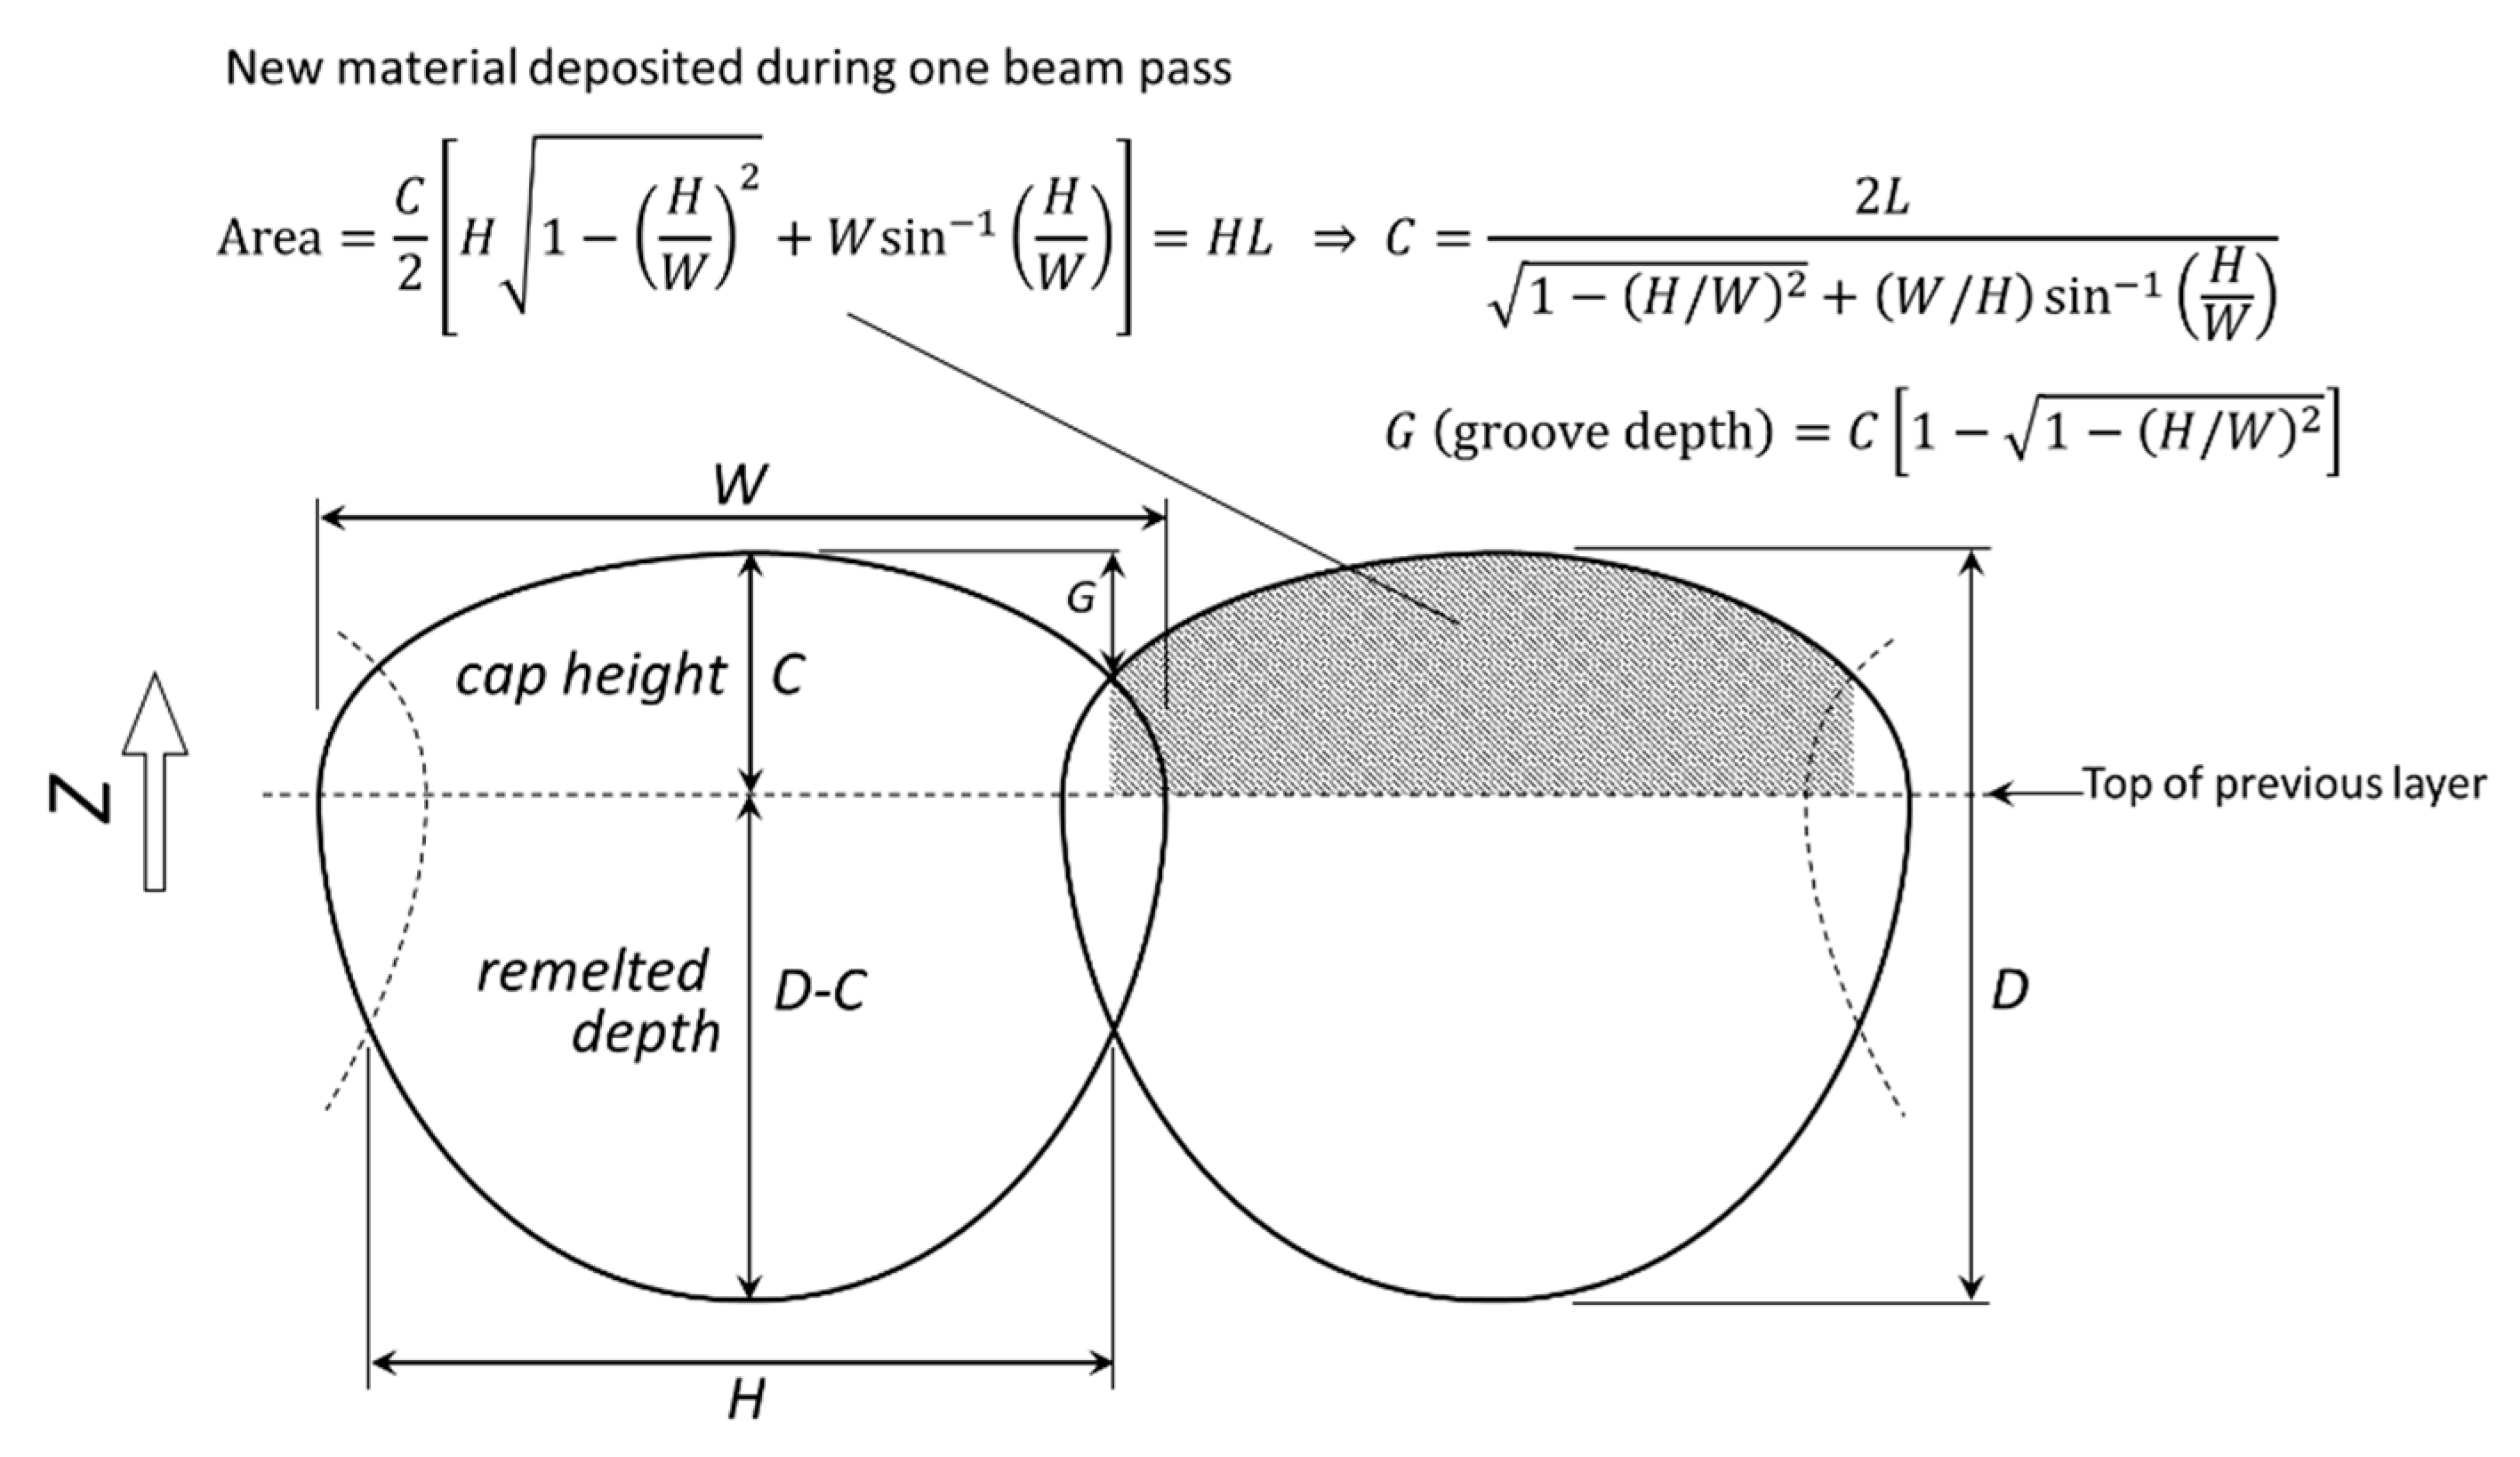
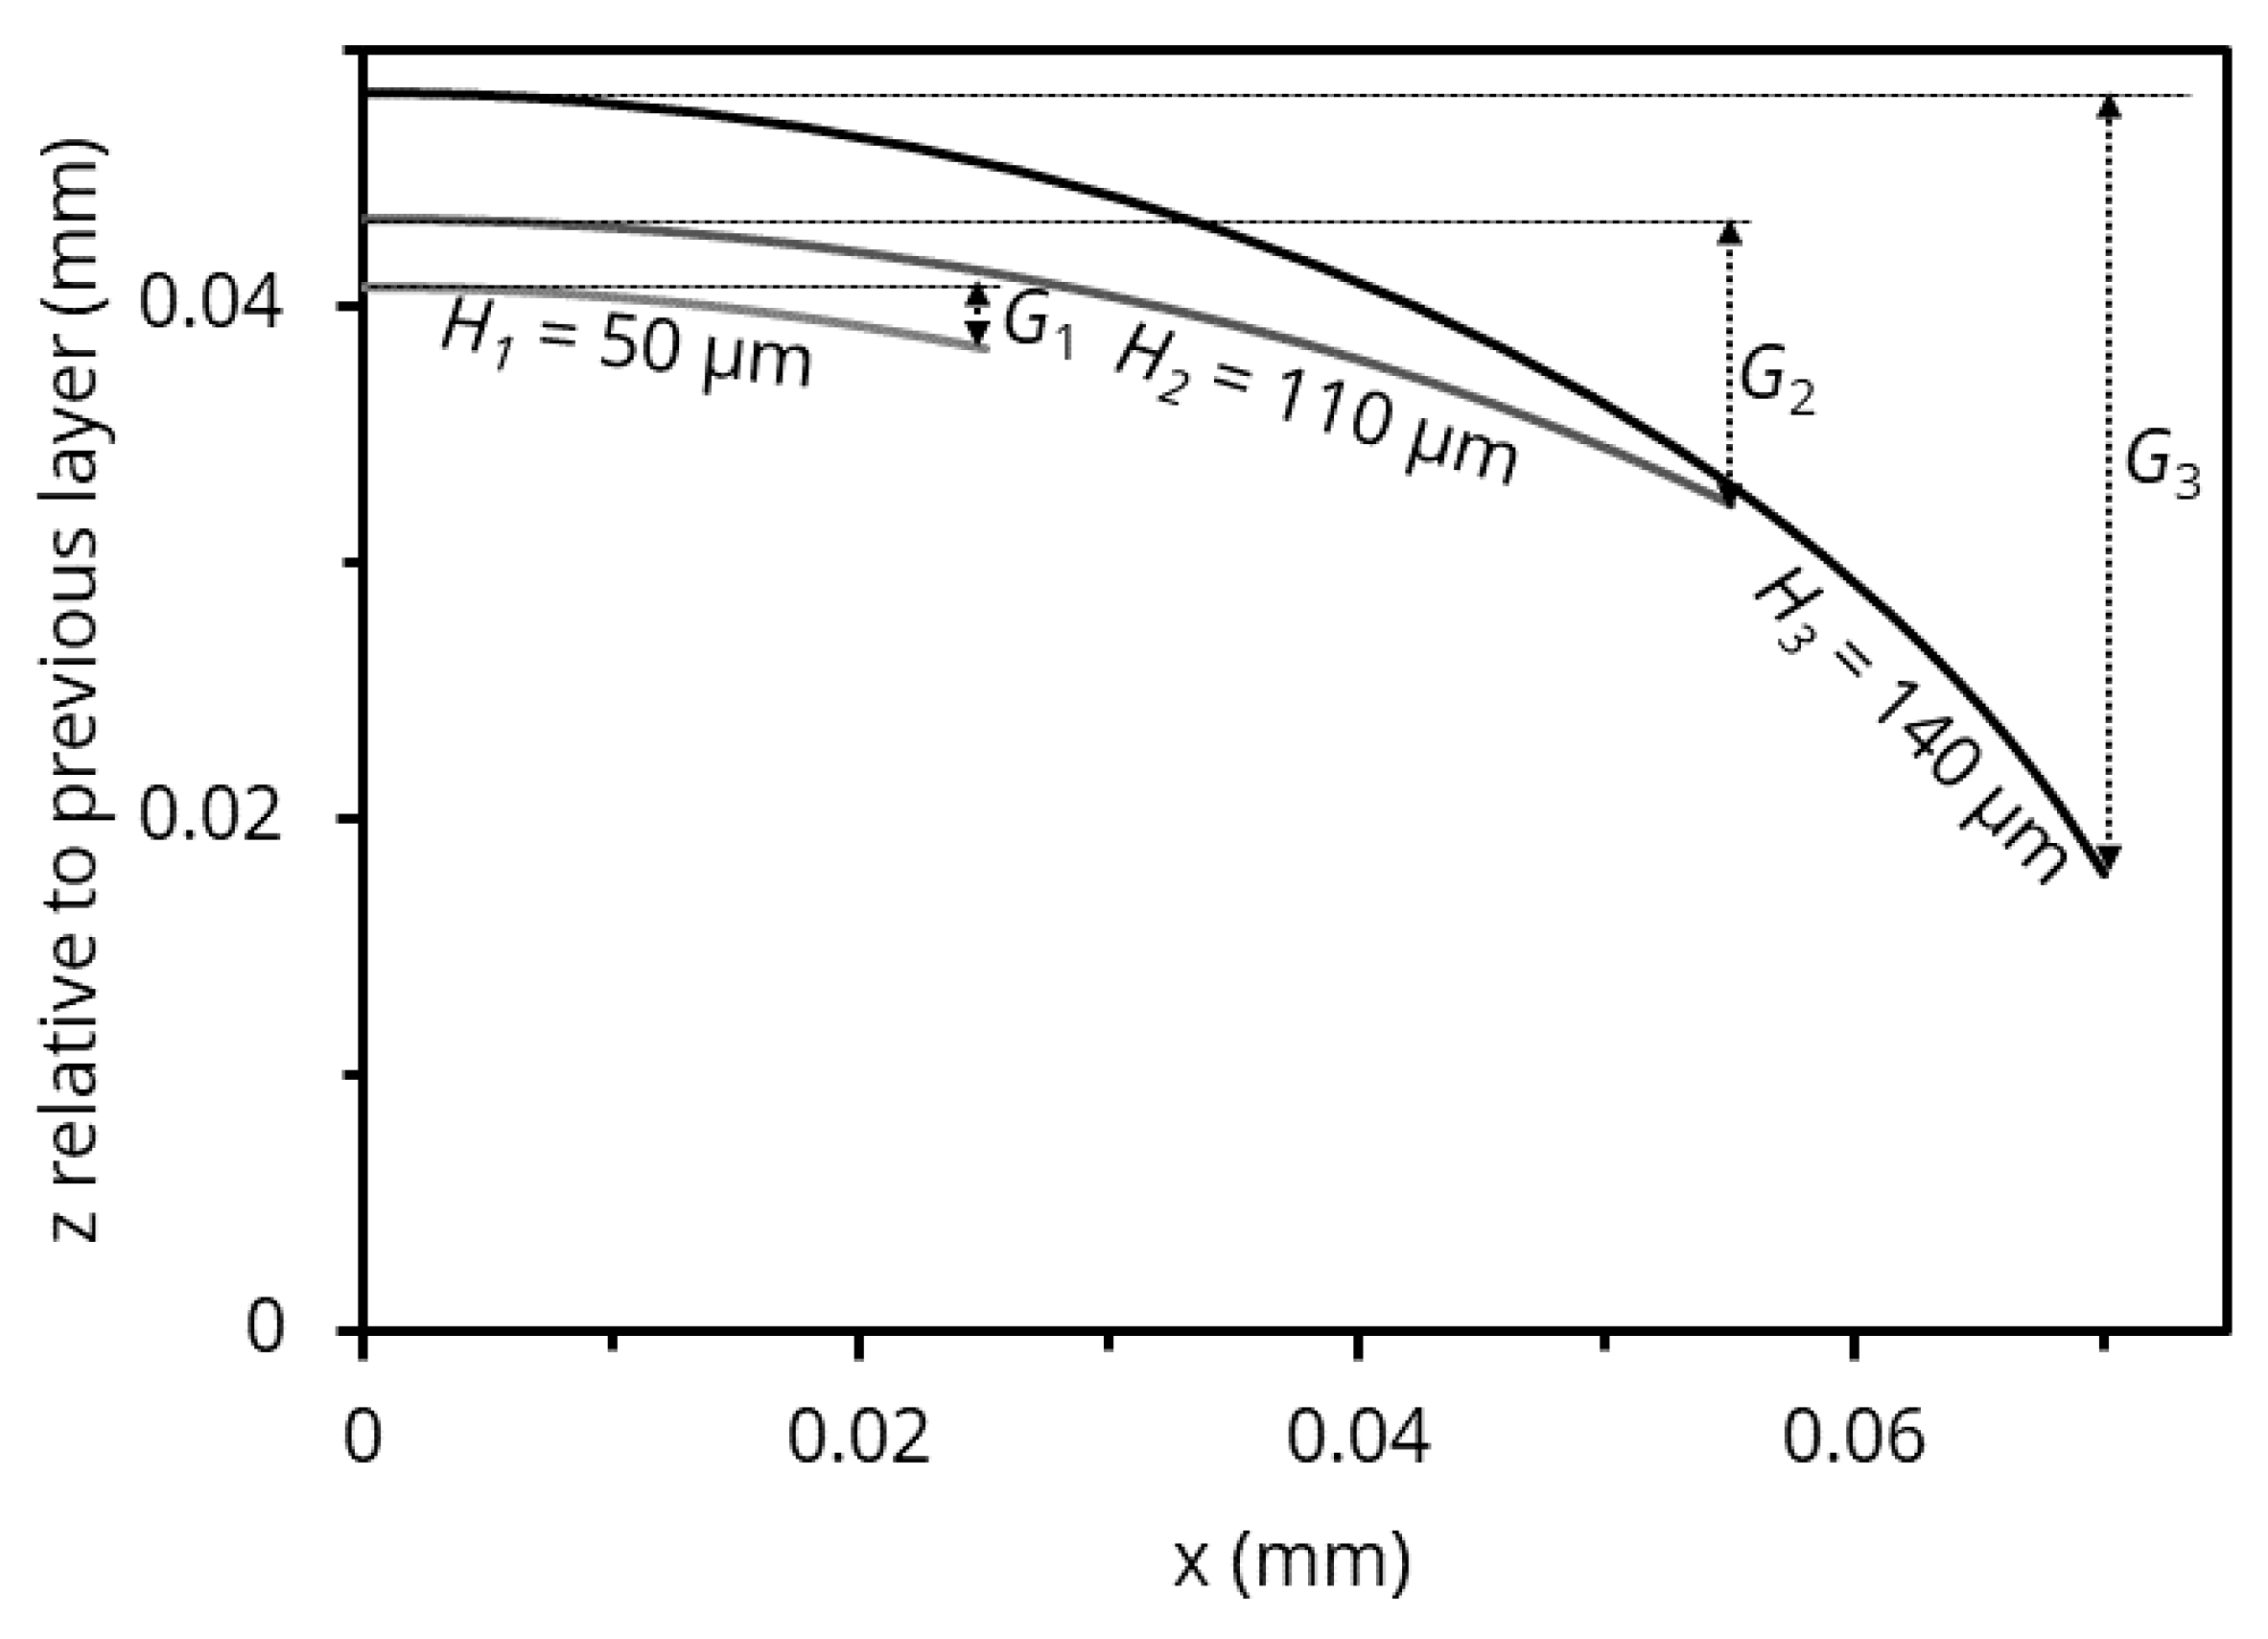
2.2. Predicted Effect of Hatch Spacing on Groove Depth

The effect of hatch spacing on the surface profile was predicted using the geometric relationships shown in Figure 4. The assumption is that the cross-section of the deposited material (“cap”) can be approximated with a half-ellipse with major axes W (where W is the width of the melt pool) and 2C (where C is the height of the cap). In the figure, the shaded region is the cross-sectional area of the material deposited in one laser pass; the area under an ellipse provides the analytical relationship between the melt pool width, hatch spacing, cap height, and the deposited area [10]. The basic mass balance is that the cross-sectional area of the metal deposited in one laser pass is equal to HL, where H is the hatch spacing and L is the layer thickness. Equating HL to the deposited area leads to the analytical expression for the cap height shown in the figure. The groove depth is found from the equation for the ellipse, and shown in the figure. Figure 5 illustrates the expected groove depths for three hatch spacings (spanning the range tested in this work), showing the large range of predicted depths.

3. Results and Discussion

The measured and predicted parameters for coupons built with different hatch spacings are summarized in Table 2.

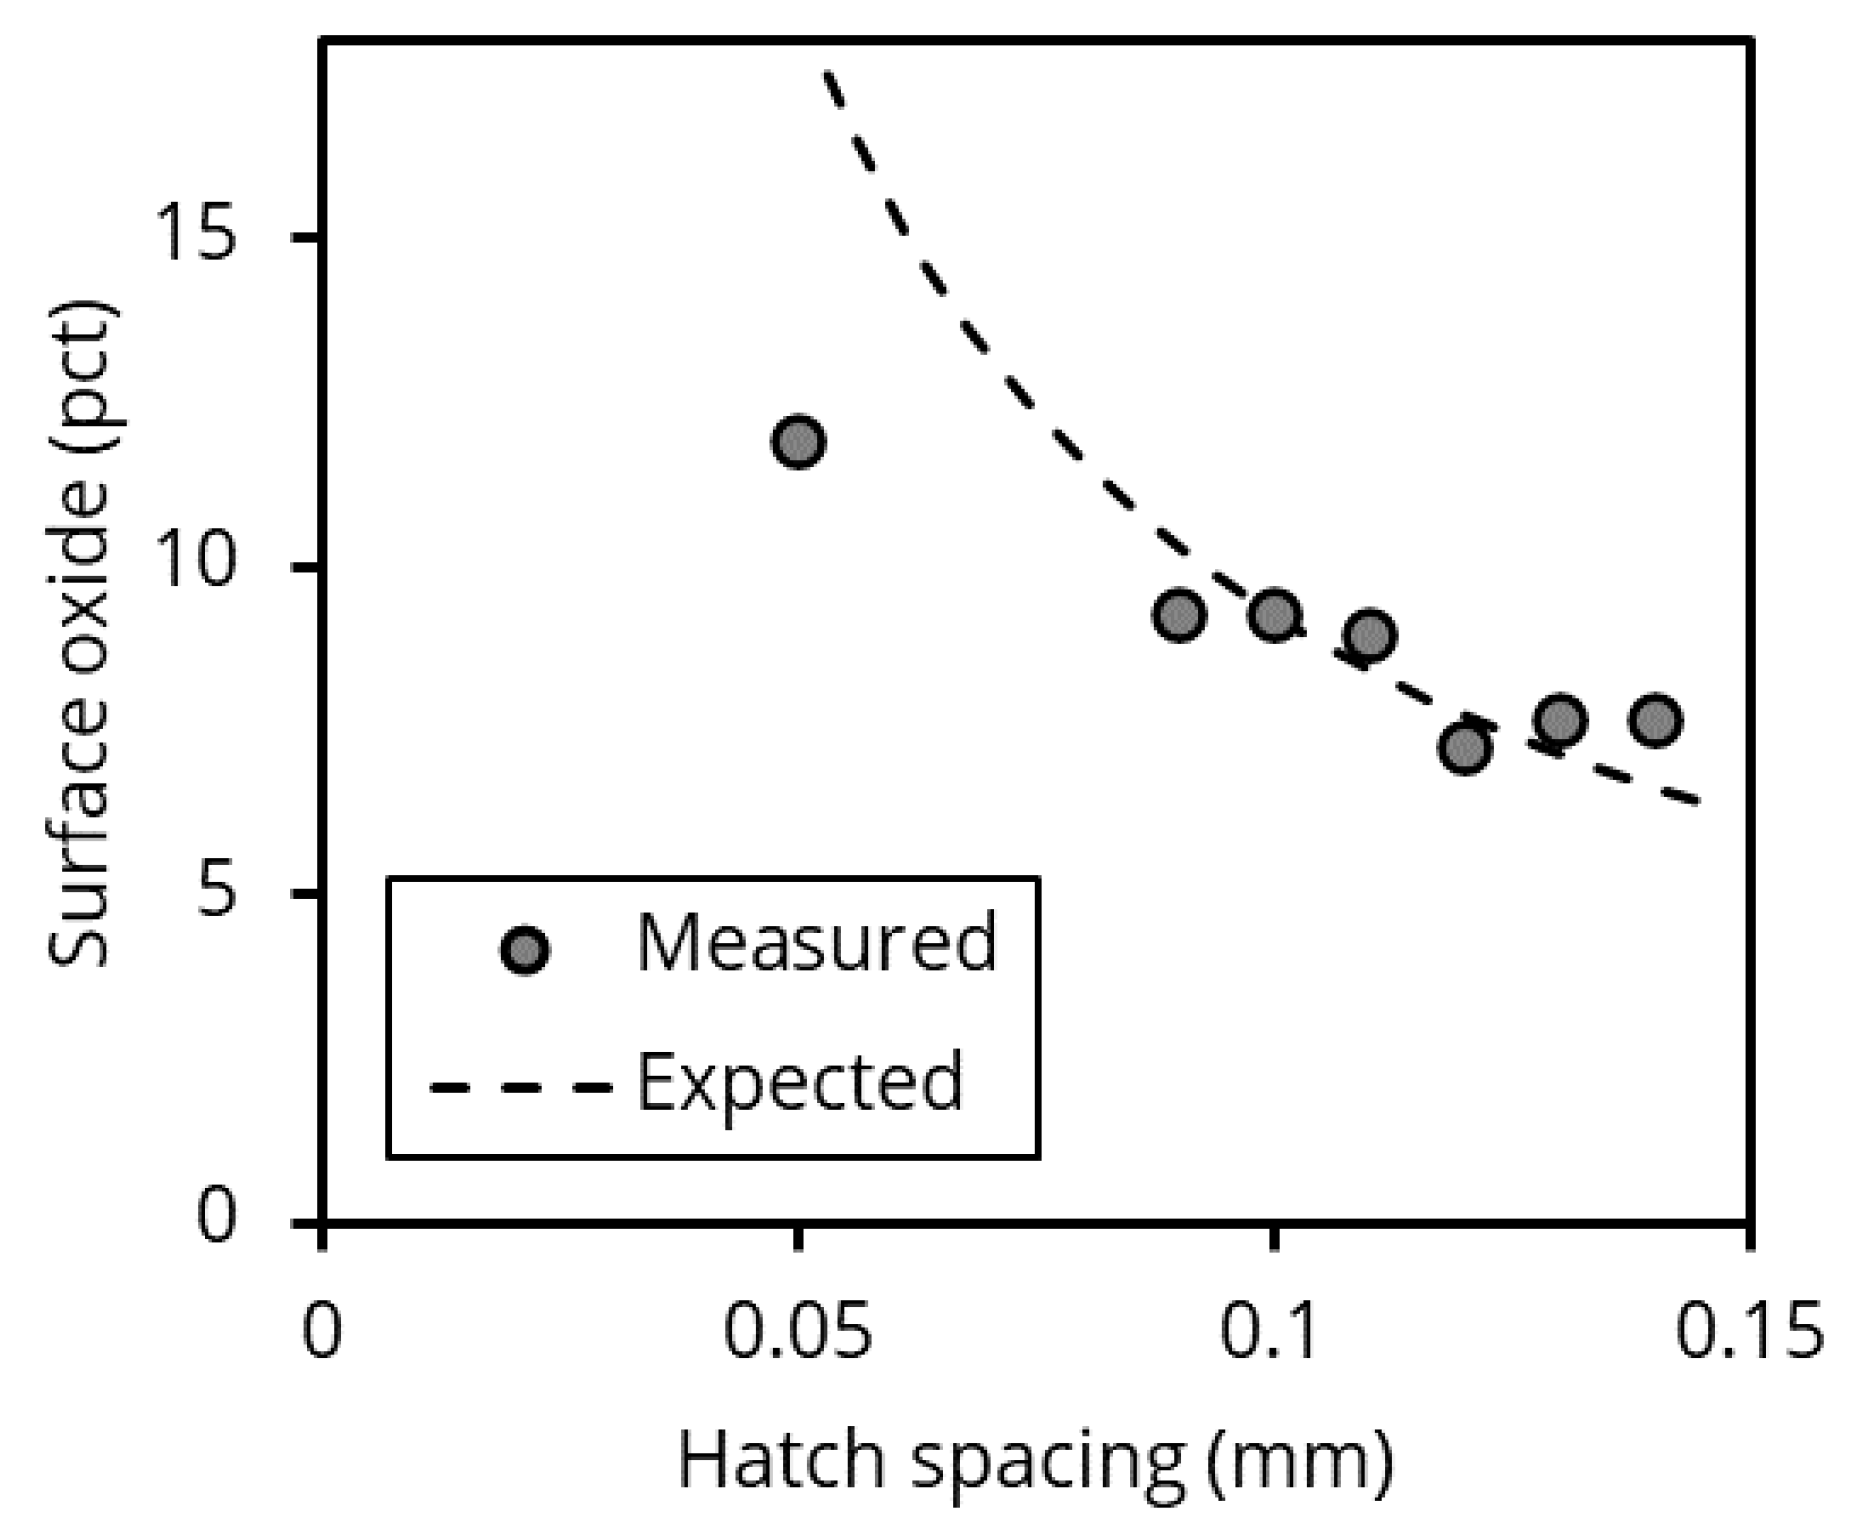
3.1. Oxides on Build Surface

Since the oxide deposited on the build surface originates from spatter, the total amount of deposited oxide should be proportional to the total duration of sample melting by the laser. That is, for a constant coupon build area and scan speed (as used here), the amount of deposited oxide should be inversely proportional to the hatch spacing. Figure 6 compares this expected relationship with measured oxide coverage. The broken line in Figure 6 shows the expected inverse proportionality relationship between surface coverage by oxides and the hatch spacing; the line was arbitrarily chosen to pass through the data point for a hatch spacing of 0.1 mm. While the observed effect is weaker than predicted, smaller hatch spacings do result in greater surface concentrations of oxide. If all the deposited oxide were incorporated into the coupons, the result would have been a higher concentration of oxide inclusions in coupons built with smaller hatch spacings. This is the opposite of what was found, as discussed below.

3.2. Oxide Inclusions within Coupons
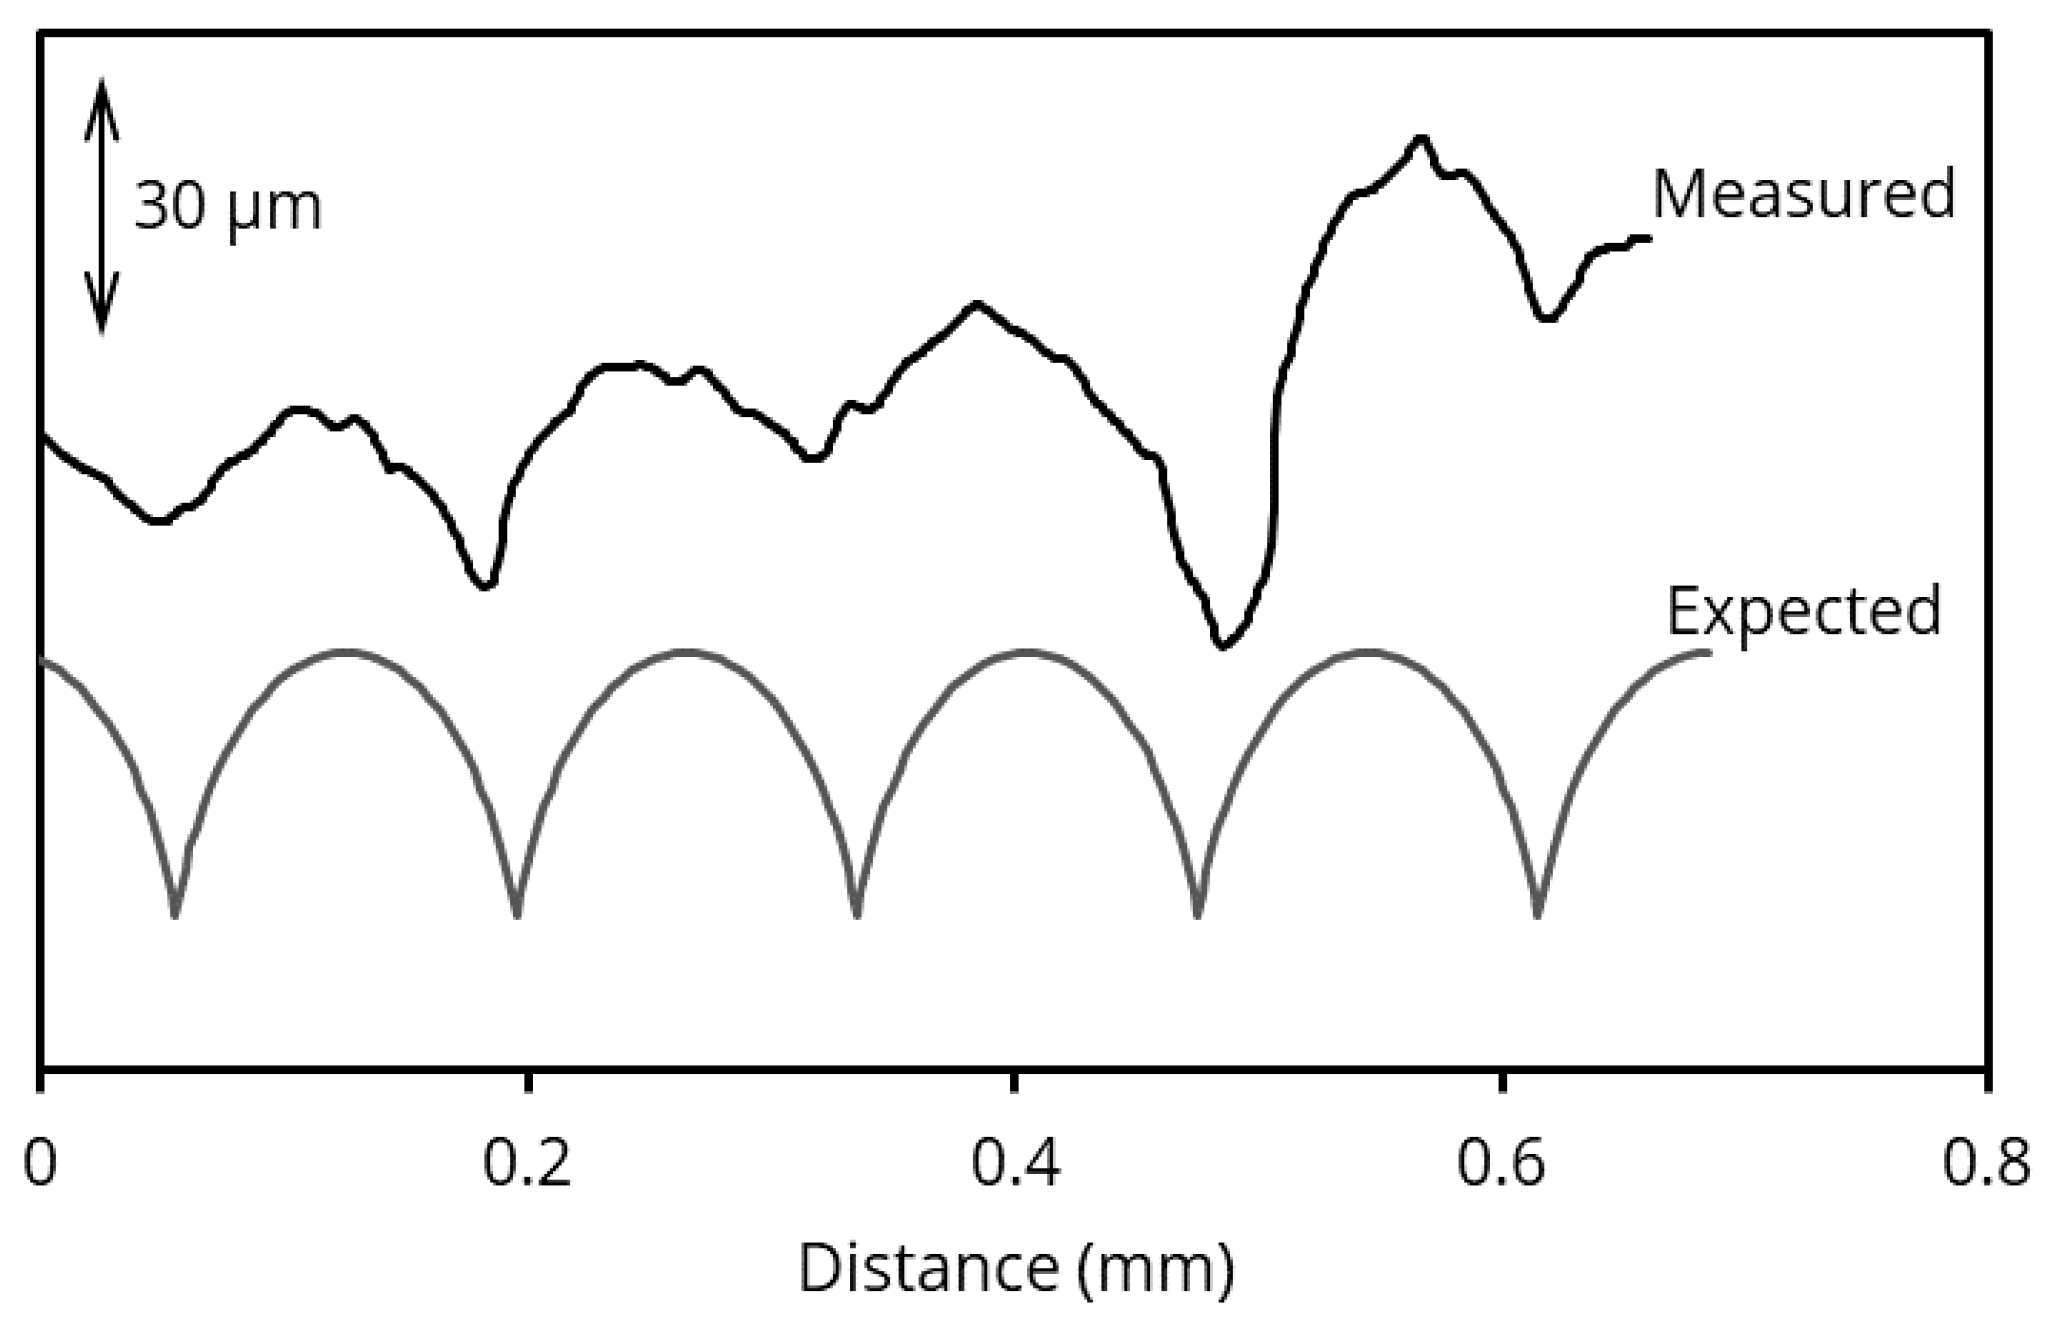
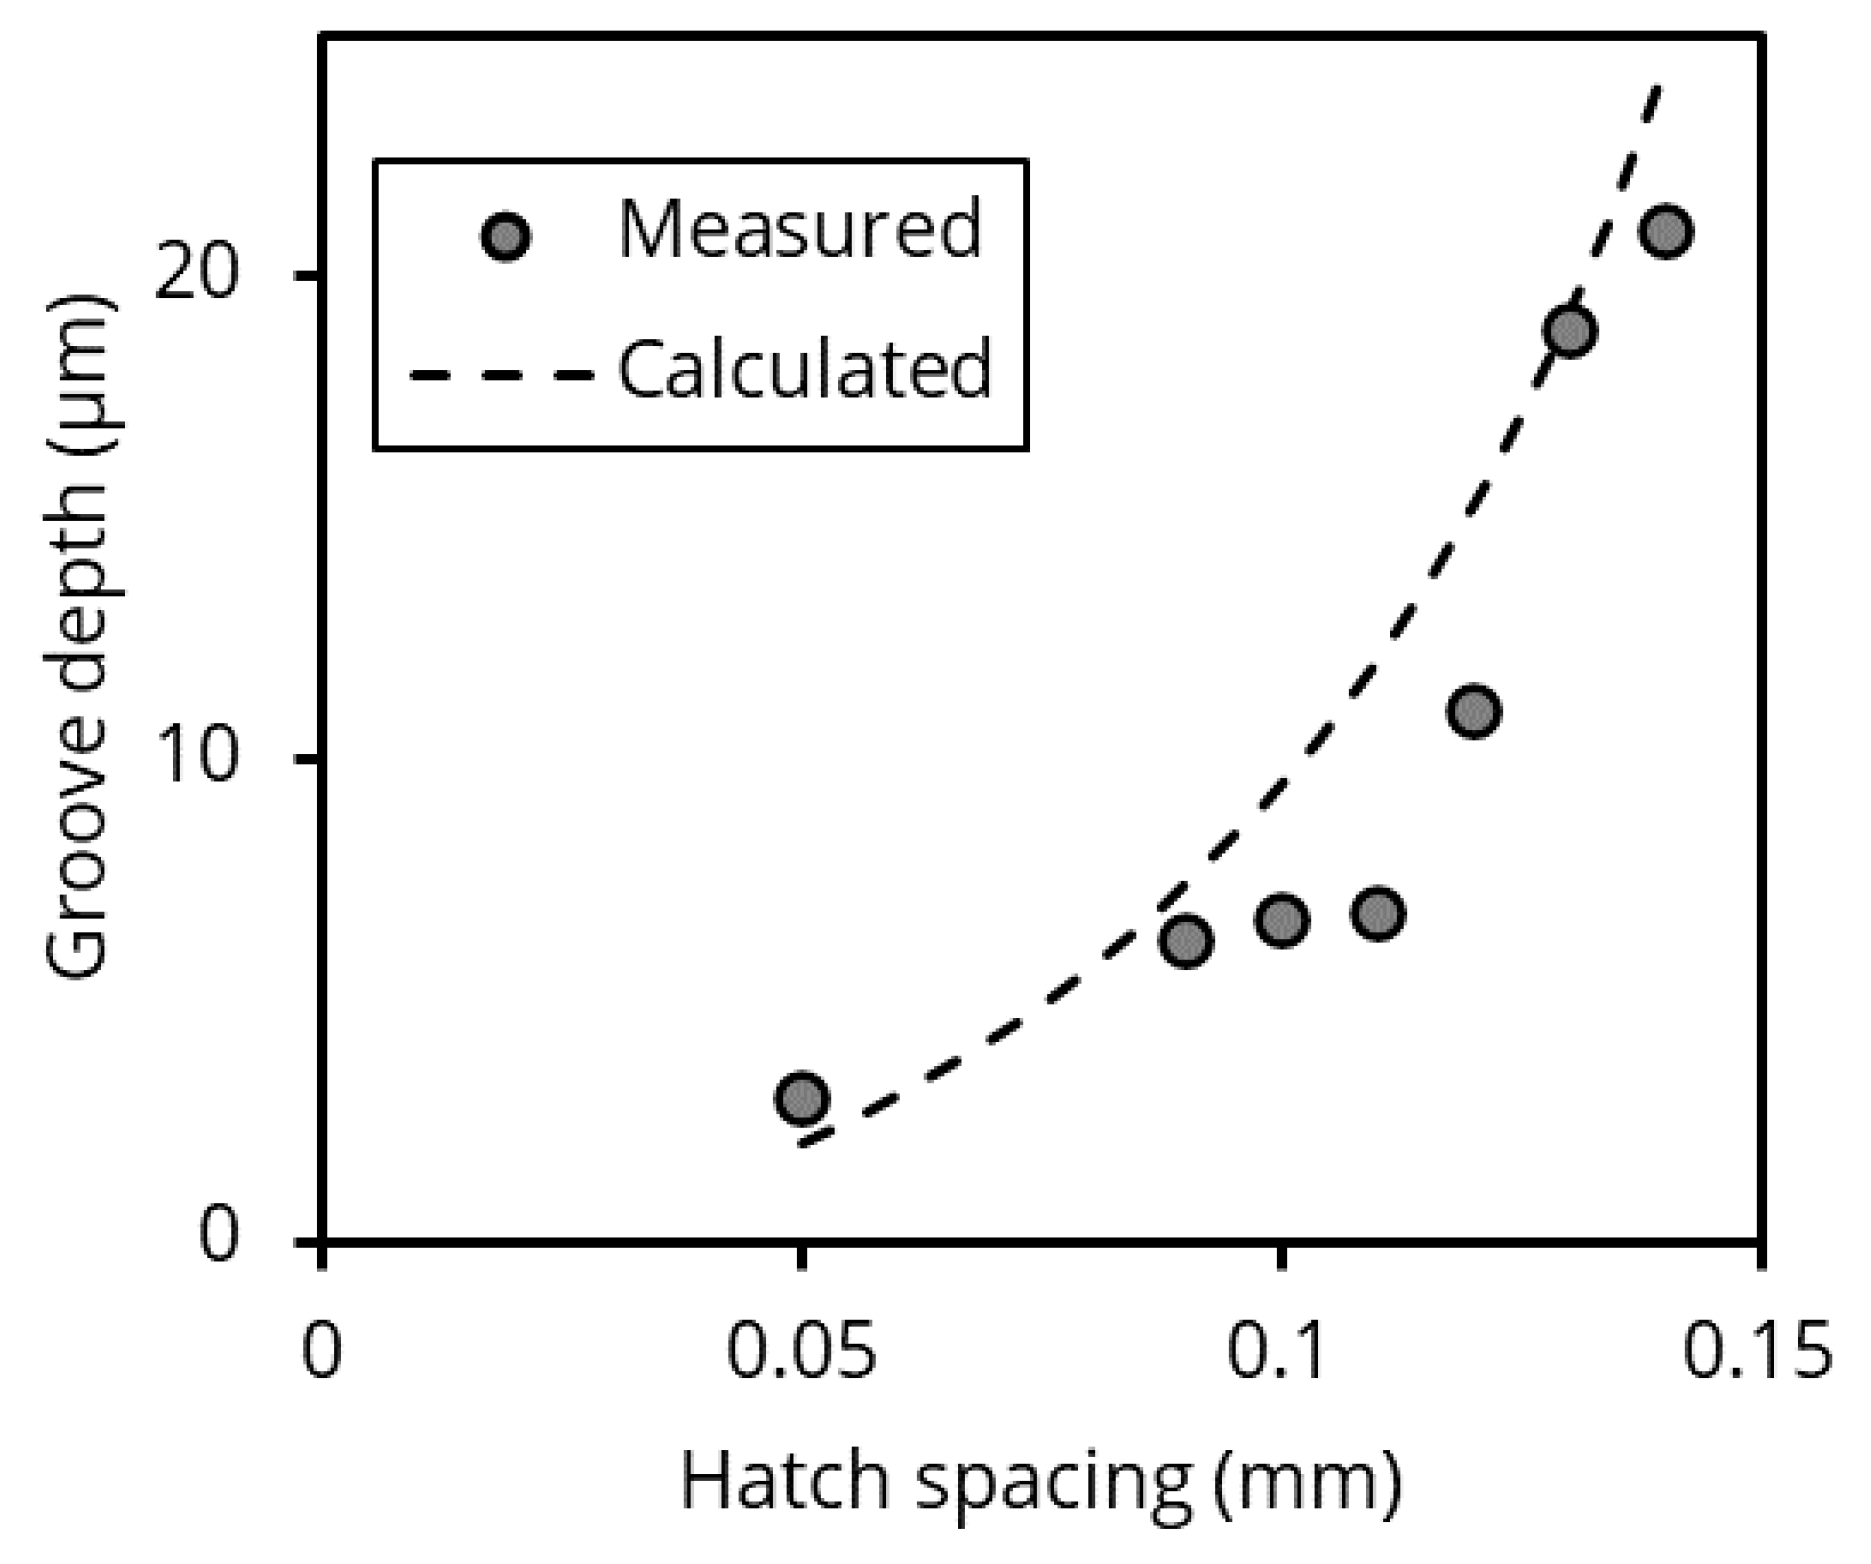
Typical examples of the oxide inclusions found within the coupons (Figure 7) illustrate the two main inclusion shapes: elongated oxides (with large aspect ratios, similar to the oxide deposited on the build surface) and near-spherical inclusions. Such spherical oxides were not found on the build surface; spheroidization likely occurred by reworking of the oxides within the melt pool, under the influence of the energy of the interface between the solid aluminum oxide and the liquid metal. The elongated oxides had sharp ends and lengths exceeding 10 µm; their shape and size are expected to be detrimental to fatigue resistance.
Coupons built with larger hatch spacings contained more inclusions of all sizes; Figure 8 gives the inclusion size distribution. The total area fraction of oxides is also summarized in Table 2; this area fraction (measured on the two-dimensional polished surface) is equal to the volume fraction of oxides within the coupons.
The values show that the amount of oxygen bound in these large inclusions is small compared with the total oxygen. The total oxygen content of IN718 parts produced by LPBF is typically around 200 ppm (parts per million by mass). In comparison, for standard build conditions (hatch spacing of 110 µm) the total area fraction of oxide inclusions (with areas ≥0.26 µm² on the polishing plane) was 81 ppm. An oxide volume fraction of 81 ppm corresponds to an oxygen mass fraction of 19 ppm, taking the oxides to be stoichiometric Al2O3 with a density of 3.99 g/cm3 and the alloy density to be 8.1 g/cm3 [11,12]. Thus, for standard building conditions, only about 10% of the total oxygen is present as oxide inclusions larger than approximately 0.5 µm. While these large oxides contain only a fraction of the total oxygen, their effect on fatigue resistance would be disproportionately large, given both their size and shape. One implication is that total oxygen in built parts would not necessarily correlate with fatigue resistance; rather, it is necessary to quantify the size and shape of the larger detrimental oxide inclusions.

3.3. Groove Depth

Figure 3 illustrates that the surfaces of the deposited beads were uneven and did not exactly follow the simple geometry of Figure 4. As a result, the measured surface profile showed variable groove depths (Figure 9), unlike the predicted even profile. (The expected surface profile in Figure 9 was calculated based on the assumption that the cap shape can be described as part of an ellipse, using the equations shown in Figure 4 with the imposed hatch spacing and the average measured melt pool width.) However, the change in average measured groove depth with hatch spacing is similar to the predicted trend (Figure 10) (the expected groove depth in Figure 10 was calculated with the equations shown in Figure 4, using the average of the measured melt pool widths, as shown in Table 2). The results confirm that it is possible to control the roughness of the build surface by manipulating hatch spacing.
The results support the proposed effect of groove depth on the concentration of oxides within builds: coupons built with deeper surface grooves (larger hatch spacings) have higher inclusion concentrations (Figure 11). In this figure, the trends of the volume fraction and number of inclusions with groove depth are similar, indicating that the average inclusion size remained similar for different hatch spacings. This is also illustrated by the size distributions in Figure 8, showing more inclusions of all sizes for samples built with larger hatch spacings.
Since the samples built with smaller hatch spacings had more oxides on the build surface (Figure 6), while having fewer inclusions within the samples (Figure 8 and Figure 11), a larger proportion of the surface oxides must have been removed from samples built with smaller hatch spacings. To calculate this proportion, it was assumed that all of the measured oxide inclusions originated from surface oxides, and not from the oxide on the powder particles. This seems reasonable, since substantial agglomeration would have been needed to grow the thin surface oxide on the powder (a few nanometers thick) to micron-sized inclusions. As before, the average thickness of the oxide on the build surface was taken to be 0.5 µm [2]. The calculated values (Figure 12) indicate that nearly all of the surface oxide was removed from the sample with the shallowest grooves, decreasing to approximately 80% removal for the sample with the deepest grooves. An example of the calculations behind Figure 12 is as follows: The coupon built with a hatch spacing of 0.12 mm (groove depth 16 µm) showed an oxide coverage of 7.2% on the build surface. Taking the oxide thickness to be 0.5 µm, and given that the layer thickness was 40 µm, the volume fraction of oxides in the coupon would have been 7.2% × 0.5/40 = 900 ppm, if all of the surface oxide were incorporated in the part. The actual measured area fraction of oxides on the polished cross-section through the coupon was 91 ppm; this area fraction on a 2D section is equal to the volume fraction of larger oxides within the part. Comparison of these two values shows that the fraction of surface oxides removed before incorporation in the part was (900 − 91)/900 = 90%.
The results show that it is possible to limit the concentration of micron-sized oxide inclusions in LPBF builds by decreasing the hatch spacing. The disadvantage would be a lower build rate: the volumetric build rate is equal to the product of hatch spacing, layer thickness, and beam speed (HLV). Depending on the intended application of the part, the decreased build rate would have to be weighed against improved part properties. The expected advantage of a lower inclusion concentration is in line with previous work on AlSi10Mg samples: fatigue specimens built with smaller hatch spacings did show better fatigue properties [13].

4. Conclusions

The roughness of the build surface does respond to changes in hatch spacing, similar to predictions based on a simple geometric model of the depth of the groove between adjacent beads of deposited material. Increased build surface roughness correlates with a larger concentration of micron-sized inclusions within the part. The observed relationship between build surface roughness and incorporated oxide inclusions is consistent with a substantial role of removal of surface oxides during recoating—calculations indicate that nearly all of the deposited oxidized spatter is removed from the build surface during recoating if the grooves are shallow, decreasing to approximately 80% removal for the samples with the deepest grooves.

Author Contributions

Conceptualization, L.A.S. and P.C.P.; methodology, L.A.S. and P.C.P.; investigation, L.A.S. and P.C.P.; resources, P.C.P.; data curation, L.A.S.; writing—original draft preparation, P.C.P.; writing—review and editing, L.A.S. and P.C.P.; visualization, L.A.S. and P.C.P.; supervision, P.C.P.; project administration, P.C.P.; funding acquisition, P.C.P. All authors have read and agreed to the published version of the manuscript.

Funding

The authors would like to acknowledge use of the Materials Characterization Facility at Carnegie Mellon University under Grant No. MCF-677785. This work was supported by an Early-Stage Innovations grant from NASA’s Space Technology Research Grants Program (Grant No. NNX17AD03G).

Data Availability Statement

The data presented in this study are available on request from the corresponding author.

Conflicts of Interest

The authors declare no conflict of interest.

References

  1. Gordon, J.V.; Narra, S.P.; Cunningham, R.W.; Liu, H.; Chen, H.; Suter, R.M.; Beuth, J.L.; Rollett, A.D. Defect structure process maps for laser powder bed fusion additive manufacturing. Addit. Manuf. 2020, 36, 101552. [Google Scholar] [CrossRef]
  2. Ohtsuki, T.; Smith, L.; Tang, M.; Pistorius, P.C. Origin of Oxides and Oxide-Related Pores in Laser Powder Bed Fusion Parts. In Structural Integrity of Additive Manufactured Materials and Parts; Shamsaei, N., Seifi, M., Eds.; ASTM International: West Conshohocken, PA, USA, 2020; pp. 45–60. [Google Scholar] [CrossRef]
  3. Deng, P.; Karadge, M.; Rebak, R.B.; Gupta, V.K.; Prorok, B.C.; Lou, X. The origin and formation of oxygen inclusions in austenitic stainless steels manufactured by laser powder bed fusion. Addit. Manuf. 2020, 35, 101334. [Google Scholar] [CrossRef]
  4. Hatami, S. Variation of fatigue strength of parts manufactured by laser powder bed fusion. Powder Metall. 2021, 1–6. [Google Scholar] [CrossRef]
  5. Sadeghi, E.; Karimi, P.; Israelsson, N.; Shipley, J.; Månsson, T.; Hansson, T. Inclusion-induced fatigue crack initiation in powder bed fusion of Alloy 718. Addit. Manuf. 2020, 36, 101670. [Google Scholar] [CrossRef]
  6. Pauzon, C.; Markström, A.; Dubiez-Le Goff, S.; Hryha, E. Effect of the Process Atmosphere Composition on Alloy 718 Produced by Laser Powder Bed Fusion. Metals 2021, 11, 1254. [Google Scholar] [CrossRef]
  7. Gong, H.; Rafi, K.; Gu, H.; Starr, T.; Stucker, B. Analysis of Defect Generation in Ti–6Al–4V Parts Made Using Powder Bed Fusion Additive Manufacturing Processes. Addit. Manuf. 2014, 1, 87–98. [Google Scholar] [CrossRef]
  8. Tang, D.; Ferreira, M.E.; Pistorius, P.C. Automated Inclusion Microanalysis in Steel by Computer-Based Scanning Electron Microscopy: Accelerating Voltage, Backscattered Electron Image Quality, and Analysis Time. Microsc. Microanal. 2017, 23, 1082–1090. [Google Scholar] [CrossRef] [PubMed]
  9. Tang, M.; Pistorius, P.C.; Beuth, J.L. Prediction of lack-of-fusion porosity for powder bed fusion. Addit. Manuf. 2017, 14, 39–48. [Google Scholar] [CrossRef]
  10. Weisstein, E.W. “Ellipse”. From MathWorld—A Wolfram Web Resource. Available online: https://mathworld.wolfram.com/Ellipse.html (accessed on 5 February 2022).
  11. Rumble, J.R. (Ed.) CRC Handbook of Chemistry and Physics, 102th ed.; Internet Version 2021; CRC Press/Taylor & Francis: Boca Raton, FL, USA, 2021. [Google Scholar]
  12. Mills, K.C. Recommended Values of Thermophysical Properties for Selected Commercial Alloys; Woodhead: Cambridge, UK, 2002. [Google Scholar]
  13. Tang, M.; Pistorius, P.C. Oxides, porosity and fatigue performance of AlSi10Mg parts produced by selective laser melting. Int. J. Fatigue 2017, 94, 192–201. [Google Scholar] [CrossRef]
Figure 1. Backscattered electron images of the top surfaces of IN718 coupons built with different hatch spacings. Dark regions are aluminum oxide; some adhering powder particles can be seen too.
Jmmp 06 00025 g001
Figure 2. Gas-atomized IN718 powder used to build the test coupons.
Jmmp 06 00025 g002
Figure 3. Example of the optically measured profile of a build surface, for the sample with 140 µm hatch spacing.
Jmmp 06 00025 g003
Figure 4. Schematic vertical cross-section perpendicular to the laser scanning direction, showing the assumed melt pool shape and the geometrical relationships used to calculate the expected groove depth, G.
Jmmp 06 00025 g004
Figure 5. Examples of the calculated melt pool profile for three different values of the hatch spacing (H). In each case, the upper boundary of half of the melt pool cross-section is shown; the groove depth (G) between consecutive passes is indicated by the vertical arrows.
Jmmp 06 00025 g005
Figure 6. Measured coverage of the build surface by aluminum oxide (data points), compared with the expected effect of hatch spacing (broken line).
Jmmp 06 00025 g006
Figure 7. Examples of oxide inclusions found within the coupons. (a) Backscattered electron images of polished surface (aluminum oxides appear dark). (b) Secondary electron images of deep-etched samples, showing oxide inclusion protruding from the etched alloy surface (with the cellular structure of the alloy evident).
Jmmp 06 00025 g007
Figure 8. Size distribution of inclusions in coupons built with different hatch spacings.
Jmmp 06 00025 g008
Figure 9. Comparison of the measured and calculated profile (perpendicular to the laser scanning direction) on the surface of the sample built with a hatch spacing of 110 µm.
Jmmp 06 00025 g009
Figure 10. Comparison of calculated and measured groove depths on the build surface of samples built with different hatch spacings.
Jmmp 06 00025 g010
Figure 11. Change in the concentration and number of oxide inclusions for samples built with different hatch spacings (resulting in different surface groove depths).
Jmmp 06 00025 g011
Figure 12. Calculated extent of removal of surface oxides before deposition of the next layer.
Jmmp 06 00025 g012
Table 1. Composition of an IN718 coupon built in this work (major elements; mass percentages).
NiCrFeNbMoTiAl
53.519.116.95.33.61.00.58
Table 2. Measured and calculated parameters for test coupons built with different hatch spacings.
Hatch SpacingMelt Pool WidthMelt Pool DepthCap Height (Calc.)Internal OxidesInternal OxidesBuild-Surface OxideGroove Depth (Calc.)Groove Depth (Meas.)
(mm)(mm)(mm)(mm)(Area, ppm)(#/mm²)(pct.)(µm)(µm)
0.050.150.170.041255.411.92.42.9
0.090.170.170.0424810.99.26.36.3
0.10.170.160.0434512.79.28.16.7
0.110.160.160.0448128.99.011.26.8
0.120.160.160.0459121.37.215.711.0
0.130.160.150.046--7.721.018.9
0.140.150.160.04817341.27.630.521.0
Publisher’s Note: MDPI stays neutral with regard to jurisdictional claims in published maps and institutional affiliations.

