Article

Physical Simulation of Laser Surface Treatment to Study Softening Effect on Age-Hardened Aluminium Alloys

by
Maria Emanuela Palmieri
* and
Luigi Tricarico
Department of Mechanics, Mathematics & Management, Polytechnic University of Bari, 70125 Bari, Italy
*
Author to whom correspondence should be addressed.
J. Manuf. Mater. Process. 2022, 6(3), 64; https://doi.org/10.3390/jmmp6030064
Submission received: 13 May 2022 / Revised: 2 June 2022 / Accepted: 7 June 2022 / Published: 10 June 2022
(This article belongs to the Special Issue Advances in Material Forming)

Abstract

:
The automotive industry is interested in manufacturing components with tailored mechanical properties. To this end, advanced heating treatments can be exploited to obtain the so-called Tailored Heat-Treated Blanks (THTB). However, mechanical properties are strongly affected by the process parameters of heating treatments, which require a preliminary design. Physical simulation can be a decisive tool in this phase to obtain useful information at the laboratory scale, even when heat treatments such as those carried out with laser technologies impose high heating and cooling rates on the material. This work uses physical simulation to investigate the changes in strength and ductility caused by laser heat treatment (LHT) on aluminum alloys hardened by aging; the methodology was implemented on the EN AW 6082 T6 alloy. First, a finite-element (FE) transient thermal model was developed to simulate LHT by varying the process parameters (laser power/peak temperature and treatment speed). Second, the resulting thermal cycles were physically simulated by means of the Gleeble 3180 system. Third, the strength and the ductility of physically simulated specimens were evaluated through micro-hardness and tensile tests; to study aging effects, investigations were performed both (i) right after Gleeble tests (samples in the supersaturated solid state, i.e., as-physically simulated (APS) state) and (ii) after one week from Gleeble tests (aged specimens—T4 state). The obtained results show that there are peak temperatures that guarantee maximum softening levels for each investigated state (T4 and APS). The optimal peak temperature ranges are in agreement with the data in the literature, demonstrating that the proposed methodology is suitable for the study of softening phenomena on aging-hardened aluminum alloys.

1. Introduction

In recent years, the automotive industry has shown increasing interest in Tailored Heat-Treated Blanks (THTB), as such components locally exhibit different mechanical properties [1]. The goal is to improve the formability of the specific regions of a component; as an example, THTB are adopted in the stamping of high-strength aluminum alloys to enhance their formability [2]. These alloys are widely used in the transport industry, which aims to obtain lighter components to reduce pollution [3].
Typical local heat treatment technologies include electromagnetic induction [4], heat conduction by heated contact plates [5] and laser radiation [6]. Electromagnetic and heat inductions are usually adopted in large-scale production on extensive areas of a blank, as such treatments are less expensive and can obtain a uniform temperature distribution [7]. The laser radiation is exploited for localized treatments of small areas, allowing for a better customization of the mechanical properties of the blanks [8]. Thanks to the interaction between the photons of the laser beam and the electrons of the material surface, it is possible to quickly heat the blank surface. The heat absorbed on the surface is transferred to the substrate by thermal conduction, guaranteeing a uniform temperature for small thickness blanks. The heated zone is then rapidly cooled by thermal conduction after the laser–material interaction. By designing process parameters such as laser power, laser spot size, laser beam shape and interaction time (time in which the laser beam interacts with the material surface), it is possible to achieve uniform thermal cycles in the treated area up to the desired peak temperatures.
The present work focuses on laser heat treatment (LHT) for the softening of the EN AW 6082 T6 aluminum alloy, studying the effect of process parameters (laser power/peak temperature and treatment speed) on the mechanical properties of the material. Generally, similar studies are carried out by means of laser beam stations [8,9,10], while a different innovative approach is proposed here. The laser thermal cycles are initially simulated with a finite-element (FE) model and then reproduced at the laboratory scale using the Gleeble system as a physical simulator [11]. The latter can perform thermo-mechanical tests on small samples, avoiding waste of material and speeding up experimental investigations. In this sense, physical simulation can represent an interesting opportunity for the industry. Integration between FE simulation and the Gleeble system has already been proposed by the authors [12] to study the localized softening by laser treatment of a blank in a hardened aluminum alloy (EN AW 5754 H32). Numerical thermal cycles were obtained with a 3D, transient, finite-element (FE) thermal model. The FE model was calibrated using the results of experiments carried out with a 2.5 kW CO2 laser source and an optical lens that allowed for a square top-hat beam profile of 20 × 20 mm2 size.
After physical simulation, microhardness tests were carried out to investigate the softening of the treated material. Moreover, tensile tests—combined with the Digital Image Correlation (DIC) technique—were exploited to measure the deformability of the material.
Compared to the laser surface treatment of a hardened aluminum alloy [12], the results obtained in this work agree with the different softening mechanisms of an age-hardened aluminum-magnesium-silicon alloy, where softening is expected as a partial or complete dissolution of Mg-Si reinforcement clusters [13]. The results show that softening level depends on the peak temperature. Immediately after the heat treatment, the material is subjected to aging and, as a result, the strength of the alloy increases due to the formation of precipitates [13]. Such behavior was investigated in detail by Hannes Fröck et al. [14], who defined a process window for the optimal heat treatment and the optimum storage time between the heat treatment and the stamping process. In the present work, aging effects are studied by performing further hardness and tensile tests on natural aged samples; this analysis shows that one week of aging reduces softening by about 30% for the greater investigated peak temperature.

2. Materials and Methods

This work studies the softening effects and the deformability improvements induced by laser heat treatments (LHTs) on the EN AW 6082 T6 aluminum alloy, 1-mm thick, with a hardness of 110 HV0.2, in as-received conditions. In particular, the goal is to investigate the influence of process parameters, such as laser power and treatment speed, immediately after treatment and after natural aging. The time considered for the natural aging was one week.
The chemical composition of the studied alloy is reported in Table 1.
The methodology used to carry out this study is outlined in Figure 1.
In more detail: (i) A three-dimensional (3D), transient, finite-element (FE) thermal model was developed to simulate different laser heating conditions and define thermal cycles with different peak temperatures and different treatment speeds. (ii) The physical simulation of the numerical thermal cycles was performed. Since these are rapid thermal cycles, to satisfy the cooling rate during Gleeble tests, a tapered specimen was adopted. The geometry of specimens was defined thanks to optimization of the length and width of the shaped area studied in the previous work [12]. Physical simulation tests were carried out on the tapered specimens that were subjected to the subsequent micro-hardness test, and on notched specimens that were subjected, instead, to the subsequent tensile test. (iii) Microhardness tests were performed on Gleeble tapered specimens to evaluate the softening effects induced by different laser-simulated thermal cycles after physical simulation treatment (APS) and after physical simulation treatment and natural aging (T4). In the APS state, it is possible to study the effect of laser heat treatment without aging phenomena. On the other hand, in the T4 state, the results consider the precipitation of hardening phases due to the aging phenomena. (iv) Tensile tests on notched specimens treated with Gleeble simulator were performed, assisted by a DIC measurement system. Notched specimens were adopted to force plastic deformation at exactly the central point of the specimen, which is the point where the thermal cycle was imposed because it is the point at which the control thermocouple was welded during the Gleeble test. In several papers [15,16], this solution is proposed to determine the mechanical properties of welded joints. (v) The experimental results obtained from the hardness tests were implemented in the FE model to verify the treatment effects in terms of the thermal softening, width and uniformity of the treated area.

2.1. FE Model of the LHT and Definition of Investigated Laser Thermal Cycles

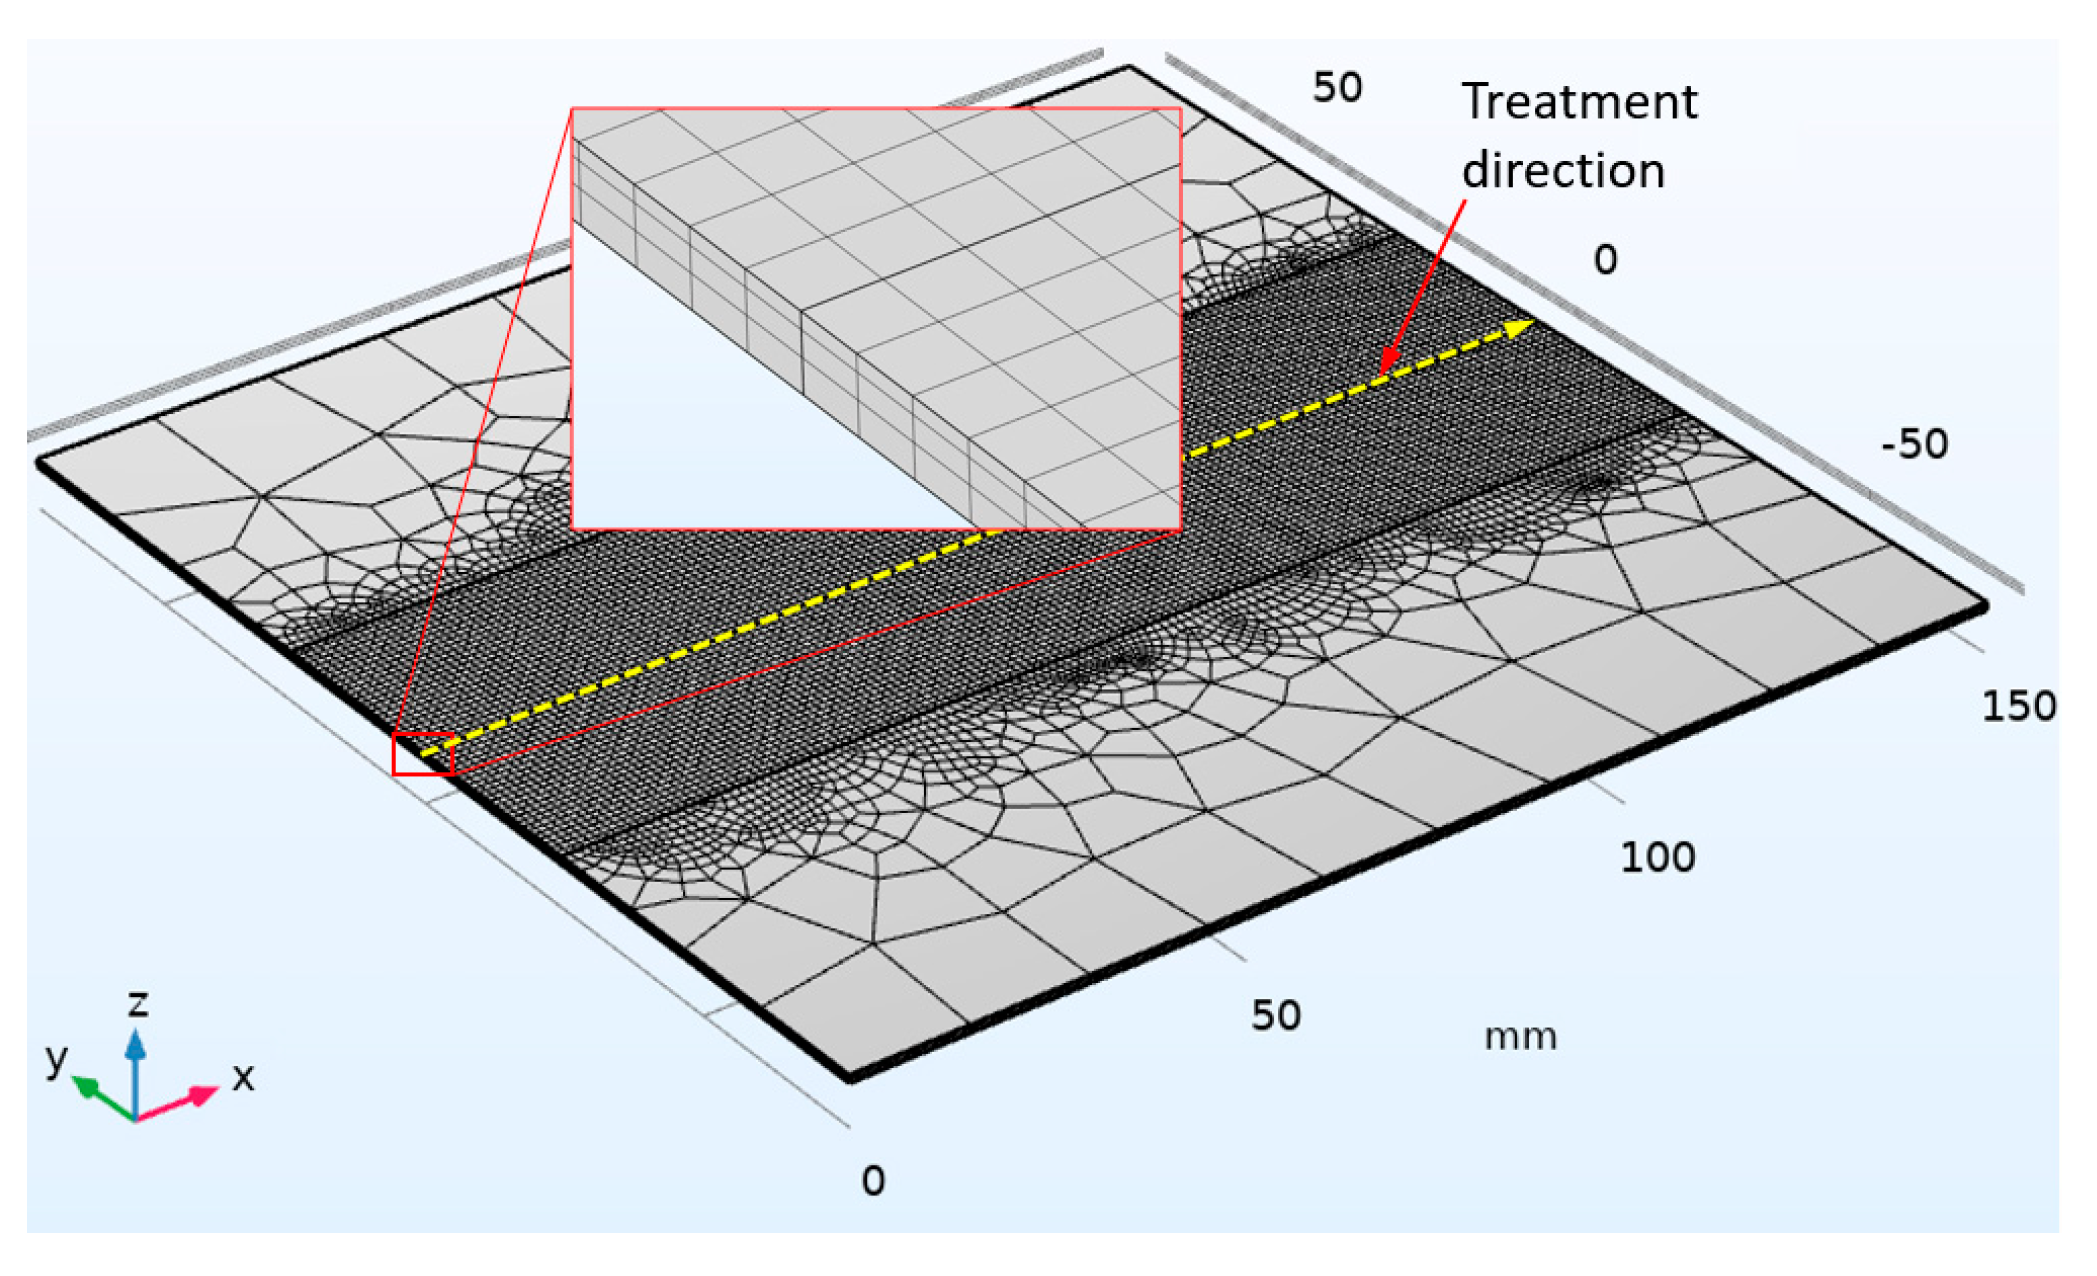
Using the finite-element (FE) software COMSOL Multiphysics 5.6, a transient, three-dimensional thermal model was developed for the numerical simulation of a localized LHT. In this process, the laser source with a square spot size of 20 × 20 mm moves with a constant speed (v) along the central trajectory (treatment direction in Figure 2) of an EN AW 6082 T6 blank of 150 × 150 mm, which was 1-mm thick. The development of the FE model uses the results obtained in a previous numerical–experimental activity carried out with a CO2 laser source on a blank in aluminum alloy EN AW 5754 H311 [2]. The heat transfer problem is governed by the following equation:
ρ · C p · T t = d i v k · grad T + Q l a s e r
where ρ , C p and k are, respectively, the density, specific heat and thermal conductivity of the material, while T is the temperature and t is the time. The heat generated by laser-material interaction ( Q l a s e r ) was modeled as a surface heat source with a top hat distribution, according to the following equation:
Q l a s e r = P L 4 · a x _ s p o t · a y _ s p o t · I _ l a s e r
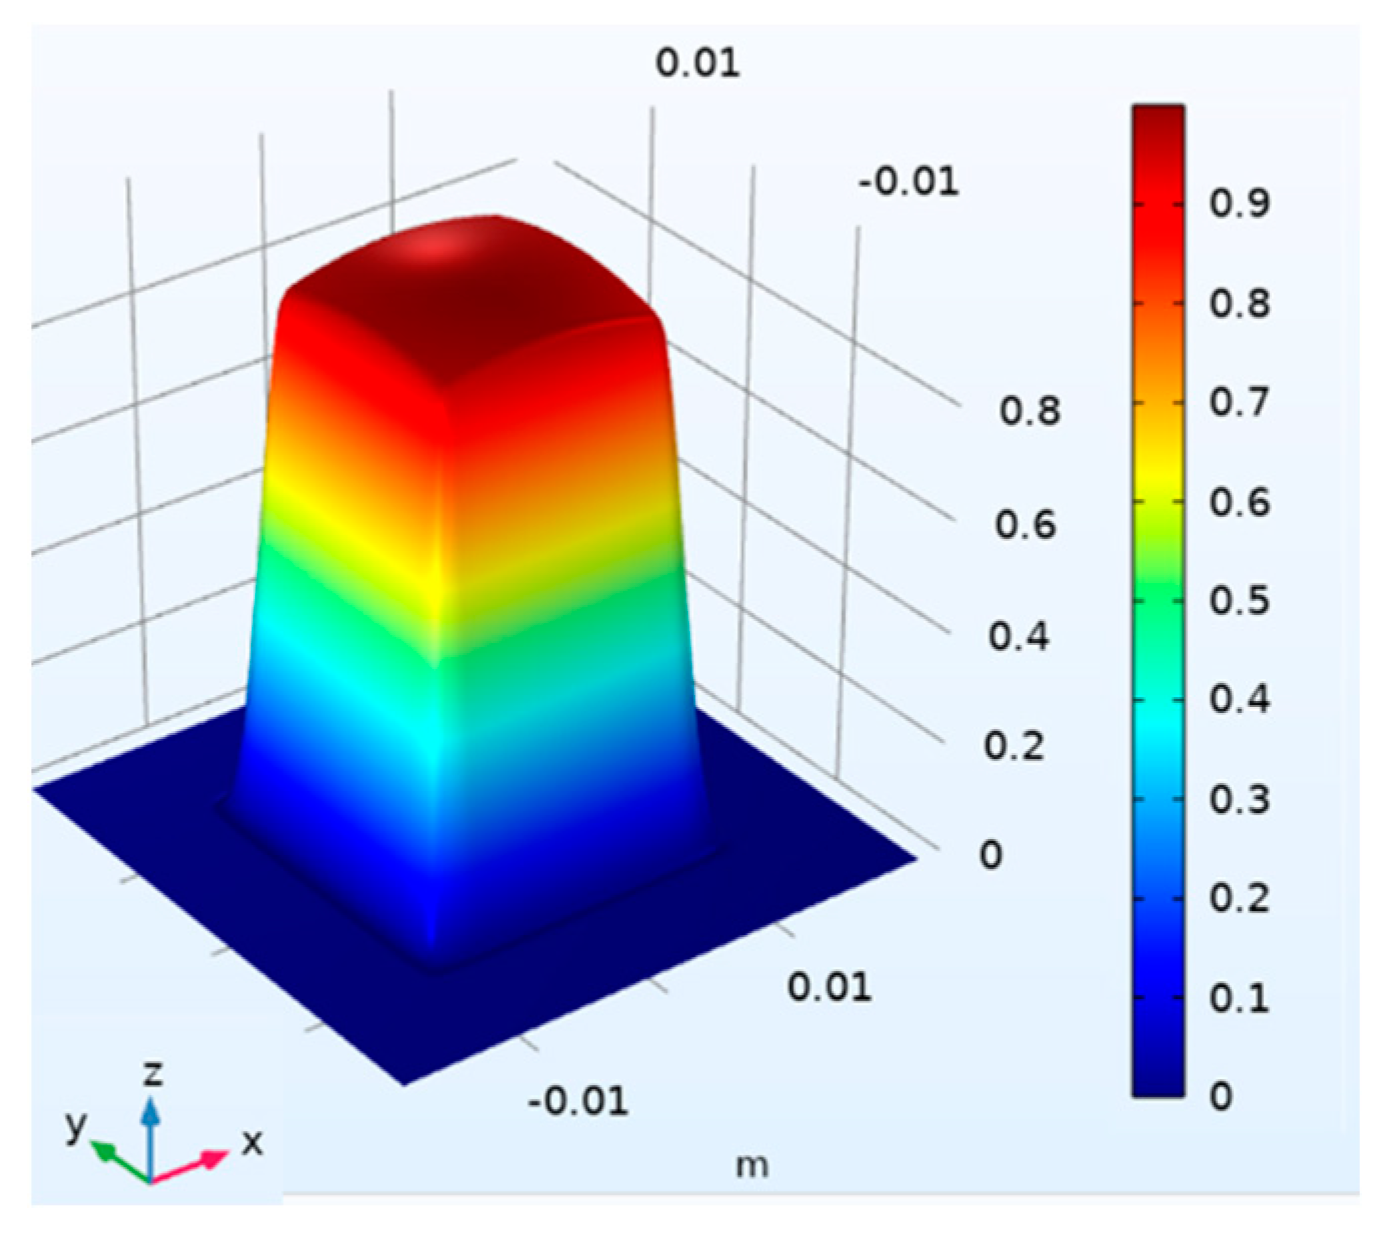
where P L is the absorbed laser power, 4 · a x _ s p o t · a y _ s p o t is the laser square spot size and I _ l a s e r is the top hat distribution function (Figure 3). A convective heat loss ( H · T T 0 ) is assumed on the blank boundary surfaces, where H is the heat transfer coefficient and T 0 is the ambient temperature.
The Figure 2 shows the mesh of the FE model, suitably refined in the area affected by major thermal gradients. Using a hexahedron (brick) element type, a mapped square mesh was adopted in the fine mesh zone, with 1 mm as the maximum element size in the XY plane and three elements in the sheet thickness (Z axis). Unstructured mesh was adopted in the coarse mesh region.
In the laser–material interaction zone, the heat transfer coefficient was assumed to be equal to 15 W/(m2 ∗ K), due to the shielding gas action. The thermo-physical material properties were modeled as a function of temperature, as highlighted in Table 2.
For the calibration of the FE model, some probes were positioned on the blank surface along the laser treatment direction. Based on the thermal cycles acquired by probes, the absorbed laser power was calibrated to assure a steady-state condition during the surface treatment, i.e., thermal cycles with constant peak temperatures (Tpeak).
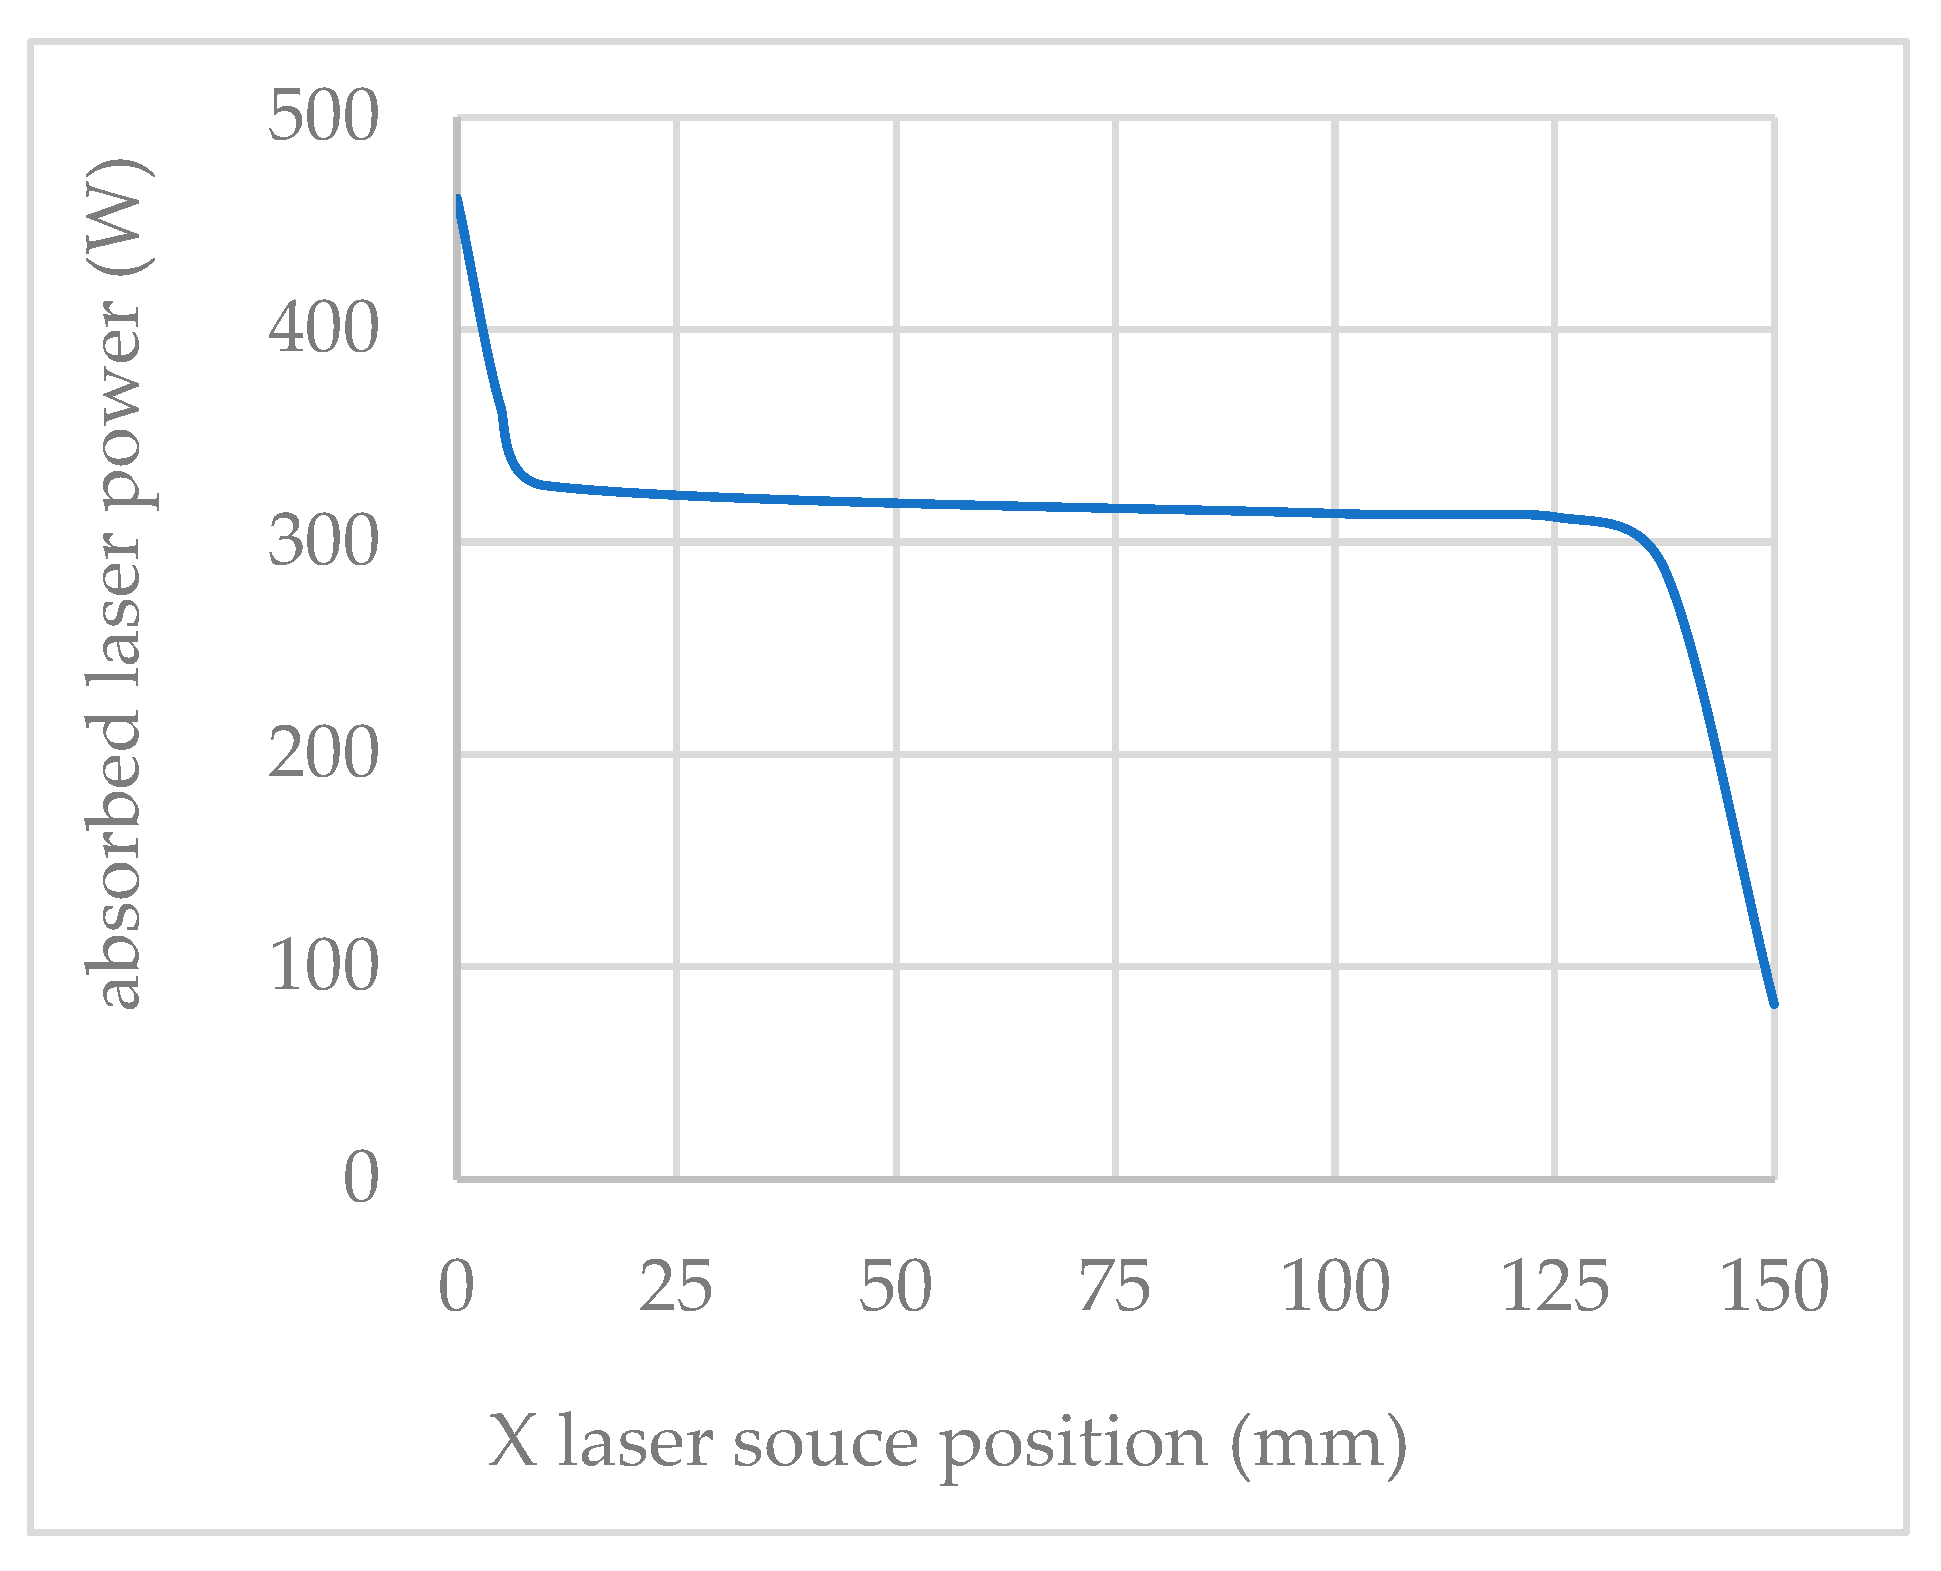
Figure 4 and Figure 5 show the results of this calibration phase, when thermal cycles were designed with a peak temperature of 510 °C and a treatment speed of 5 mm/s (T510V5 treatment condition). Figure 4 shows the profile of the absorbed laser power along the treatment direction (absorbed laser power as a function of the X laser source position), while Figure 5 shows the probe positions and thermal cycles measured by probes.
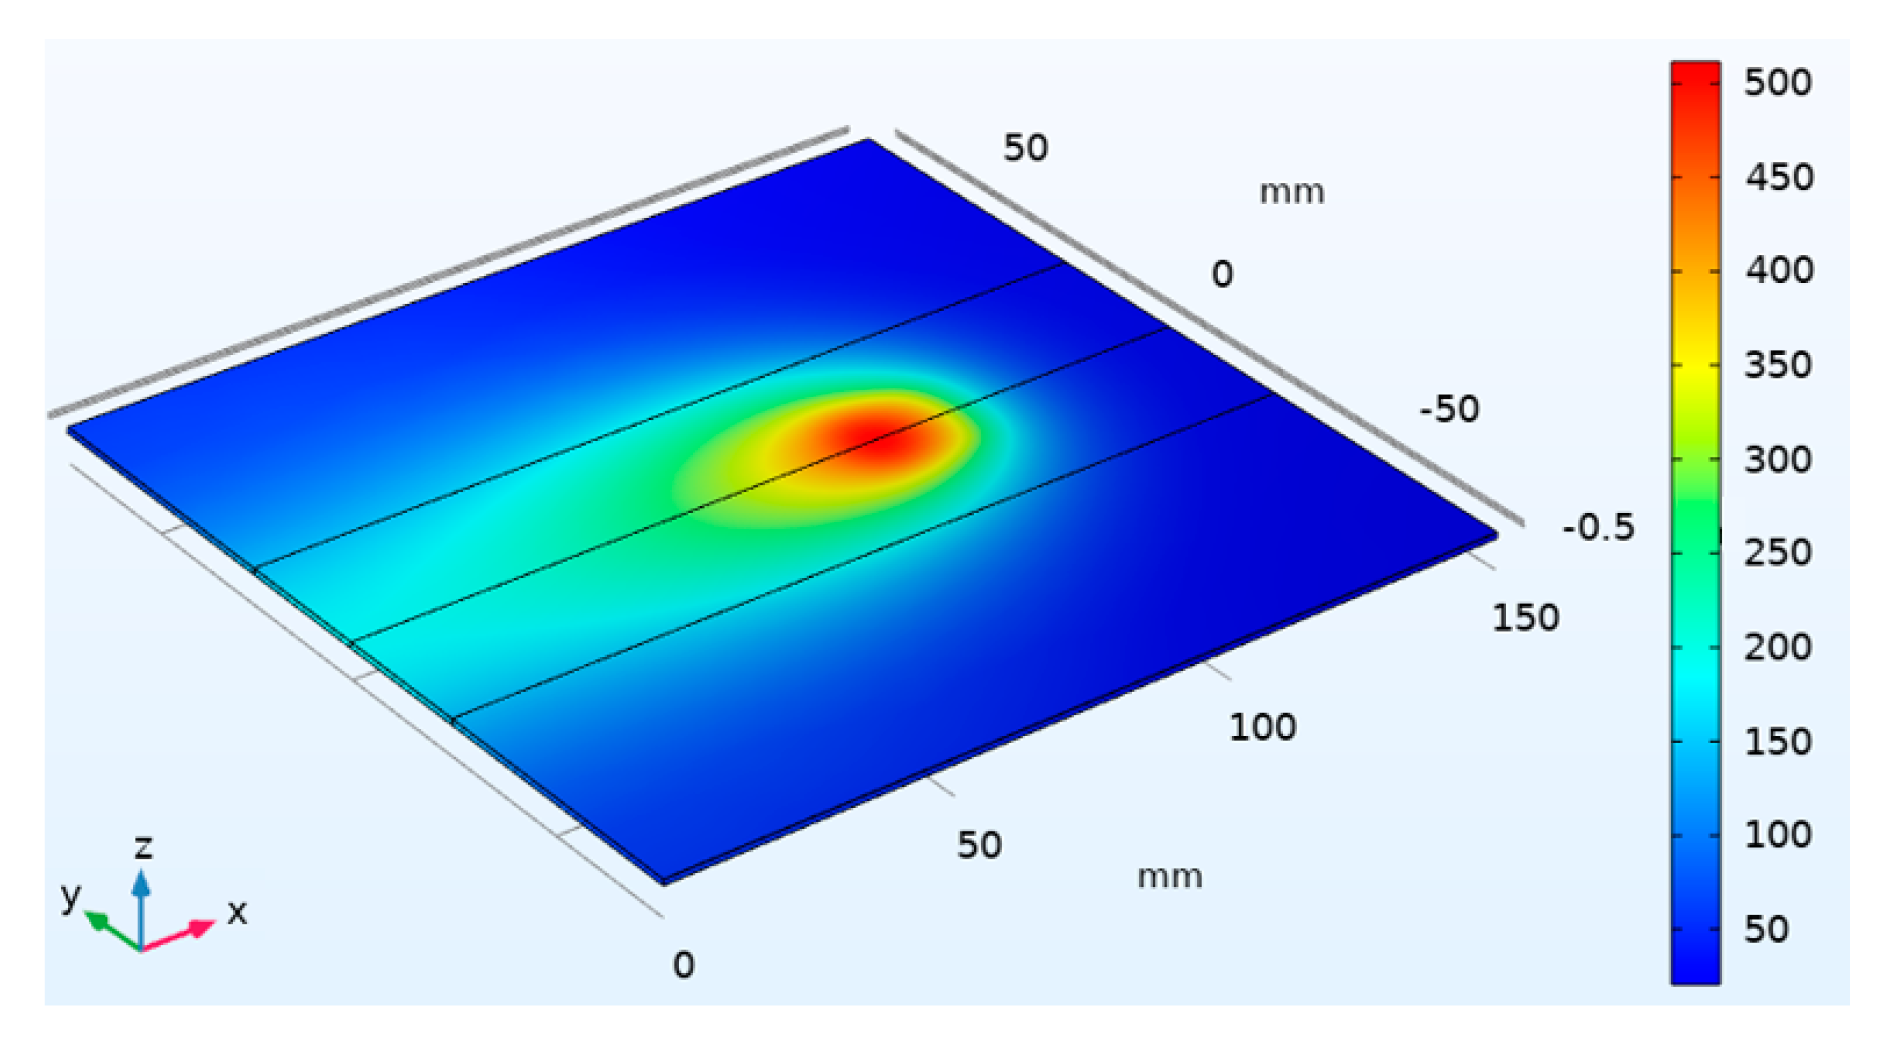
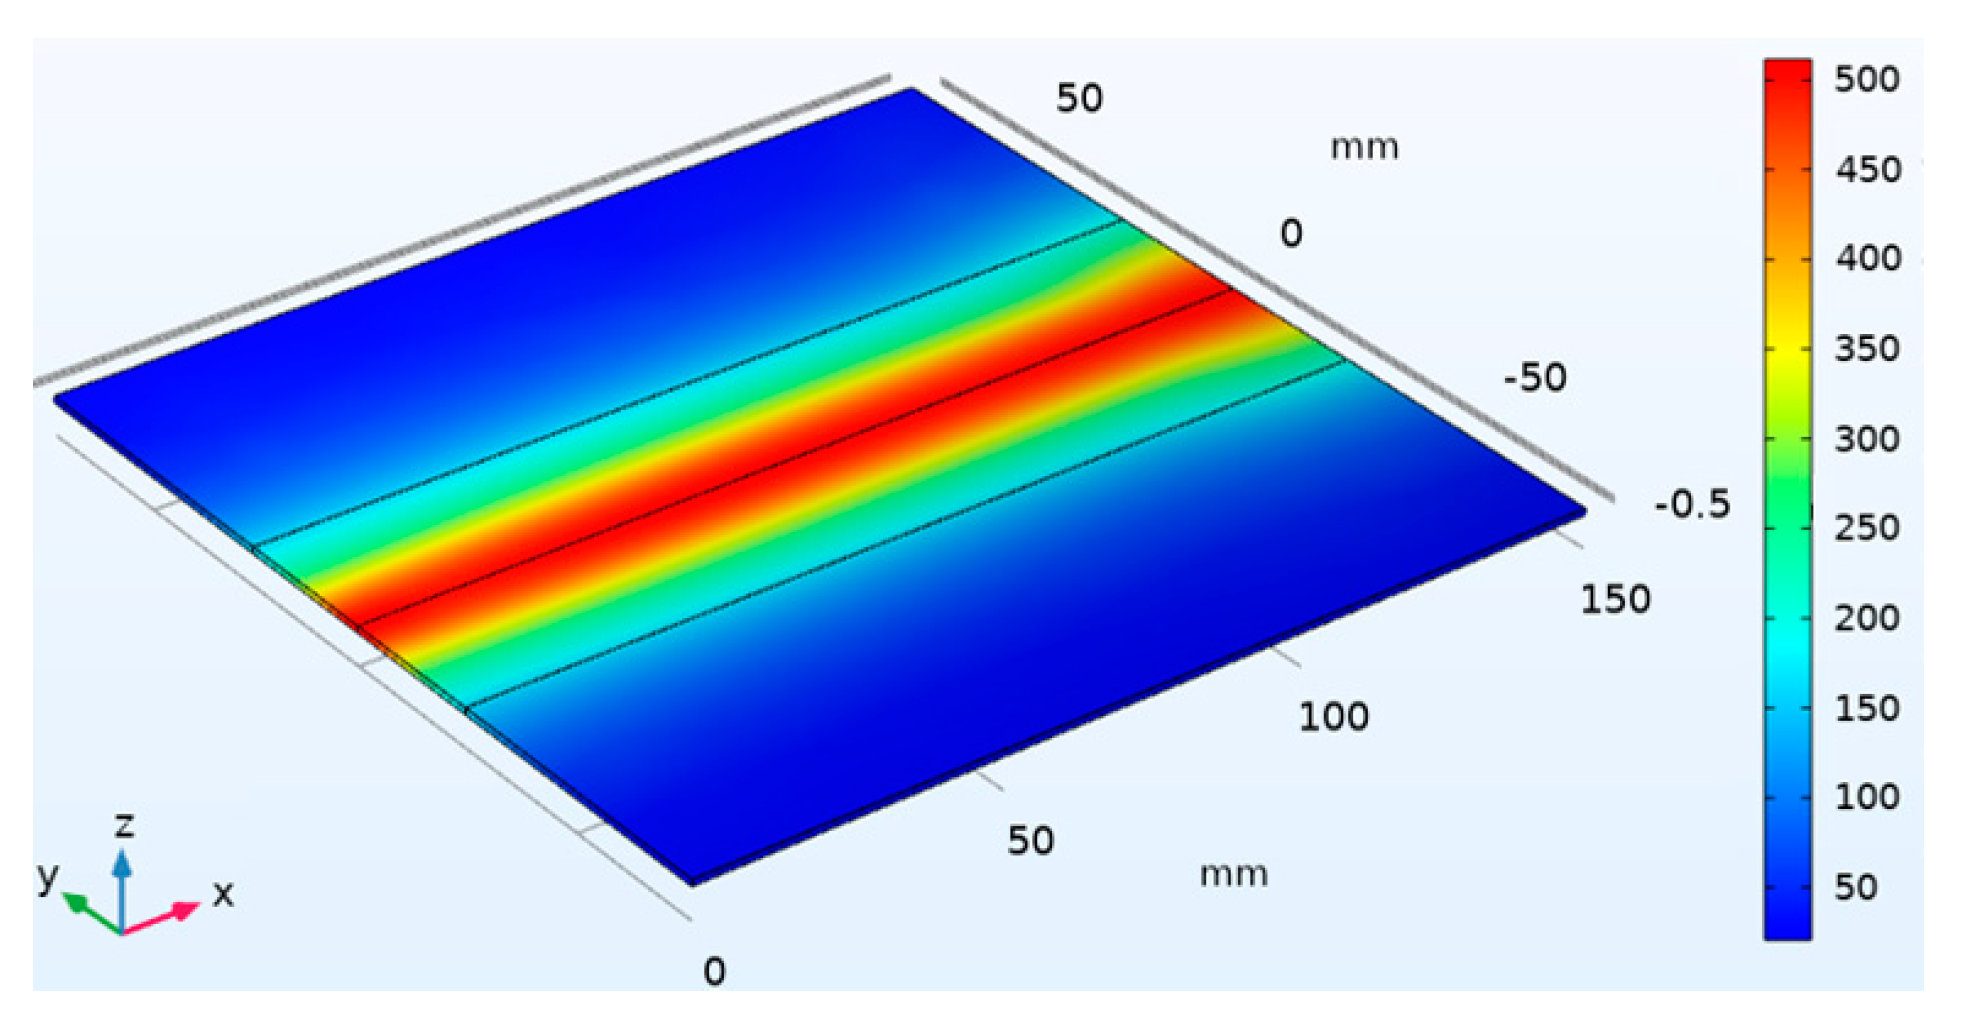
In accordance with the T510V5 treatment condition, Figure 6 shows the temperature distribution in the blank after 22 s of surface treatment, while Figure 7 shows the peak temperature distribution in the blank after the laser surface treatment. The temperature distribution in Figure 6 remains constant for the entire duration of the heat treatment. The temperature distribution in Figure 7, which was obtained by developing a post-processing procedure, shows that the calibration of the absorbed laser power and the top hat distribution function ensure that a wide region of the blank is treated uniformly.
The FE model was used to investigate different treatment speeds and peak temperatures. In the simulation plan, the treatment speeds of 5 mm/s and 7.5 mm/s were investigated, while peak temperatures were chosen to investigate the softening effects on the alloy. Usually, for Al-Mg-Si alloys, for temperatures between 250 °C and 350 °C, there is an inhomogeneous microstructure with Si and Mg atoms or in the form of small clusters, or with Mg and Si atoms grouped in larger precipitates (β″ or β′), with a greater lattice deformation of the aluminum matrix. However, for temperatures above 400 °C, a complete dissolution of the MgSi-clusters and a more homogenous microstructure occurs with all Si and Mg atoms in solution. Therefore, at a high temperature, the ductility reaches higher values [7]. Based on these considerations, for each treatment speed, the absorbed laser power was designed to assure thermal cycles with peak temperatures of about 300 °C, 400 °C and 500 °C. Table 3 shows the characteristic parameters of the investigated thermal cycles.
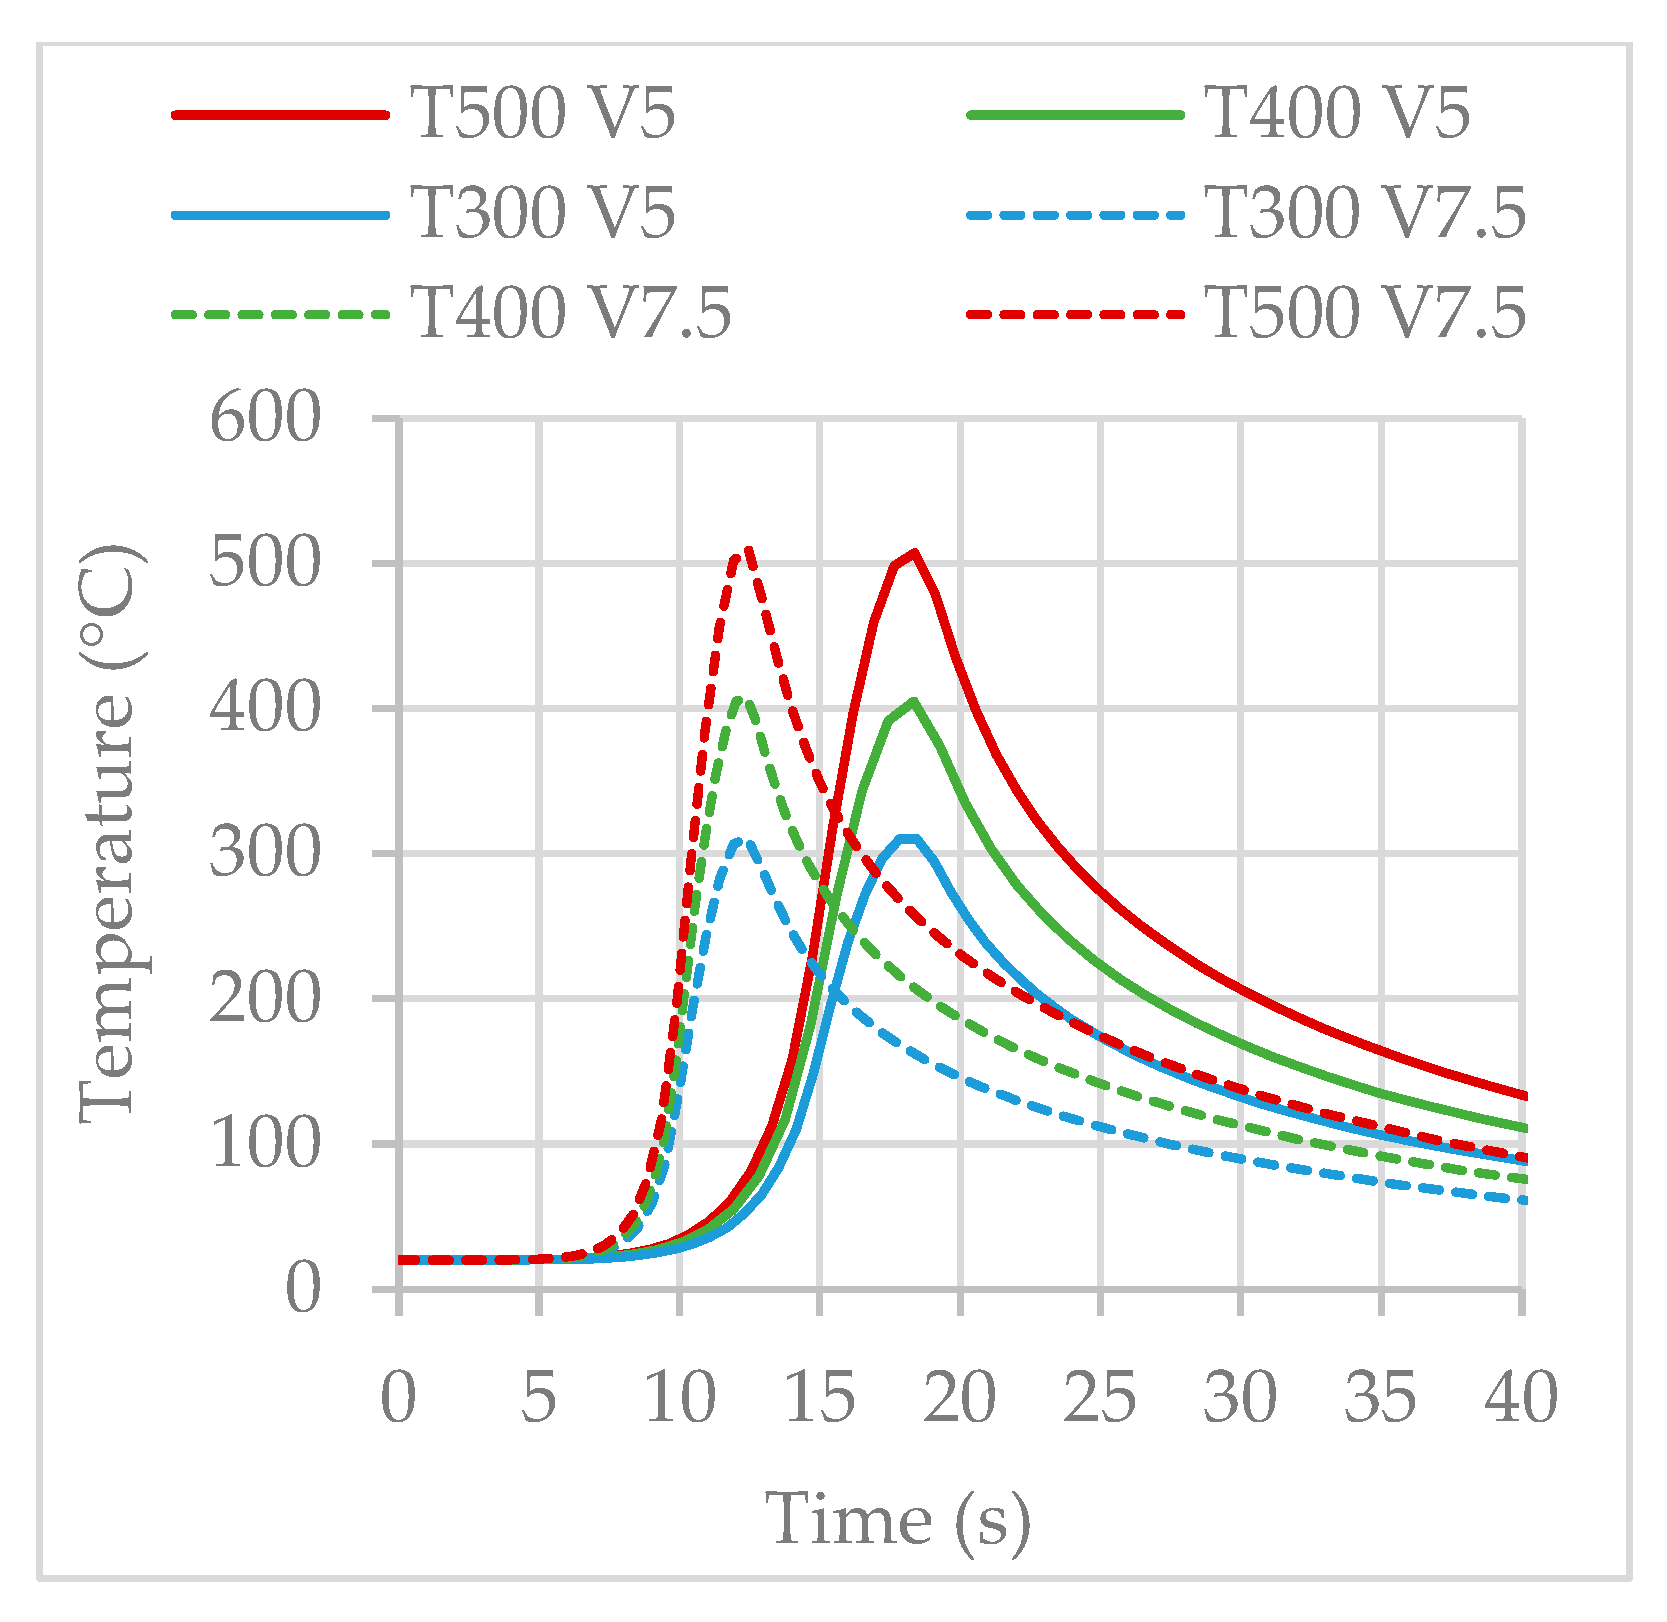
The thermal cycles measured in the central probe (probe 5, Figure 5) and corresponding to the treatment conditions shown in Table 3, are plotted in Figure 8. Thermal cycles obtained with a treatment speed of 5 mm/s are represented by a solid line, while those obtained with a treatment speed of 7.5 mm/s are represented by a dotted line. These thermal cycles were used for physical simulation tests.
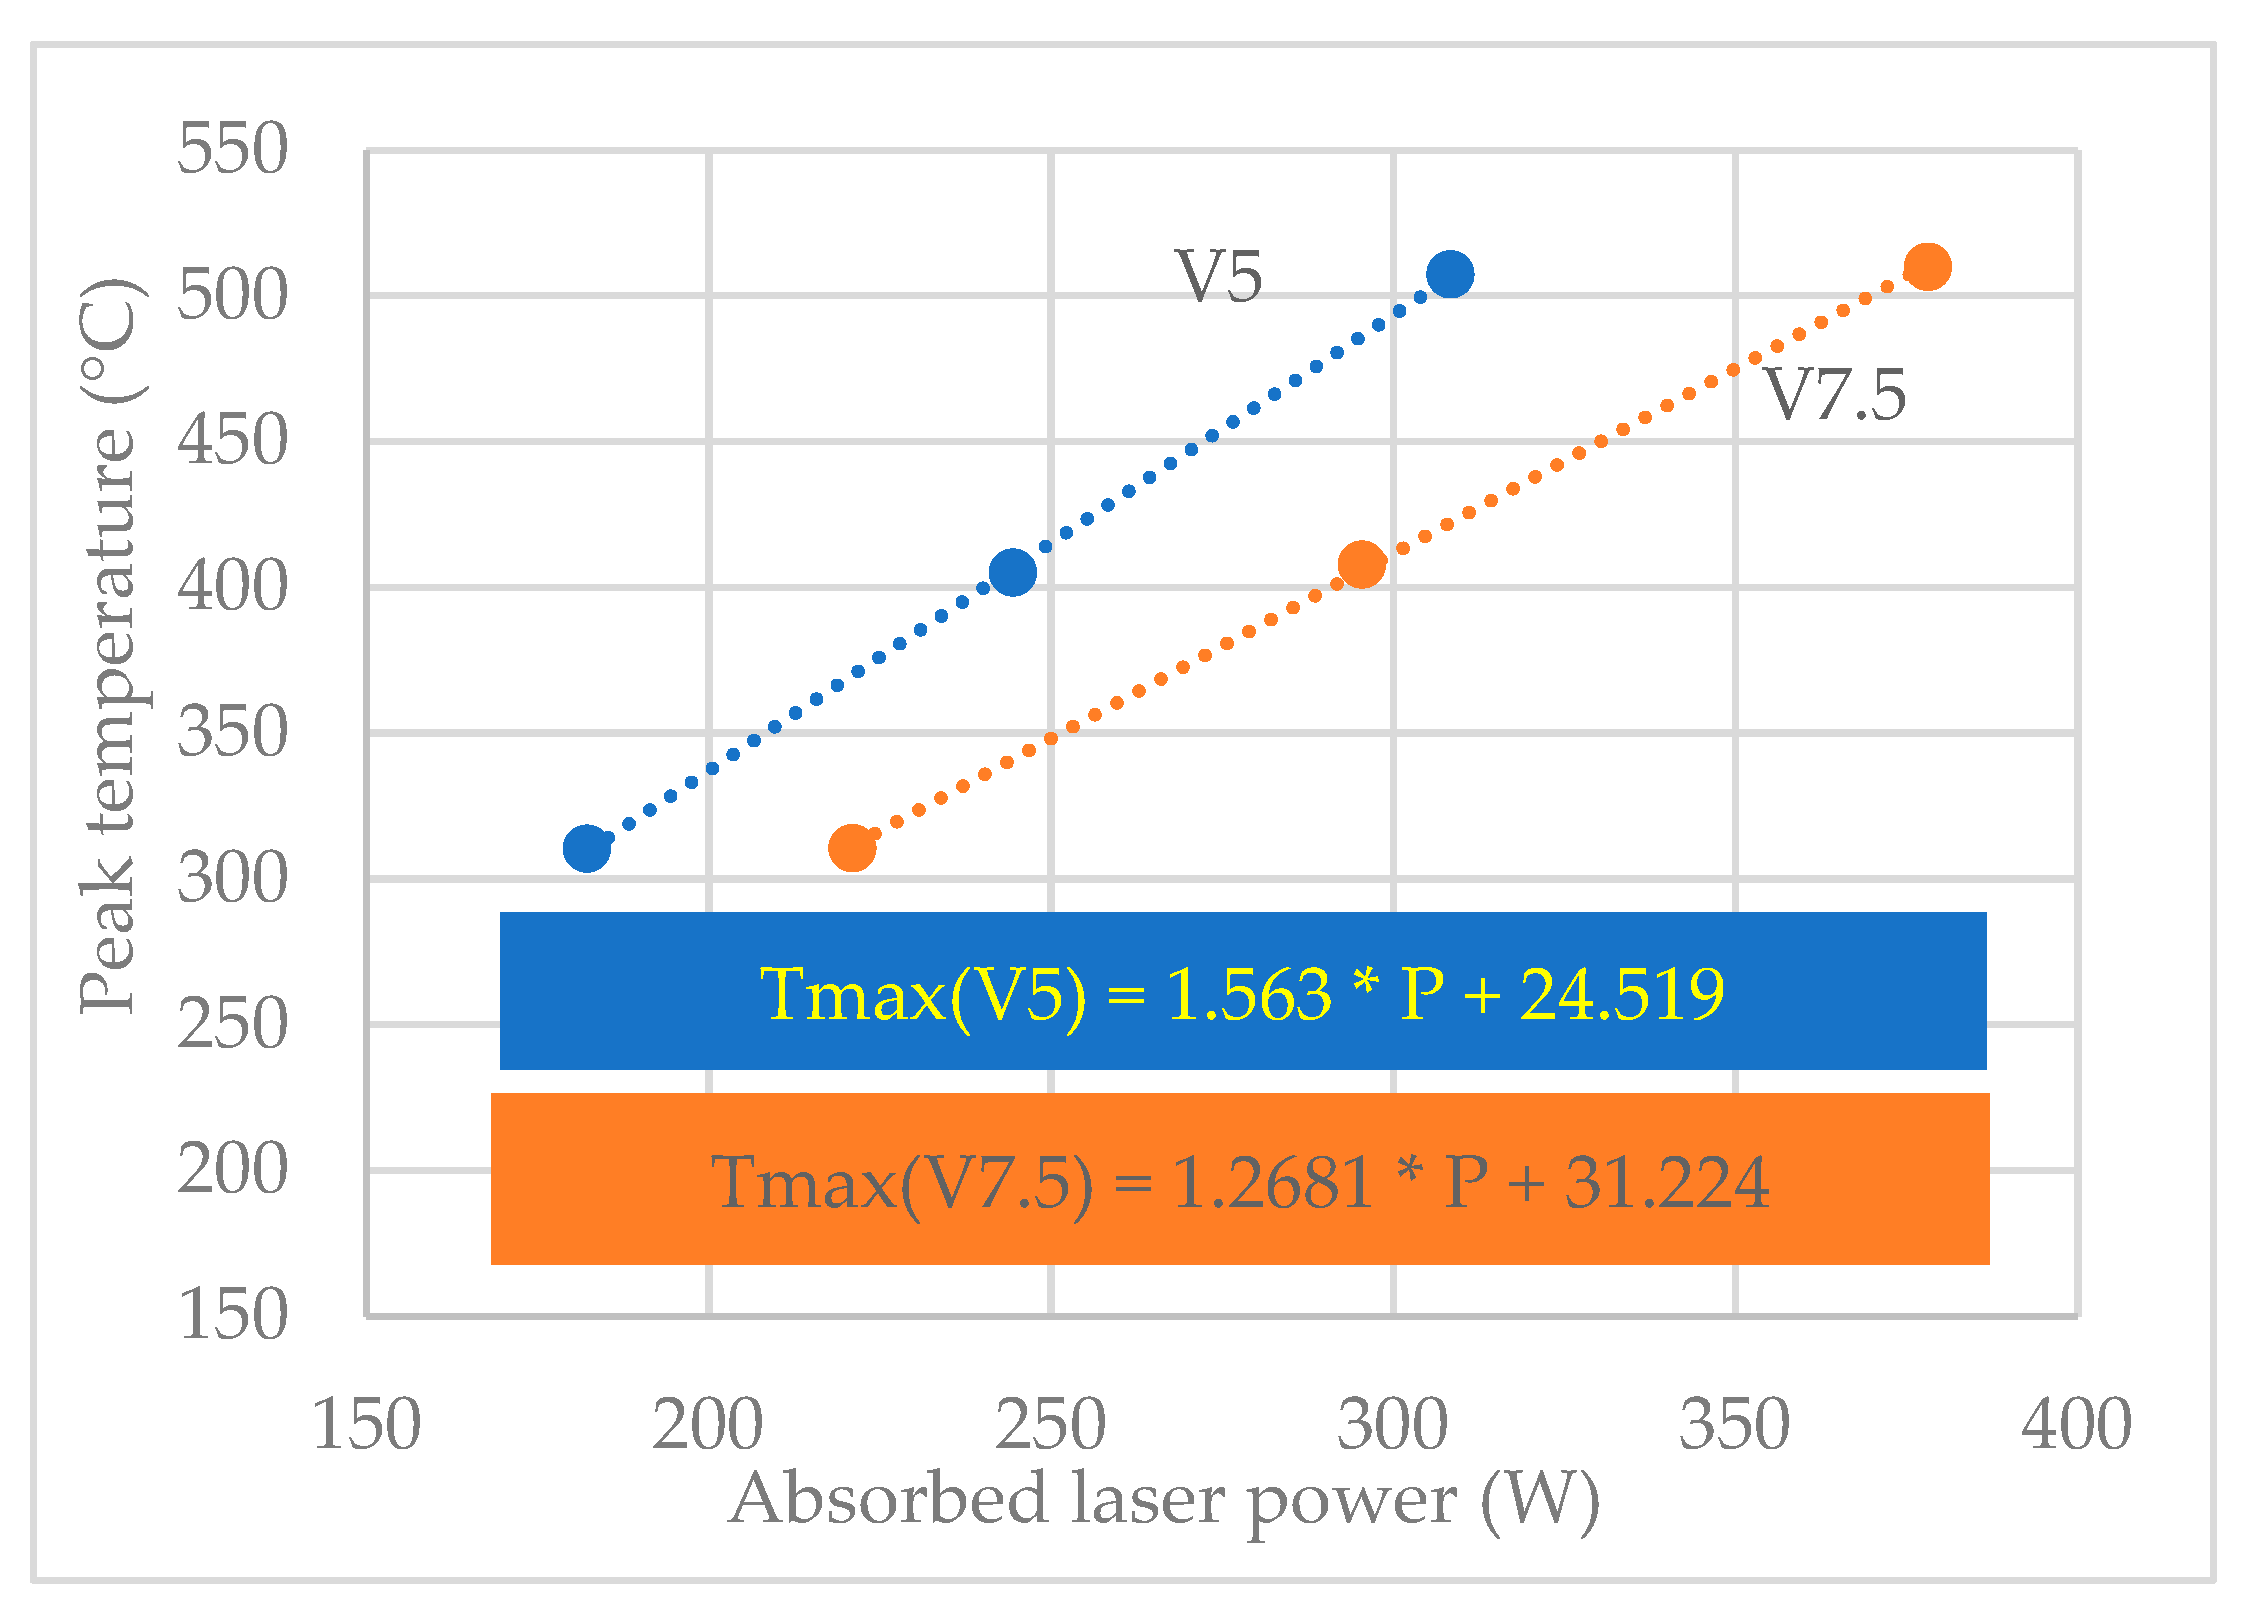
Finally, Figure 9 shows for the peak temperature as a function of the absorbed laser power for the two treatment speeds; the absorbed laser power is that which occurs when the laser spot centre coincides with the central probe.

2.2. Physical Simulation of LHT

The physical simulation is a laboratory test that can reproduce thermal or thermo-mechanical cycles on samples. A classical physical simulator tool is the Gleeble system, which was mainly developed to simulate the rapid thermal cycles typical of welding process [17]. In fact, the standard Gleeble system model can reach a high heating rate (of about 103 k/s). In this work, the Gleeble 3180 system was adopted to reproduce the rapid laser thermal cycles seen in Figure 8 at the specimen center.
In the Gleeble systems, there is a closed-loop thermal system and a closed-loop hydraulic servo system, which are controlled by a synchronous digital computer control to carry out accurate physical simulations tests, which can reproduce the imposed thermal or thermomechanical cycles.
A detailed view of the experimental setup is shown in Figure 10, while, in Figure 11 geometries of the specimens subjected to physical simulation tests are highlighted. Specifically, Figure 11a shows the geometry of the specimens (tapered specimens) used to analyze the material softening through micro-hardness tests; Figure 11b shows the geometry of specimens (notched specimens) adopted to analyze the material fracture deformability by means of tensile tests. Preliminary tests showed that both specimens allow for the laser thermal cycles in the center of the specimen to be reproduced in the Gleeble system, while in the tensile tests, only the notched specimens guarantee the failure in the specimen center in all investigated conditions.
As shown in Figure 10, the specimen is clamped with stainless steel grips. The specimen is heated by the Joule effect and the current flow is modulated by a closed loop controller capable of minimizing the difference between the target temperature (set temperature) and that acquired by means of the K-type pilot thermocouple welded to the centre of the specimen. With increasing distance from the specimen center, similar thermal cycles are achieved, with lower peak temperatures due to the cooling effect of the clamps. With the aim of estimating the peak temperature trend in the tapered specimens as a function of the distance from the specimen center (temperature profile), other two K-type thermocouples were welded along the longitudinal axis, at distances of about 5 mm and 10 mm from the central thermocouple.
The results acquired from the thermocouples were used to estimate the peak temperature profile thanks to a thermo-electric, 3D, transient, finite-element model developed in COMSOL Multiphysics [12]. The FE model couples the thermal and electrical fields. The heat transfer problem is governed by the following equation:
ρ · C p · T t = d i v k · grad T + Q j o u l e
where ρ , C p and k are, respectively, the density, the specific heat and the thermal conductivity of the material (Table 2), while T is the temperature and t is the time. The heat source generated by Joule effect ( Q J o u l e ) is given by the following equation:
Q j o u l e = σ e · V x 2 + V y 2 + V z 2
where σ e is the electrical conductivity (assumed equal to 27 MS/m) and V is the electrical potential.
The electric problem is governed by the current continuity equation:
d i v σ e · g r a d V = 0
Figure 12a shows the FE model mesh used for the simulation of the Gleeble tests with the tapered specimen. The mesh is obtained with a brick-type element. A mapped square mesh was adopted in the tapered zone of the specimen, with 1 mm as the maximum element size in the XY plane and two elements in the sheet thickness (Z axis). Unstructured mesh was adopted in the grip and non-tapered regions. Moreover, some probes were defined on the longitudinal axis of the specimen with the aim of simulating the thermal cycle in the pilot thermocouple position (control point) and in the control thermocouples’ position (Probe 1 and Probe 2).
Regarding the thermal boundary conditions, a convective heat loss ( H · T T 0 ) is assumed for the grip and non-taped boundary surfaces, where H is the heat transfer coefficient and T 0 is the ambient temperature. Regarding the electric boundary condition, on the boundary surface of the left grip, a potential V is applied, while the right grip is the ground and all other surfaces are insulated. A proportional–integrative–derivative (PID) controller was implemented to the FE model to guarantee the required thermal cycle in the control point by varying the potential V according the following equation:
V = K P · T T s e t + K I · T T s e t · d t + K D · t T T s e t
where T s e t is the temperature of the laser thermal cycle, while the proportional ( K P ), integral ( K I ), and derivative ( K D ) parameters of the PID controller were calibrated to 0.08 V/K, 0.009 V/(K⋅s) and 10−7 V⋅s, respectively.
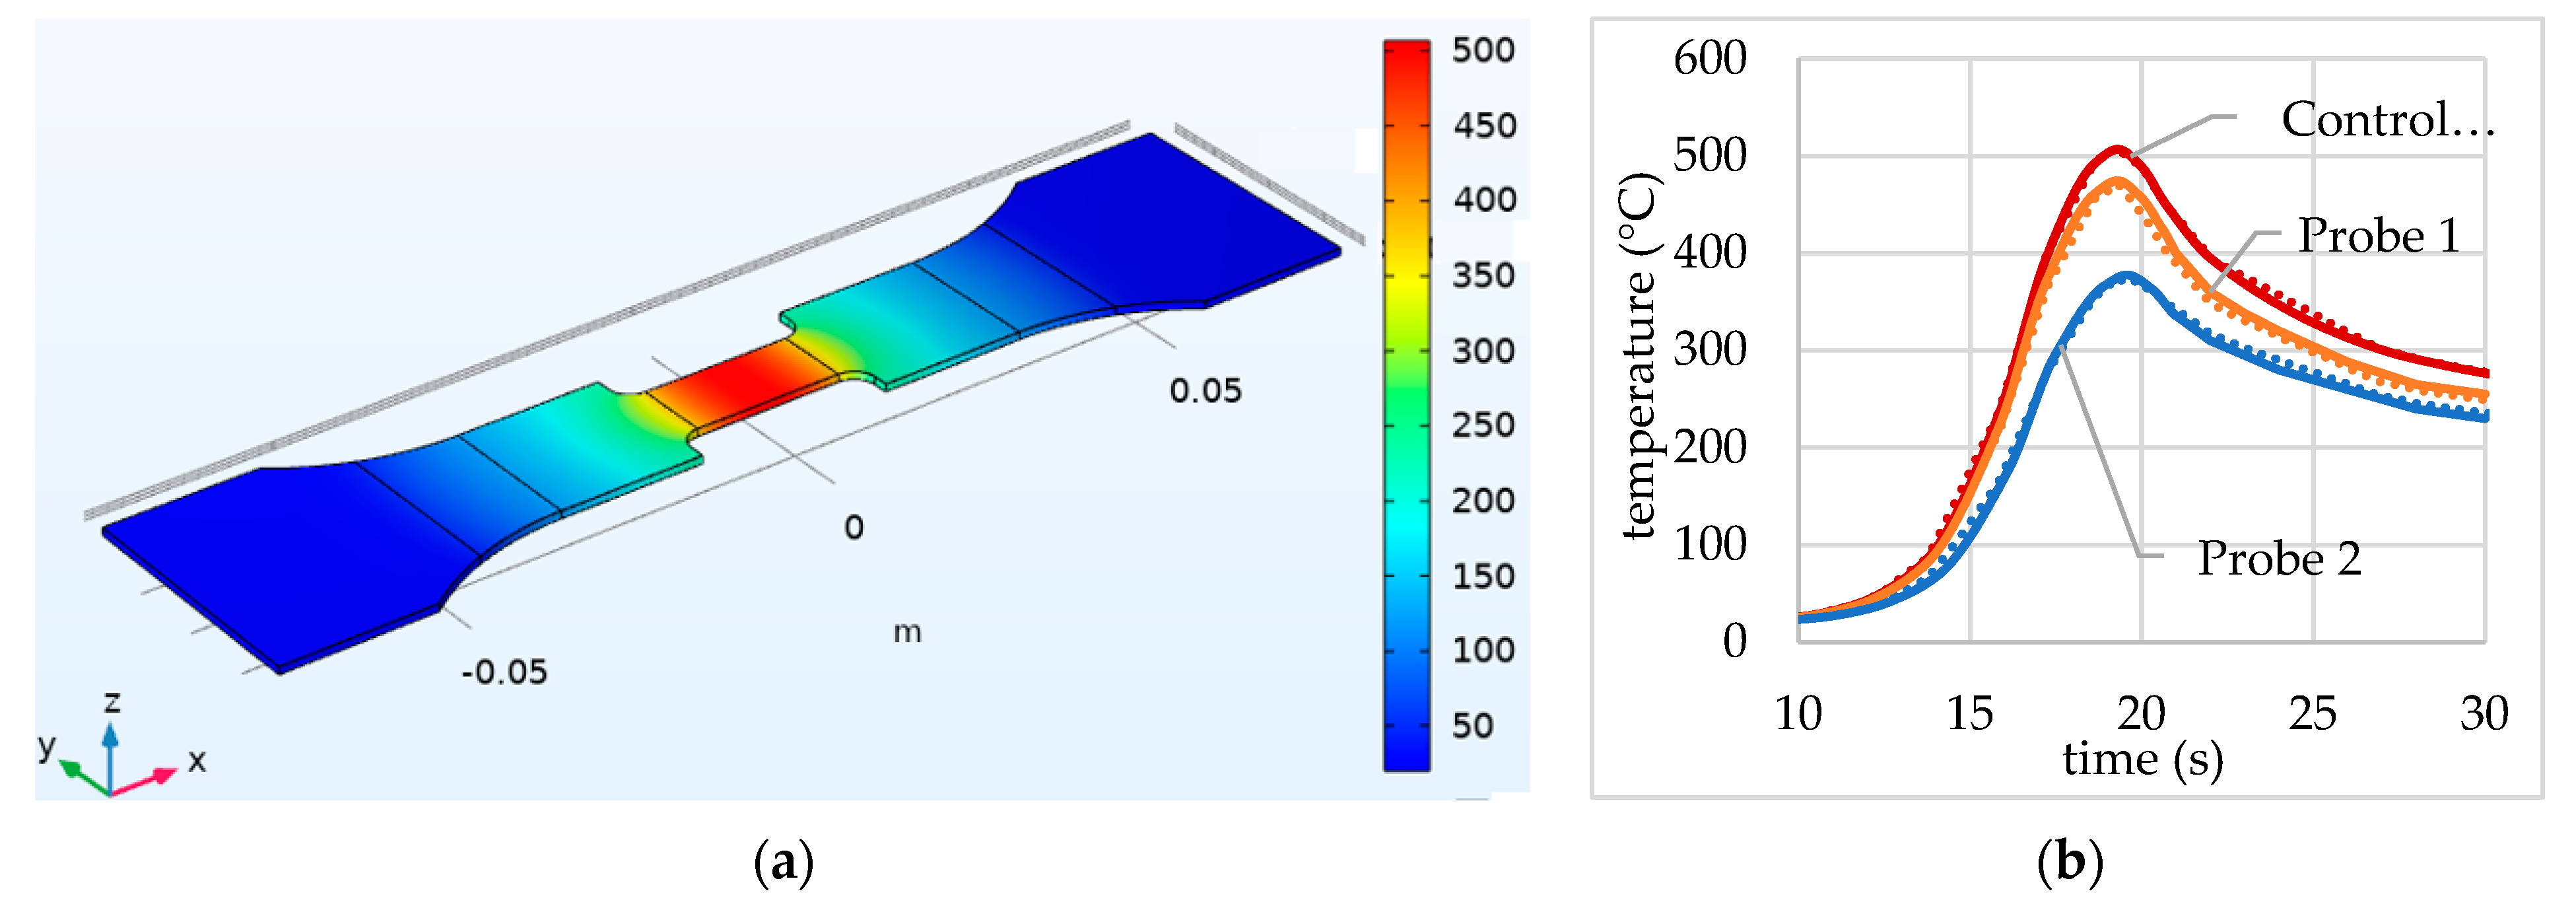
For each treatment condition (Table 3), the corresponding laser thermal cycle (Figure 8) is imposed in the control point of the specimen, while heat transfer coefficients are assigned on the specimen surface in contact with the grips and the non-tapered region. Figure 12b shows how the simulated peak temperature profile can be changed by varying, e.g., from 10 W/(m2⋅K) to 400 W/(m2⋅K), the heat transfer coefficient in the non-tapered region for the T510V5 treatment condition. Figure 13 shows the peak temperatures in the specimen (Figure 13a) and the thermal cycles that are simulated and measured on the Gleeble system (Figure 13b) in correspondence with the T510V5 condition. These results were obtained with 2000 W/(m2⋅K) and 400 W/(m2⋅K) heat transfer coefficients on the boundary surface of grips and non-tapered regions.

2.3. Hardness Tests on Tapered Specimen for Softening Investigation

The fully automatic Qness Q10+ hardness tester was used to define, for each tapered specimen subjected to physical simulation, the micro-hardness trend as a function of the distance from the specimen center (micro-hardness profile). The micro-hardness profile was constructed through micro-hardness measurements along the longitudinal axis of the tapered specimen with a pitch between two adjacent tests equal to 0.5 mm (pitch); the micro-hardness measurements were performed with a load of 0.2 kg and a dwell time of 5 s after grinding and polishing the specimen surface.
For each investigated laser condition (different treatment speeds and peak temperatures), three micro-hardness profiles were measured (along the central path and the two adjacent side paths, as shown in Figure 14); the measurements were performed on specimens immediately after Gleeble tests and one week after the physical simulation tests, as preliminary hardness tests showed that, after one week, the hardness value of the alloy remained constant.
Since the investigated alloy is an age-hardened aluminum alloy, during the rapid laser thermal cycle, the particles that cause precipitation hardening are partially locally dissolved. The drastic cooling rate leads to a super-satured solid solution that is an unstable condition. Therefore, the precipitation of secondary phases is promoted, leading to the natural ageing phenomenon [18].

2.4. Tensile Tests on Notched Specimen for Deformability Investigation

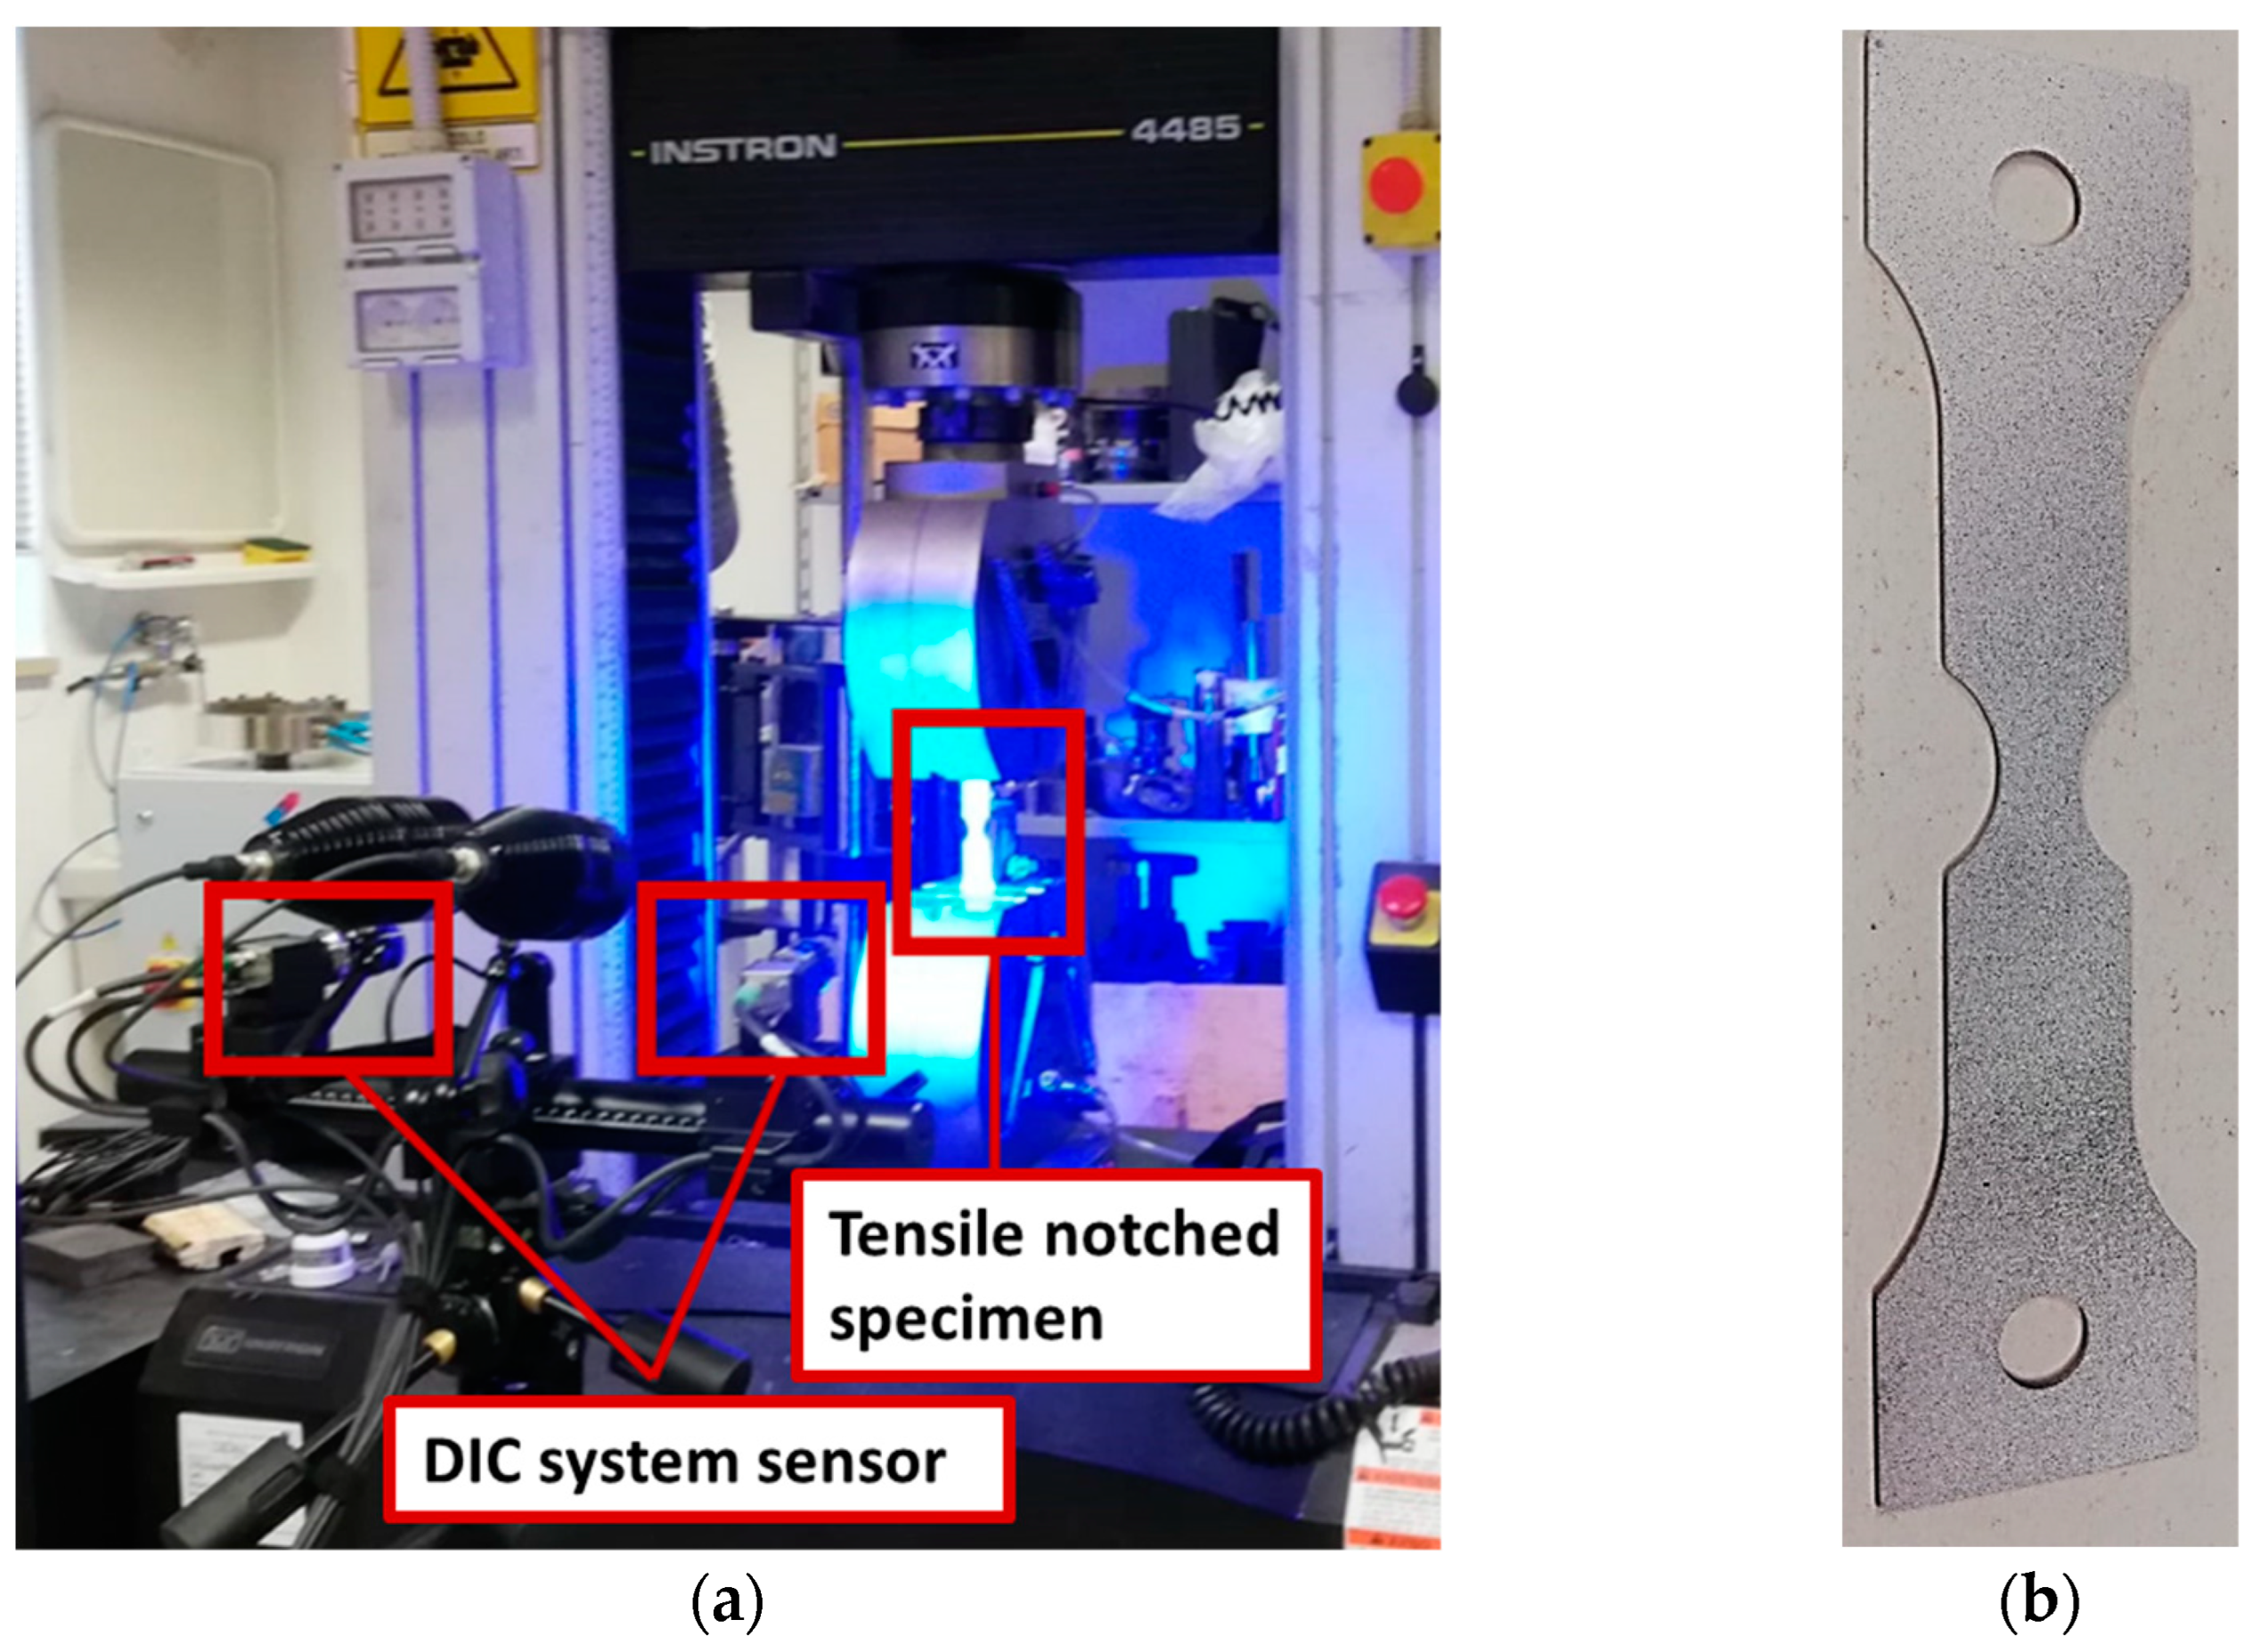
Uniaxial tensile tests were carried out on notched specimens by means of the Instron 4485 universal testing machine, assisted by the Digital Image Correlation (DIC) system ARAMIS 3D (provided by GOM) to continuously acquire the strain distribution during the test: the experimental setup is reported in Figure 15a.
Before tensile tests, specimens were sprayed with a withe matte layer to avoid reflection and, subsequently, with a random distribution of small black points, so that the resulting pattern (speckle) could be recognized by the two DIC cameras as a virtual grid (Figure 15b). For hardness tests, tensile tests were also performed on specimens immediately after treatment and on those that underwent natural aging. To ensure repeatability, three tensile tests were performed for each investigated laser condition.

3. Results and Discussion

Gleeble tests were performed by imposing the thermal cycles shown in Figure 8 at the central point of tapered and notched specimens. After physical simulation tests, the tapered and notched specimens were used for hardness and tensile tests, respectively, to study the APS and T4 sample states. The experimental plan and the number of repetitions for each laser treatment condition and sample state are summarized in Table 4.

3.1. Physical Simulation Test Results

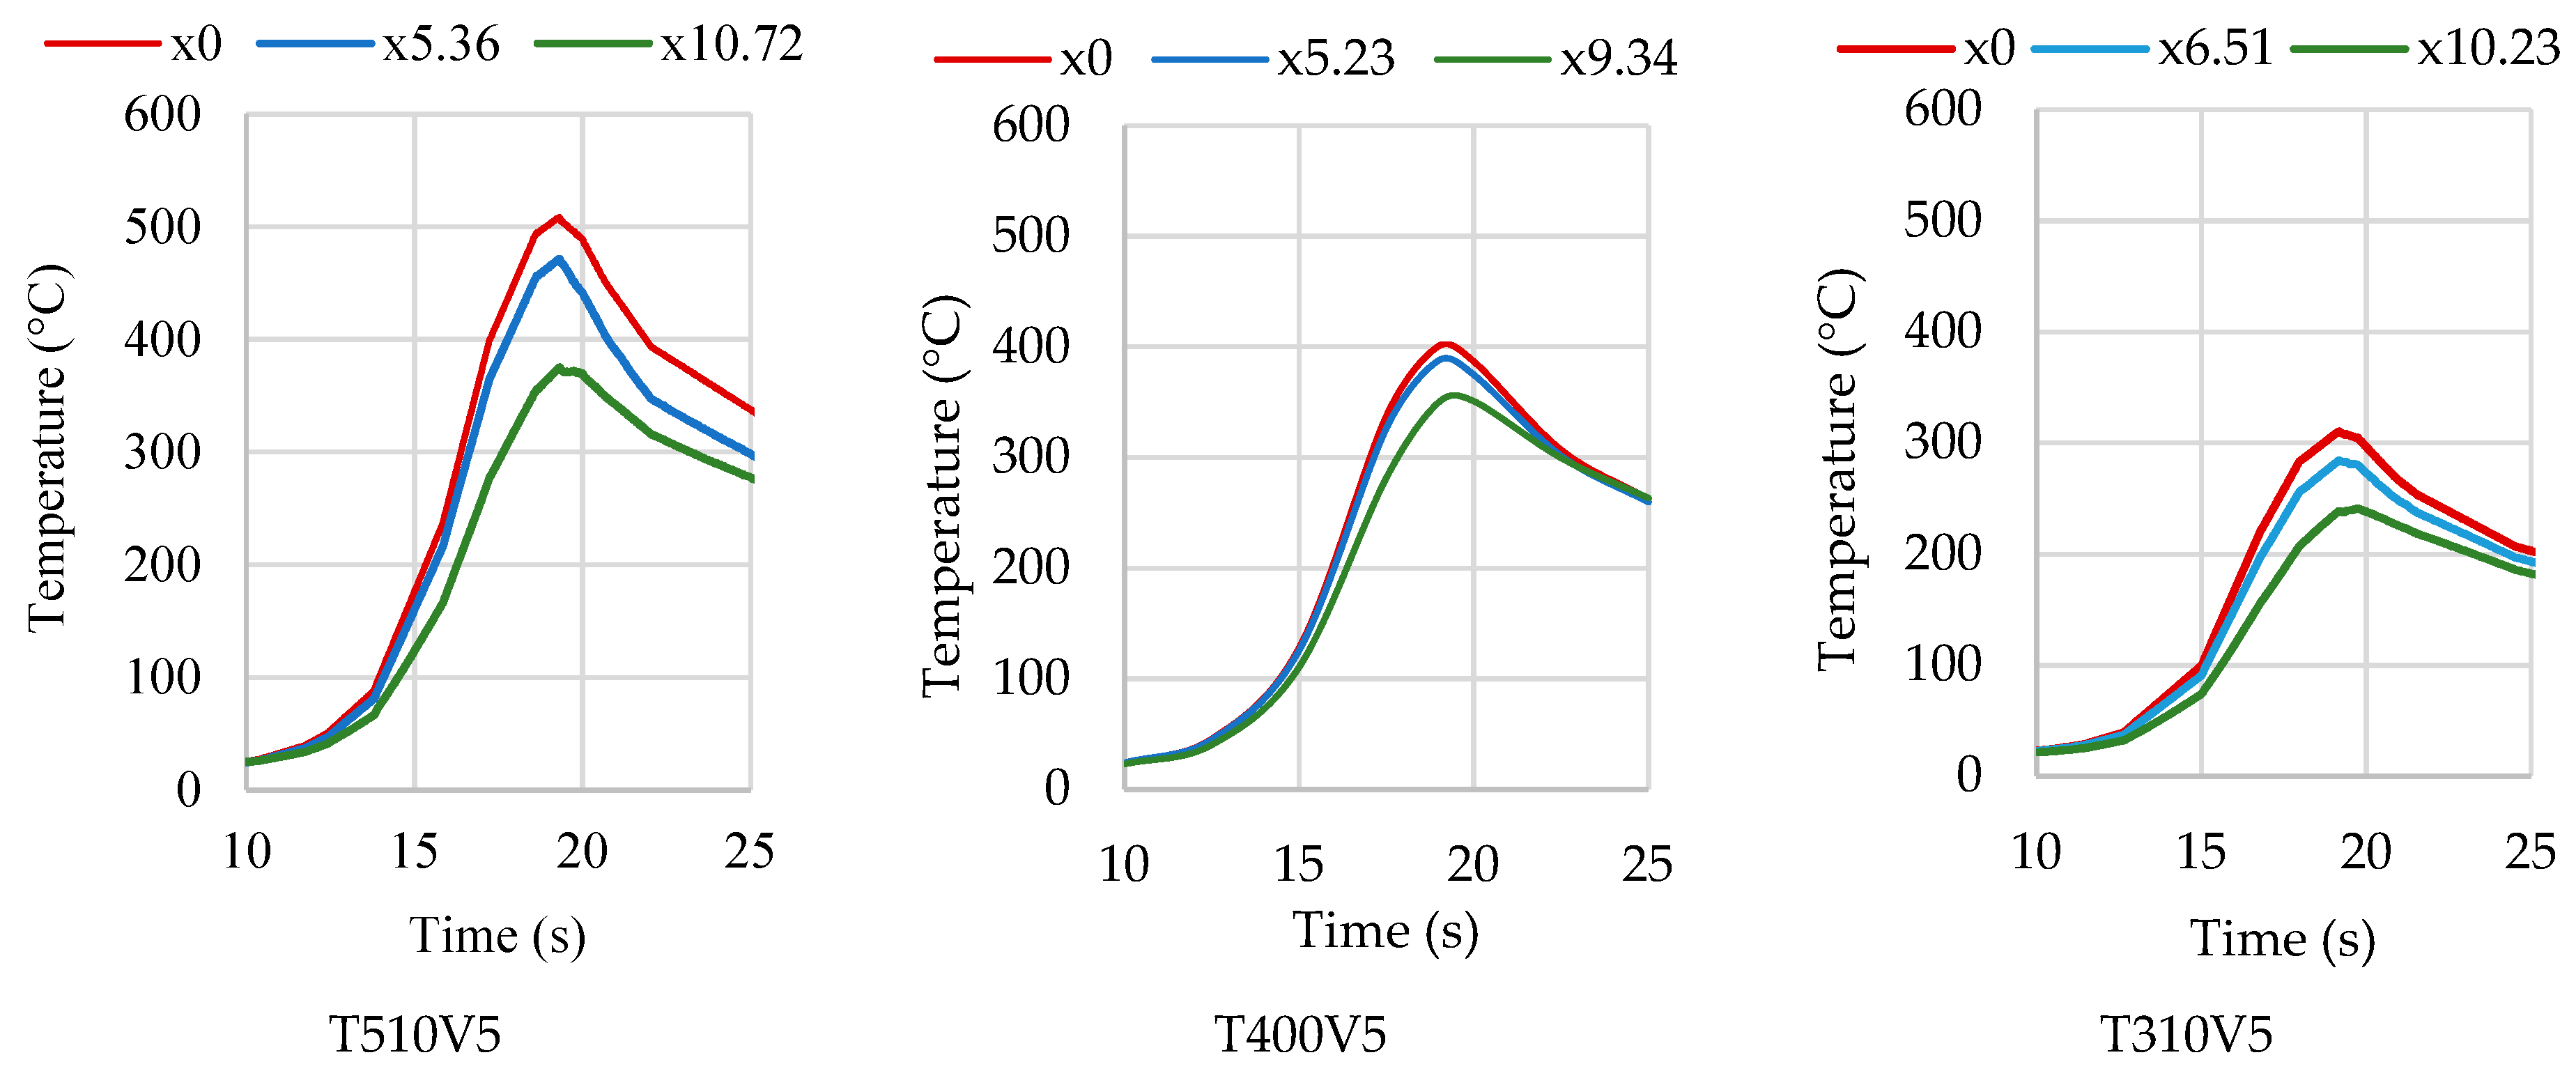
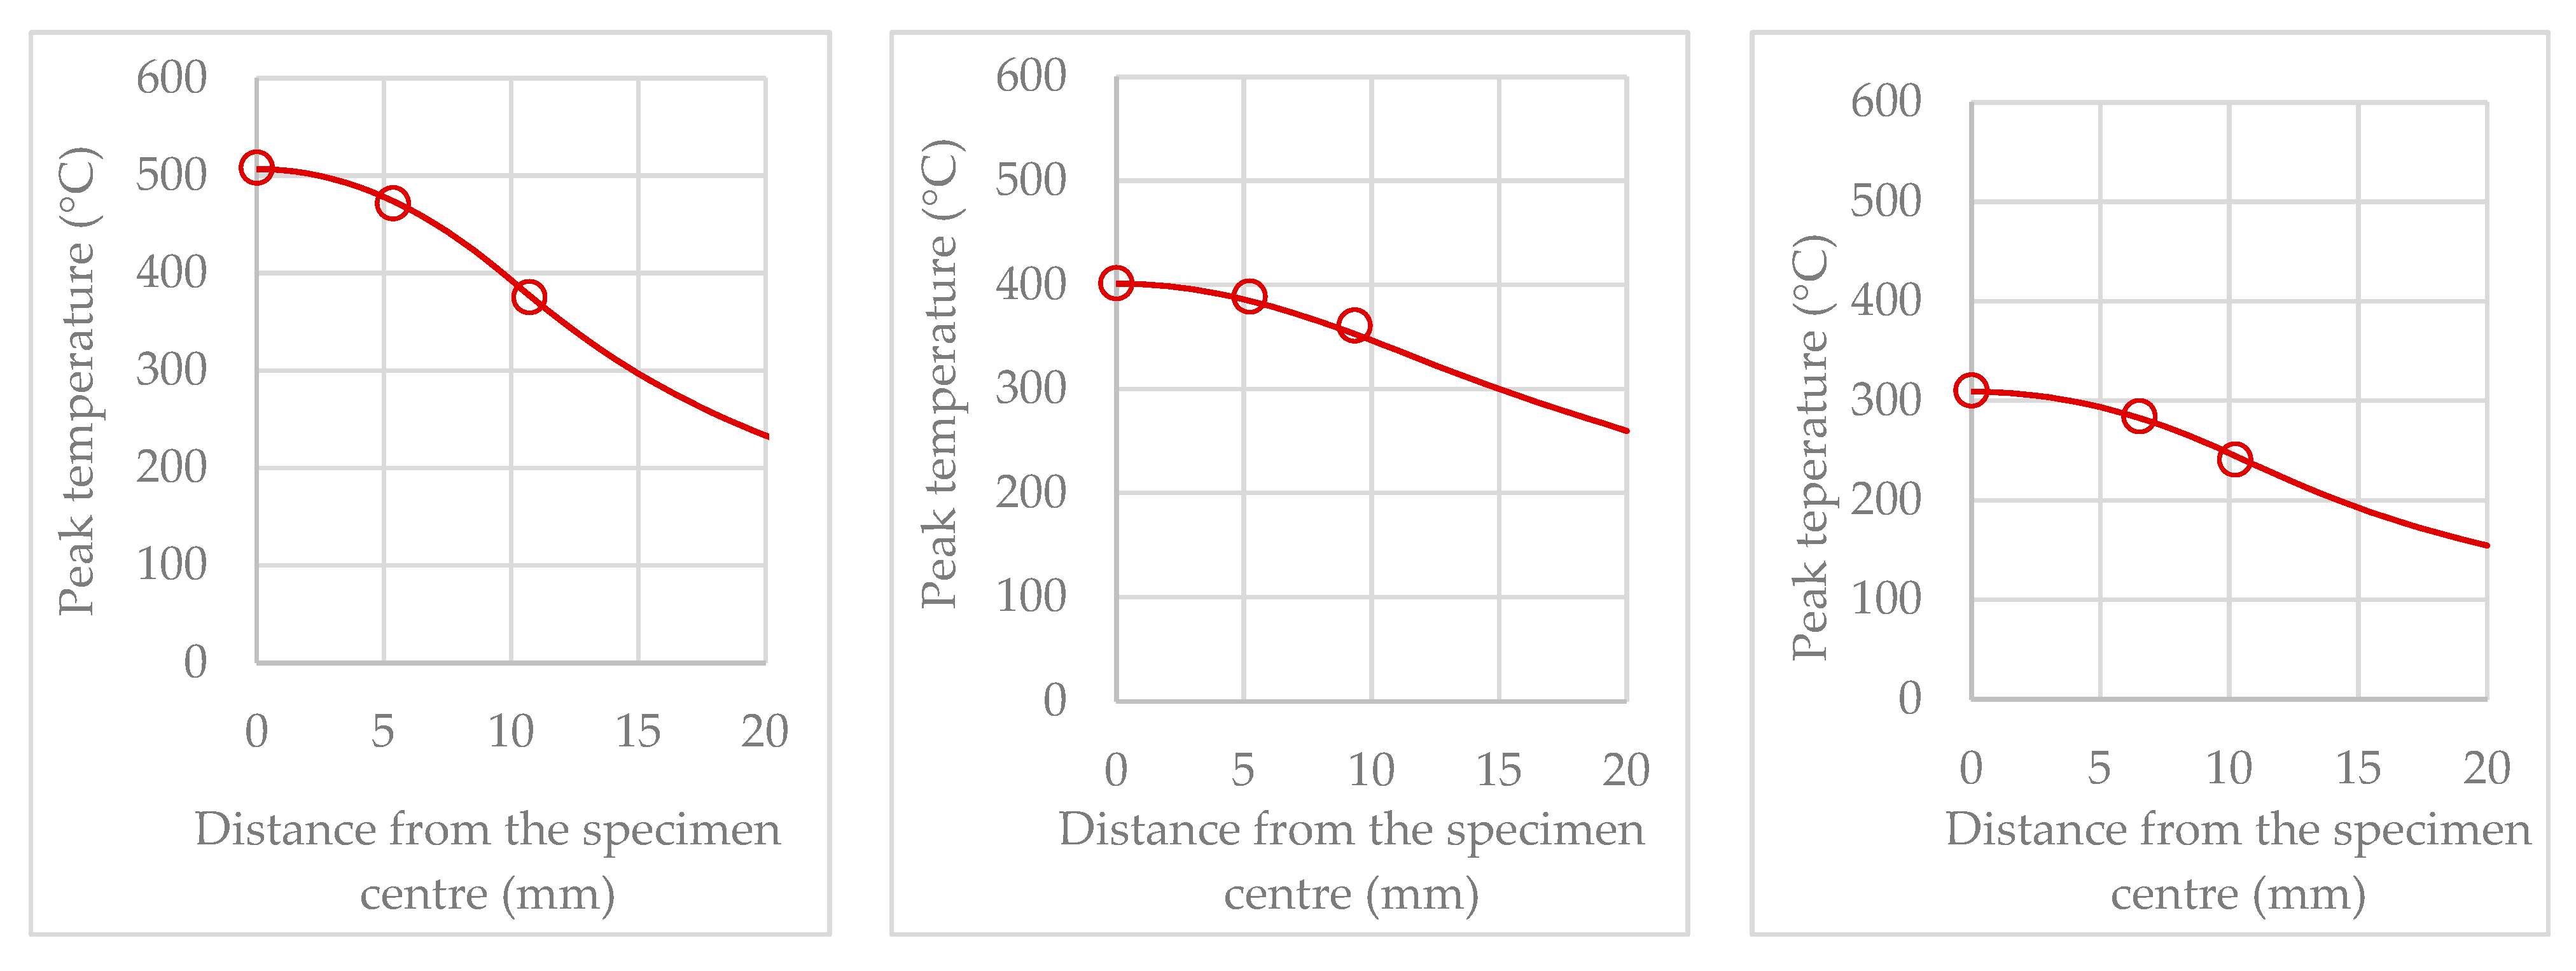
Figure 16 shows the thermal cycles measured in the tapered specimen in physical simulation tests of the laser treatment, characterized by a treatment speed of 5 mm/s. The thermal cycle in the specimen central point (x0) corresponds to the one set (Figure 8), while those at lower temperatures are measured by thermocouples welded about 5 mm and 10 mm from the central thermocouple.
The match between thermal cycles simulated with the FE model and those measured with thermocouples was achieved by varying the convective exchange coefficient in the region of the specimen in contact with the clamps. Figure 17 compares the temperature profiles estimated with the FE model (solid line) with the peak temperatures measured by thermocouples (circles marker) in physical simulation tests of thermal cycles relating to the treatment speed of 5 mm/s and at peak temperatures at midpoints of about 500 °C, 400 °C and 300 °C. The high fit between the experimental and numerical results in the points where the thermocouples were welded was recorded for all physical simulation tests that were carried out.

3.2. Effects of Thermal Cycles on Material Softening

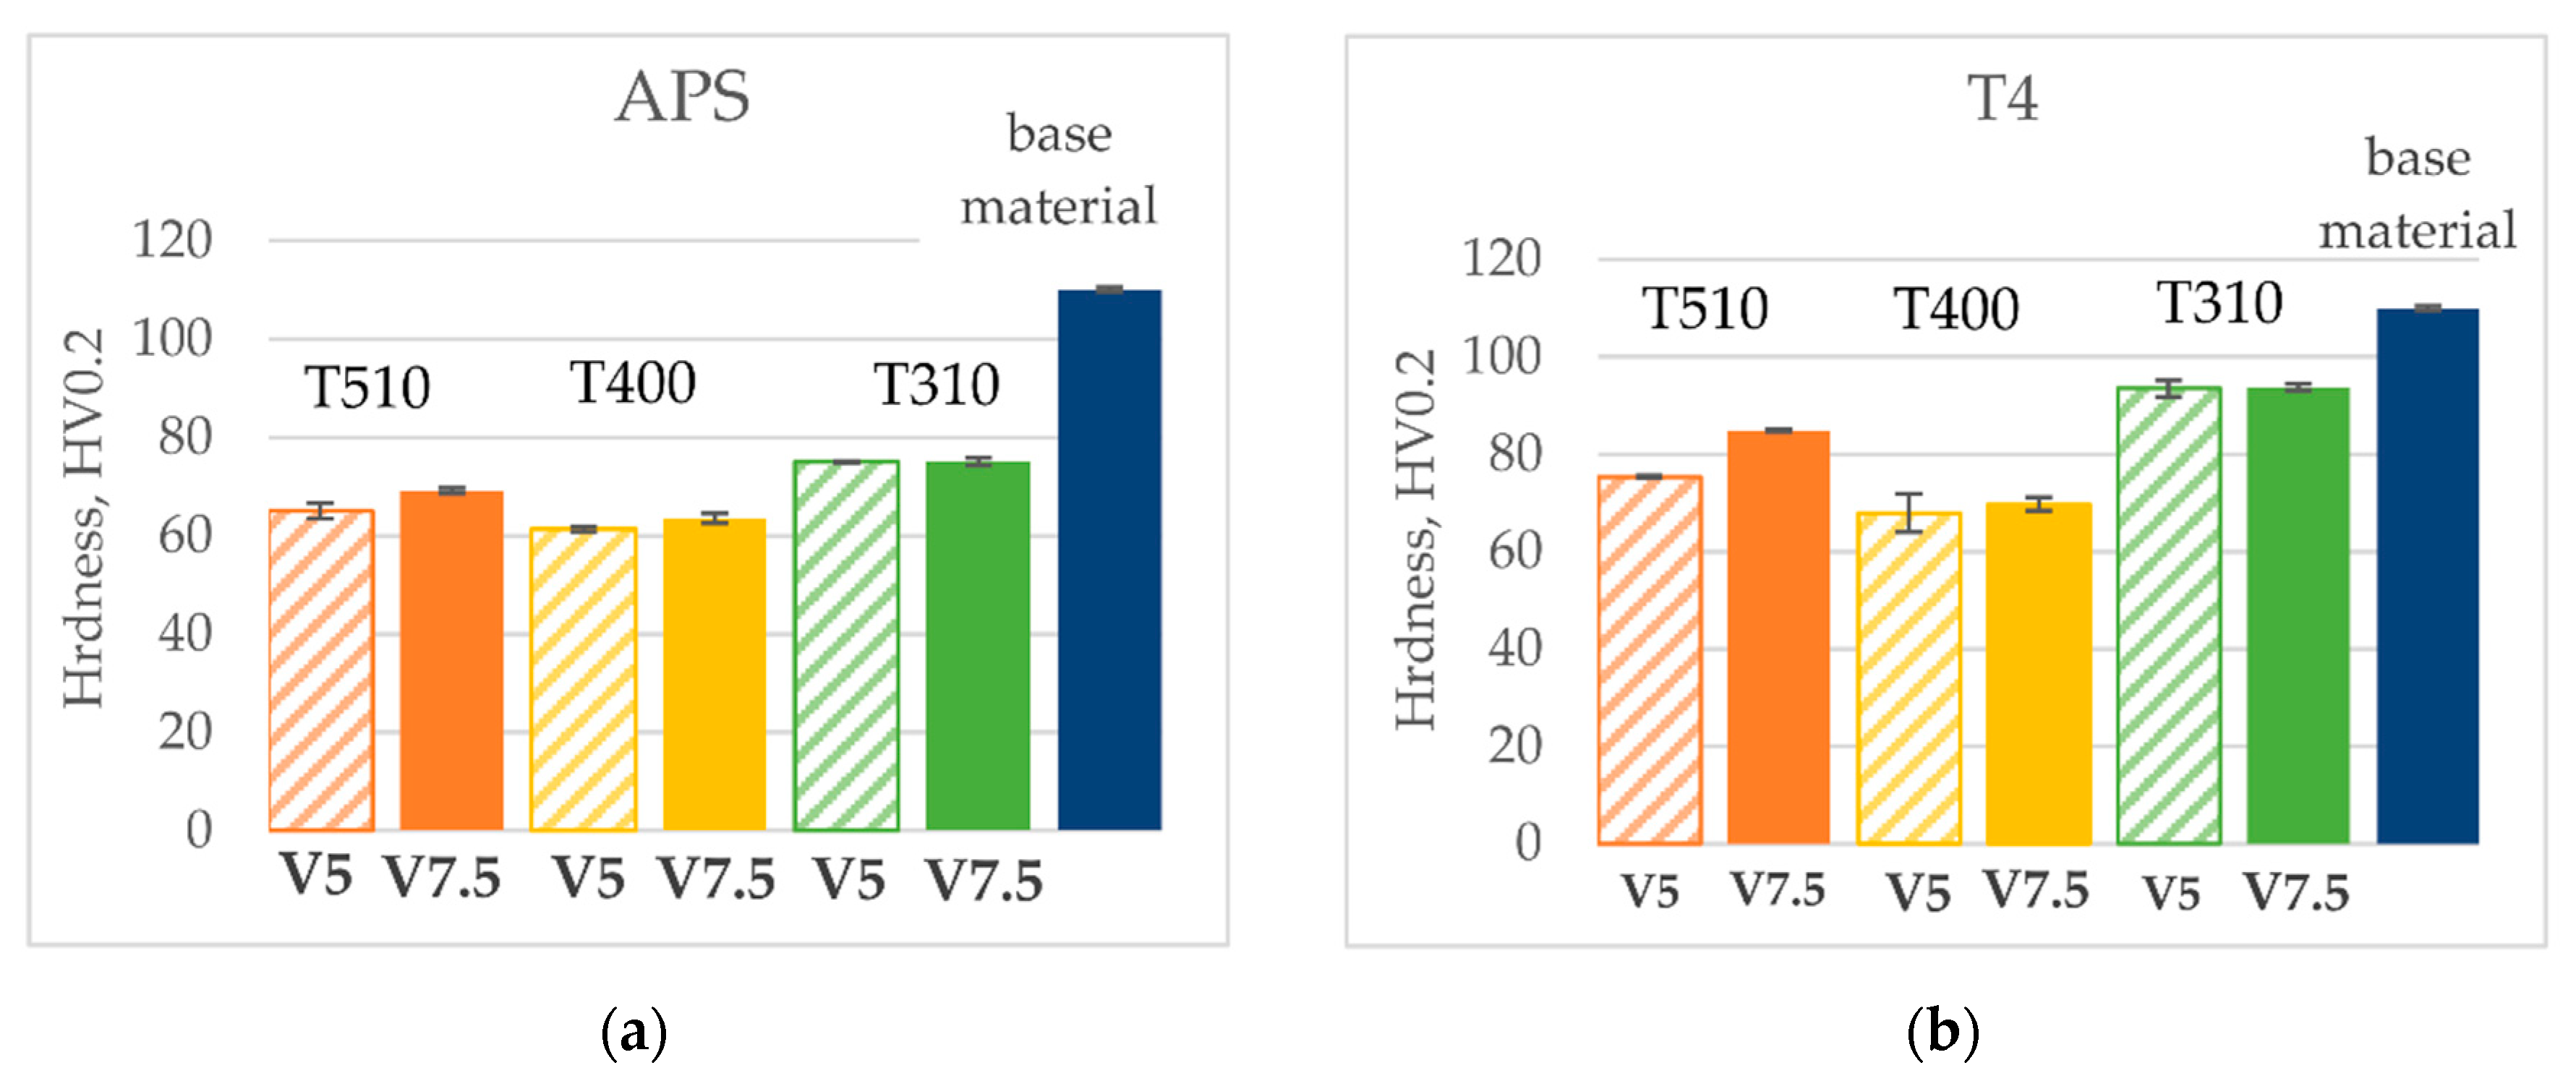
Figure 18 summarises the hardness mean values obtained at the center of tapered specimens immediately after physical simulation (Figure 18a) and after physical simulation and natural aging (Figure 18b), for each treatment speed and peak temperature. These graphs also show the calculated standard deviations, represented as error bars between the hardness values measured in the specimen central section for each repetition. The errors in hardness measurements are, at most, 1 HV. The low standard deviation values are justified by the fact that the hardness measurements were evaluated at the central specimen centre where the thermal cycle was imposed (near the control thermocouple).
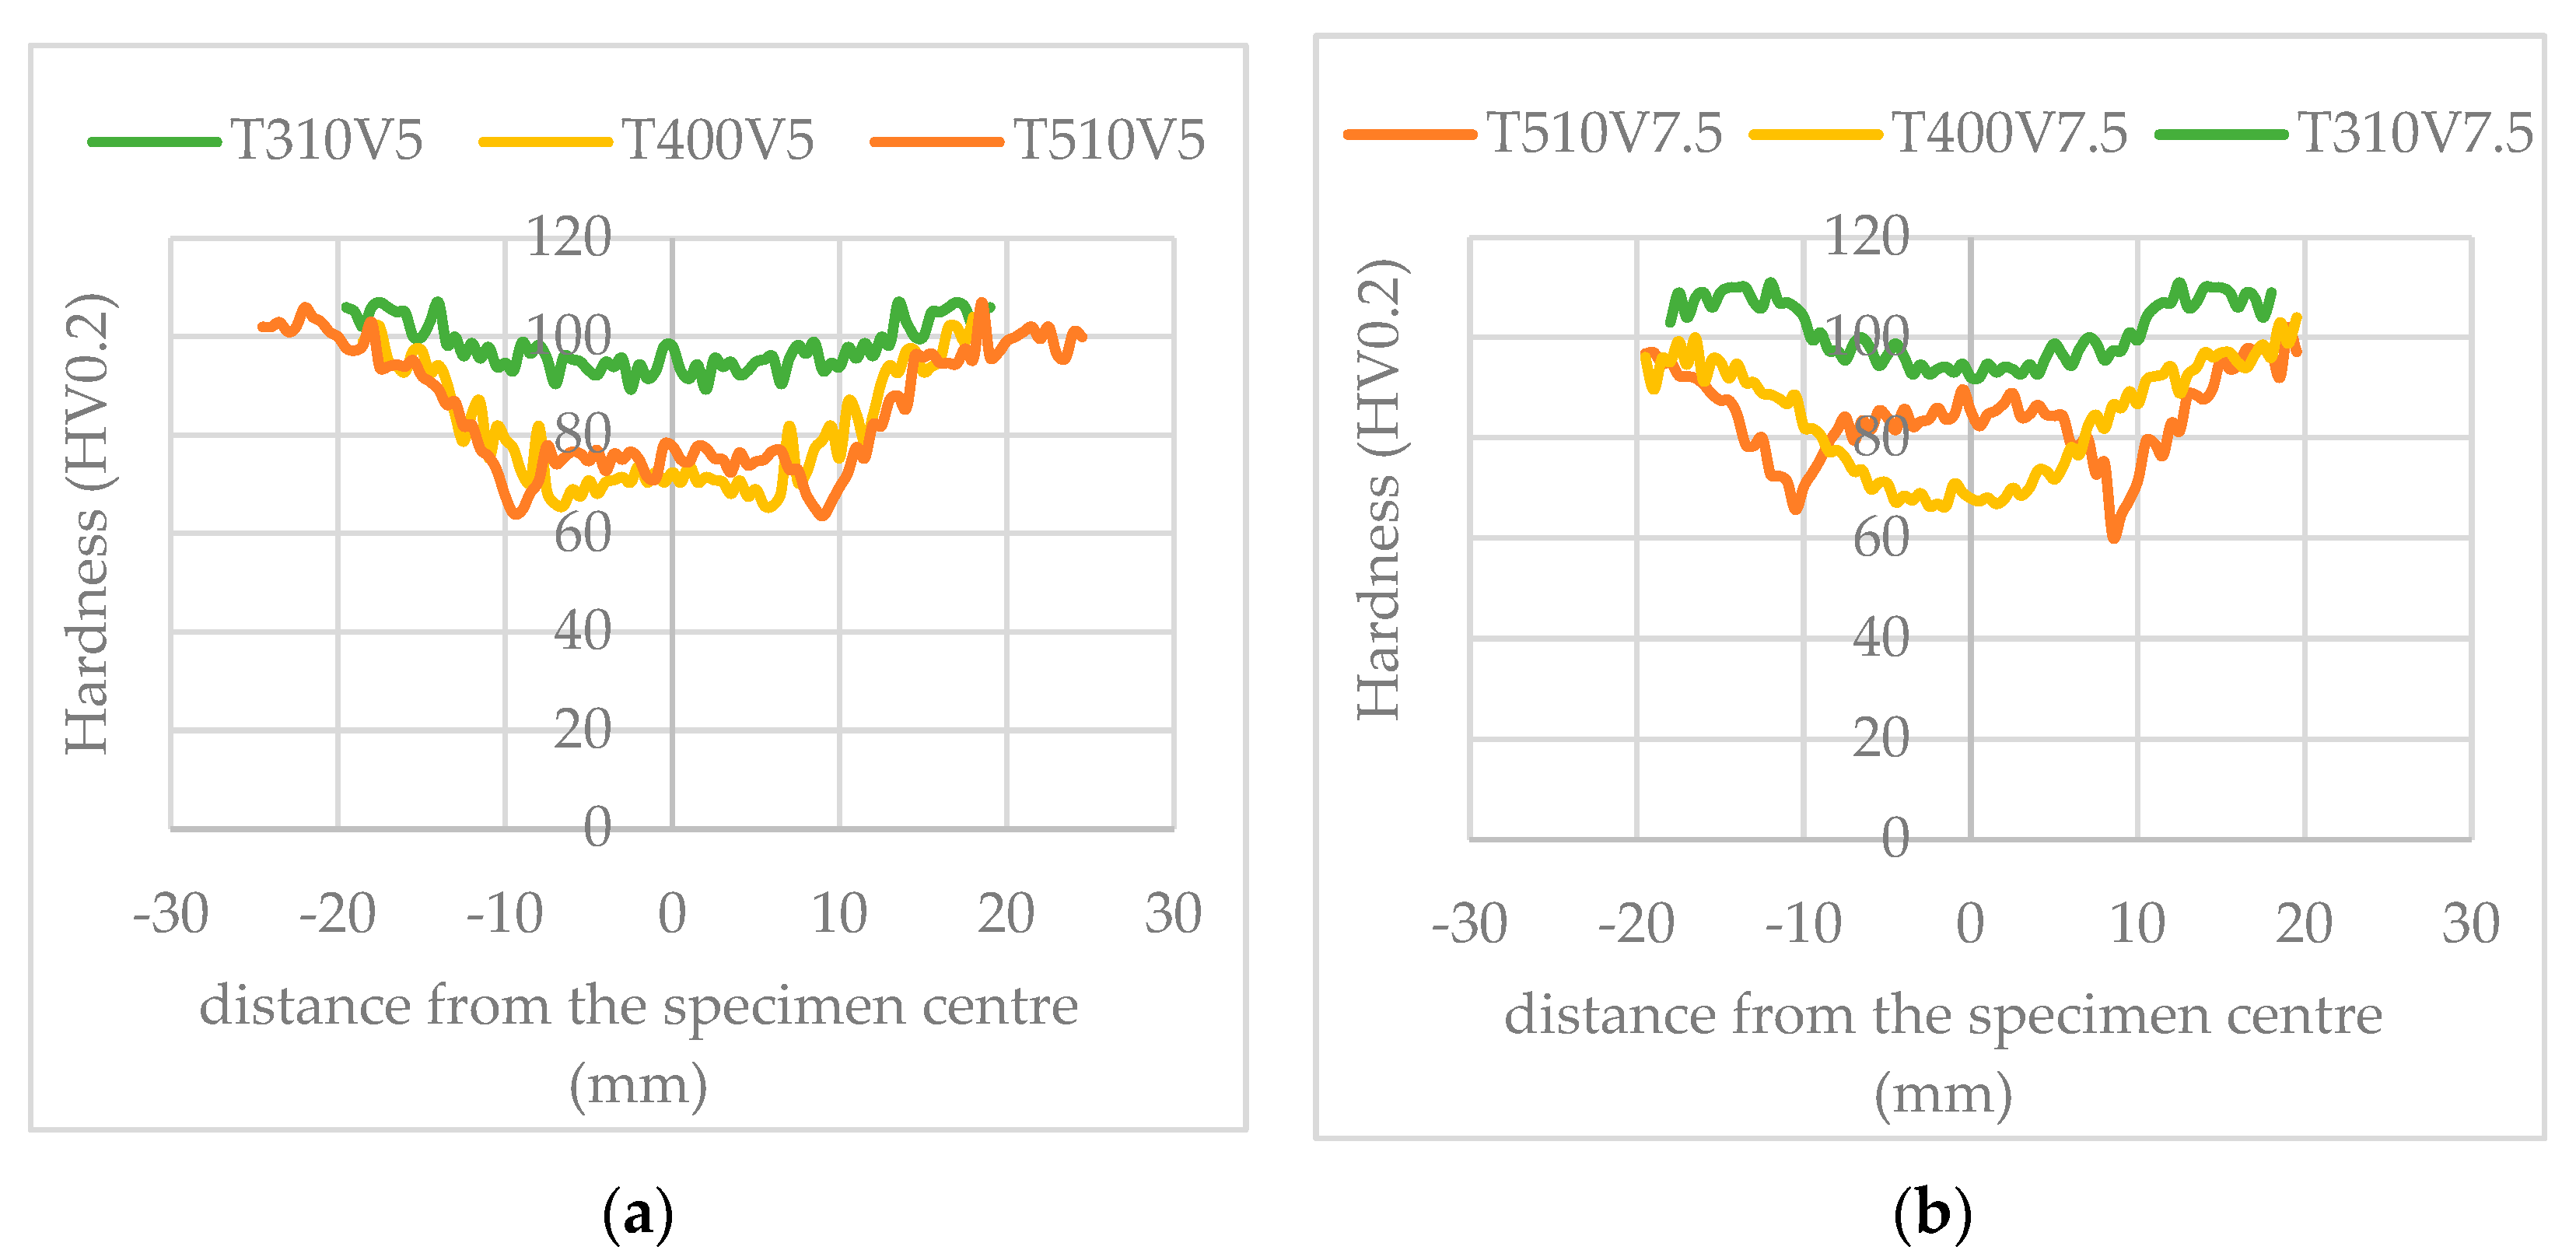
It is observed that as the treatment speed decreases, the hardness value slightly decreases for all investigated peak temperatures. However, the effect of treatment speed on softening is more evident at the highest tested peak temperatures, especially in the T4 state. This behaviour is explained by the greater dissolution of the precipitates that were initially present in the alloy. At the moment at which micro-hardness measurements were performed, the softening obtained in the T4 state is constantly lower than that measured in the APS state, confirming the precipitation of Mg and Si atoms solubilized during the thermal cycle imposed by the physical simulation. Finally, a marked influence of peak temperature is observed, with the greatest reduction in hardness occurring at the peak temperature of about 400 °C, especially in the T4 state. Based on the temperature profiles estimated with the thermoelectric FE model, the effect of the peak temperature on softening can be investigated by analyzing the micro-hardness profiles. Figure 19 shows, for example, micro-hardness profiles measured in tapered specimens in the T4 state for all explored treatment speeds and peak temperatures (Figure 8). Figure 19a compares the hardness profiles relating to treatment with a speed of 5 mm/s, while Figure 19b compares those corresponding to a treatment speed of 7.5 mm/s.
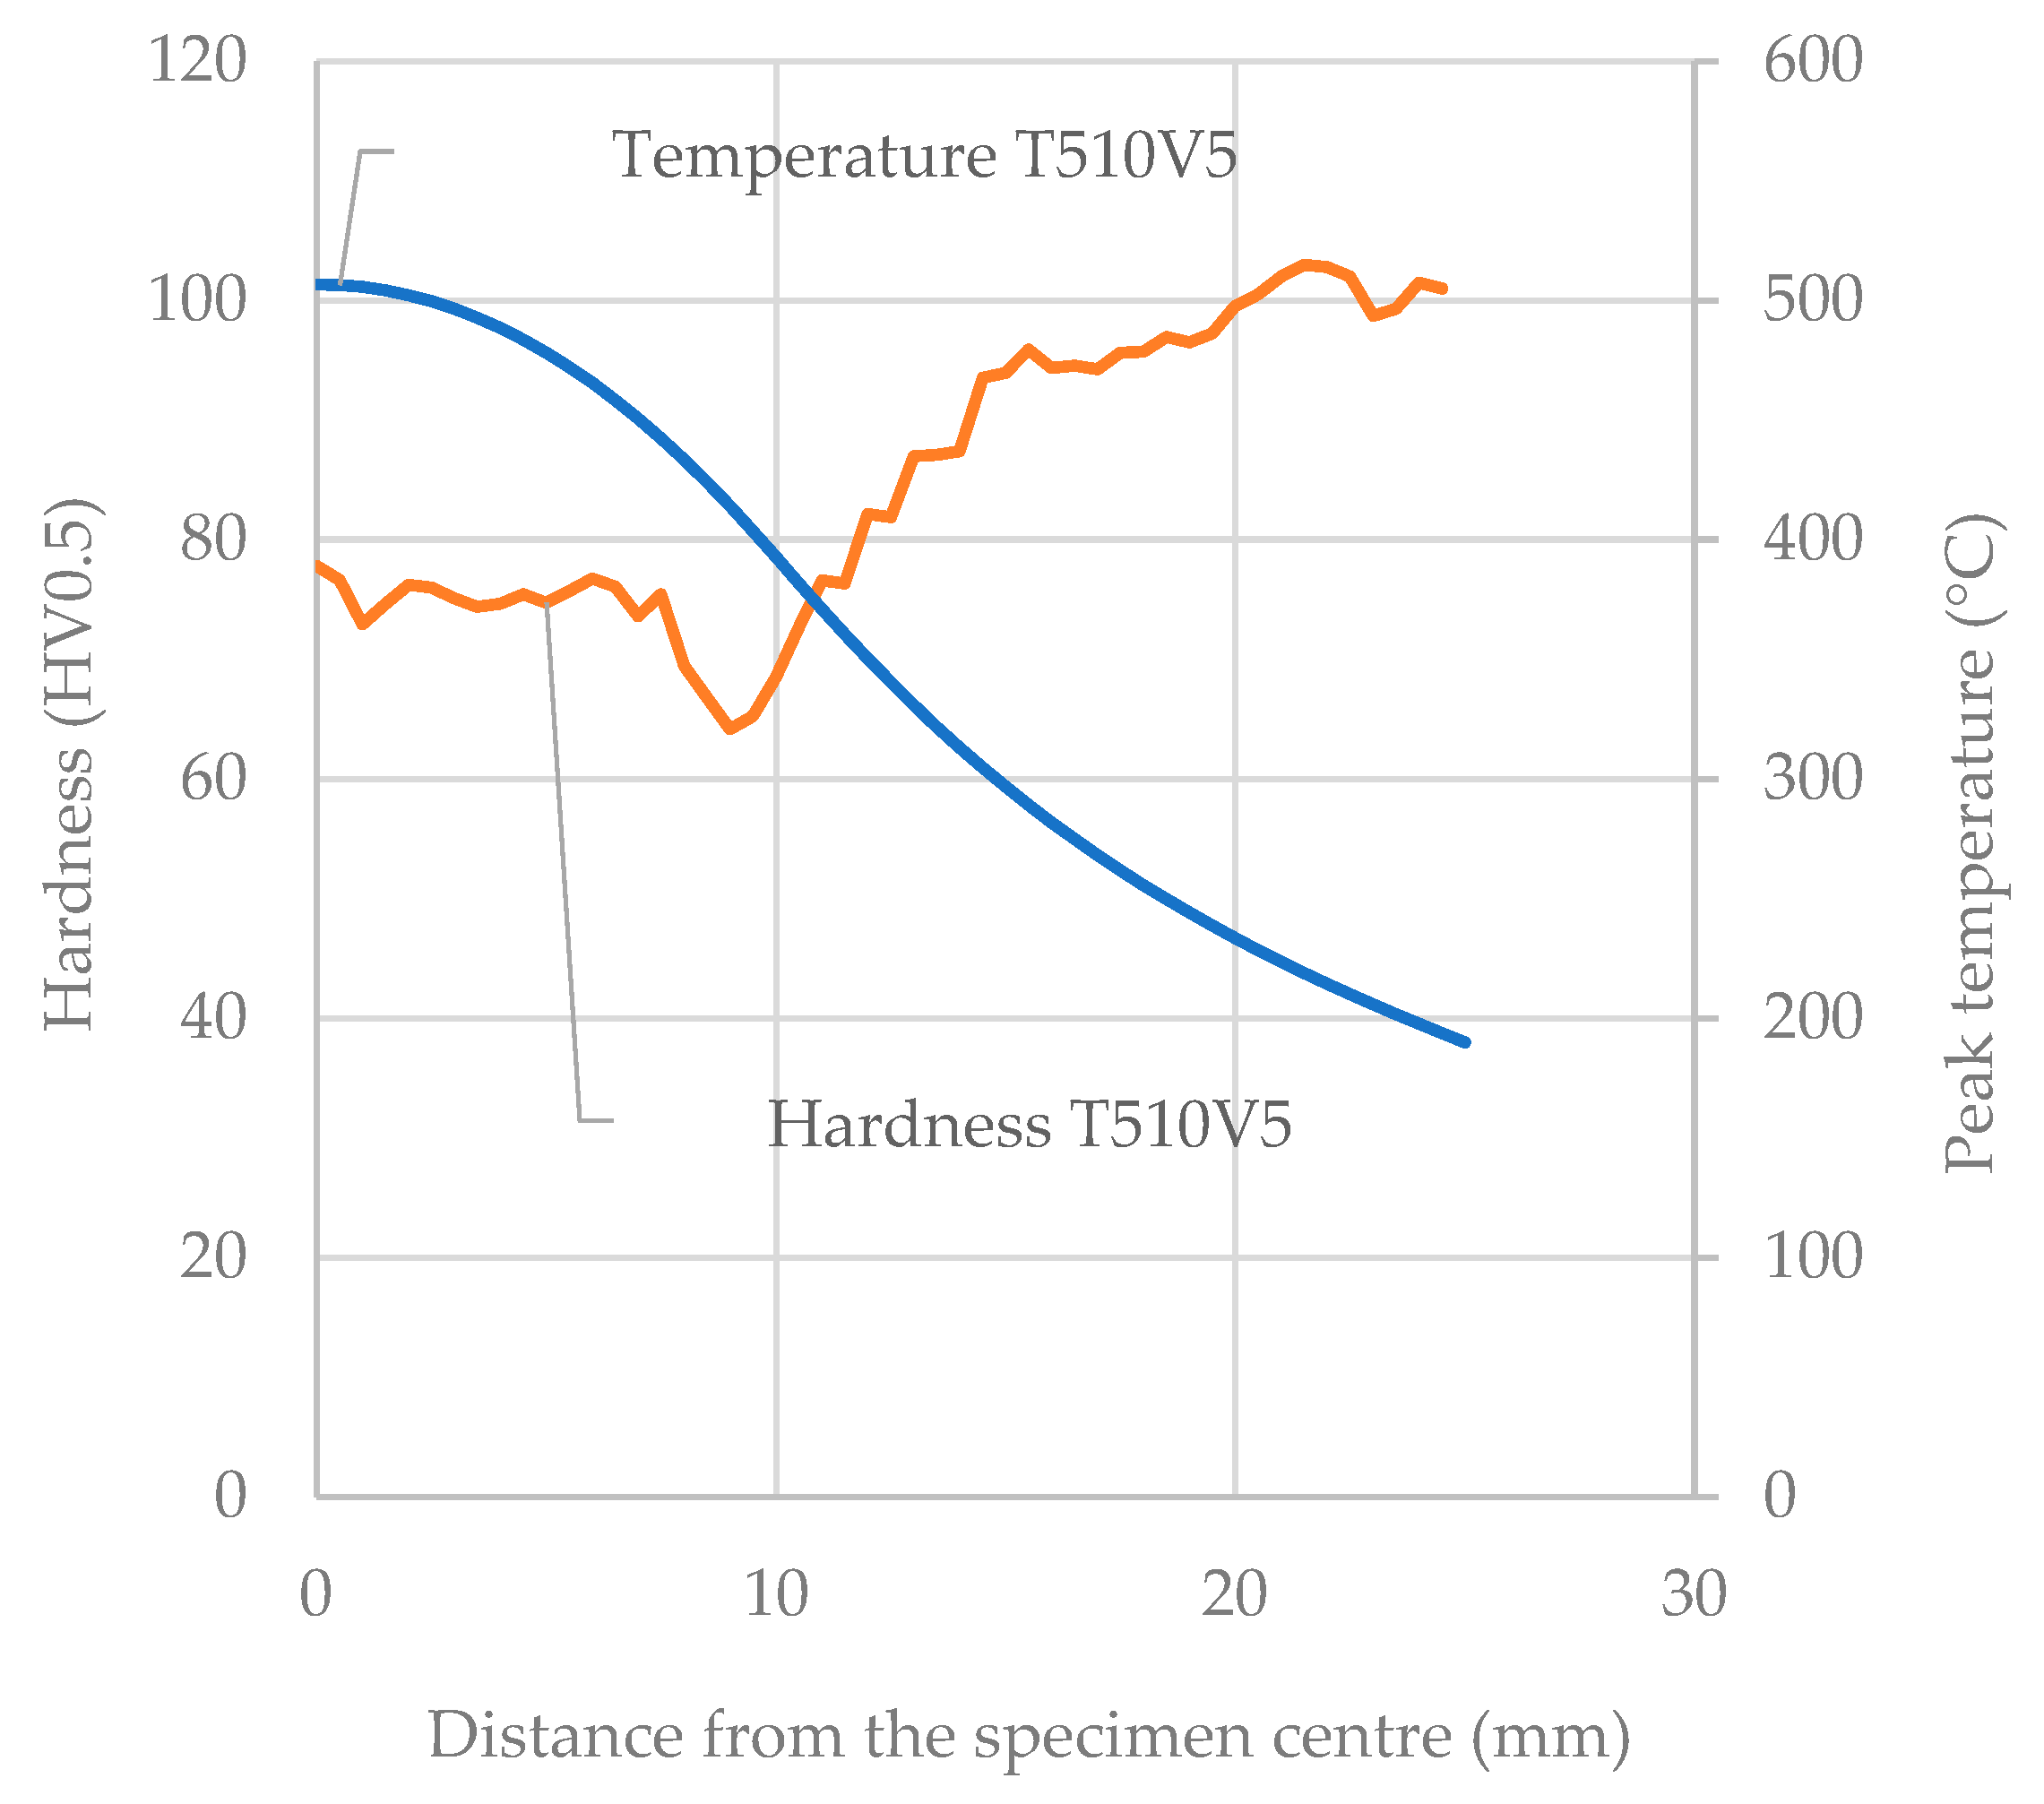
By analyzing the micro-hardness values measured at the specimen center, it is confirmed that, for both treatment speeds, the maximum softening occurs in the tests with a peak temperature of about 400 °C. However, considering the entire hardness profile, the maximum softening occurs in the tests performed with a peak temperature of about 510 °C, even if the position of maximum softening does not coincide with the center of the specimen. To investigate this result, the hardness profiles proposed in Figure 19 were compared with the temperature profiles estimated with the FE model; for example, Figure 20 compares treatment condition T4 with a treatment speed of 5 mm/s and peak temperature of about 510 °C. Figure 21 highlights the hardness trend as a function of peak temperature obtained by combining the profiles in Figure 20. It is observed that the minimum hardness occurs at a peak temperature of about 430 °C.
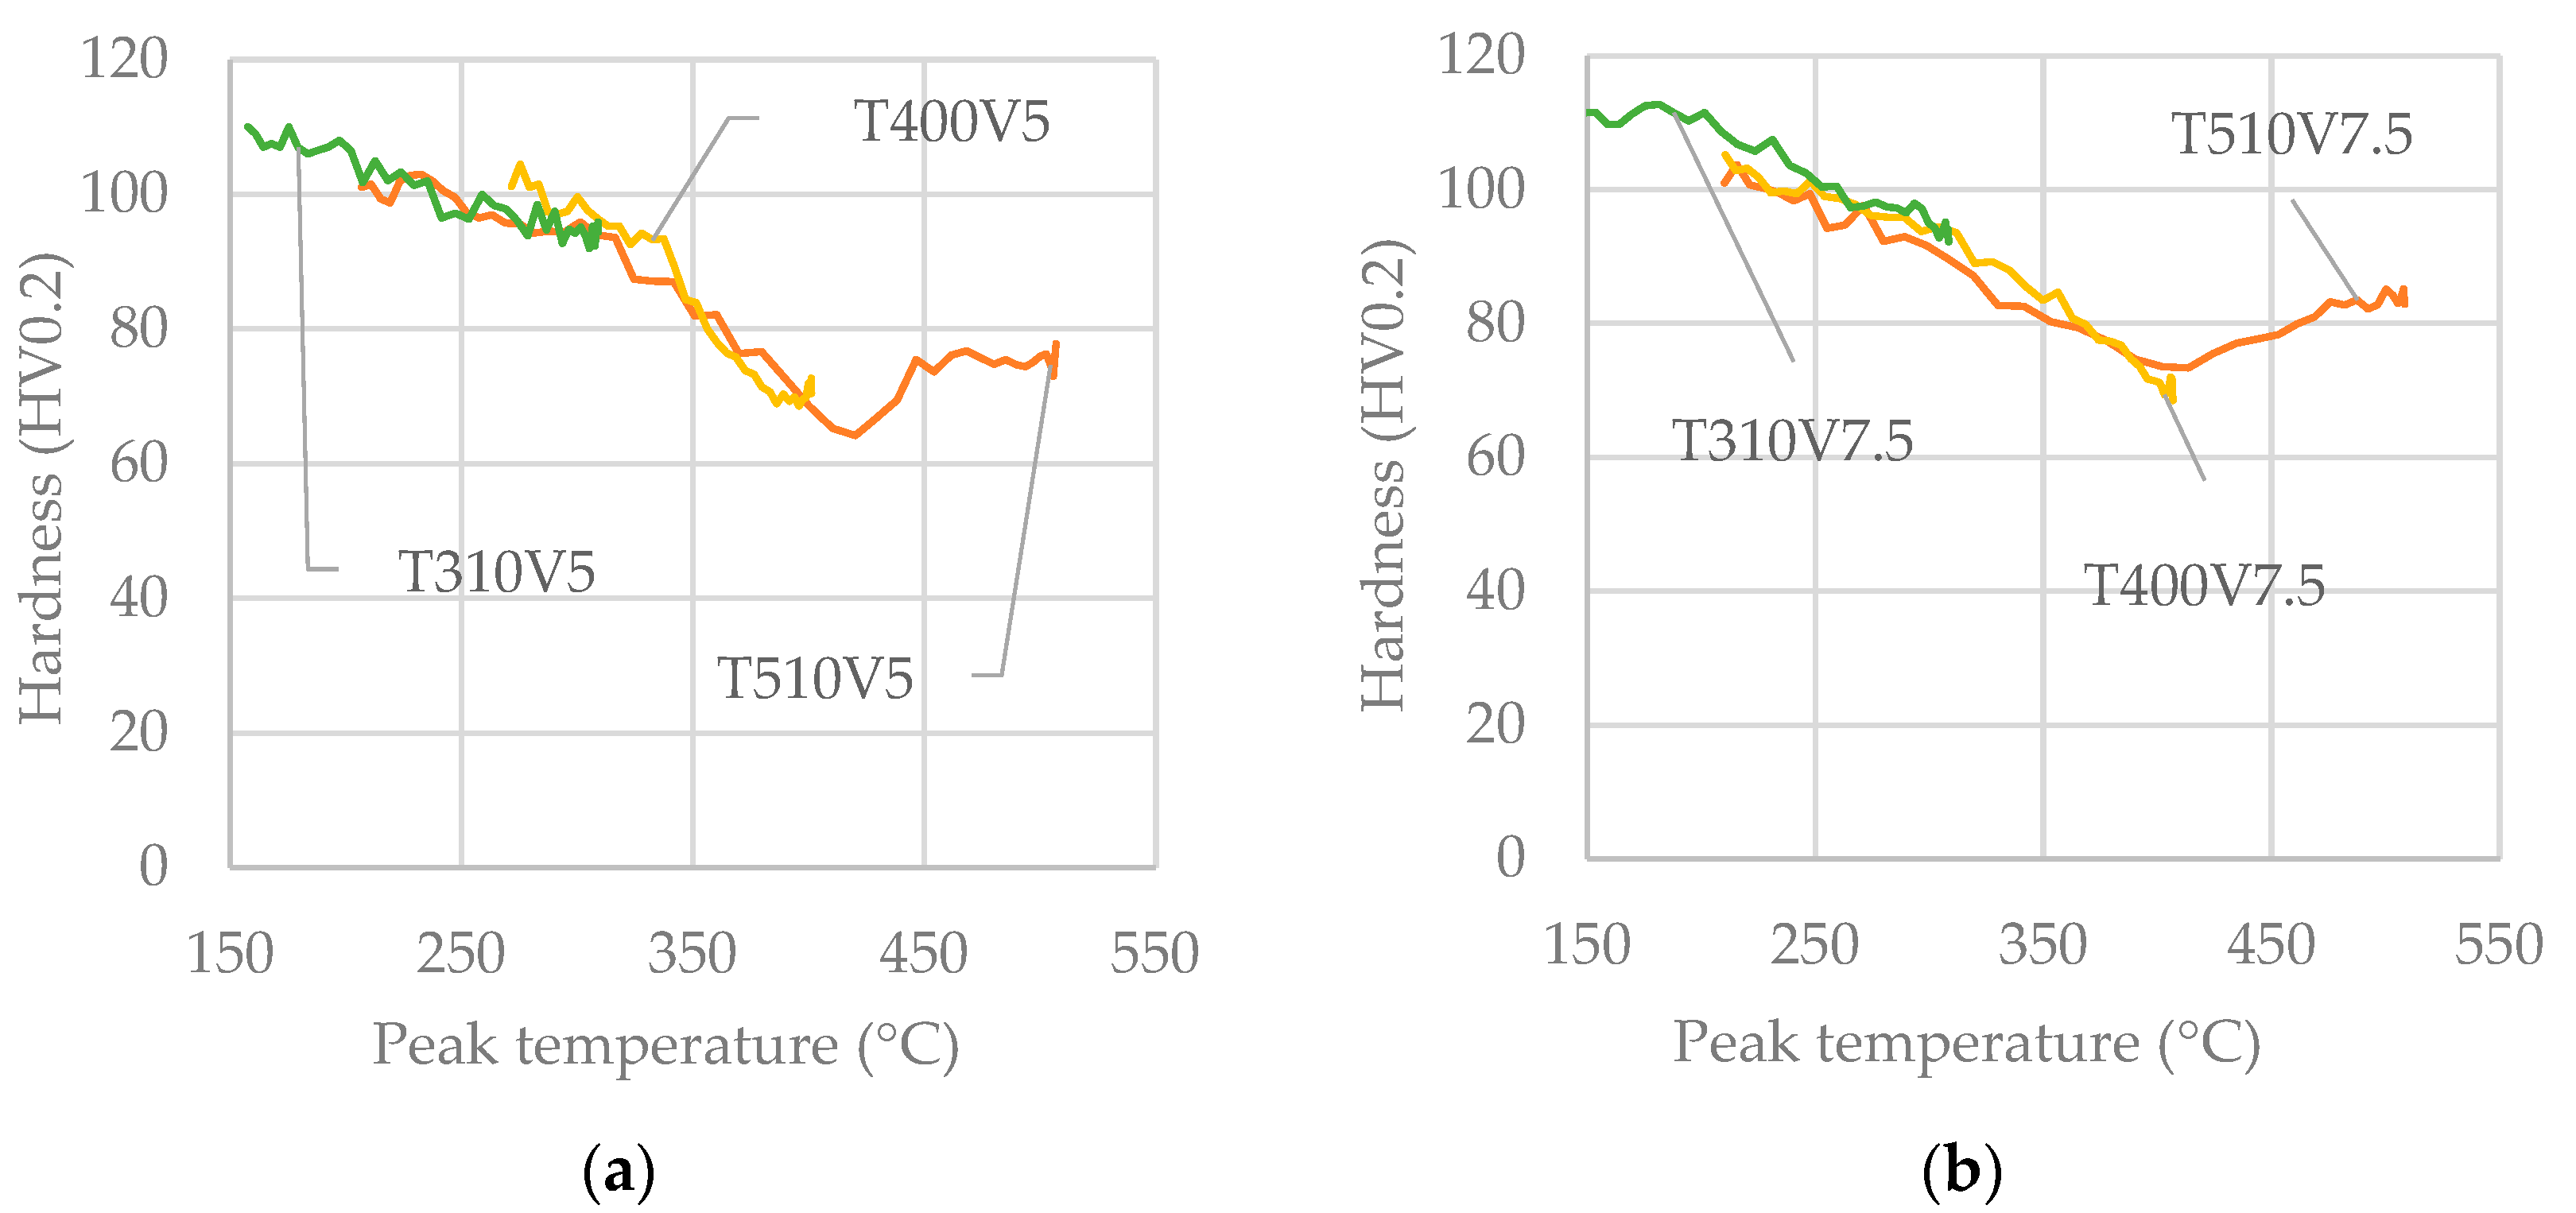
Curves like those proposed in Figure 21 were obtained by varying the treatment speed and the peak temperature. Overall, these trends showed great repeatability and those proposed in Figure 22 are sufficiently representative of the softening achieved in the alloy in the T4 state for both investigated treatment speeds. There is an overlap of the hardness values obtained with thermal cycles at different peak temperatures when setting the treatment speed. Hence, a single Gleeble test at a peak temperature of 510 °C allows for the hardness values of all peak temperatures of interest to be explored. In the T4 state, the maximum softening treatment temperature is between 420 and 430 °C and an increase in the laser treatment speed involves a reduction in maximum achievable softening.
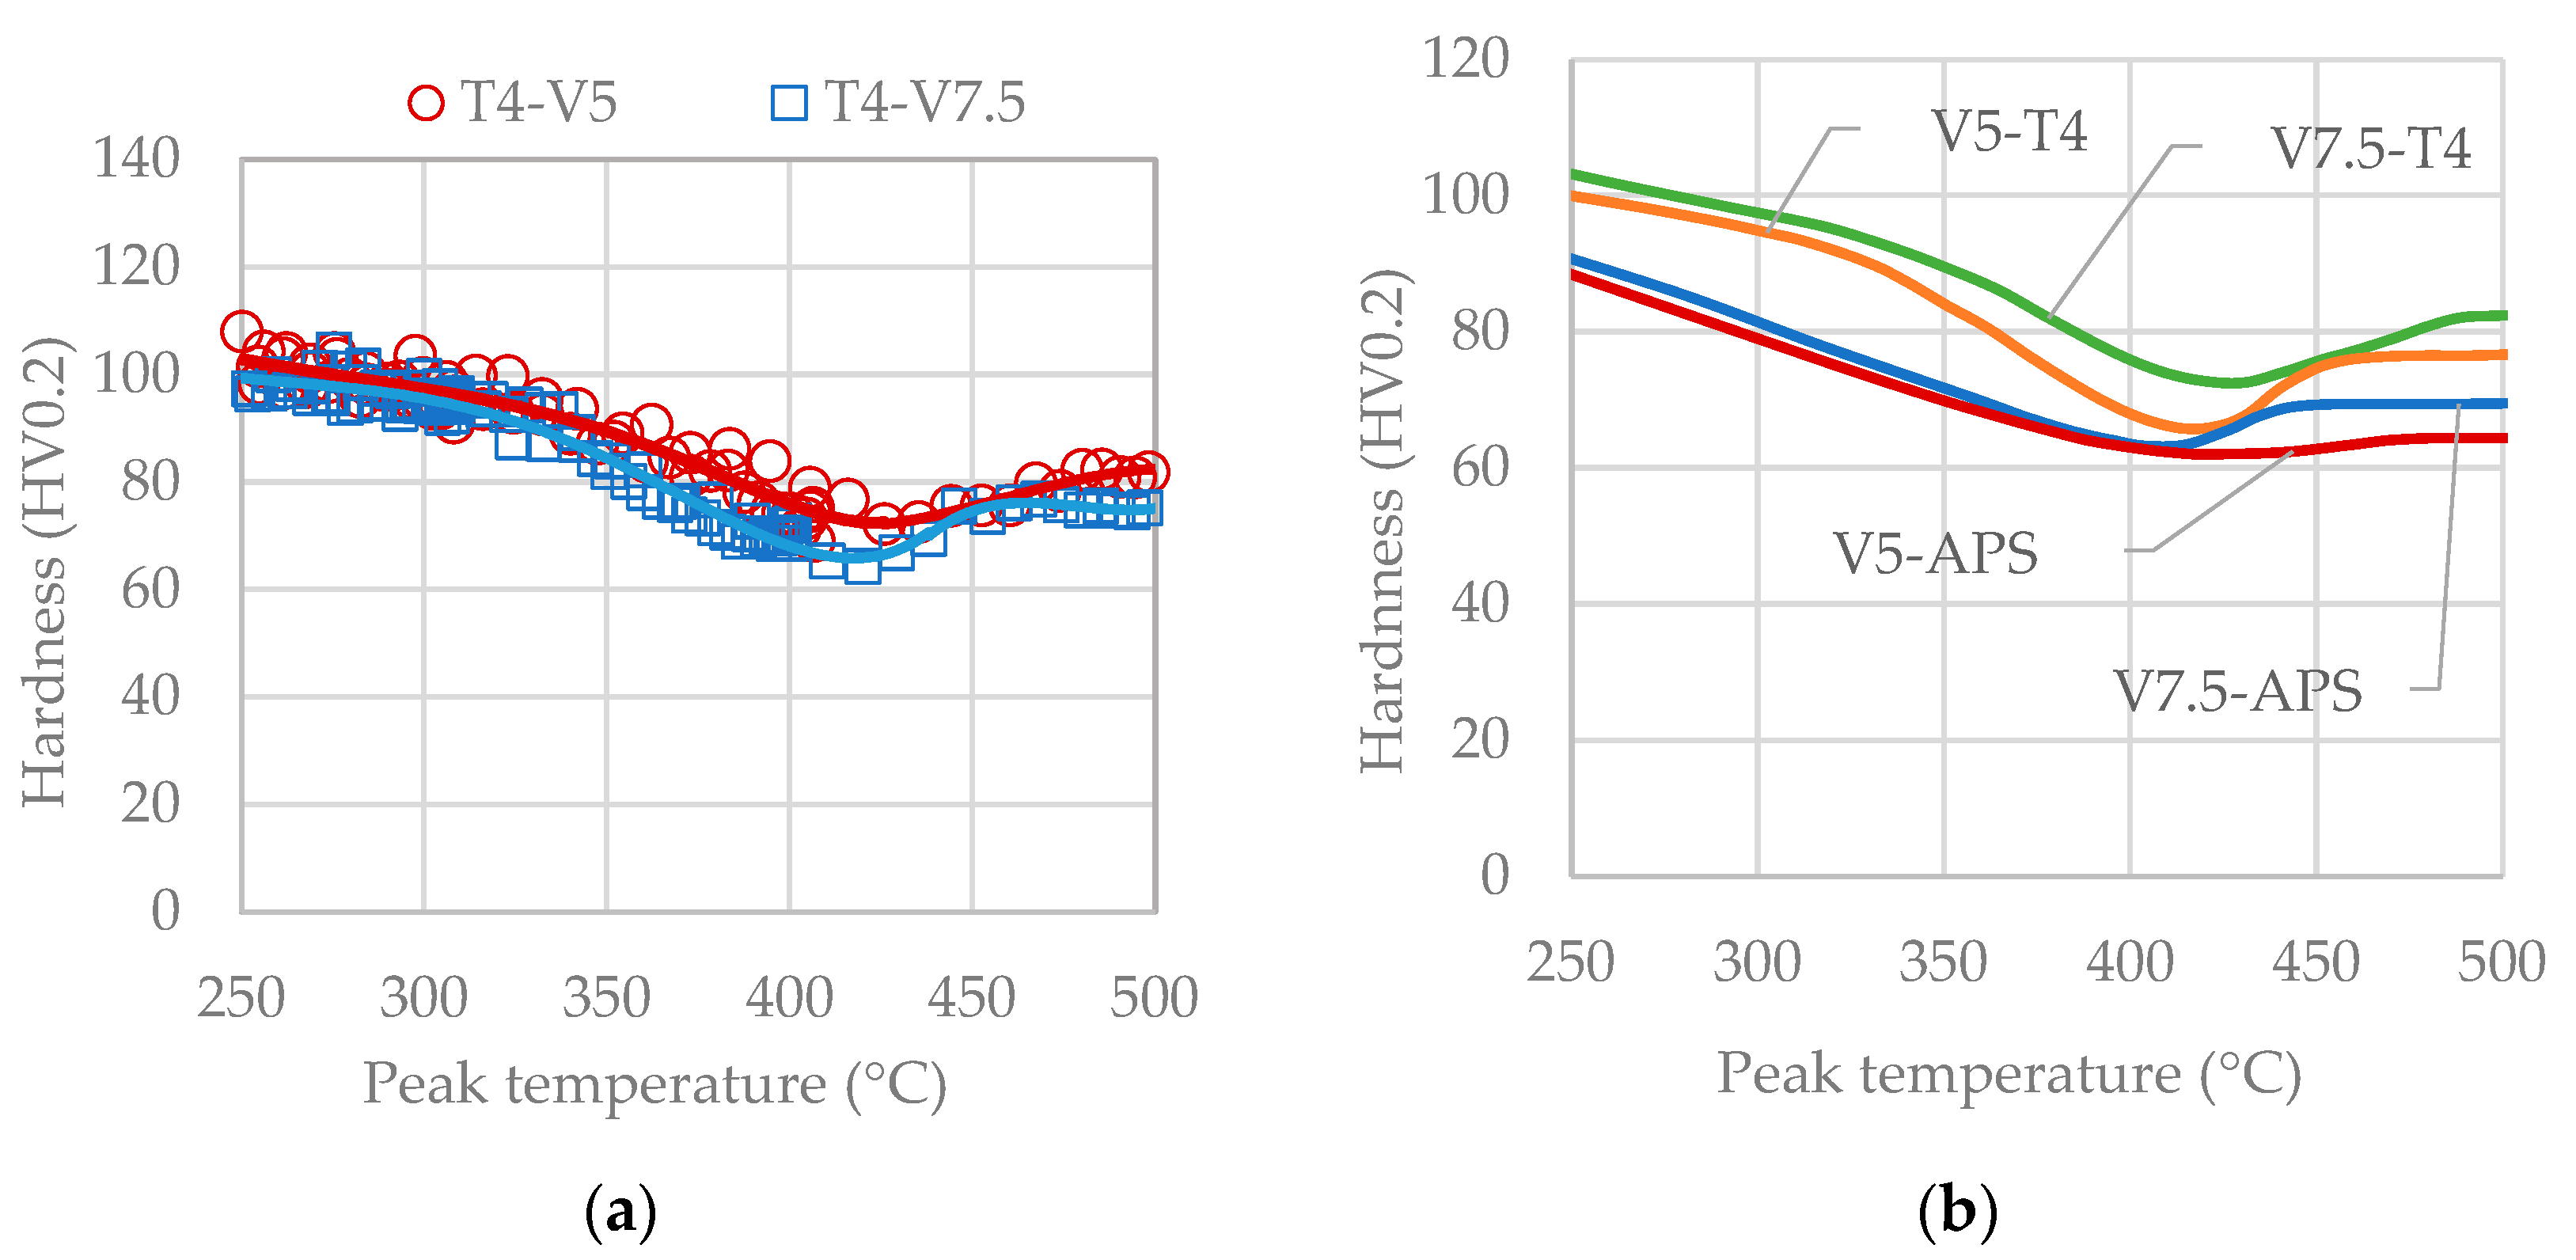
With the aim of modelling the effect of peak temperature and treatment speed on the micro-hardness obtained in APS and T4 states, micro-hardness trends, as a function of peak temperature obtained in different repetitions, were interpolated with polynomials. Figure 23 summarizes the obtained results. Figure 23a shows interpolation curves relating to T4 state with a continuous line, while some of the hardness measurements obtained at treatment speeds of 5 mm/s and 7.5 mm/s are indicated by empty circles and squares, respectively. The same procedure was adopted for the results in the APS state. Considering only the interpolation curves, Figure 23b shows a comparison between T4 state and APS state and the two treatment speeds; all polynomials fit the experimental data with correlation coefficients of greater than 95%. In the APS state, however, the maximum softening was reached at temperatures of about 410 °C and, at this temperature, the two treatment conditions had comparable results; at higher peak temperatures, a decrease in softening continued to be observed, but when the treatment speed was 5 mm/s this reduction was negligible. Therefore, in the hypothesis where plastic deformation operations were carried out immediately after the laser treatment, higher temperatures could be adopted, since these guarantee a greater width in the softened area.
For T4 state and the APS state, the treatment speed of 5 mm/s showed an overall greater softening. Table 5 reports on the polynomials obtained by fitting microhardness results measured on APS and T4 state specimens subjected to simulated laser thermal cycles with a treatment speed of 5 mm/s (curves V5-T4 and V5-APS in Figure 22b).
Overall, the hardness profiles measured in the T4 state are comparable to those detected by W. Zhang et al. [19] in the heat-affected zone (HAZ) of MIG welds of the EN AA 6082 T6 alloy. Although, in our work, the examined process is different and the cooling rates are lower, the mechanism that leads to the alloy softening is the same as that which occurs in different HAZ subzones. In fact, the main factor responsible for the thermal softening of the HAZ of Al-Mg-Si welded joints is the precipitation variation, which includes the dissolution and coarsening in the size of strengthening precipitates β″ and phase transformation from β″ to β′ and β phases. Moreover, during the welding process, as the distance from the weld center increases, the peak temperature, and heating and the cooling rate decrease, similarly to what is seen on specimens subjected to the physical simulations of laser thermal cycles. Due to the heat treatability of Al-Mg-Si alloys, the change in temperature affects the microstructure and mechanical properties of welded of Al-Mg-Si joints. In particular, the HAZ has different softening degrees, with the minimum value in the center of this zone. The area adjacent to that of maximum softening, near to the weld toe although presenting a higher peak temperature, has less softening. This is due to the high heating rate, which does not allow for complete phase transformation, leading to the coexistence of β′ and β phases. This mechanism can justify the hardness results obtained in this work.

3.3. Effect of Thermal Cycles on Material Deformability

Tensile tests were carried out to measure the elongation at break, which is a fundamental quantity needed to understand the deformability of the treated material. Notched samples were used since such geometry guarantee rupture occurring in the middle section of the specimen, where thermal cycles were previously imposed. In fact, preliminary tensile tests showed that tapered specimens are unsuitable for investigating deformability, as rupture does not occur in the middle section. As an example, Figure 24 shows a tapered sample that was treated with a maximum peak temperature of 510 °C in the middle section, while rupture was not located in the center. In fact, as previously highlighted, the maximum softening conditions were not reached in the central area.
To highlight the specimen region of the maximum softening, a procedure that estimates the material micro-hardness value as a function of the peak temperature reached in the physical simulation test was implemented in the thermoelectric FE model [12]; in this procedure, the micro-hardness value was calculated using the polynomials reported in Table 5.
Figure 25 shows the results obtained with the FE model for the T510V5 thermal cycle, using the interpolation polynomial estimated in the T4 state. The temperature and micro-hardness profiles highlighted in Figure 25a show that the specimen area that reaches the maximum softening is the one with a peak temperature of about 410 °C. The hardness distribution proposed in Figure 25b highlights that the maximum softening area coincides with the area at which the deformation and rupture are located (Figure 24).
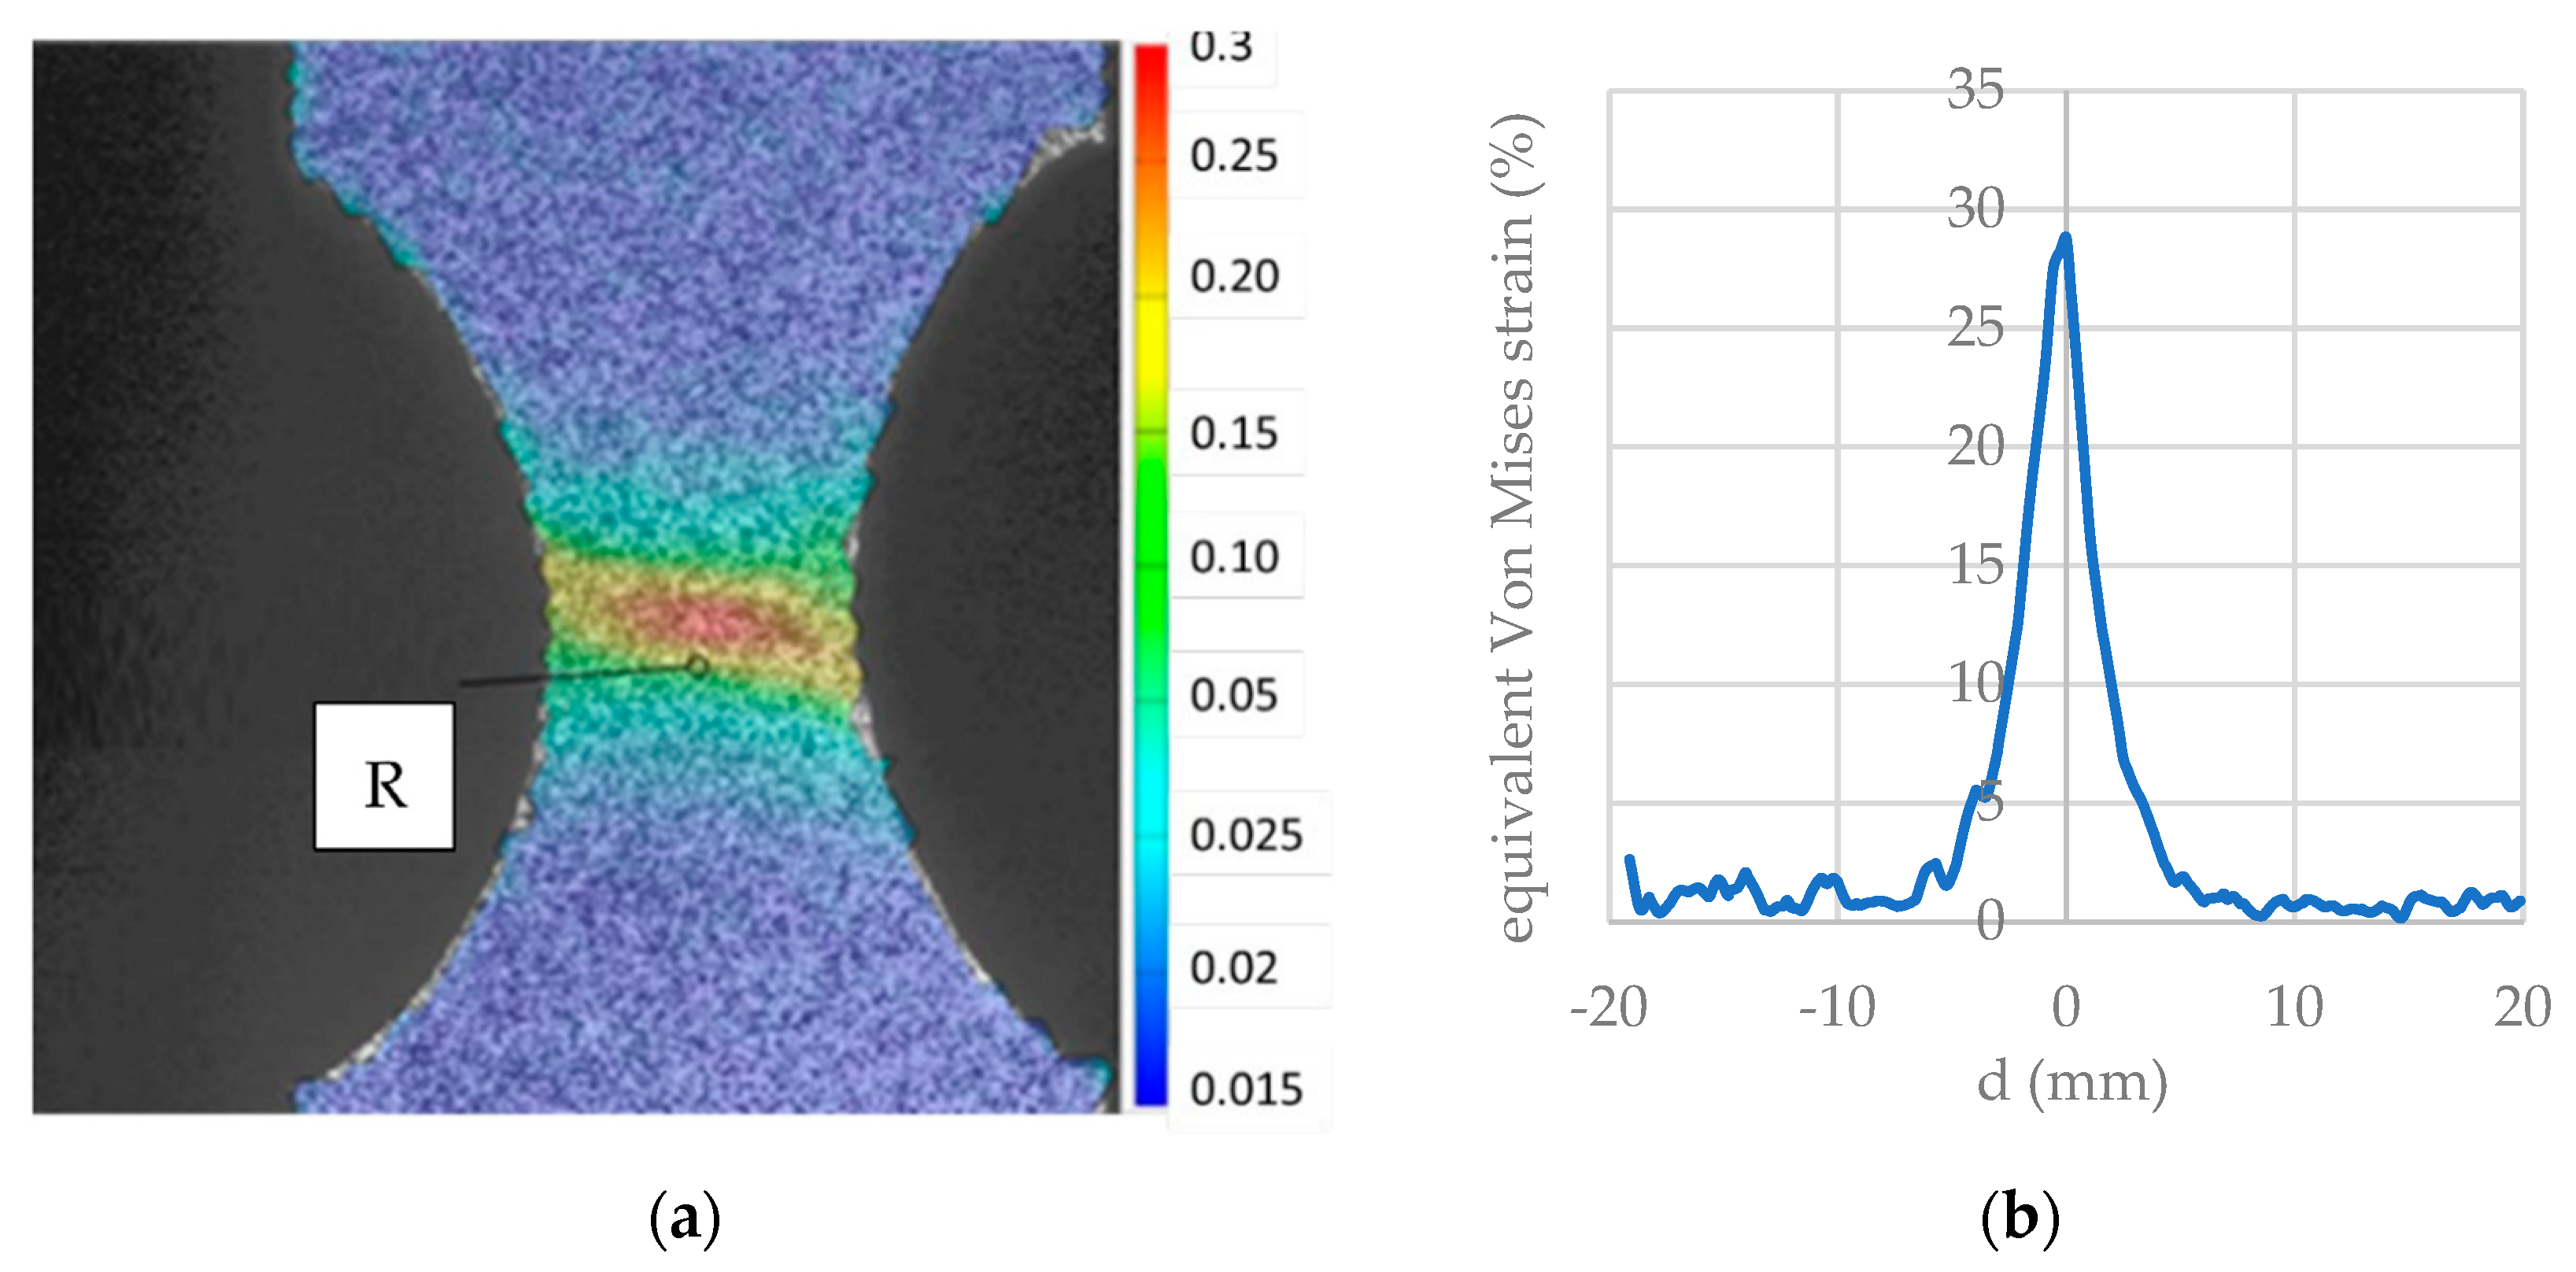
In contrast to the tapered specimens, the notched ones always break in the center, allowing for the mechanical behavior corresponding to the imposed thermal cycles to be characterized. The elongation at break, representative of the material deformability, was evaluated at the breaking point in terms of the equivalent Von Mises strain.
As an example, Figure 26a shows the deformation distribution on the specimen surface, demonstrating that, on notched specimens, higher deformation values are measured in the center of the specimen, where rupture (point R) occurs. Figure 26b shows the typical deformation profile in terms of the equivalent Von Mises strain along the longitudinal section of the sample. In Figure 26a,b, the results refer to those of the base material.
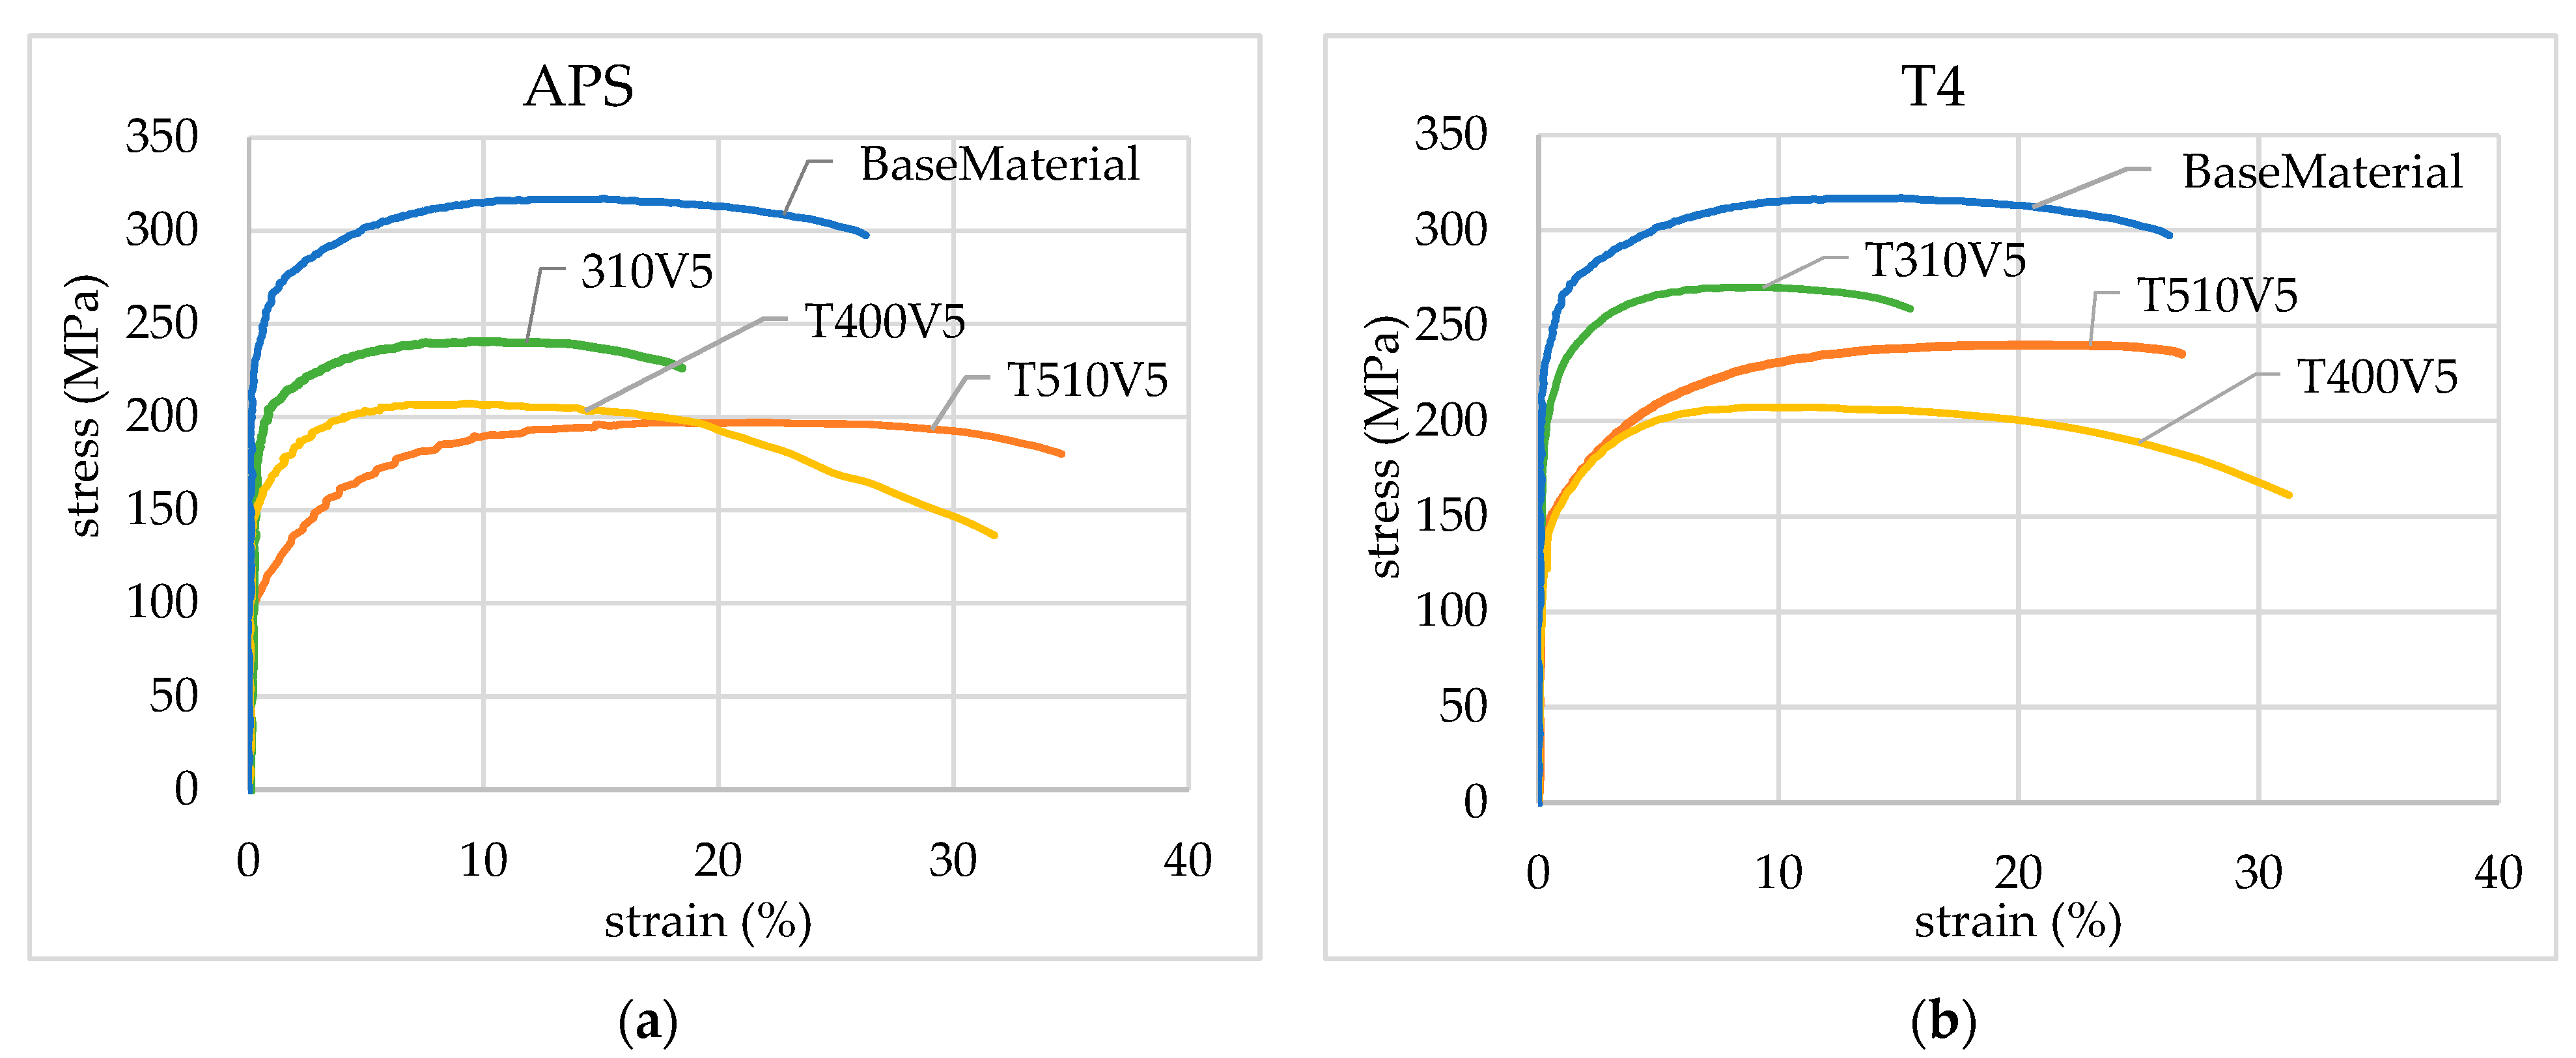
In Figure 27 the stress–strain curve of the base material is compared with the ones obtained for specimens in the APS state (Figure 27a) and T4 state (Figure 27b) subjected to a physical simulation of the laser thermal cycles obtained for a treatment speed equal to 5 mm/s. The gauge length at which such curves were obtained was equal to 10 mm near the central section of specimens.
During the tensile tests, the tension state was not completely monoaxial due to the geometry of the adopted specimens; therefore, the results shown in Figure 27a,b offer a qualitative indication of the tensile strength and the elongation at break for different peak temperatures and for each material state (APS or T4). The results of the tensile tests in terms of tensile strength confirm those of the hardness tests explained in Section 3.2. Furthermore, in the APS state (Figure 27a), a greater elongation at break was observed for a peak temperature of 510 °C; while in the T4 state (Figure 27b), the maximum elongation at break was observed at a peak temperature of 400 °C. However, for a more accurate analysis, the elongation at break was locally calculated at the correspondence of the breaking point. In this way, it is possible to evaluate the elongation at break corresponding to the set thermal cycle without considering the effect of the thermal gradient on the specimen during the physical simulation test.
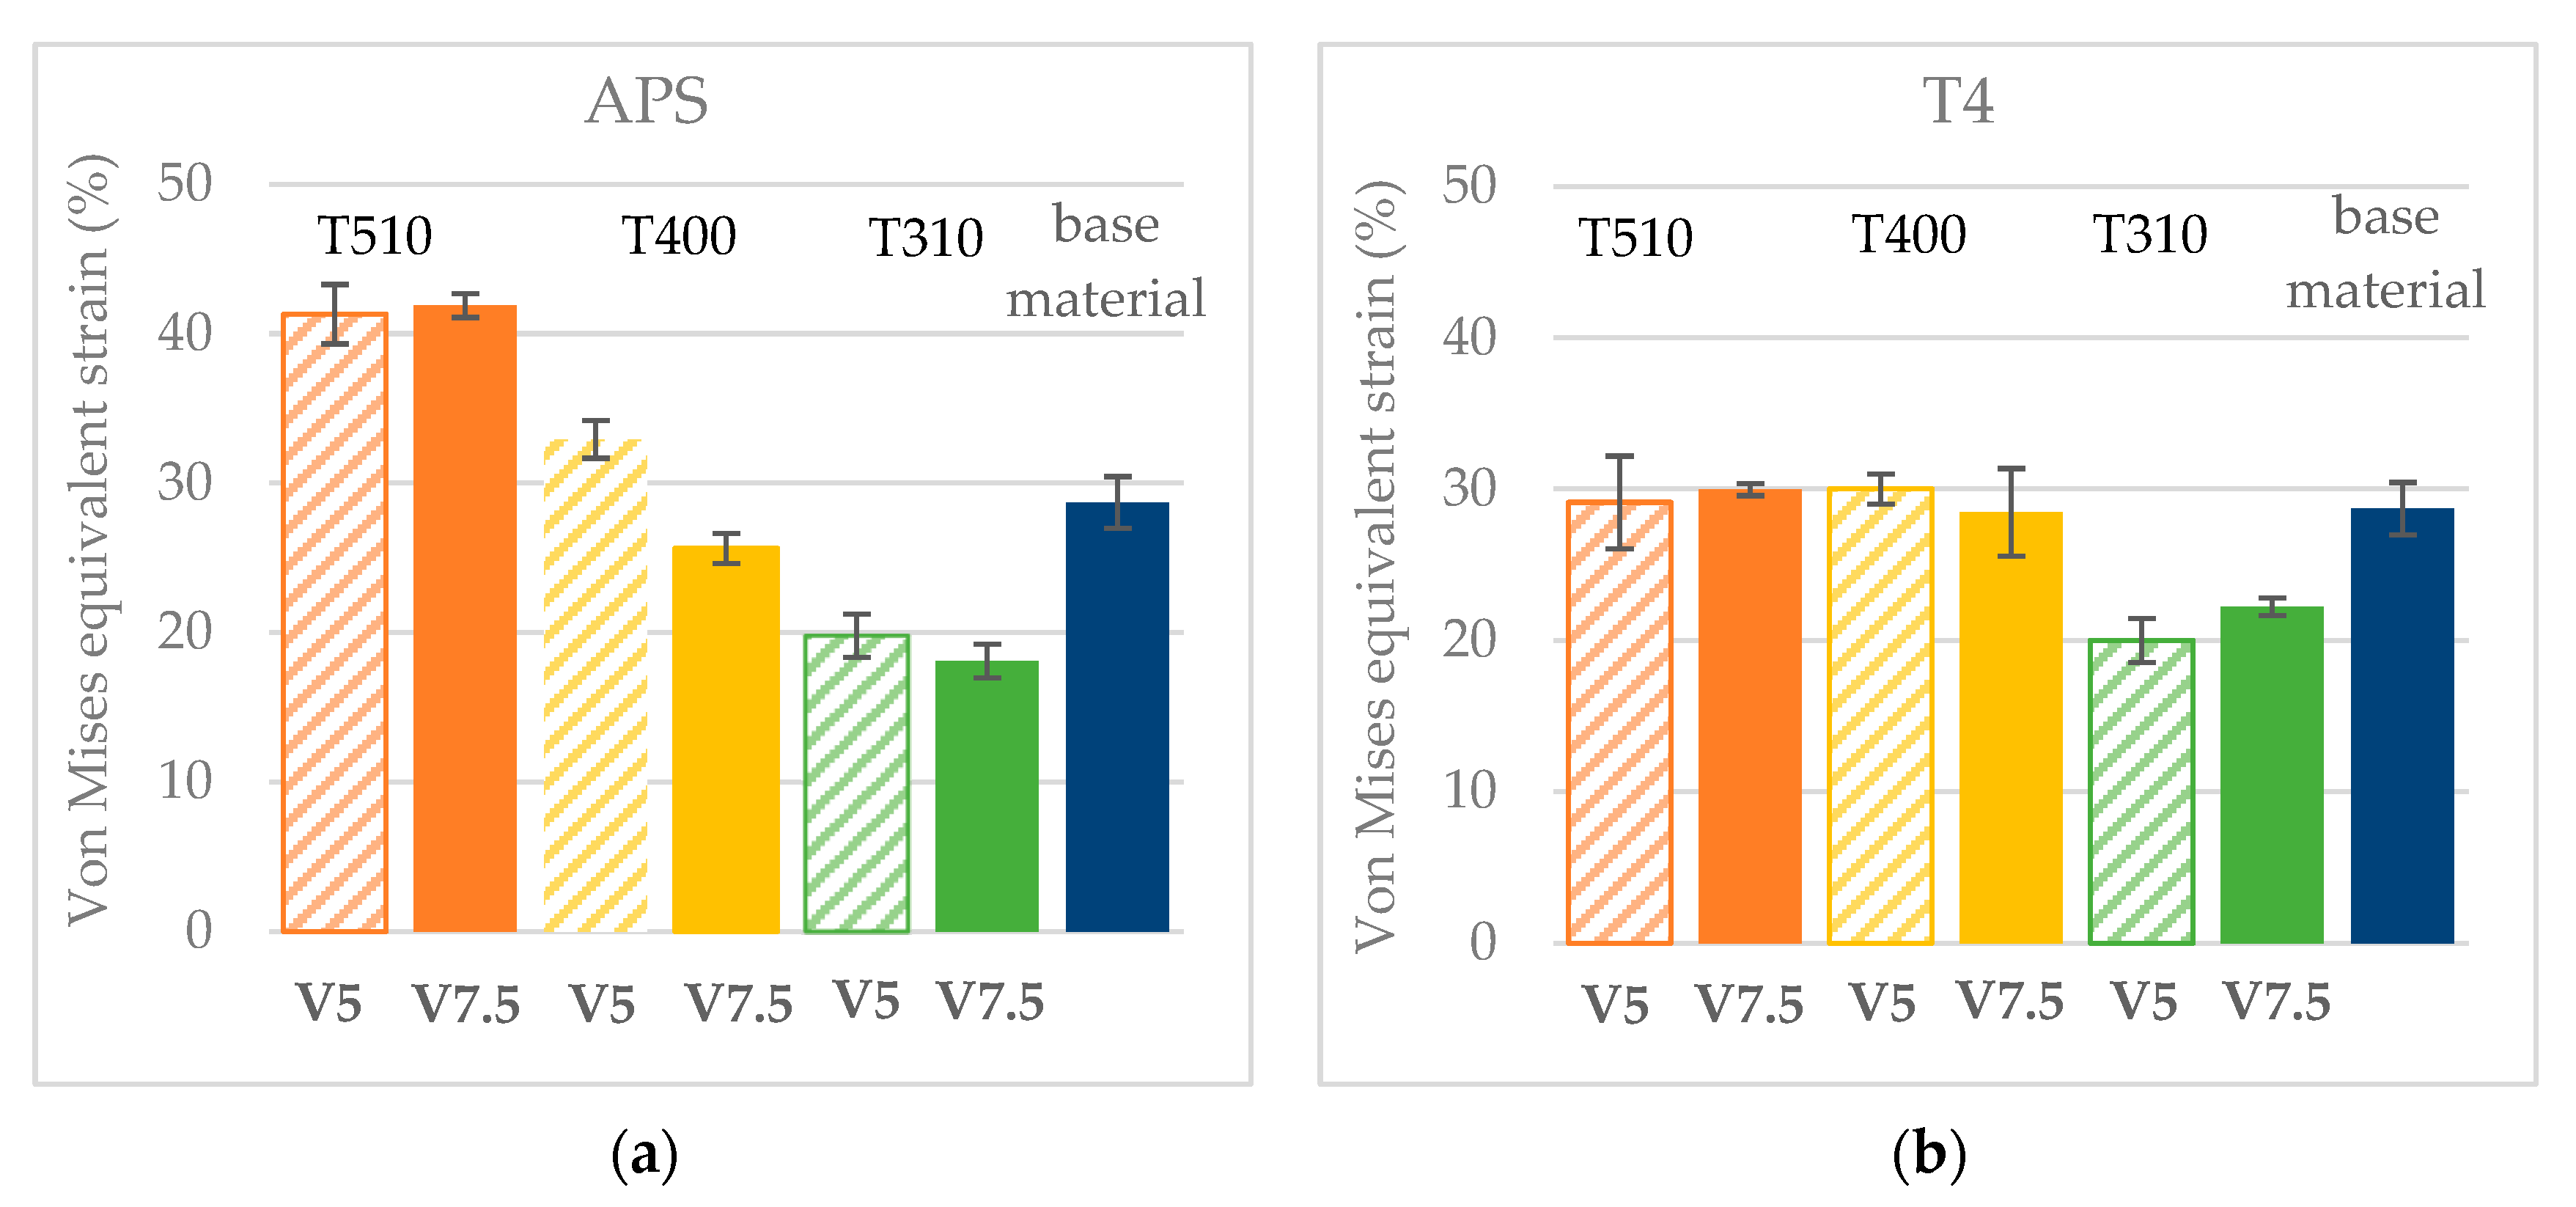
Histograms in Figure 28a,b collected all the tensile test results in terms of elongation at break, derived, respectively, at the APS state and T4 state. Such figures show the mean values of the equivalent Von Mises strain and the standard deviations, represented as error bars.
By observing Figure 28a, it can be seen that, immediately after physical simulation, a significant increase in deformability is obtained with respect to the base material for the cycles that reached the peak temperature of 500 °C. Even at 400 °C, a slight improvement can be observed in deformability. For cycles that reached a peak temperature of 300 °C, a decrease in equivalent strain can be observed. These results are can be explained as, for peak temperatures between 400 °C and 500 °C, the heat flux is sufficiently strong so that the MgSi clusters are increasingly completely dissolved. This increases the ductility of the material.
On the other hand, when the peak temperature is 300 °C, the presence of semi-coherent and coherent precipitates leads to a reduction in ductility with respect to the base material. These results are also confirmed by the evaluation of deformability after natural aging (Figure 28b). The results are in line with the references. In fact, in previous investigations by M. Merklein et al. [20,21] and Geiger et al. [7], there was a reduction in uniform elongation at a temperature of 300 °C. However, it can be observed that, in the T4 state, for the cycles that reached a peak temperature of 500 °C, a material deformability of lower than about 10% is obtained with respect to the deformability obtained immediately after Gleeble treatment. This is due to the reprecipitation of the Mg and Si atoms. Furthermore, both data show that the laser treatment speed did not influence the deformability.

3.4. Results Applied to the Laser Treatment

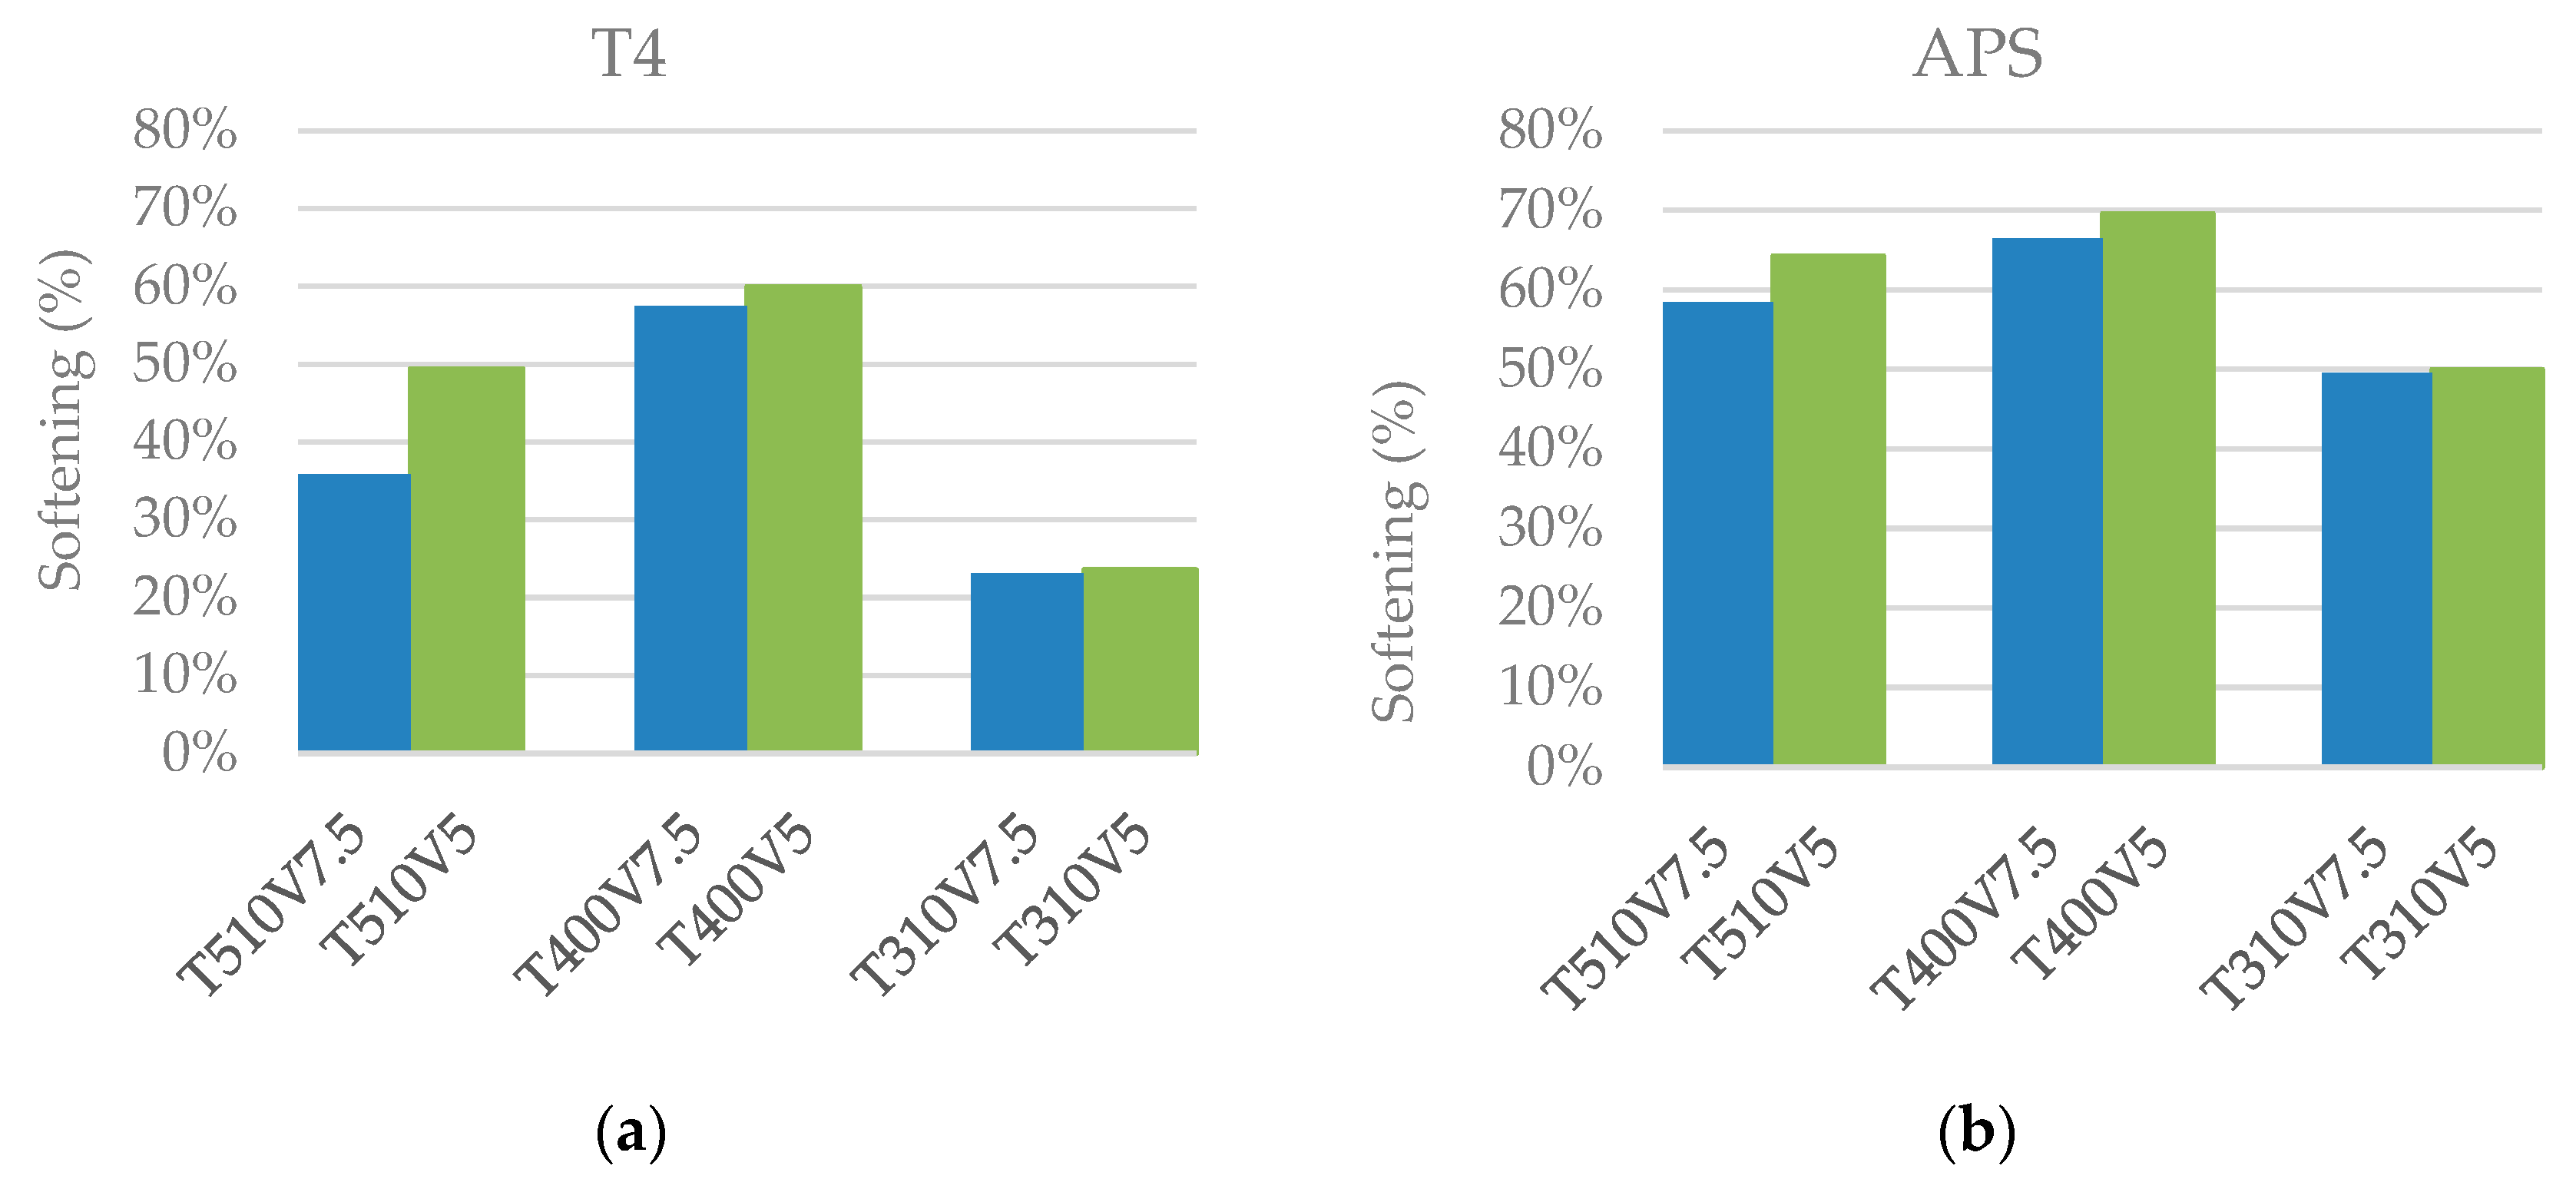
For all investigated laser conditions, the treatment speed that guarantees a higher level of softening is 5 mm/s. This is confirmed by histograms in Figure 29a,b that show, respectively, the softening reached under T4 and APS conditions. The softening level was calculated as the ratio between the measured softening value and that associated with the complete softening condition, which is approximately 40HV0.2 [22].
From the comparison with the literature works, an agreement with the results presented here emerges. Merklein et al. [20] also demonstrated that the maximum temperatures should range from 400°C to 500°C to obtain greater softening and elongation at break.
With the aim of simulating the effect of laser treatment in terms of microhardness, the polynomials reported in Table 5 were implemented in the 3D transient thermal model developed for the laser surface treatment simulation. In the post-processing phase, polynomials were used to estimate the micro-hardness of the blank in the T4 and APS states as a function of the peak temperatures computed in the blank at the end of the laser treatment (Figure 7).
When choosing the 5 mm/s laser speed, during the hypothesis used to realize the formation with the blank in the T4 state, the surface treatment was designed to have a peak temperature of 420 °C. For the blank formed immediately after laser treatment (APS state), the heat treatment was designed with a peak temperature of 500 °C. In the FE simulation, the laser source moved along the treatment direction (Figure 2), while the absorbed laser power was modulated to maintain the programmed peak temperature along the treatment trajectory, by increasing it at the start of the treatment and reducing it in the exit area, as shown in Figure 4.
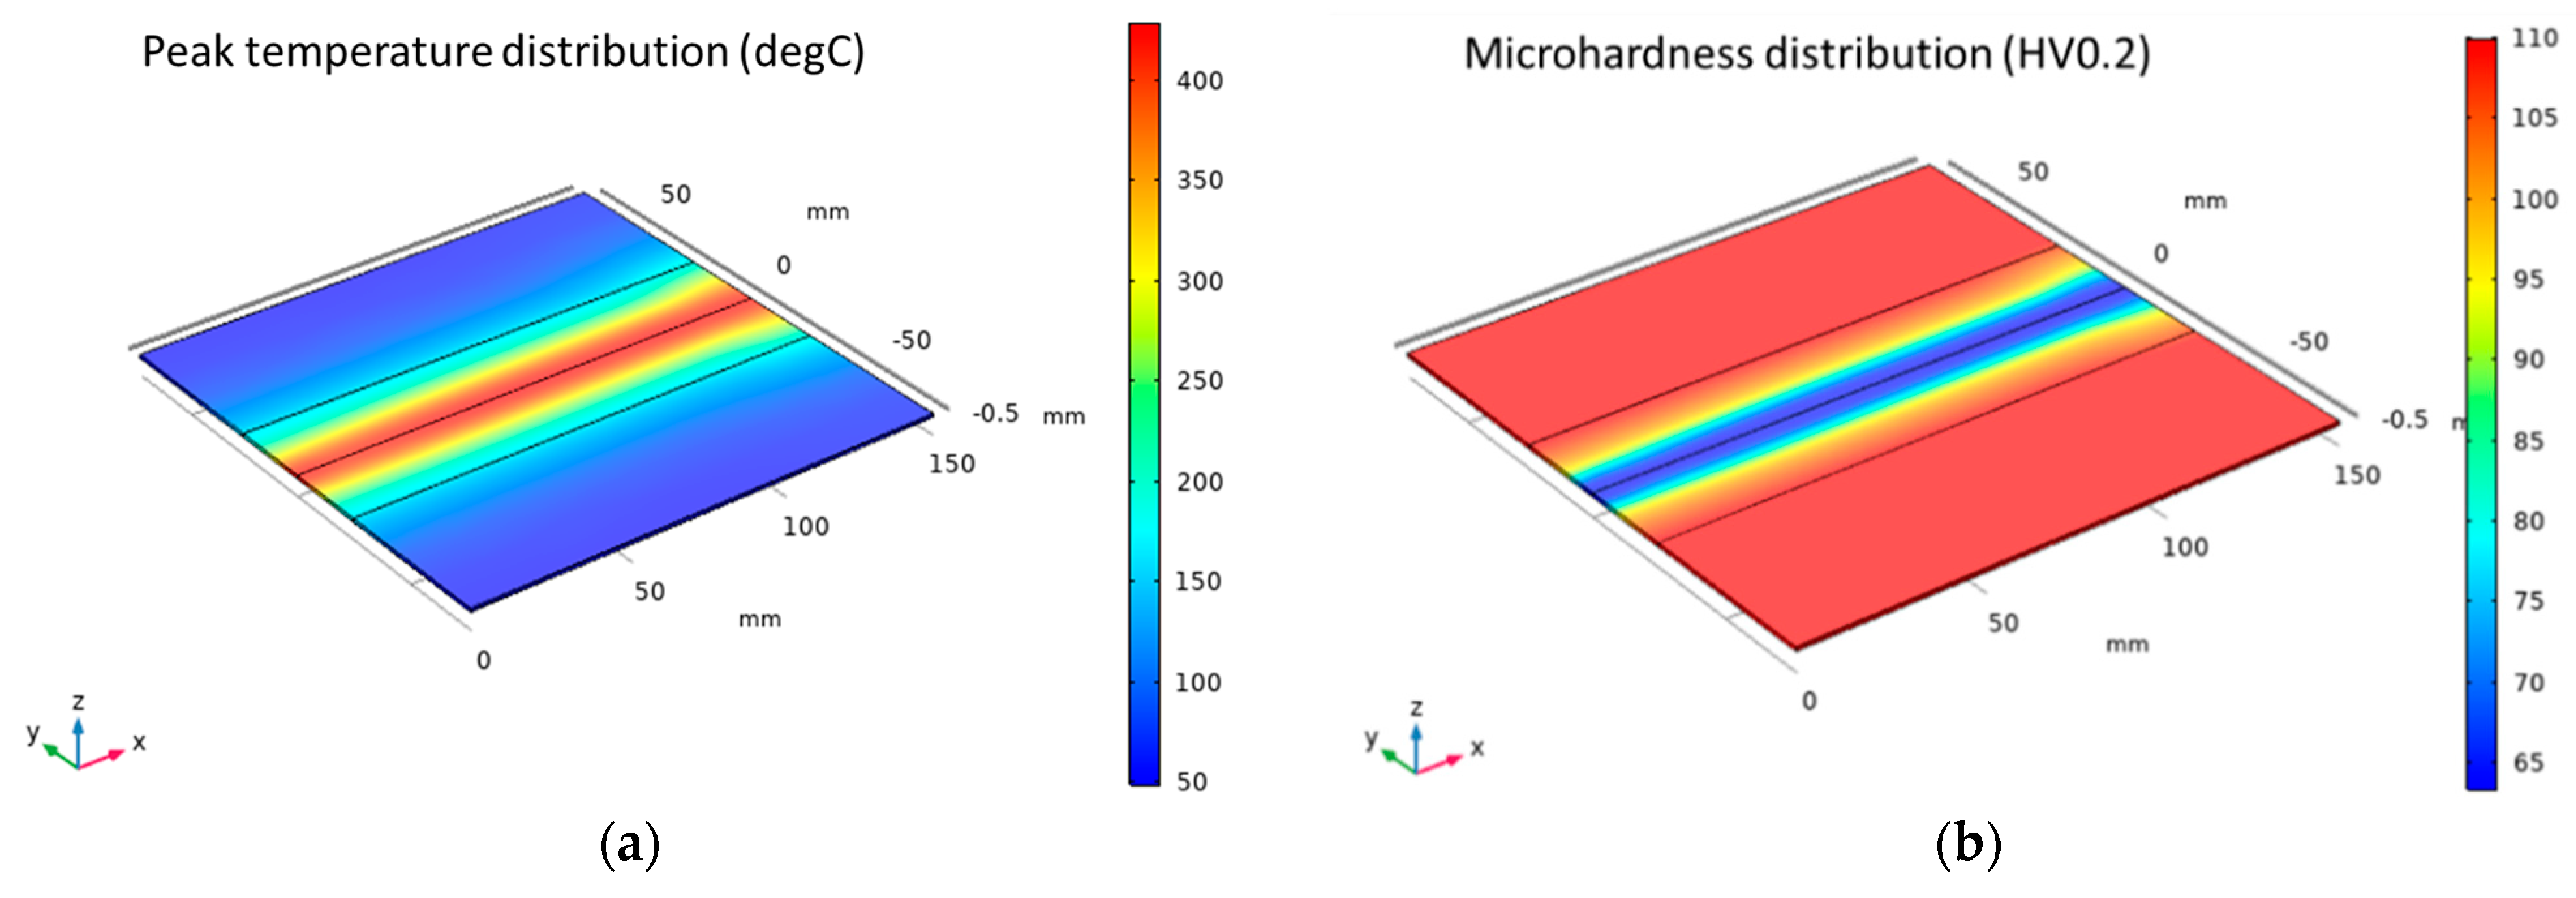
Figure 30a shows the peak temperature distributions in the blank; this was computed at the end of the laser treatment designed to have a treatment speed of 5 mm/s and a peak temperature of 420 °C (T420V5). For this laser treatment condition, Figure 30b shows the microhardness distribution computed when the blank is assumed in the T4 state (T420V5-T4). Figure 31 shows the corresponding hardness and peak temperature profiles estimated both transversely and longitudinally with respect to the laser treatment direction. The firsts were evaluated in the x = 75 mm position (Figure 31a), while the seconds were evaluated in the y = 0 mm position (Figure 31b).
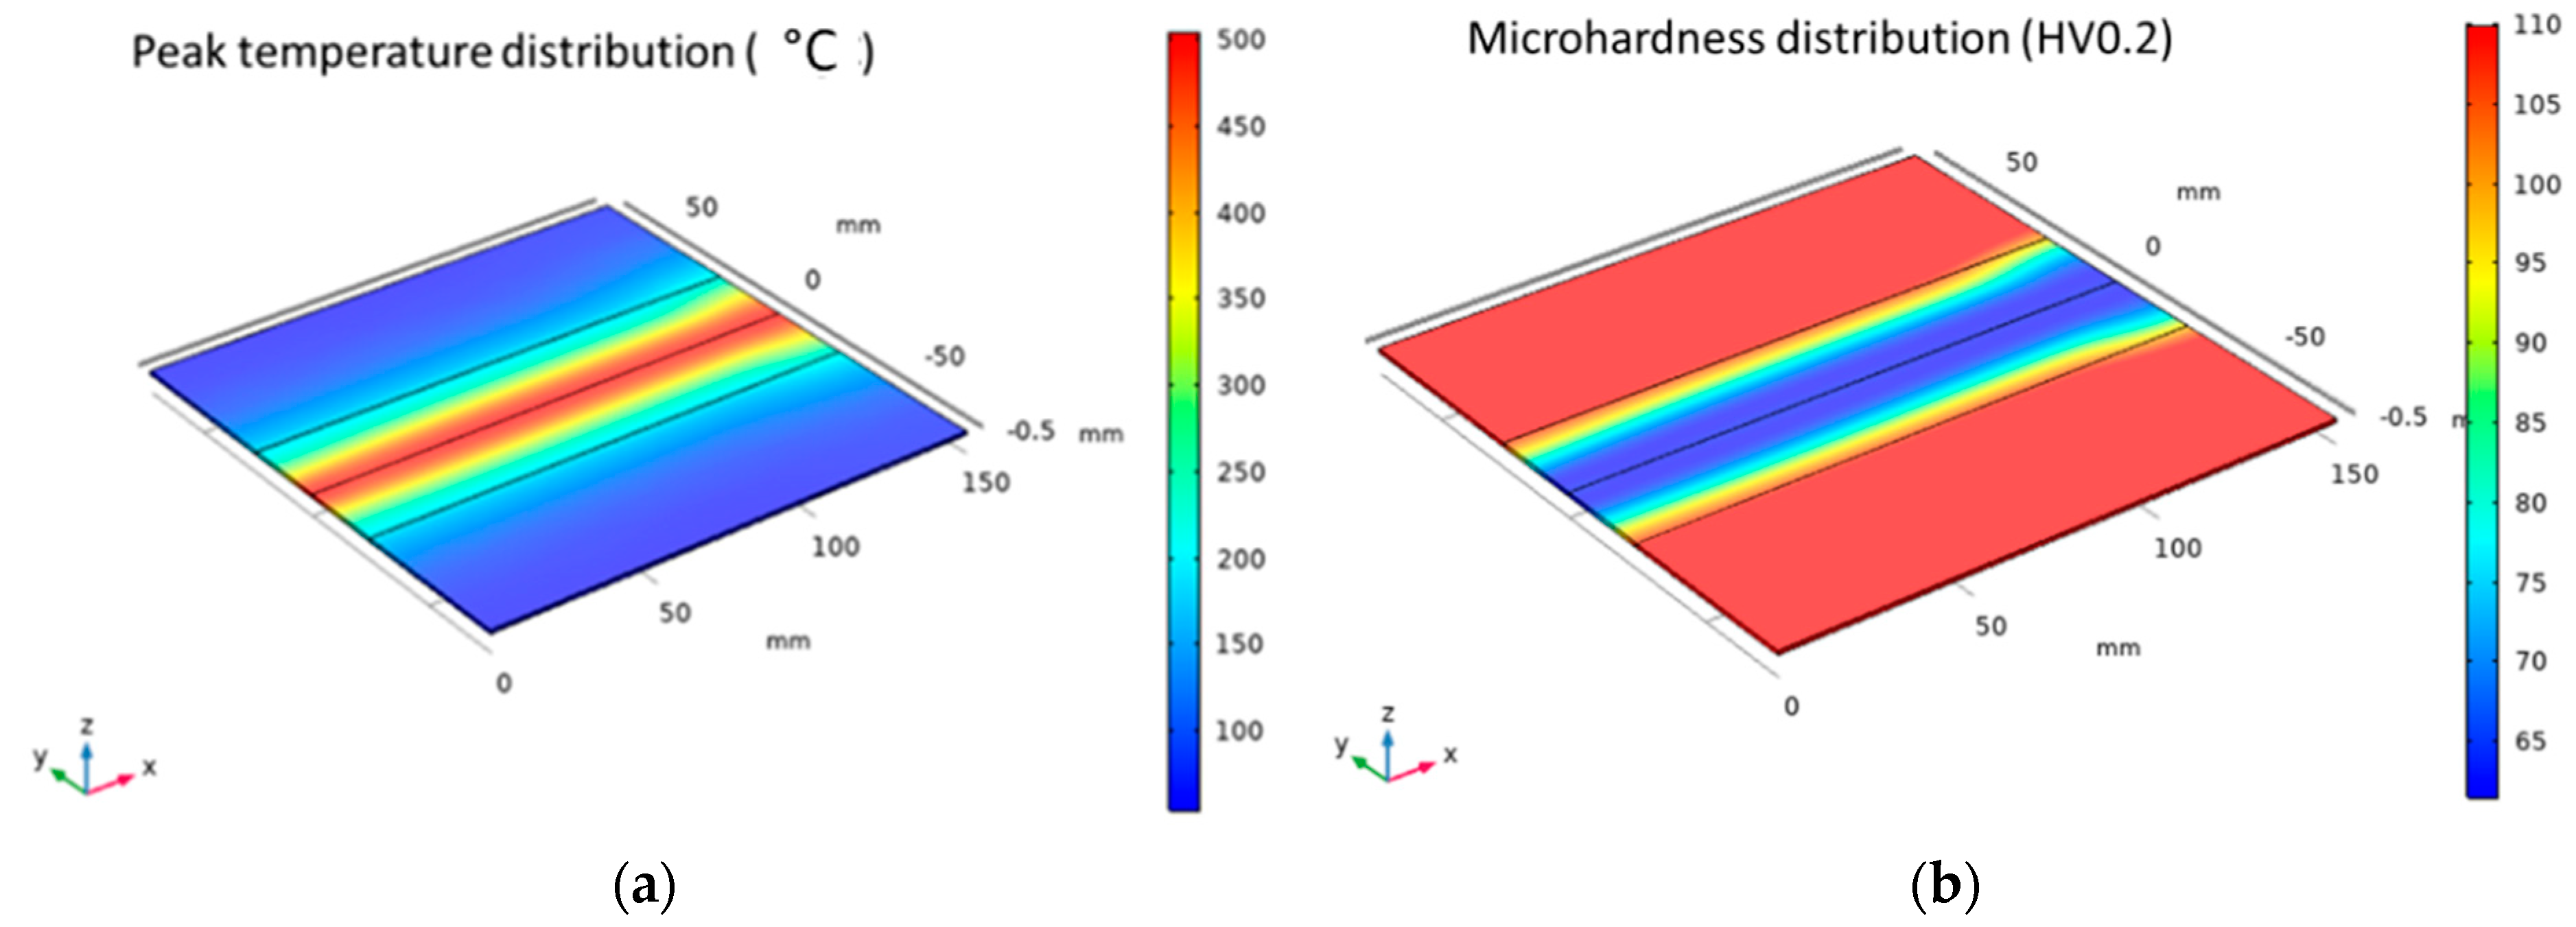
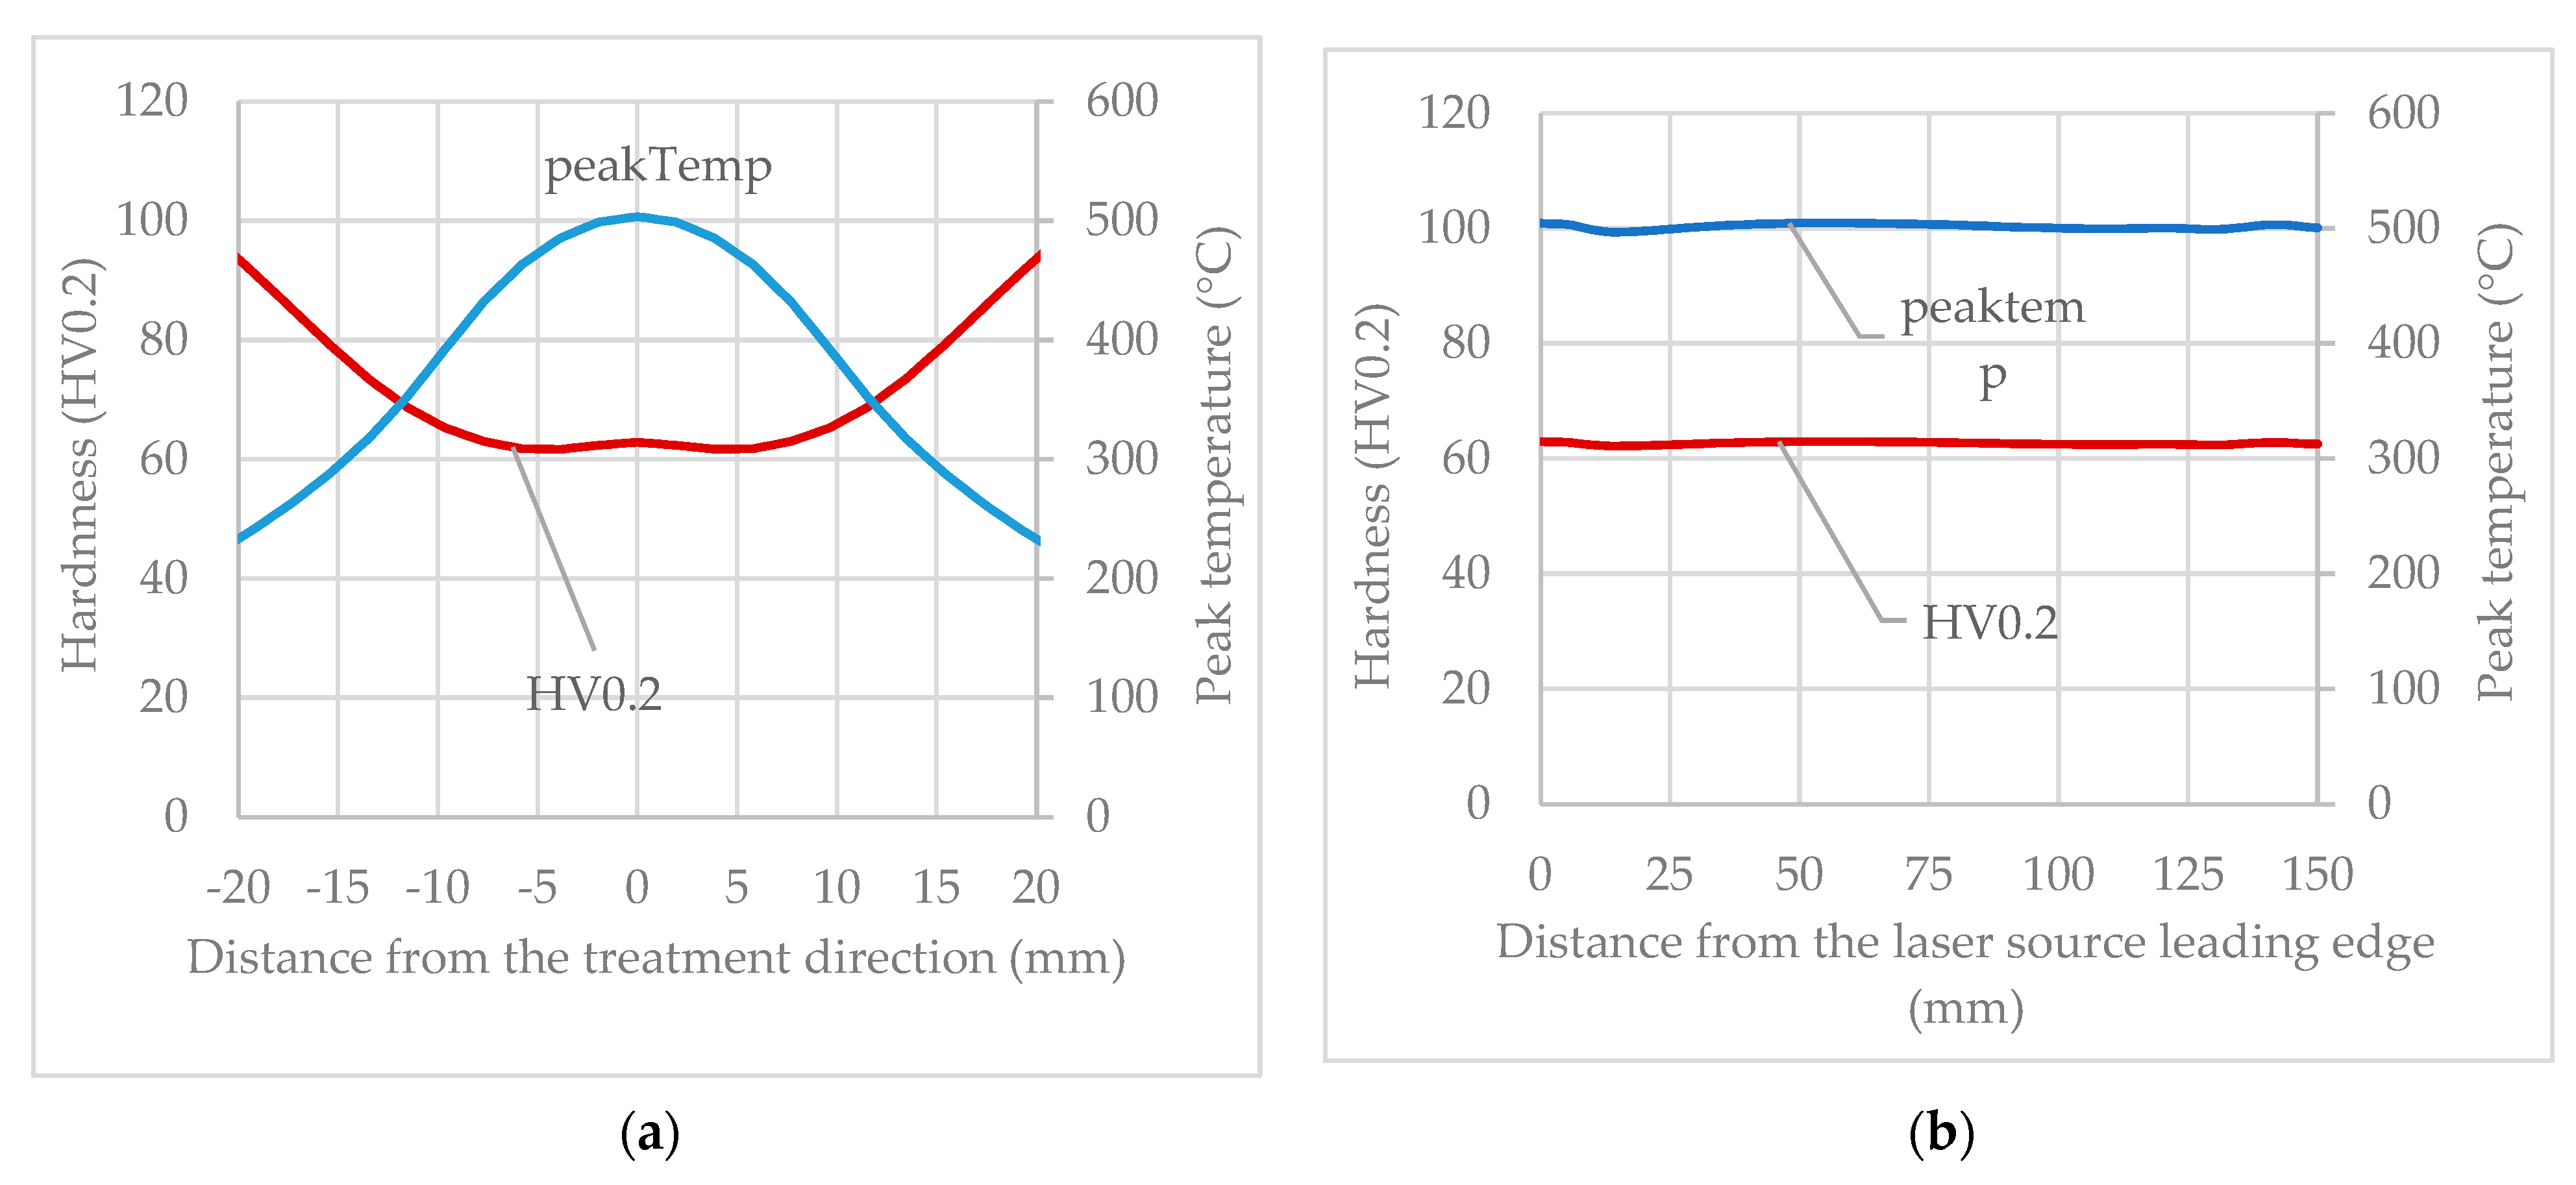
Figure 32a shows the peak temperature distribution computed at the end of the T500V5 laser treatment simulation; for this laser treatment condition, Figure 32b shows the microhardness distribution computed when the blank is assumed in the APS state (T500V5-APS). Figure 33 shows the corresponding hardness and peak temperature profiles that were transversely evaluated (x = 75 mm) and along the laser treatment direction (y = 0 mm).
Analyzing the results obtained when a single laser path with a 20 × 20 laser spot size is realized, the top hat laser energy distribution and constant peak temperature obtained by modulating the absorbed laser power along the treatment direction allow for a uniform softening of the laser-treated surface. Comparing the two explored states, the blank in the T4 state guarantees a 45% softening (65HV0.2) on an area of about 8 mm amplitude (40% of the spot size). A similar softening was obtained when the blank is in the APS state, but, in this case, the width of the softening area was greater and comparable to the spot size (20 mm).

4. Conclusions

In this work, physical simulation proved to be an effective tool for studying the softening effects on an EN AW 6082T6 alloy after the rapid thermal cycle typical of laser heat-treatment. The innovative method adopted in this study obtained results in agreement with those found in the literature, in which classical tests with laser beam station were adopted. Differently from such tests, in this work, the laser heat treatment was numerically simulated by means of an FE model to derive the thermal cycles that could be physically simulated with the Gleeble 3180 system. The effects of this treatment on the softening and deformability of the investigated alloy were analysed in both the T4 state and immediately after physical simulation, to understand whether it is more appropriate to perform plastic deformations immediately after treatment or after natural aging. By simulating the surface laser treatment with two treatment speeds, it was possible to understand if this parameter influences the mechanical properties. The results showed that the investigated range of treatment speeds had a small impact on the alloy softening. In fact, lower hardness values were obtained for lower treatment speeds, but there were no improvements in terms of deformability when the treatment speed was reduced. However, further investigations with a wide range of laser treatment speeds will be carried out.
In agreement with the bibliography, the peak temperature proved to be the most significant parameter. By combining the numerical and experimental results, it was possible to identify the optimum peak temperature needed to obtain maximum softening for both investigated conditions: APS and T4. Beyond this optimum peak temperature, an increase in hardness was recorded. This was mainly evident in the T4 state. The optimum peak temperature was in the range of 420–430 °C in the T4 state, while, immediately after physical simulation of the laser treatment, the optimum peak temperature was around 410 °C. Therefore, if plastic deformation is performed after natural aging, it would be advisable to ensure a laser power that guarantees a peak temperature of 420–430 °C. However, tensile tests indicate that, within this peak temperature range, there were no improvements in deformability compared to the base material. If, on the other hand, the plastic deformation was performed immediately after the surface laser treatment, laser treatment with higher peak temperatures (even 510 °C) guarantees higher levels of softening and deformability, as well as a greater width in the softened area, even if greater distortions of the blank may occur. It was also concluded that, for all the explored laser conditions, at the peak temperature of about 300 °C, in addition to a very low softening, there is a worsening in the deformability compared to the base material. This means that, during the stamping of a component treated with the THTB method, defects could be present in the transition zone in which this peak temperature value is reached.

Author Contributions

Conceptualization, M.E.P. and L.T.; methodology, M.E.P. and L.T.; software, M.E.P. and L.T.; validation, M.E.P.; formal analysis, M.E.P.; investigation, M.E.P.; resources, M.E.P. and L.T.; data curation, M.E.P.; writing—original draft preparation, M.E.P.; writing—review and editing, M.E.P. and L.T.; visualization, M.E.P. and L.T.; supervision, L.T.; project administration, L.T.; funding acquisition, L.T. All authors have read and agreed to the published version of the manuscript.

Funding

This research was funded by MIUR PICO&PRO project (COD.ID.ARS01_01061).

Data Availability Statement

Data sharing is not applicable to this article.

Acknowledgments

The authors gratefully acknowledge the support for this work provided by MIUR PICO&PRO project (COD.ID.ARS01_01061). Furthermore, the authors want to thank the engineer Vincenzo Domenico Lorusso for the support during experimental tests.

Conflicts of Interest

The authors declare no conflict of interest.

References

  1. Conrads, L.; Hirt, G.; Hama-Saleh, R.; Weisheit, A. Lightweight design using local heat treatment of cold rolled steels. Lightweight Des. Worldw. 2018, 11, 52–57. [Google Scholar] [CrossRef]
  2. Merklein, M.; Johannes, M.; Lechner, M.; Kuppert, A. A review on tailored blanks—Production, applications and evaluation. J. Mater. Process Tech. 2014, 214, 151–164. [Google Scholar] [CrossRef]
  3. Madhusudhana, H.K.; Gaitonde, V.N.; Jangali, G.S. A Review on Lightweight Metal Component Forming and its Application. J. Phys. Conf. Ser. 2021, 2070, 012246. [Google Scholar] [CrossRef]
  4. Siefert, K.; Sulzberger, A.; Merklein, M. Investigation on induction heat treatment to enhance the formability of aluminum alloy AA5182. In Proceedings of the International Conference on Technology of Plasticity ICTP, Aachen, Germany, 25–30 September 2011. [Google Scholar]
  5. Hogg, M. Herstellung und Umformung Lokal Wärmebehandelter Platinen; DGM Informationsges sellschaft mbH: Frankfurt, Germany, 2006. [Google Scholar]
  6. Merklein, M.; Böhm, W.; Lechner, M. Tailoring material properties of aluminum by local laser heat treatment. Phys. Proc 2012, 39, 232–239. [Google Scholar] [CrossRef]
  7. Geiger, M.; Merklein, M.; Vogt, U. Aluminum tailored heat treated blanks. Prod Eng. 2009, 3, 401–410. [Google Scholar] [CrossRef]
  8. Zarini, S.; Mostaed, E.; Vedani, M.; Previtali, B. Formability enhancement of Al 6060 sheets through fiber laser heat treatment. Int. J. Mater. Form. 2017, 10, 741–751. [Google Scholar] [CrossRef]
  9. Rigas, N.; Merklein, M. Experimental investigation of distortion behavior of laser heat treated blanks. Procedia CIRP 2020, 94, 557–560. [Google Scholar] [CrossRef]
  10. Staud, D.; Merklein, M. Inverse approach to the forming simulation of tailored heat treated blanks. Int. J. Mater. Form. 2008, 1, 37–40. [Google Scholar] [CrossRef]
  11. Available online: https://gleeble.com/ (accessed on 1 September 2020).
  12. Palmieri, M.E.; Lorusso, V.D.; Tricarico, L. Laser-induced softening analysis of a hardened aluminum alloy by physical simulation. Int. J. Adv. Manuf. Tech. 2020, 111, 1503–1515. [Google Scholar] [CrossRef]
  13. Machhammer, M.; Sommitsch, C. The interaction between short-term heat-treatment and the formability of an Al-Mg-Si alloy regarding deep drawing processes. In IOP Conference Series: Materials Science and Engineering; IOP Publishing: Bristol, UK, 2016; Volume 159. [Google Scholar]
  14. Fröck, H.; Graser, M.; Milkereit, B.; Reich, M.; Lechner, M.; Merklein, M.; Kessler, O. Precipitation Behaviour and Mechanical Properties during Short-Term Heat Treatment for Tailor Heat Treated Profiles (THTP) of Aluminium Alloy 6060 T4. In Proceedings of the 15th International Conference on Aluminum Alloys, Chongqing, China, 12–16 June 2016. [Google Scholar]
  15. Javaheri, E.; Lubritz, J.; Graf, B.; Rethmeier, M. Mechanical properties characterization of welded automotive steels. Metals 2020, 10, 1. [Google Scholar] [CrossRef]
  16. Zhang, Z.L.; Hauge, M.; Thaulow, C.; Ødegård, J. A notched cross weld tensile testing method for determining true stress–strain curves for weldments. Eng. Fract. Mech. 2002, 69, 353–366. [Google Scholar] [CrossRef]
  17. Mandziej, S.T. Physical simulation of metallurgical processes. Mater. Technol. 2010, 44, 105–119. [Google Scholar]
  18. Cao, L.; Rometsch, P.A.; Couper, M.J. Clustering behaviour in an Al–Mg–Si–Cu alloy during natural ageing and subsequent under-ageing. Mat. Sci. Eng. A 2013, 559, 257–261. [Google Scholar] [CrossRef]
  19. Zhang, W.; He, H.; Xu, C.; Yu, W.; Li, L. Precipitates dissolution, phase transformation, and re-precipitation-induced hardness variation in 6082-T6 alloy during mig welding and subsequent baking. JOM 2019, 71, 2711–2720. [Google Scholar] [CrossRef]
  20. Merklein, M.; Graser, M.; Lechner, M. Experimental investigation of heat-treated aluminum profiles. Key Eng. Mat. 2015, 651, 59–64. [Google Scholar] [CrossRef]
  21. Merklein, M.; Lechner, M.; Schneider, T.; Plettke, R. Tailored heat treated profiles-enhancement of the forming limit of aluminum profiles under bending load. Key Eng. Mat. 2012, 504, 375–380. [Google Scholar] [CrossRef]
  22. Kumar, N.; Rao, P.N.; Jayaganthan, R.; Brokmeier, H.G. Effect of cryorolling and annealing on recovery, recrystallisation, grain growth and their influence on mechanical and corrosion behaviour of 6082 Al alloy. Mater. Chem. Phys. 2015, 165, 177–187. [Google Scholar] [CrossRef]
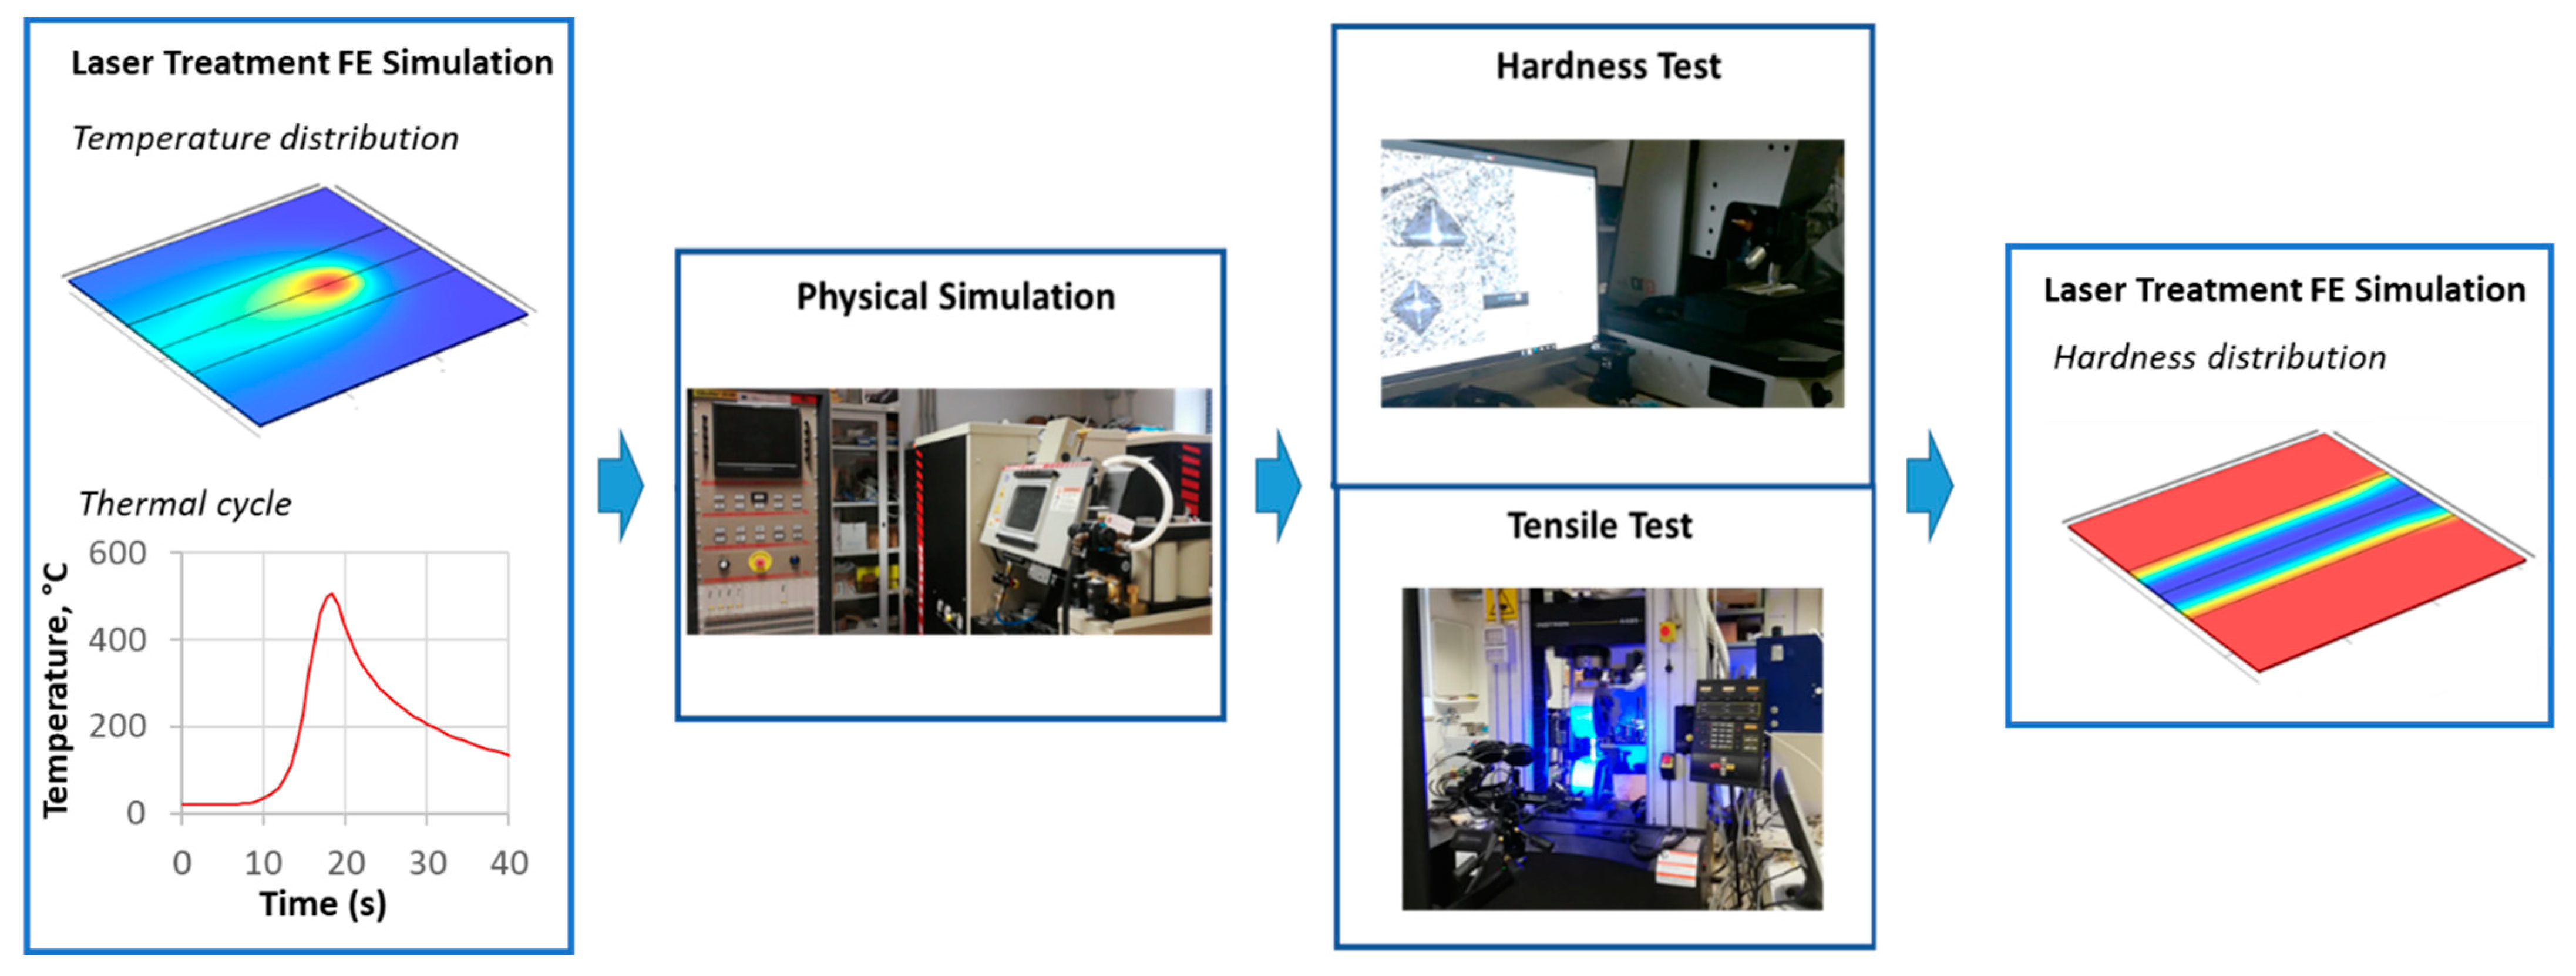
Figure 1. Schematic description of adopted methodology.
Jmmp 06 00064 g001
Figure 2. Mesh distribution in the blank.
Jmmp 06 00064 g002
Figure 3. Top hat distribution function.
Jmmp 06 00064 g003
Figure 4. Absorbed laser power profile, (T510V5).
Jmmp 06 00064 g004
Figure 5. Thermal cycles in the probes (1–9), (T510V5).
Jmmp 06 00064 g005
Figure 6. Temperature distribution in the blank after 22 s of surface treatment (T510V5).
Jmmp 06 00064 g006
Figure 7. Peak temperatures in the blank at the end of the laser surface treatment (T510V5).
Jmmp 06 00064 g007
Figure 8. Investigated laser thermal cycles.
Jmmp 06 00064 g008
Figure 9. Absorbed laser power as a function of the peak temperature.
Jmmp 06 00064 g009
Figure 10. Experimental setup for Gleeble tests.
Jmmp 06 00064 g010
Figure 11. (a) Geometry of tapered specimens; (b) Geometry of notched specimens.
Jmmp 06 00064 g011
Figure 12. (a) Geometry of tapered specimens in the FE model; (b) Peak temperature profile simulated with different heat transfer coefficients.
Jmmp 06 00064 g012
Figure 13. (a) Peak temperature distribution (T500V5). (b) Comparison between experimental (dotted line) and numerical (solid line) thermal cycles (T500V5).
Jmmp 06 00064 g013
Figure 14. Microhardness test scheme.
Jmmp 06 00064 g014
Figure 15. (a) Experimental equipment for uniaxial tensile tests; (b) Notched specimen with speckle-pattern.
Jmmp 06 00064 g015
Figure 16. Thermal cycles recorded by thermocouples (v = 5 mm/s).
Jmmp 06 00064 g016
Figure 17. Estimated temperature profiles in physical simulation tests of thermal cycles with treatment speed of 5 mm/s.
Jmmp 06 00064 g017
Figure 18. (a) Hardness mean values and standard deviations recorded at specimen centre in APS state for different treatment speed and peak temperature; (b) Hardness mean values and standard deviations recorded at specimen in T4 state for different treatment speed and peak temperature.
Jmmp 06 00064 g018
Figure 19. (a) Hardness profiles obtained after natural aging (T4) for treatment speed of 5 mm/s; (b) Hardness profiles obtained after natural aging (T4) for treatment speed of 7.5 mm/s.
Jmmp 06 00064 g019
Figure 20. Hardness and peak temperature profiles relative to T510V5 test (T4 state).
Jmmp 06 00064 g020
Figure 21. Hardness trend as a function of peak temperature relating to T510V5 test (T4 state).
Jmmp 06 00064 g021
Figure 22. (a) Hardness trend as a function of peak temperature related to laser treatments with a speed of 5 mm/s (T4 state); (b) Hardness trend as a function of peak temperature related to laser treatments with a speed of 7.5 mm/s (T4 state).
Jmmp 06 00064 g022
Figure 23. (a) Hardness trends as function of peak temperature obtained at treatment speeds of 5 mm/s and 7.5 mm/s in T4 state; (b) Comparison of hardness trends as a function of peak temperature between APS and T4 state.
Jmmp 06 00064 g023
Figure 24. Tapered specimen after the tensile test.
Jmmp 06 00064 g024
Figure 25. (a) Peak temperature and hardness profiles along the longitudinal direction of the specimen (T510V5-T4); (b) Microhardness distribution in the tapered specimen (T510V5-T4).
Jmmp 06 00064 g025
Figure 26. (a) Equivalent Von Mises strain across specimen longitudinal section; (b) Equivalent Von Mises strain across specimen longitudinal section.
Jmmp 06 00064 g026
Figure 27. (a) Stress–strain curves of base material and those obtained in APS state for laser thermal cycles at a treatment speed equal to 5 mm/s; (b) Stress–strain curves of base material and those obtained in T4 state for laser thermal cycles at a treatment speed equal to 5 mm/s.
Jmmp 06 00064 g027
Figure 28. (a) Von Mises equivalent strain after physical simulation for all investigated laser conditions and comparison with material base; (b) Von Mises equivalent strain after natural aging for all investigated laser conditions and comparison with material base.
Jmmp 06 00064 g028
Figure 29. (a) Softening level reached in T4 state for all investigated laser treatments; (b) Softening level reached in APS state for all investigated laser treatments.
Jmmp 06 00064 g029
Figure 30. (a) Blank peak temperature distribution for the laser treatment carried out at the peak temperature of 420 °C and treatment speed of 5 mm/s; (b) Hardness distribution in the blank in T4 state for the laser treatment carried out at the peak temperature of 420 °C and treatment speed of 5 mm/s.
Jmmp 06 00064 g030
Figure 31. (a) Hardness and peak temperature profiles evaluated transversely to the treatment direction (T420V5-T4); (b) Hardness and peak temperature profiles evaluated along the treatment direction (T420V5-T4).
Jmmp 06 00064 g031
Figure 32. (a). Blank peak temperatures distribution in the laser treatment carried out at the peak temperature of 500 °C and treatment speed of 5 mm/s; (b) Hardness distribution in the blank in APS state in the treatment carried out at the peak temperature of 500 °C and treatment speed of 5 mm/s.
Jmmp 06 00064 g032
Figure 33. (a) Hardness and peak temperature profiles evaluated transversely to the treatment direction (T500V5-APS); (b) Hardness and peak temperature profiles evaluated along the treatment direction (T500V5-APS).
Jmmp 06 00064 g033
Table 1. Chemical composition of the investigated alloy (EN AW 6082 T6).
SiFe2CuMnMgCr2Zn2Ti2Al
0.70–1.30≤0.50≤0.100.4–10.6–1.20≤0.25≤0.20≤0.10Balance
Table 2. Thermal conductivity (k), specific heat (Cp) and density (ρ) functions.
T (°C) k (W/(m ∗ K)) Cp (J/(kg/∗K)) ρ (kg/cm3)
20–600 182.15 + 0.0611 × T893.65 + 0.5771 × T2.7645 − 0.0002 × T
Table 3. Laser heat treatment condition.
Treatment Code v (mm/s) Tpeak (°C)
T510V5 5510
T400V5 5400
T310V5 5310
T510V7.5 7.5510
T400V7.5 7.5400
T310V7.5 7.5310
Table 4. Experimental scheme.
Specimen TypeGleeble TestHardness TestTensile Test
Sample StateRepetitionsSample StateRepetitions
taperedThermal cycles according to laser treatment condition in Table 3 (Figure 8)APS2
T42
notched APS3
T43
Table 5. Polynomials obtained by the fitting of micro-hardness results measured on specimens in APS and T4 states and corresponding to a 5 mm/s treatment speed.
StateT (°C)HV0.2
APS 50 118
50–420 1.78685 × 10 6 · T 3 1.31778 × 10 3 · T 2 + 1.09791 × 10 1 · T + 1.15952 × 10 2
420–470 1.07145 × 10 5 · T 3 + 1.50812 × 10 2 · T 2 7.00864 · T + 1.13911 × 10 3
470–520 1.8395 × 10 5 · T 3 2.7494 × 10 2 · T 2 + 1.3696 × 10 1 · T 2.2093 × 10 3
T4 50 118
50–410 3.44827 × 10 4 · T 3 + 4.52993 × 10 1 · T 2 1.97969 × 10 2 · T + 2.88519 × 10 4
410–450 1.28439 × 10 6 · T 3 + 4.71167 × 10 4 · T 2 1.17033 × 10 1 · T + 1.21887 × 10 2
450–520 5.44251 × 10 5 · T 3 7.95658 × 10 2 · T 2 + 3.87559 × 10 1 · T 6.21317 × 10 3
Publisher’s Note: MDPI stays neutral with regard to jurisdictional claims in published maps and institutional affiliations.