Article

Carbonated 3D-Printable Polymer Composite for Thermo-Mechanically Stable Applications

Department of Mechanical Engineering, Southern University and A&M College, Baton Rouge, LA 70813, USA
*
Author to whom correspondence should be addressed.
J. Manuf. Mater. Process. 2022, 6(3), 66; https://doi.org/10.3390/jmmp6030066
Submission received: 10 May 2022 / Revised: 7 June 2022 / Accepted: 13 June 2022 / Published: 15 June 2022

Abstract

:
In this report, we investigate the infusion of carbon dioxide into a 3D-printable photosensitive polymer. The result is a carbonated polymer composite material. In use, polymer composite materials expect to succeed where ordinary polymers and metals fail. This is due to the tailorability of composite materials for specific applications. Usually, micro/nano-particulates are embedded as fillers within a polymer matrix, enhancing the overall material properties. Here, carbon dioxide (CO2) microbubbles serve as the filler within a nylon-like polymer matrix. Additive manufacturing by stereolithography (SLA) of the carbonated polymer composite proved possible using the digital light projection (DLP) 3D printing technique. Post-heat treatment using thermogravimetric analysis of the samples at elevated temperatures resulted in a 33% mass reduction, indicative of nearly complete solvent removal and curing. An initial increase in polymer carbonation duration showed a 16% increase in porosity, more stable thermal profiles, and a 40% decrease in specific heat capacity. Thermo-mechanical compressive tests on an optimal carbonated sample revealed a 70% increase in compressive strength over its neat counterpart and a peak modulus at 50 °C of 60 MPa. Such 3D-printable carbonated polymer composites may find use in applications requiring high strength-to-weight ratio thermally stable polymers and applications requiring a versatile and convenient storage medium for on-demand CO2 deposition or supercritical fluid phase transformation.

Graphical Abstract

1. Introduction

As engineering requirements for materials become stricter, it is imperative that material selection and processability become more expansive. Composites serve as an effective approach to this demand since they are tailorable to a myriad of applications. Furthermore, the option of creating complex shapes from a composite provides an additional expansion of its use. The intent of this work is to address this material requirement by introducing a new polymer composite material that can be additively manufactured by 3D printing.
Fundamentally, polymer composites are comprised of two parts: the lightweight polymer matrix, which constitutes the bulk of the material and functions as the major load bearer, and the filler, which functions as an enhancement to the matrix. The effective composition of these materials provides solutions to problems where ordinary polymers and metals fail. Imparting useful properties such as increased surface area, conductivity, and the high strength of metal or nonmetal micro- or nano-particulates as fillers into a polymer matrix creates a versatile, lightweight, easily formable, multifunctional polymer composite material [1,2,3,4,5,6]. In this work, it is suggested that gas molecules can also serve as a filler within a polymer matrix. This suggestion is largely counter-intuitive since, generally, pockets of air (gas) or voids in composites and in materials are categorized as defects and cause adverse effects on the overall material property and performance [7,8]. Extensive work goes into the detection of voids and their formation [9,10,11,12,13]. Even more research is directed toward avoiding and removing gas bubbles from resin during manufacturing [14]. However, instead of removal, the objective here is to intentionally include gas microbubbles to make the resulting material thermally and mechanically advantageous over its neat polymer counterpart. In this study, the gas chosen as the filler constituent of the composite is carbon dioxide. Carbon dioxide (CO2) is abundant in nature, and it is well understood that moderate levels of it in the troposphere help regulate the temperature of the planet, whereas an excess of it, contributed largely by combustion engines, has led to adverse effects on the global climate [15,16]. This is because the heavier-than-air CO2 molecule can absorb heat, which, in turn, also grants it many other beneficial commercial uses such as in beverages, liquid fuel, concrete curing, fire extinguishers, and as a dry refrigerant [17]. Figure 1 is the phase diagram of CO2 illustrating the phase state and transformations of the molecule due to changes in pressure and temperature. In terms of material selection, the purpose of Figure 1 is to provide some information pertaining to the properties of the molecule we intend on using as the filler or enhancement to the neat thermoset polymer. Therefore, of particular importance to this study and as shown in Figure 1, are (1) the thermal stability of the gas molecule filler at 1 atm (for manufacturing, material utility, and operational purposes) and (2) the conditions necessary to transform the phase of the CO2 filler, for material application purposes. One application to consider is the utility of the printed carbonated composite as a personal, portable, and on-demand CO2 phase transformation storage medium. For example, the phase diagram indicates that the critical point to transform the gas into a supercritical fluid occurs at a minimum temperature and pressure of 30.98 °C and 72.79 atm (7.38 MPa), respectively. The release and storage of supercritical fluids within porous materials have proved useful in solvent extraction, porous polymer synthesis, lithography, and food processing applications [18]. We use the results of this study to determine if the manufactured composite is thermally and mechanically suitable for this application.
Recently, Tang et al. reviewed CO2-based functional polymers in which CO2 was used to create enhanced polymers [19]. It was reported that by using CO2 as a precursor, advanced polymers could be formed. For example, CO2-based polycarbonates showed superior thermal properties over typical PPCs. More towards the additive manufacturing interest of this work, they also reviewed CO2-derived polyhydroxyurethanes (PHUs), which were found to be 3D printable by extrusion-based fused deposition modeling.
In contrast to the cited work, we report on the thermal and mechanical properties of infusing CO2 gas as the filler into a 3D-printable thermoset polymer matrix. The brief outline of this study is to (1) infuse CO2 in its gas state (microbubbles) into a photosensitive thermoset polymer, (2) 3D print the now carbonated polymer composite, and (3) characterize the material to determine if the properties of the CO2 filler have influenced the polymer matrix in such a way as to enhance its thermal and mechanical properties.

2. Material and Methods

2.1. Sample Preparation

The photosensitive resin, Nylon Green Tough Resin® from Phrozen Technology, was carbonated at standard room temperature and pressure using forced carbonation, a method akin to carbonating liquids and, recently, cement [20]. The lab-made carbonation system, as shown in Figure 2a, included a capped vial with a drill hole to accommodate a pipette tip and tube assembly for the flow of CO2. Sixteen-gram canisters of CO2 were acquired from Leland Gas Technologies. On each run, a CO2 canister was fitted to a PrestaTM Valve Stem to regulate the gas flow through the tubing assembly into the half-filled vial of resin. The vial cap entrance was quickly sealed then placed into the 8000 M Mixer/Mill®, and shaken for intervals of 5, 10, 15, 20, 25, 35, and 45 s. The now carbonated photosensitive resins were then slowly poured into the vat of the Phrozen Sonic 4 K 3D Printer® for printing.
With a UV peak wavelength of 405 nm, a 200 µm thick base layer composed of four 50 µm layers was exposed to a dose of 87 mJcm−2. This was to ensure that the samples adhered to the surface of the build plate after print completion. The subsequent 50 µm thick layers were each exposed to a dose of 3.8 mJcm−2, resulting in an approximate total UV exposure dosage of approximately 1–2 Jcm−2 for each sample. The samples were then soaked and rinsed with IPA for 2 min and allowed to air dry for 5 min, then placed in storage. Figure 2b is an image of a carbonated printed polymer coupon. The final dimensions used for the cylindrical samples, shown in Figure 2c, were 4 mm in diameter with 1.7 mm in height for porosity and thermal testing and 4 mm in height for mechanical testing.
The process parameters are summarized in Table 1 below.

2.2. Sample Analysis

Morphological studies were carried out with both an optical microscope equipped with a Nikon CCD camera and the Nanoscience Instruments Phenom ProX Scanning Electron Microscope (SEM). To investigate whether the printed samples were completely removed of solvent (i.e., completely cured) via UV print exposure, an as-printed initial weight of each sample was taken, followed by a five-cycle 1 min exposure dose/weight measurement experiment. Thermogravimetric analysis (TGA) was also performed to study the effects of thermal curing on solvent removal or weight change. The Micromeritics AccuPyc II 1340 Gas Pycnometer was used to obtain porosity measurements. Differential scanning calorimetry (DSC) using the Hitachi® DSC7000X Thermal Analysis System, at a temperature ramp rate of 1 °C min−1, was used to observe the thermal behavior of the samples, specifically, the effect of polymer carbonation and post-heat treatment on the thermal profile and specific heat capacity. A TA Instruments RSAG2 Dynamical Mechanical Analyzer (DMA) was used to carry out compressive strength testing at room temperature and under varying temperatures up to 150 °C with a frequency sweep testing mode ranging from 1 to 100 Hz.

3. Results and Discussion

3D printing of these samples proved successful. Optical microscopy shown in Figure 3 of the samples shows the increase in CO2 bubbles as the shaking or carbonation duration increased. For a comparative study, samples were also oxygenated at the same parameters. As shown, the infusion of air is less than that of CO2, which is a consequence of CO2 being heavier and having a higher permeability than air [17]. The bubble size varies widely with the carbonated sample having an average bubble size of 340 µm at a mixing duration of 20 s. Figure 4 shows an SEM cross-sectional image of a carbonated 3D-printed polymer. With an increased depth of focus compared to optical microscopy, electron microscopy of the cross-sectional view of a carbonated sample clearly shows the approximately 200 µm voids where CO2 gas-filled microbubbles were once located. The void has a smooth distinct bowl shape with a polymer matrix wall, indicating that the CO2 bubbles physically resemble that of a smooth solid particle filler, such as in syntactic foam polymers [21,22]. The surrounding cut polymer surface shows a brittle-like fracture, typical of additively manufactured thermoset polymers [21,23,24], especially around the once-filled CO2 pockets. Any residual polymer strings or debris within the voids are likely to be due to the cutting fracture upon sectioning.
Figure 5 shows the effect of carbonation and post-UV exposure time on polymer weight. The weight of the neat polymer is 14.5 mg, whereas the weight of the carbonated samples is about 21% higher. This indicates that carbonation results in an increase in mass, reinforcing the idea that the CO2 microbubbles are not behaving as true voids but instead as matrix fillers. This measurement also provides an approximate microbubble weight fraction of 17%. It is noted, however, that an increase in carbonation duration unexpectedly did not result in a corresponding increase in weight. This is attributed to not having the desired control, not only of micro-bubble size but also of quantity and distribution. Extended UV exposure dosage showed no significant effect on weight change.
Thermogravimetric analysis (TGA), shown in Figure 6 of the neat printed sample shows that after approximately 10 h of thermal curing at 100 °C, the solvent of the polymer has been nearly completely removed, indicating complete curing. In the interest of studying completely cured carbonated polymer composites, the subsequent samples were all cured at 100 °C for 10 h. This result also indicates that off-gassing or removal of solvent has occurred and can indirectly indicate the gas permeability or porous network of the sample. This is a critical factor in using He gas-based pycnometry to measure porosity [25,26].
Porosity measurements of the neat and cured carbonated polymer samples were carried out according to ASTM D4892 guidelines [27]. Figure 7 shows how the porosity changes with respect to carbonation duration (circled value) of as-printed and post-heat treatment cured samples at maximum temperatures of 100 °C and 300 °C. As shown, the porosity volume increases 25% over the neat polymer for carbonation duration up to 25 s with a maximum porosity of 15%, then begins to decrease for longer durations. This decrease may be the result of pre-UV exposure temperature increase effects occurring during carbonation at lengthier times. In-situ temperature measurements would provide more information on whether this is the case. Furthermore, post-heat treatment resulted in a decrease in porosity volume with a minimum observed at 8%. With regards to structural dimensional change, there is no noticeable contraction of the sample after post-heat treatment. The polymer macromolecular chains are strongly cross-linked into shape facilitated by a photoinitiated component within the nylon-like resin having been accurately and selectively exposed to UV light via DLP. Any reduction of mass due to post-heat treatment is likely the loss of trapped water molecules and excess solvent, and the removal of any unexposed resin.
Figure 8 is an illustration showing the method by which porosity is measured (middle image). The pycnometer uses helium gas to flood voids present within the sample and measures changes in pressure by displacement. It is important to note that the microbubbles observed are filled with CO2 gas and behave as a solid filler component in a composite material. Therefore, the bubbles may not be interpreted as pores or voids and do not directly factor into the change in the porosity. Instead, the change may be due to surface interfacial voids that may be formed between the microbubbles and the polymer matrix. It is likely that under post-heat treatment, thermal molecular vibrations cause these interfacial voids and bubbles to be displaced or to collapse giving rise to increased matrix-to-bubble filler surface contact, resulting in decreased porosity, as depicted in Figure 8.
Figure 9 shows thermal profiles of as-printed, neat cured, and carbonated samples observed using DSC. The as-printed samples show more pronounced endothermic and exothermic changes signaling thermal curing (TC) between 35 °C and 125 °C. The cured sample showed more thermal stability with a less pronounced transition with fewer pronounced transition points. Comparatively, the carbonated samples showed increased stability over the cured as-printed samples.
Over the entire measured temperature range, the carbonated samples show more thermal stability overall as indicated in the linear fit approximations in Figure 10. The lower slope of the carbonated samples indicates increased thermal stability over a wide temperature range, whereas the higher slope (as-printed and neat cured) indicates decreased thermal stability.
An analysis of the DSC thermal profile yielded information pertaining to the specific heat capacity (CP) of the samples. These measurements were made in accordance with ASTM E1269–11 guidelines [28]. Figure 11 shows CP of neat and carbonated samples with respect to change in temperature from 35 °C and upwards. The as-printed (neat) sample exhibited a large fluctuation in CP between 35 °C and TG with a steep increase in CP reaching a maximum of 4.16 Jg−1 °C−1. It is likely that this high value is due to an increase in the composite molecular vibrations of an incomplete but curing state of the as-printed sample. With the exception of the high inflection CP point, the neat cured sample has a similar profile to that of the as-printed neat sample.
As expected, CP initially increases with an increase in temperature. The inflection at TG signals the molecules taking a more ordered arrangement with a decrease in molecular vibrations. After TG, the carbonated samples exhibited near-constant CP values up until the decomposition temperature (TD) point. Plotting the average CP values for the carbonated samples, shown in Figure 12, shows that a minimum CP value of 1.85 was observed for the 15 s carbonation duration sample. The increase for longer carbonation duration samples may be due to unwanted pre-thermal curing during the mixing/carbonation stage. It is suggested that a form of temperature regulation is implemented to avoid pre-printing thermal effects of the material. The more thermally stable CP profiles of the carbonated samples reflect the fact that the CO2 micro-bubbles do indeed absorb and hold heat, thereby transferring heat into the surrounding polymer matrix, requiring less heat energy to increase the overall composite temperature.
Compressive strength tests were performed on the neat and the thermally stable 15 s carbonated polymer composite sample, as shown in Figure 13. A comparative study shows a 70% increase in the average elastic modulus (E’) of the carbonated sample over its neat counterpart. Effects of temperature on E’, shown in Figure 14, for the carbonated sample were also investigated. At room temperature, E’ was measured to be approximately 38 MPa. An initial increase in temperature resulted in a fluctuating yet increasing trend in E’ to a maximum of approximately 60 MPa at 323 K (50 °C). For higher temperatures, it was observed that E’ decreased exponentially. This temperature modulus-dependent behavior is expected as the polymer molecular bonds weaken under increasing temperature thereby weakening the overall strength of the matrix. The initial modulus fluctuations observed may be indicative of the CO2 microbubbles collapsing while undergoing compression. These thermal and mechanical results correlate fairly well with the reported literature on similar thermosetting polymers [29,30].

4. Conclusions

We synthesized and successfully 3D printed a novel carbonated polymer composite. The novelty includes:
  • Synthesizing a carbonated polymer composite material using a method akin to liquid carbonation
  • Additive manufacturing of the carbonated polymer composite proved possible using the digital light projection (DLP) 3D-printing technique
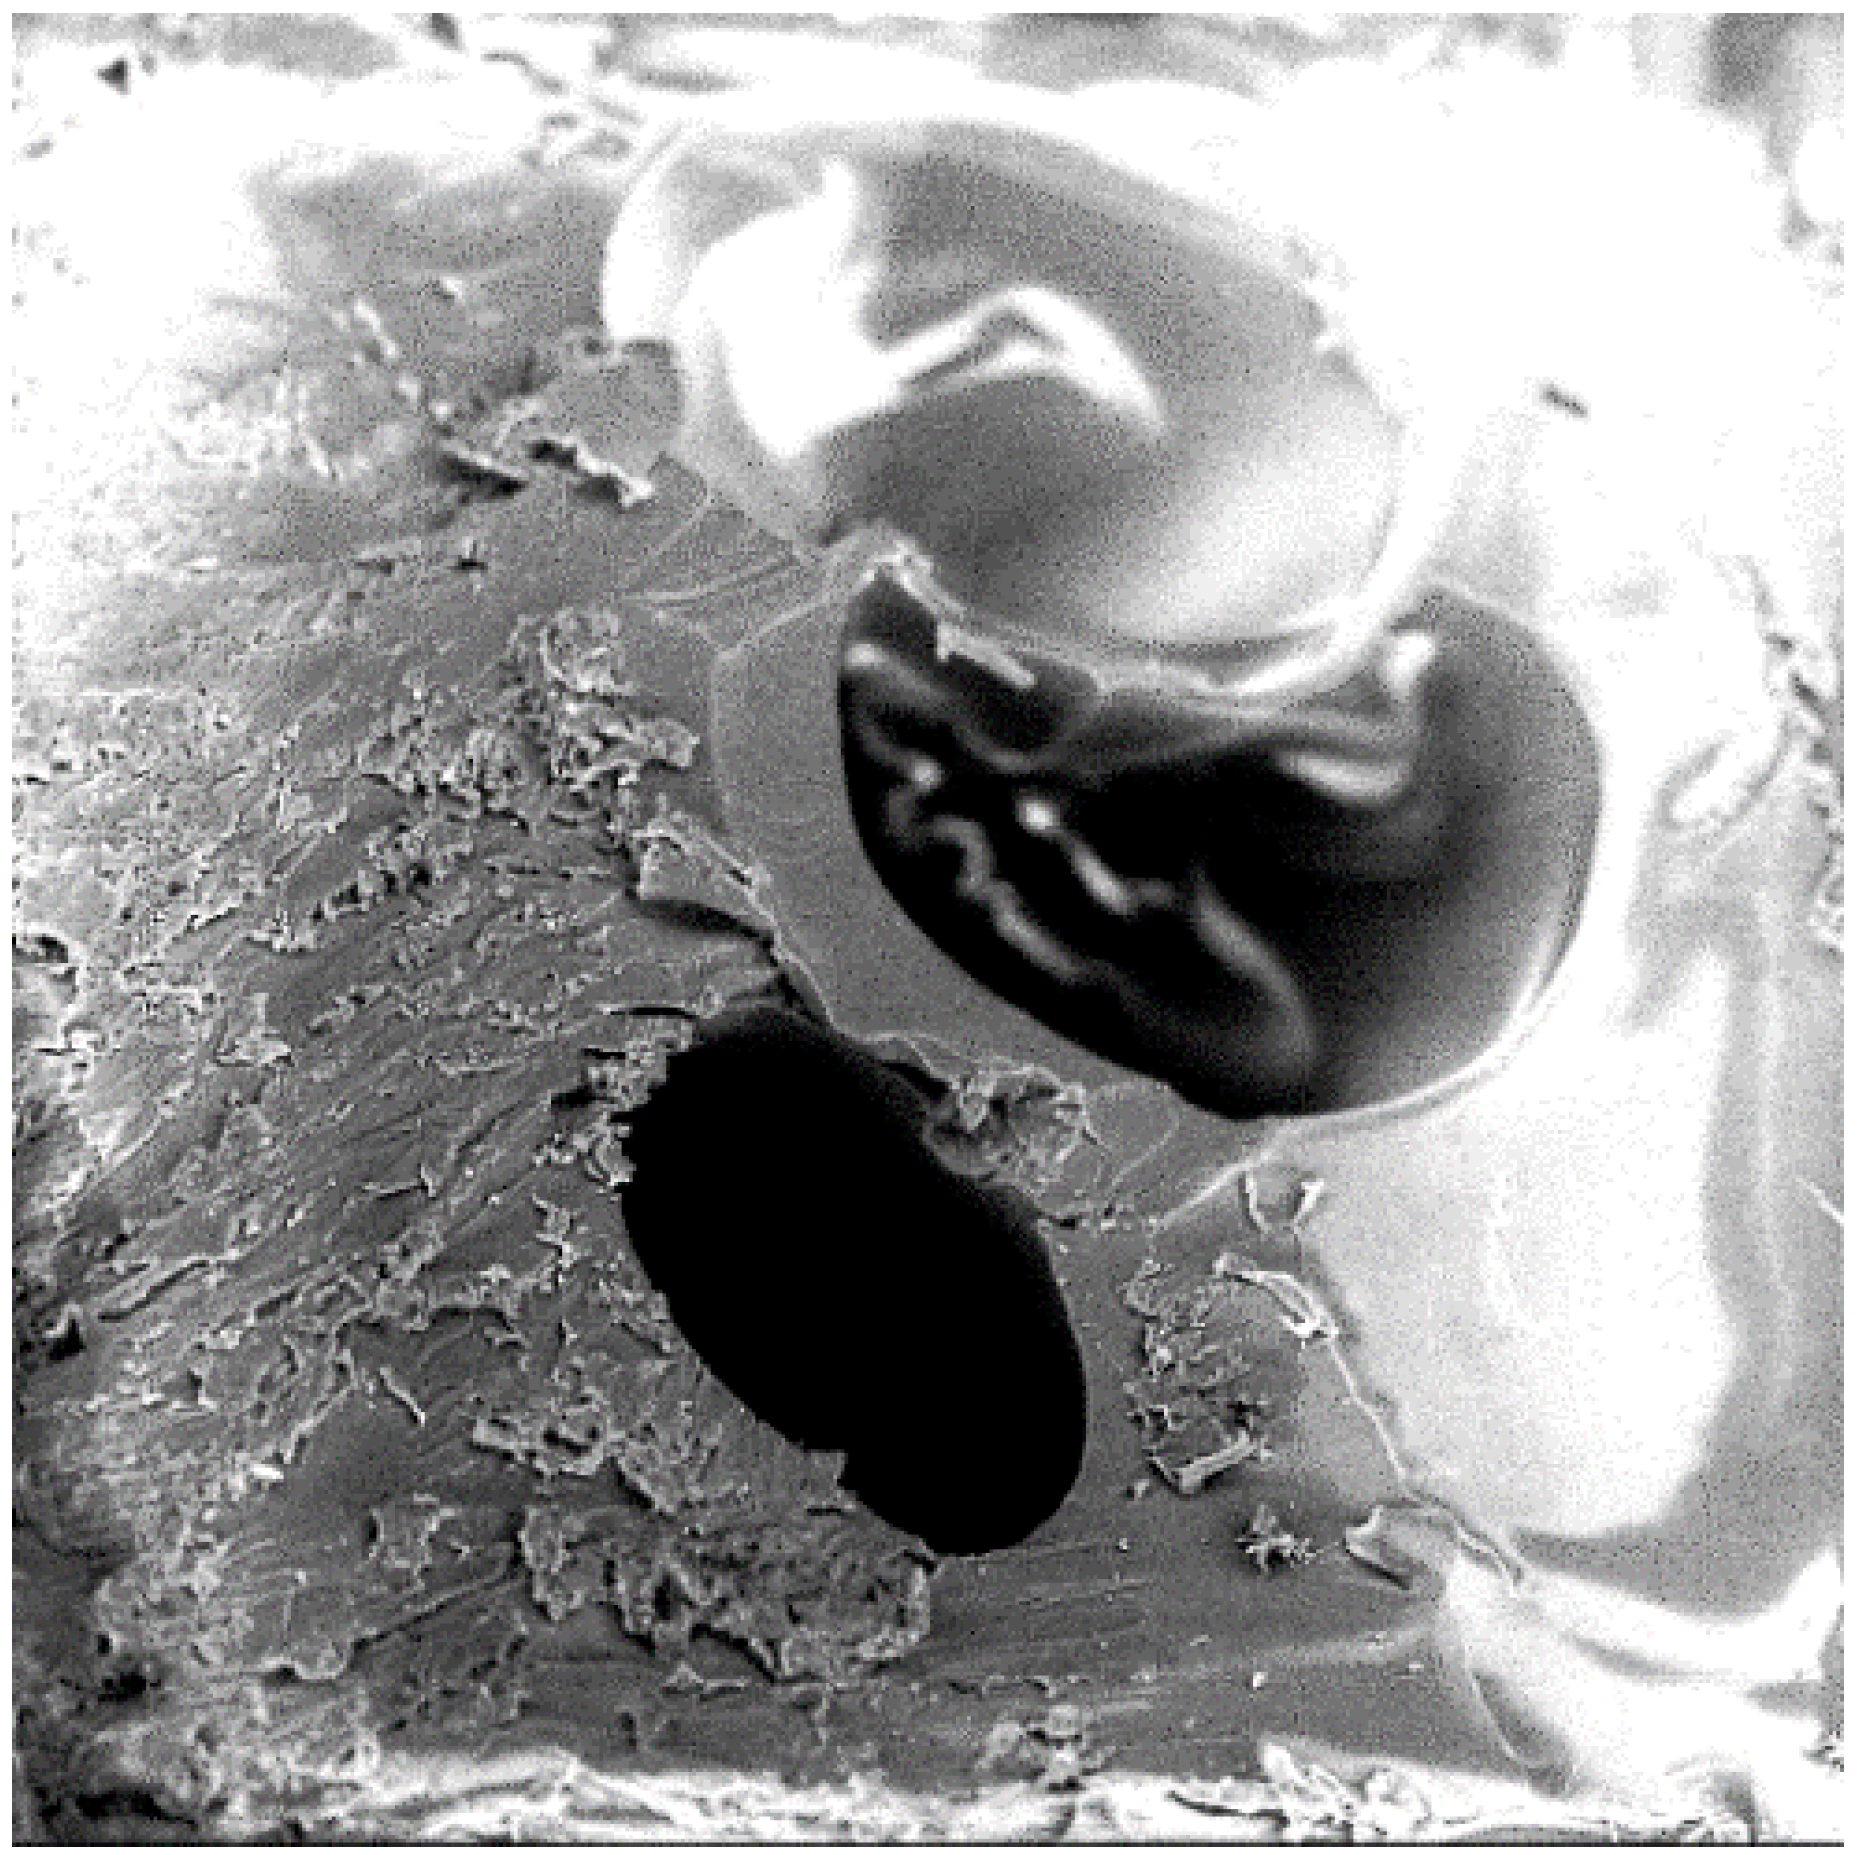
  • Characterization revealed that the CO2 gas molecule physically behaves as a solid particulate filler. This observation gives rise to the consideration of utilizing an assortment of other gas molecules and mixtures with unique properties as polymer enhancement fillers, thereby expanding the selection of polymer composite materials and manufacturing processes.
The main contributions of this current work to the scientific community’s body of knowledge include:
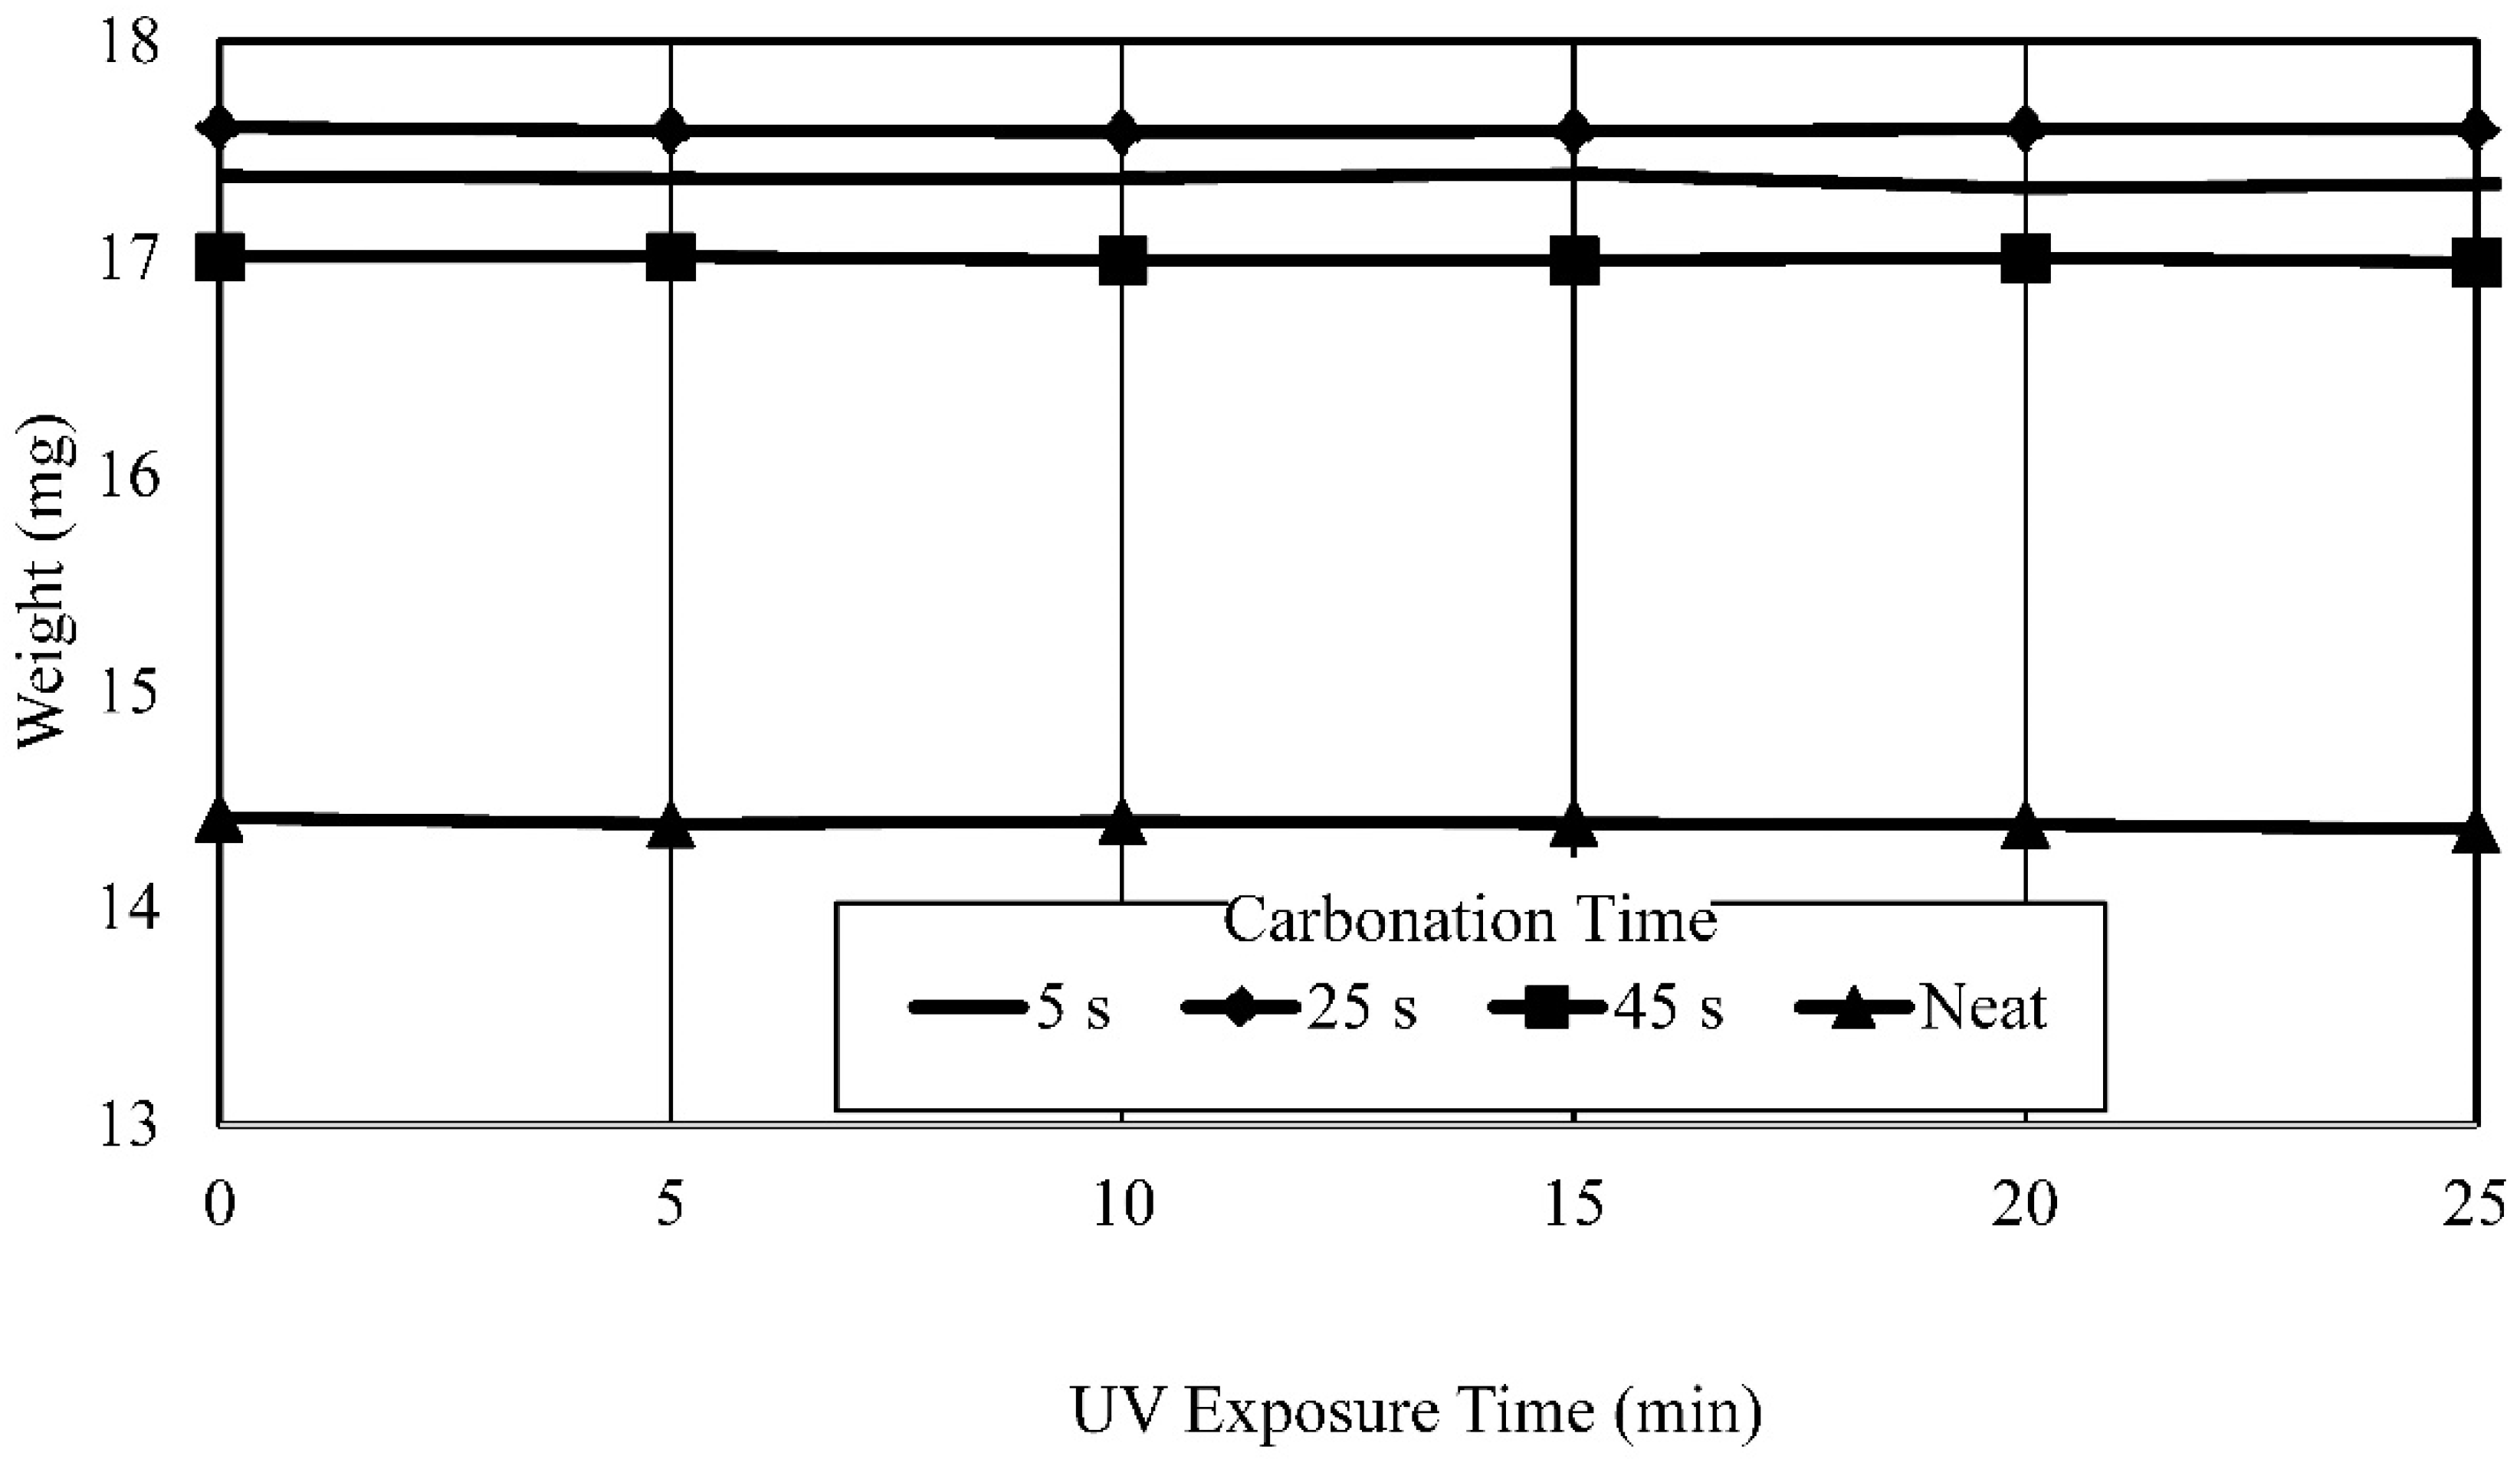
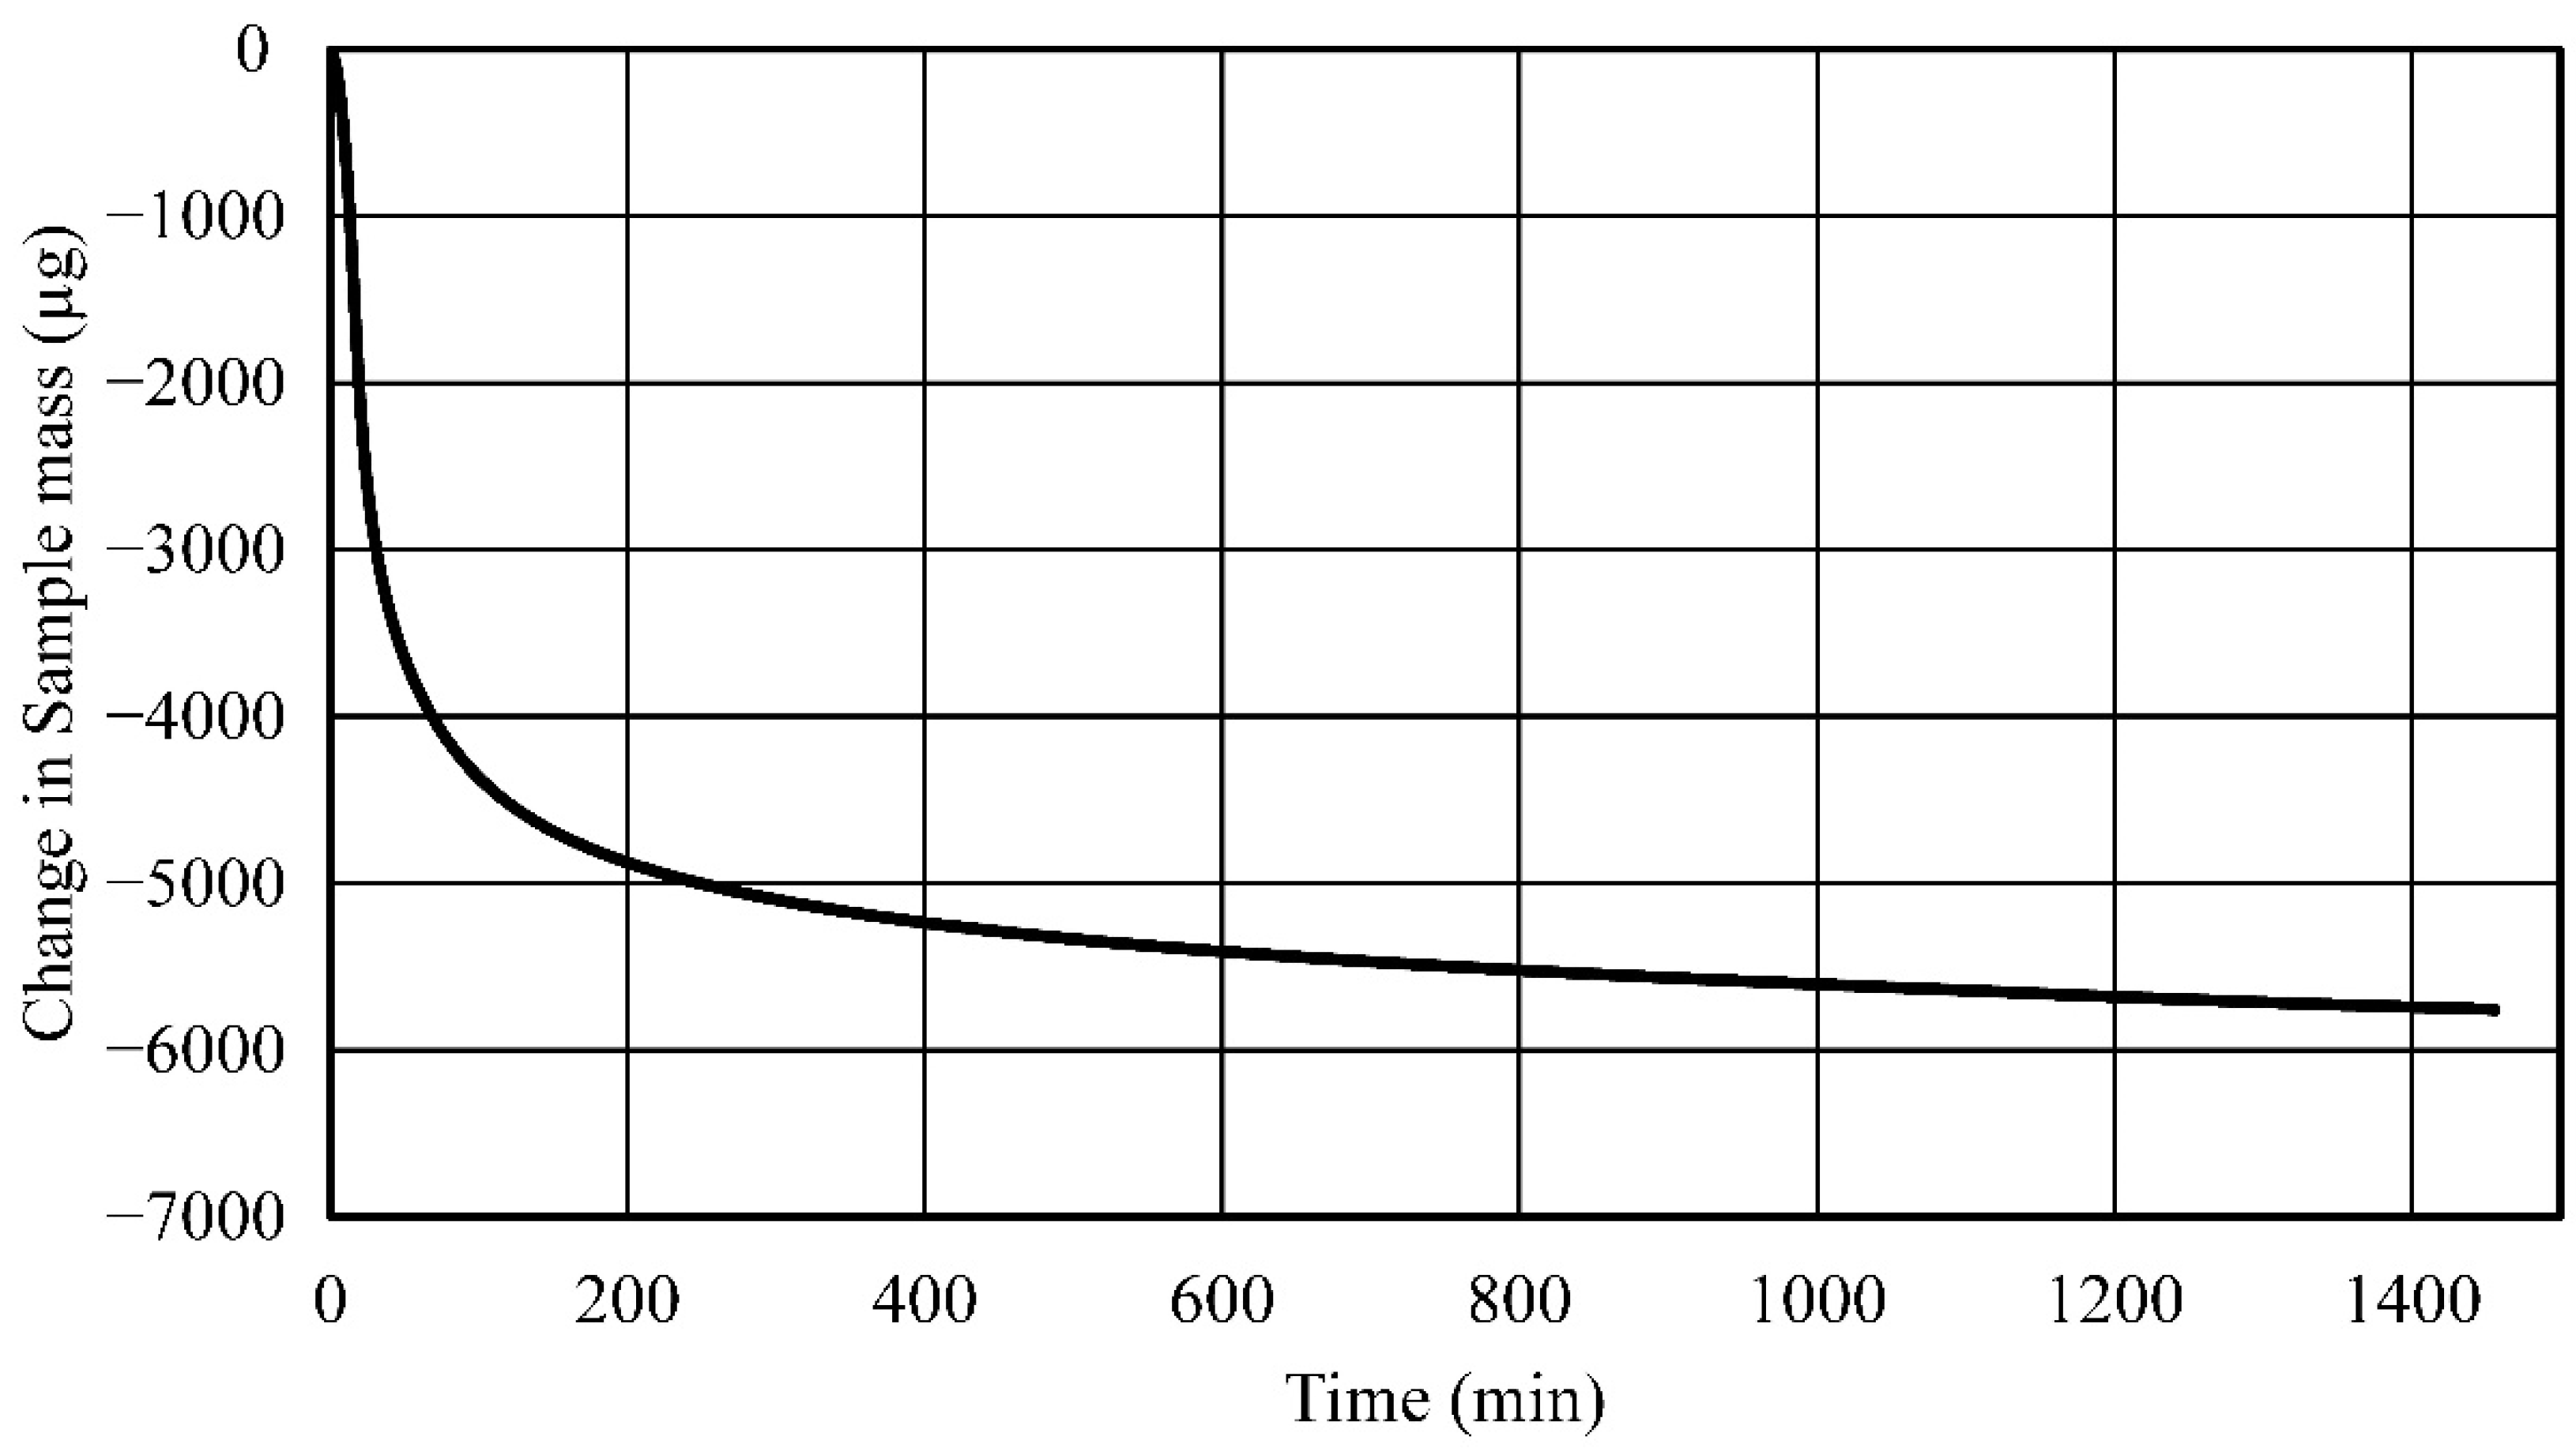
  • Established process and process parameters to synthesize and 3D print carbonated polymer composites and studied effects of UV overexposure and post-heat treatment—it was observed that extended UV-exposure dose showed no effect on additional solvent removal. Post-heat treatment using thermogravimetric analysis of the neat polymer sample at elevated temperatures resulted in a 33% mass reduction, indicative of nearly complete water and solvent removal and curing.
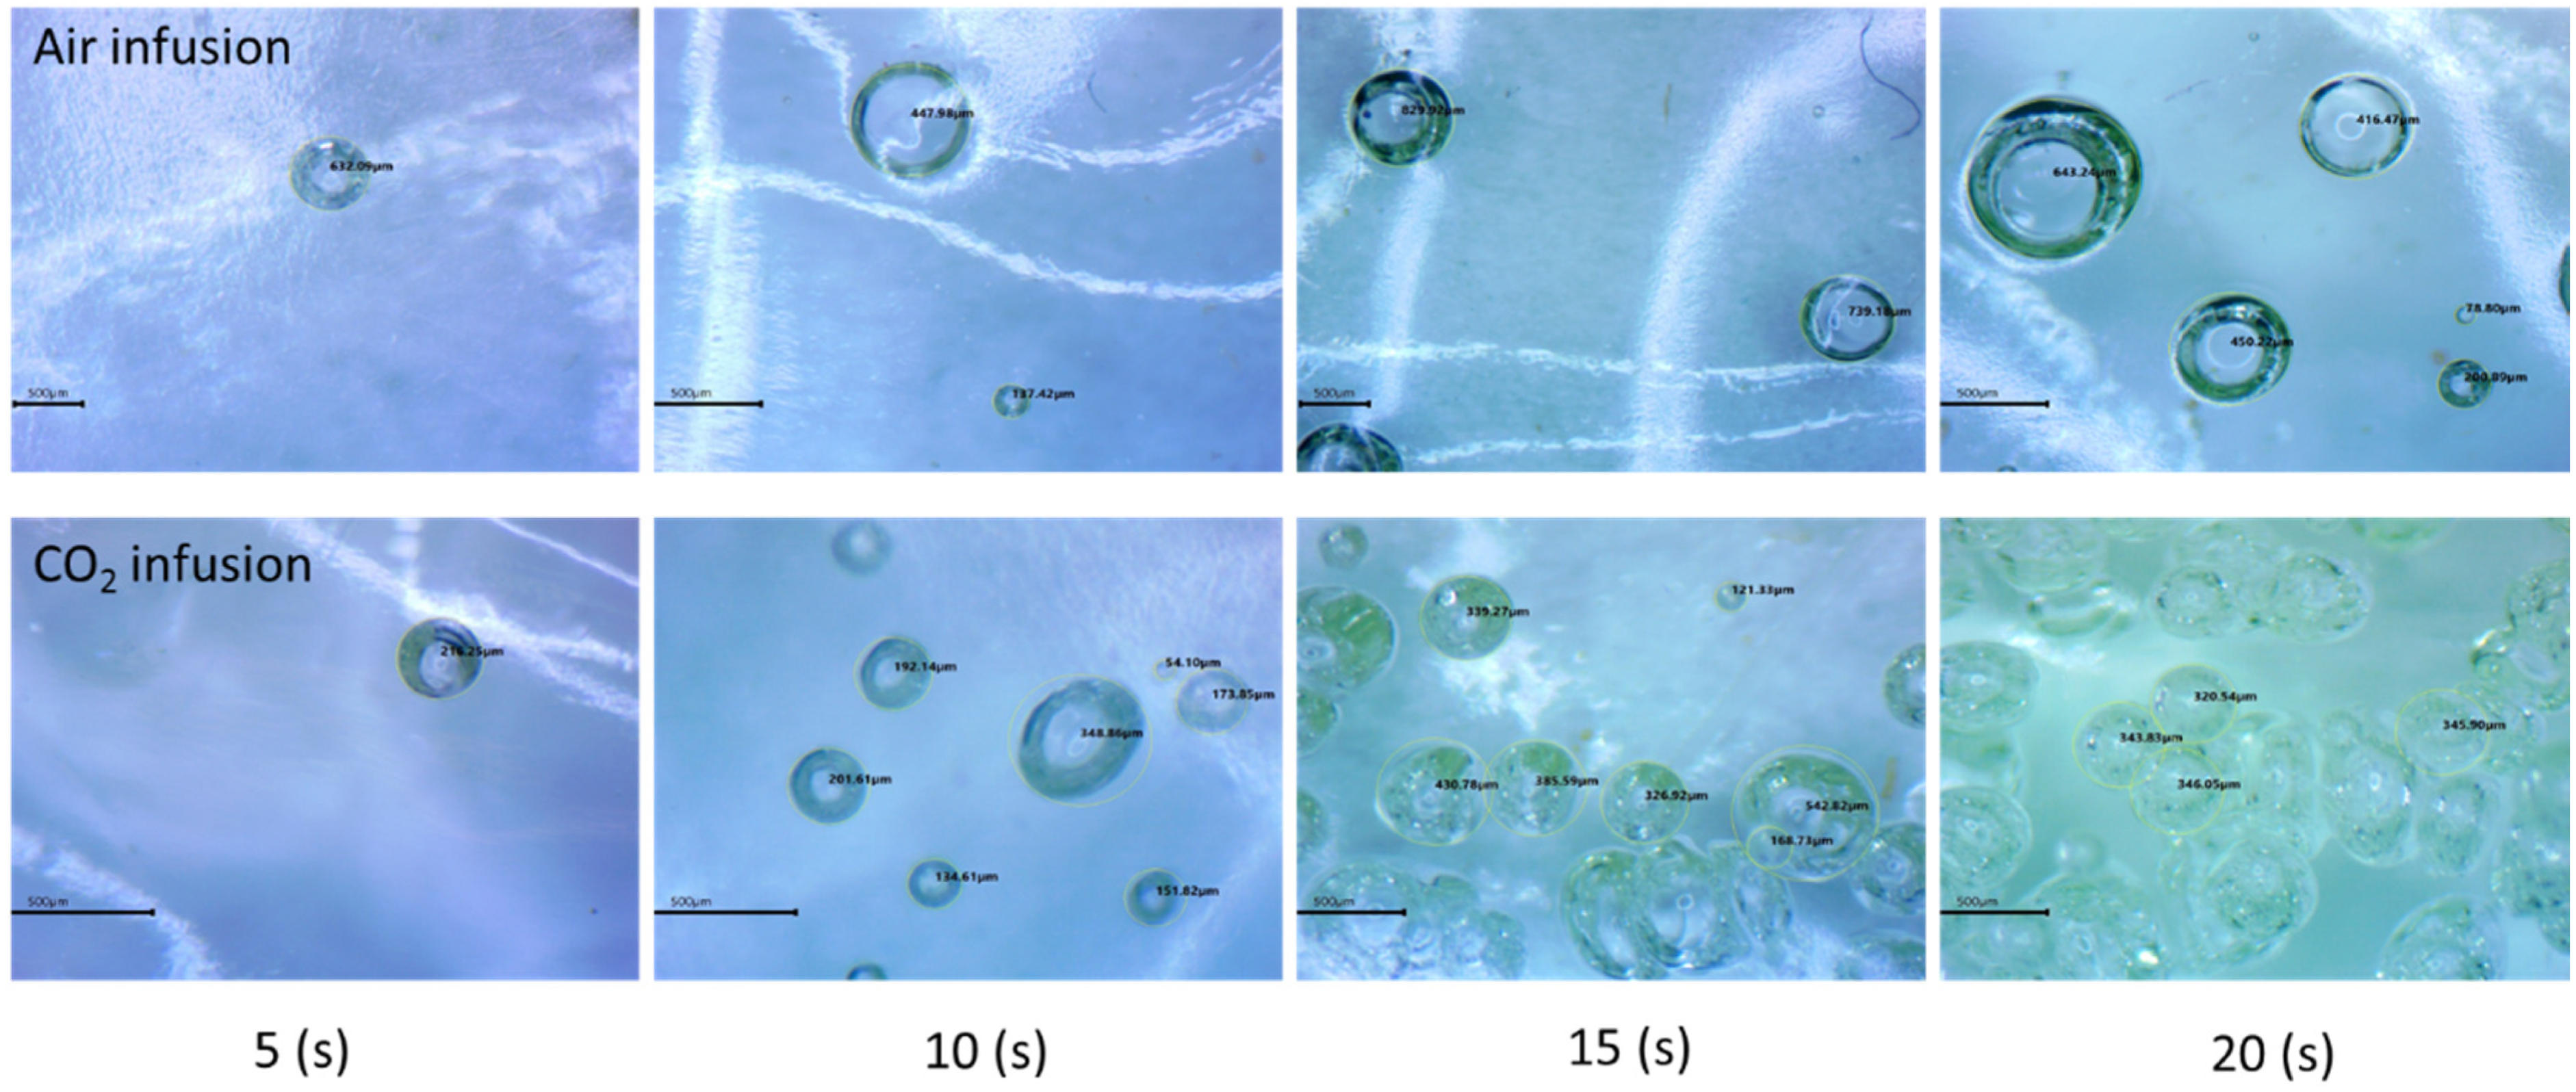
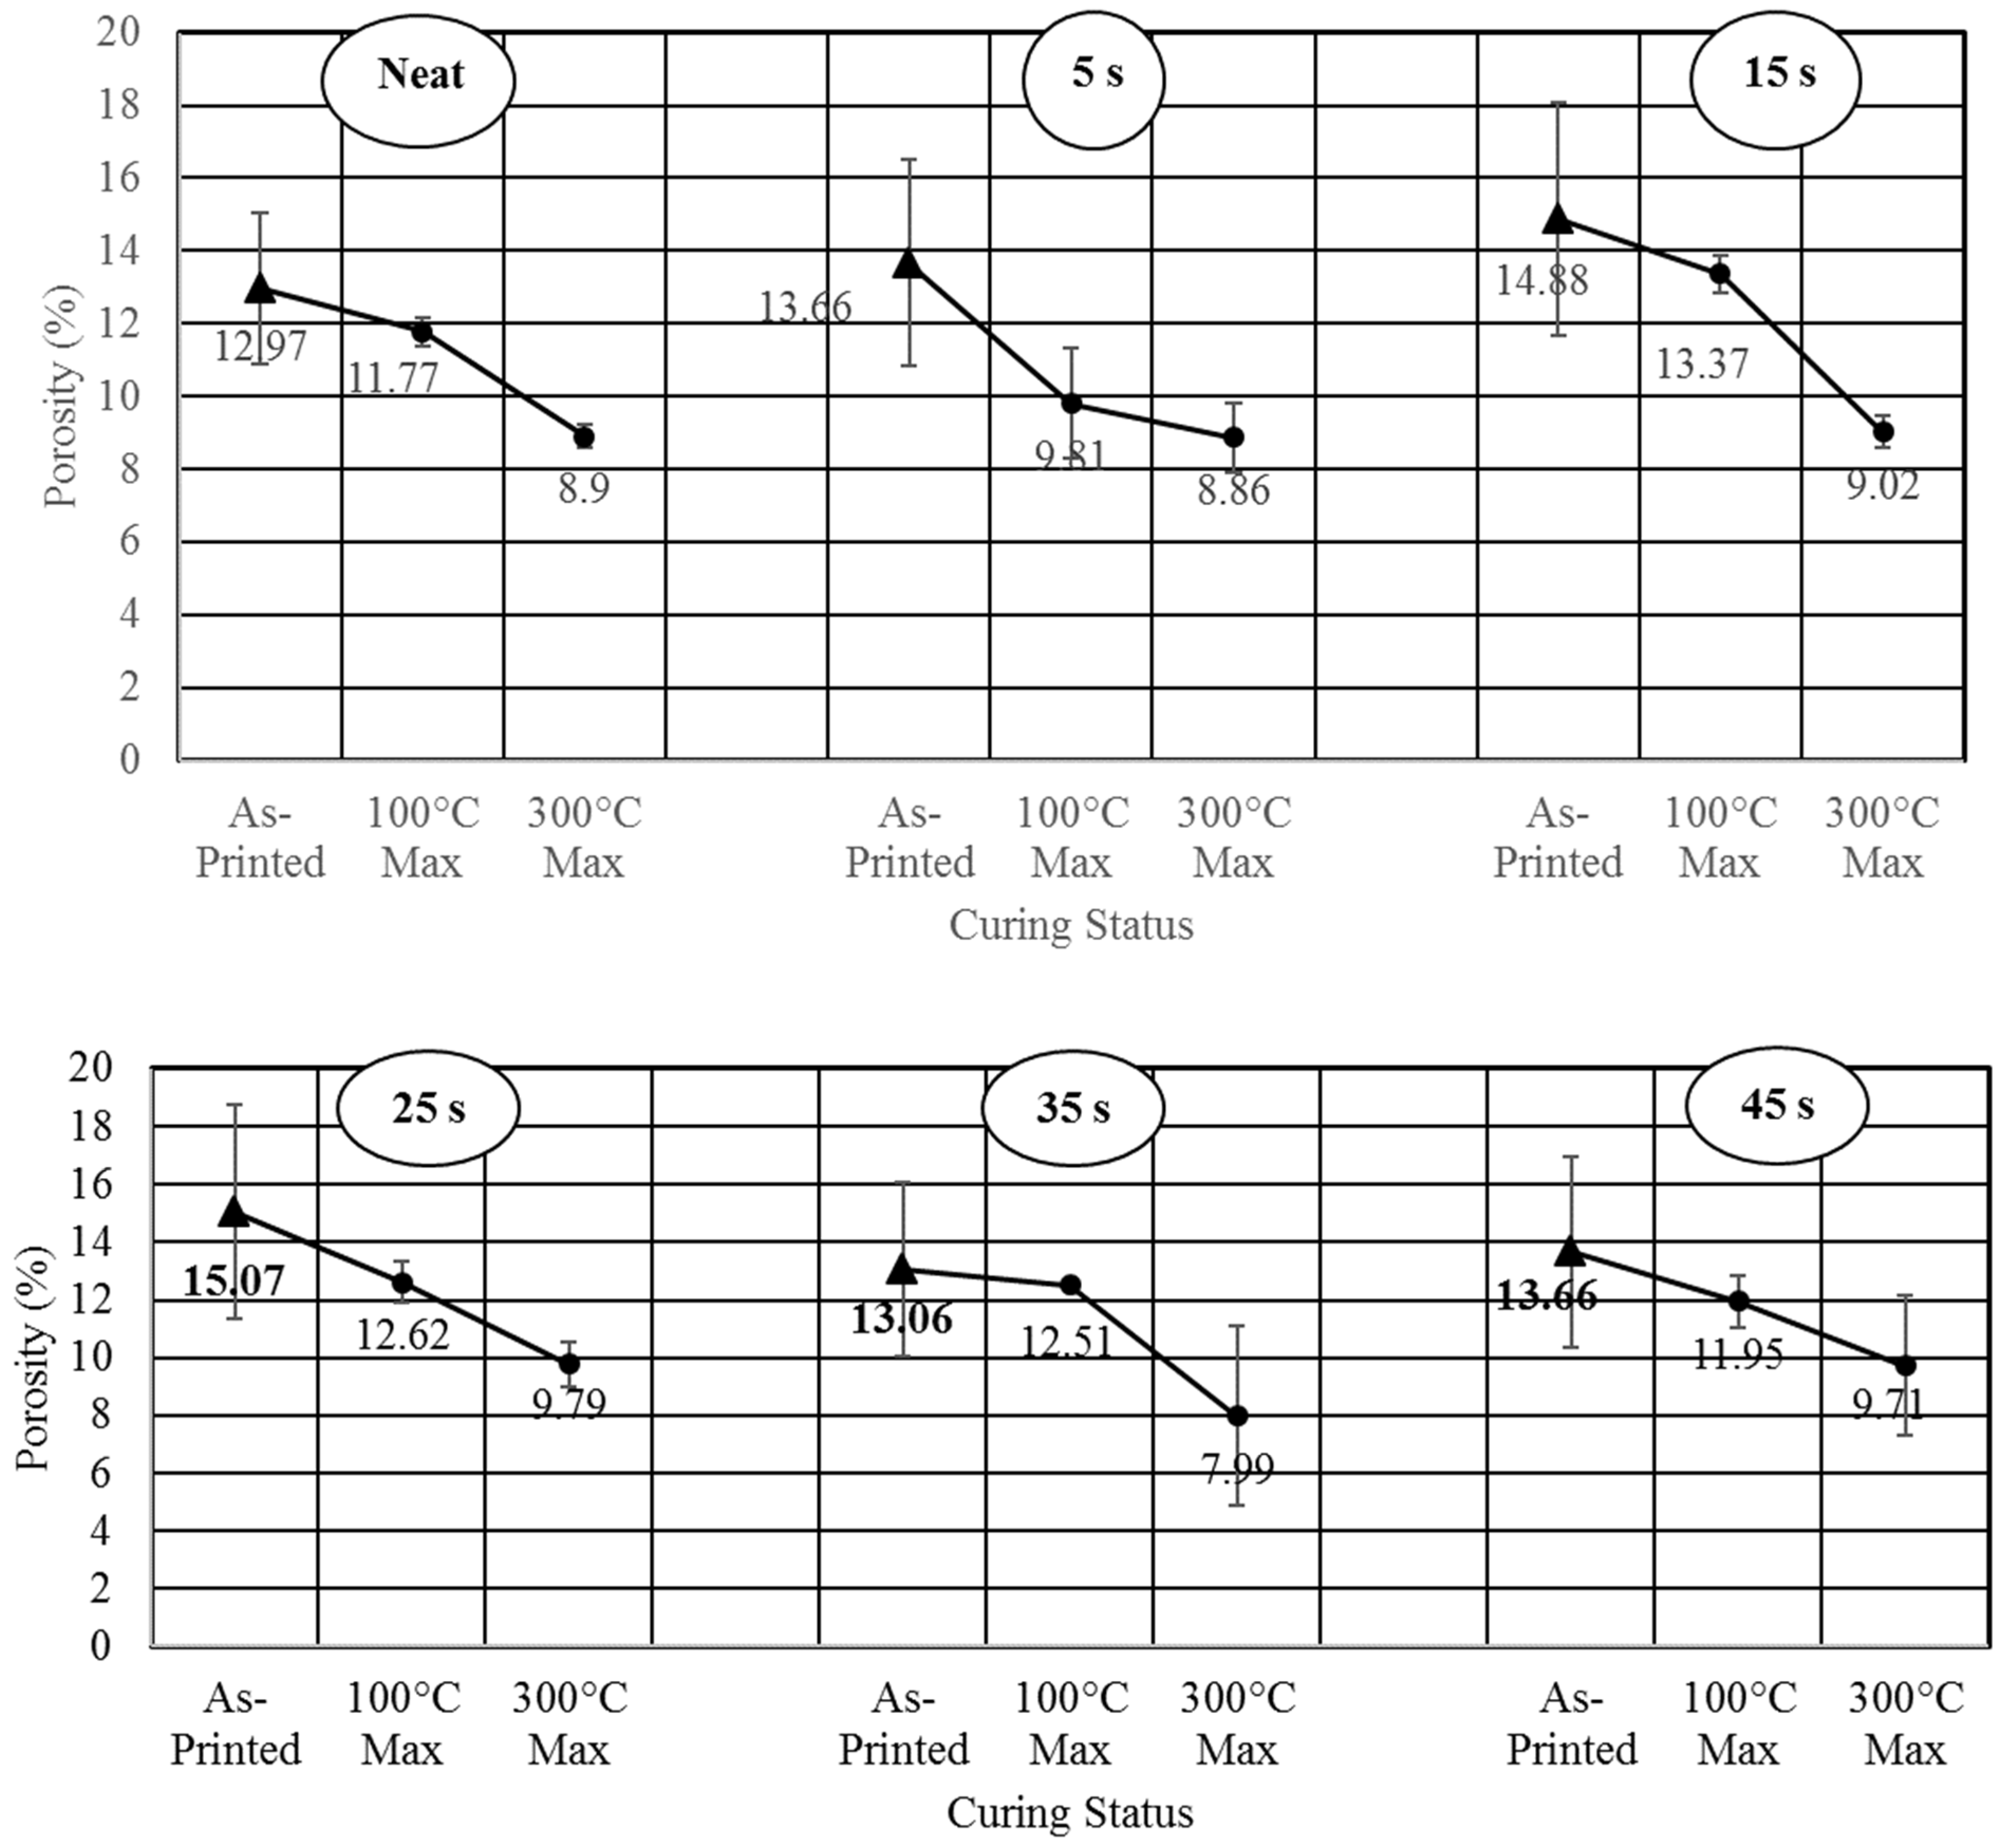
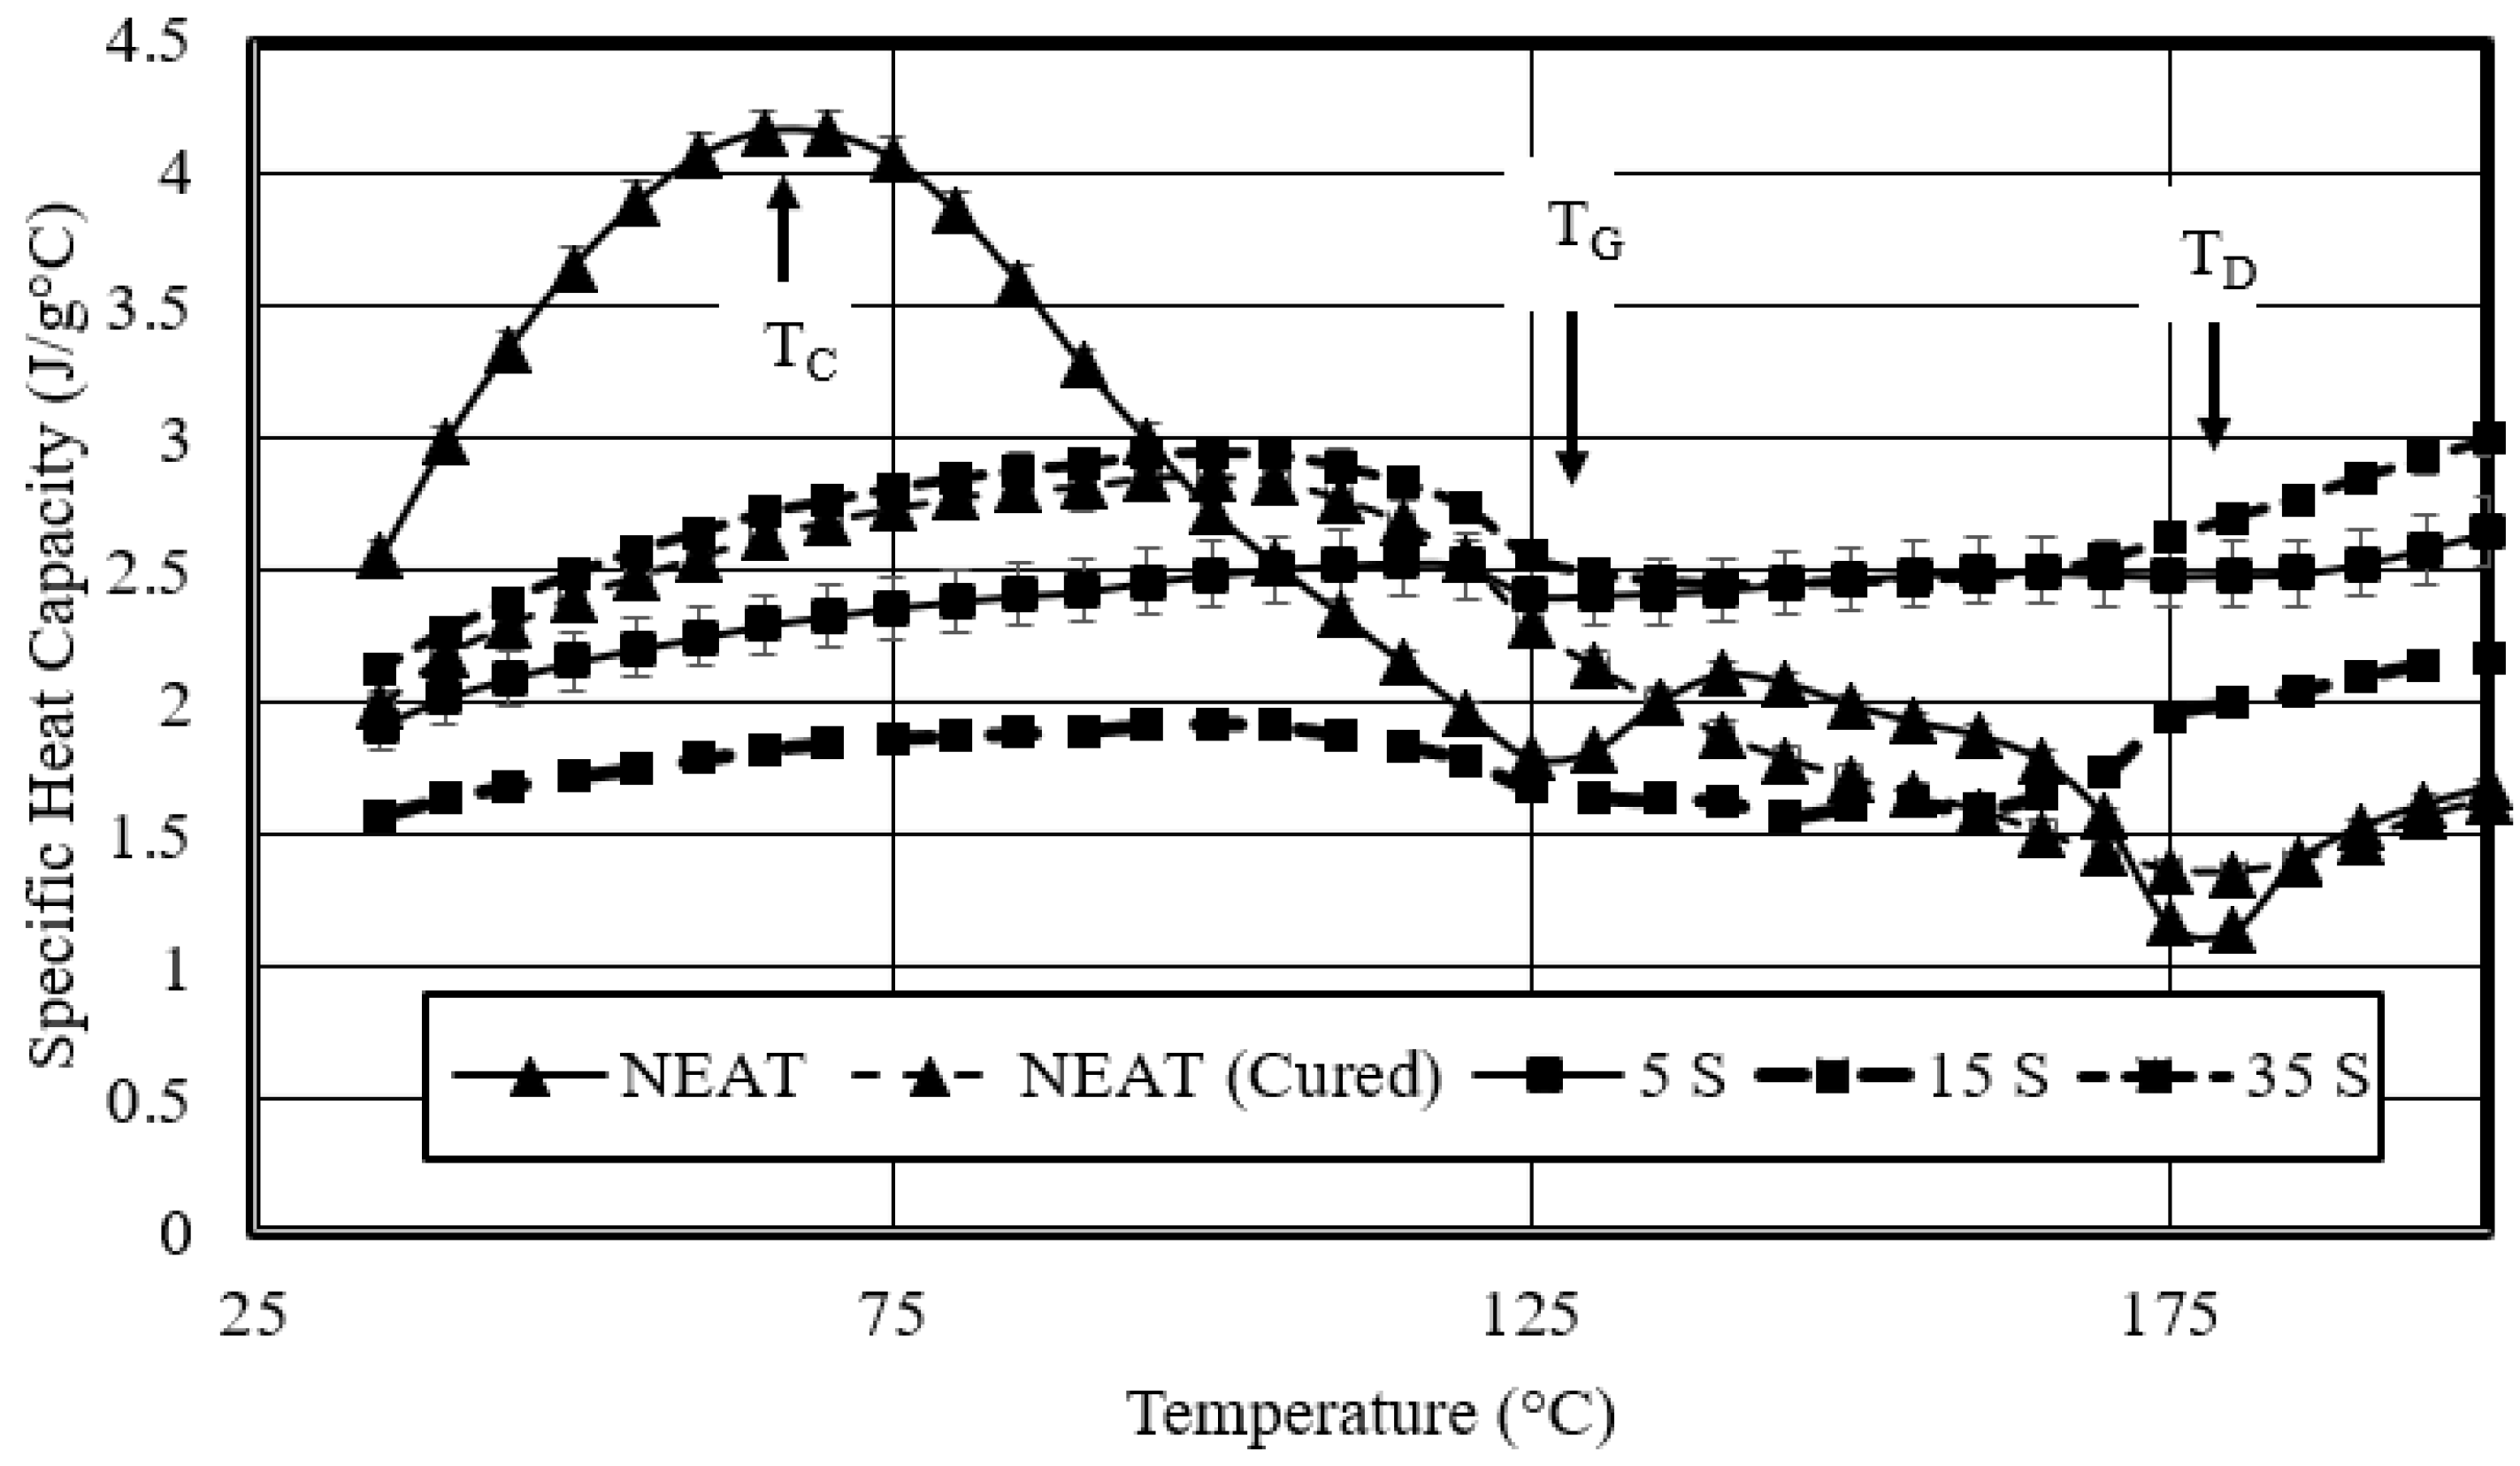
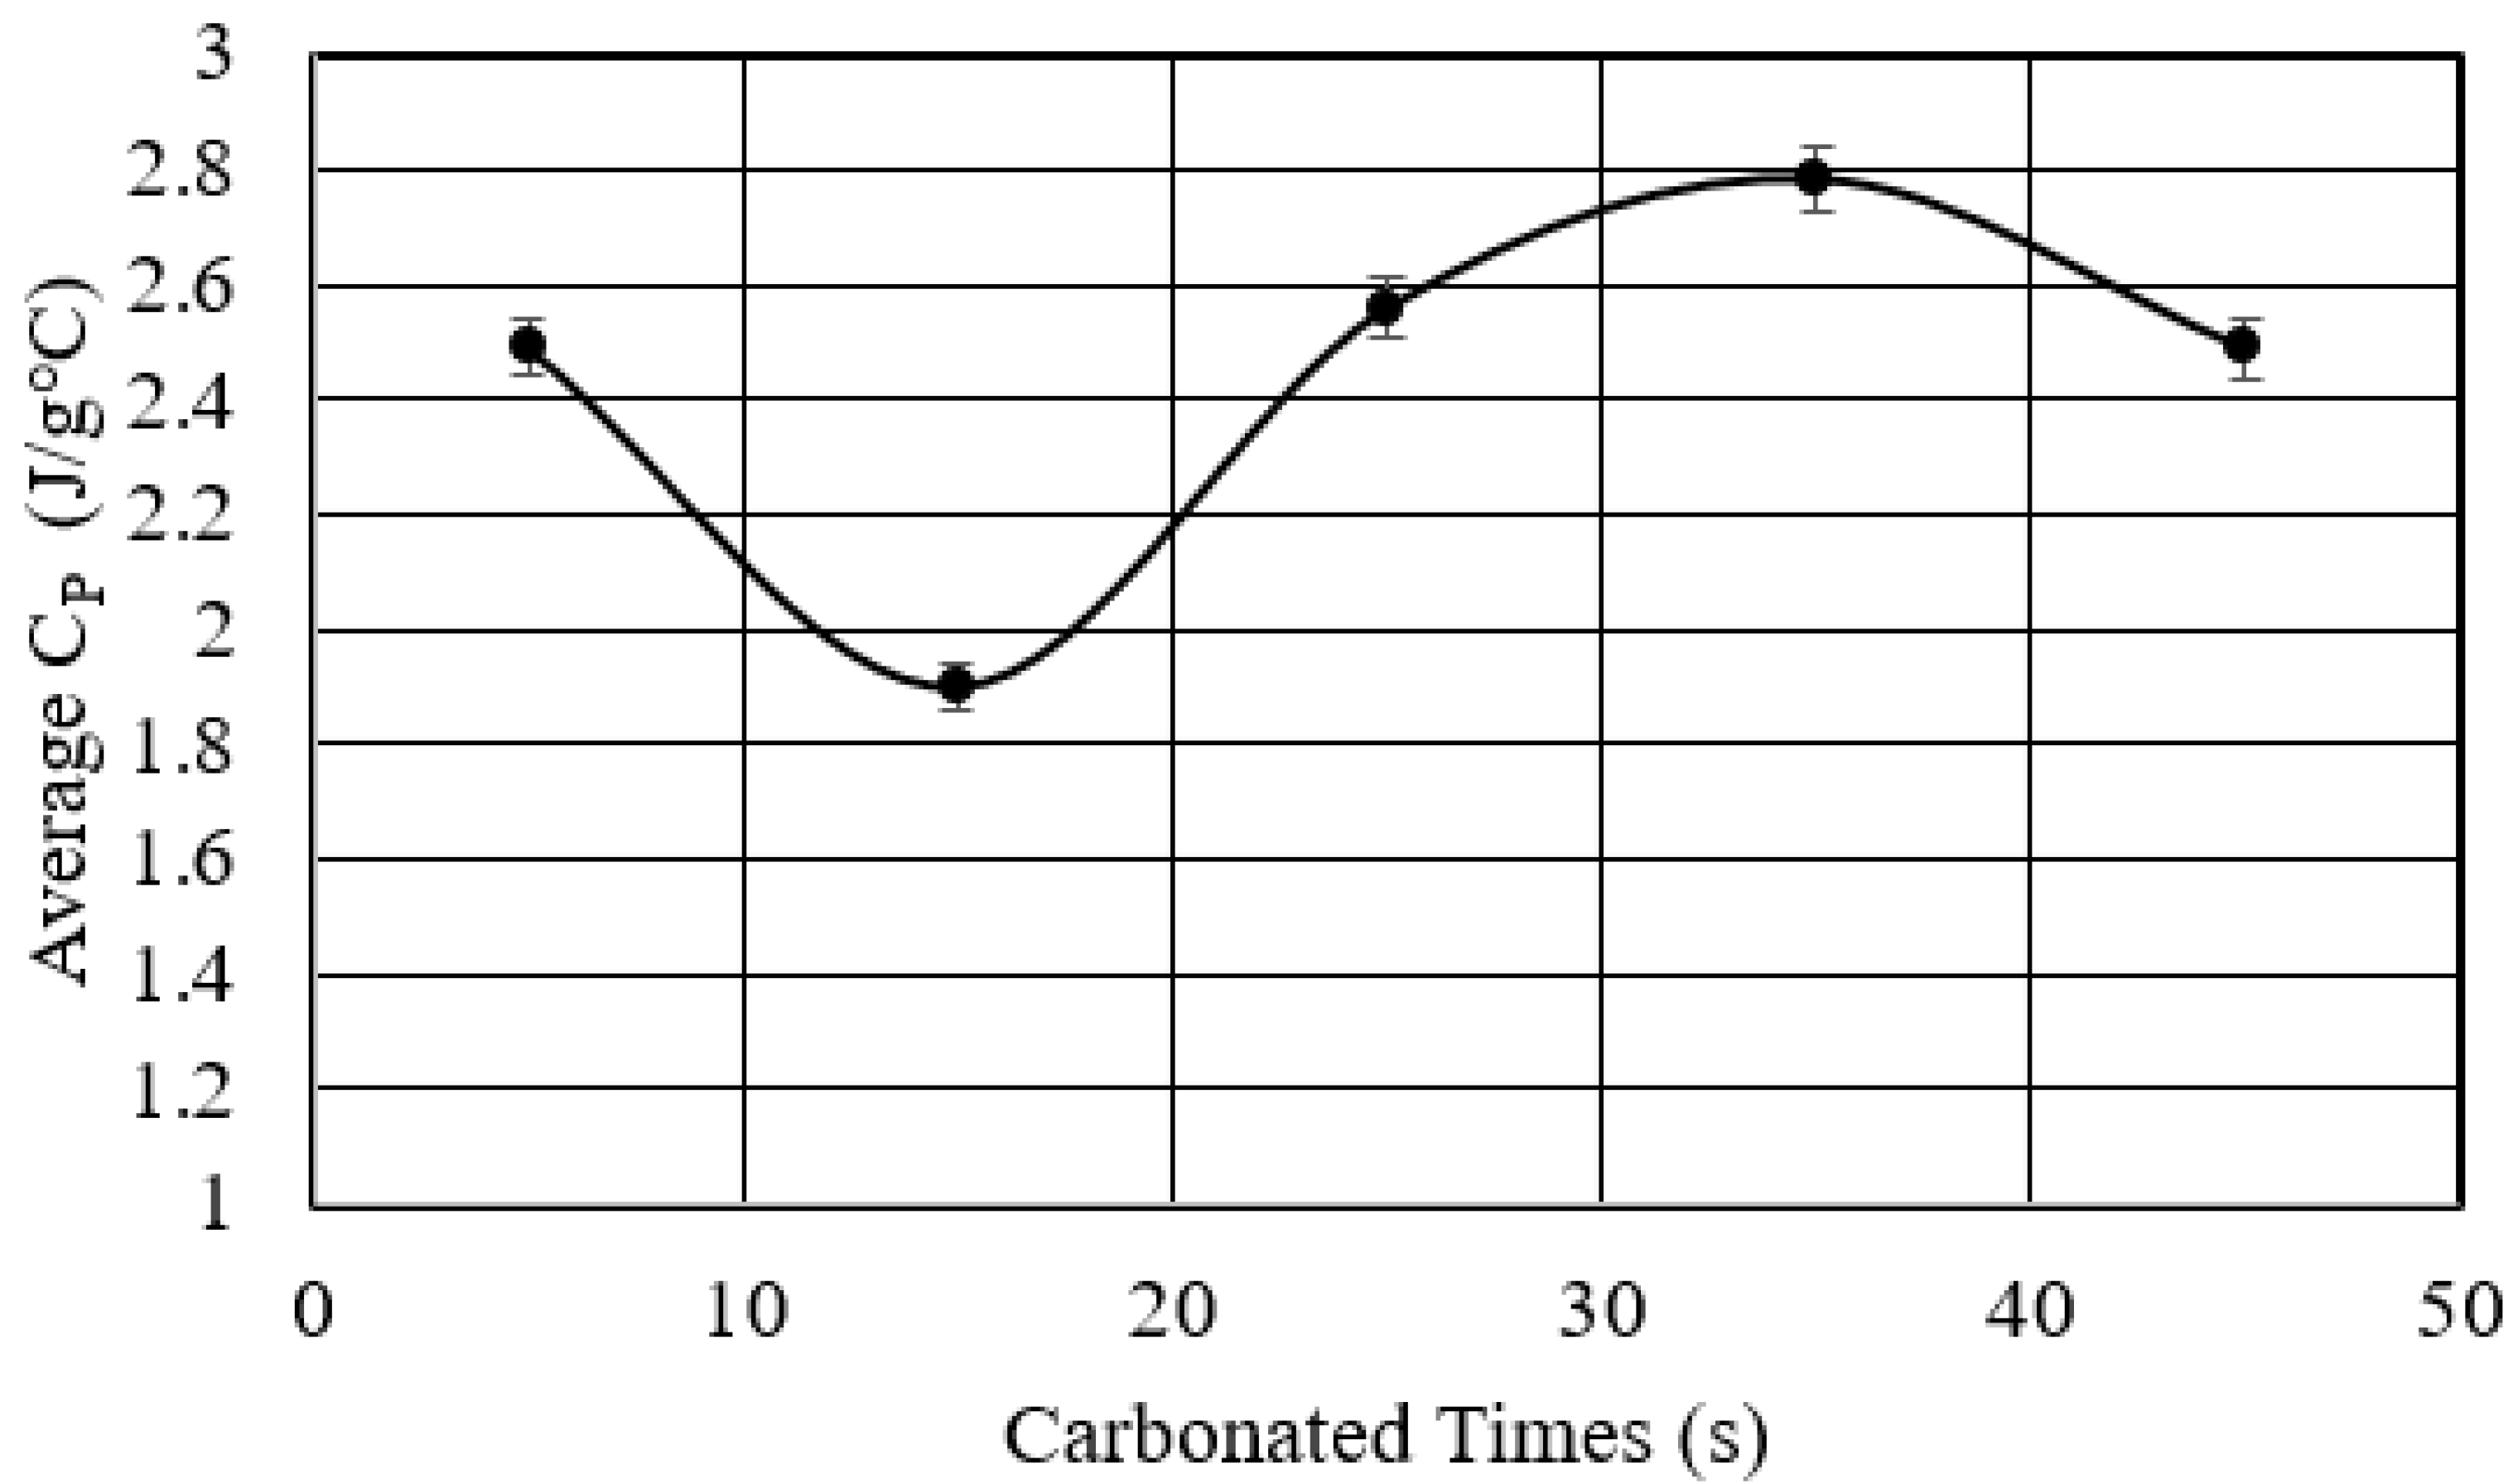
  • Studied the effects of carbonation duration on polymer porosity and thermal profile behavior—an initial increase in polymer carbonation duration showed a 16% increase in porosity, more stable thermal profiles, and a 40% decrease in specific heat capacity.
  • Studied the response of the carbonated polymer to thermo-mechanical compressive tests—an optimum carbonated sample revealed a 70% increase in compressive strength over its neat counterpart. The temperature modulus-dependent behavior of the carbonated sample showed a peak modulus maximum at 50 °C of 60 MPa, after which it decreased exponentially with increased temperature.
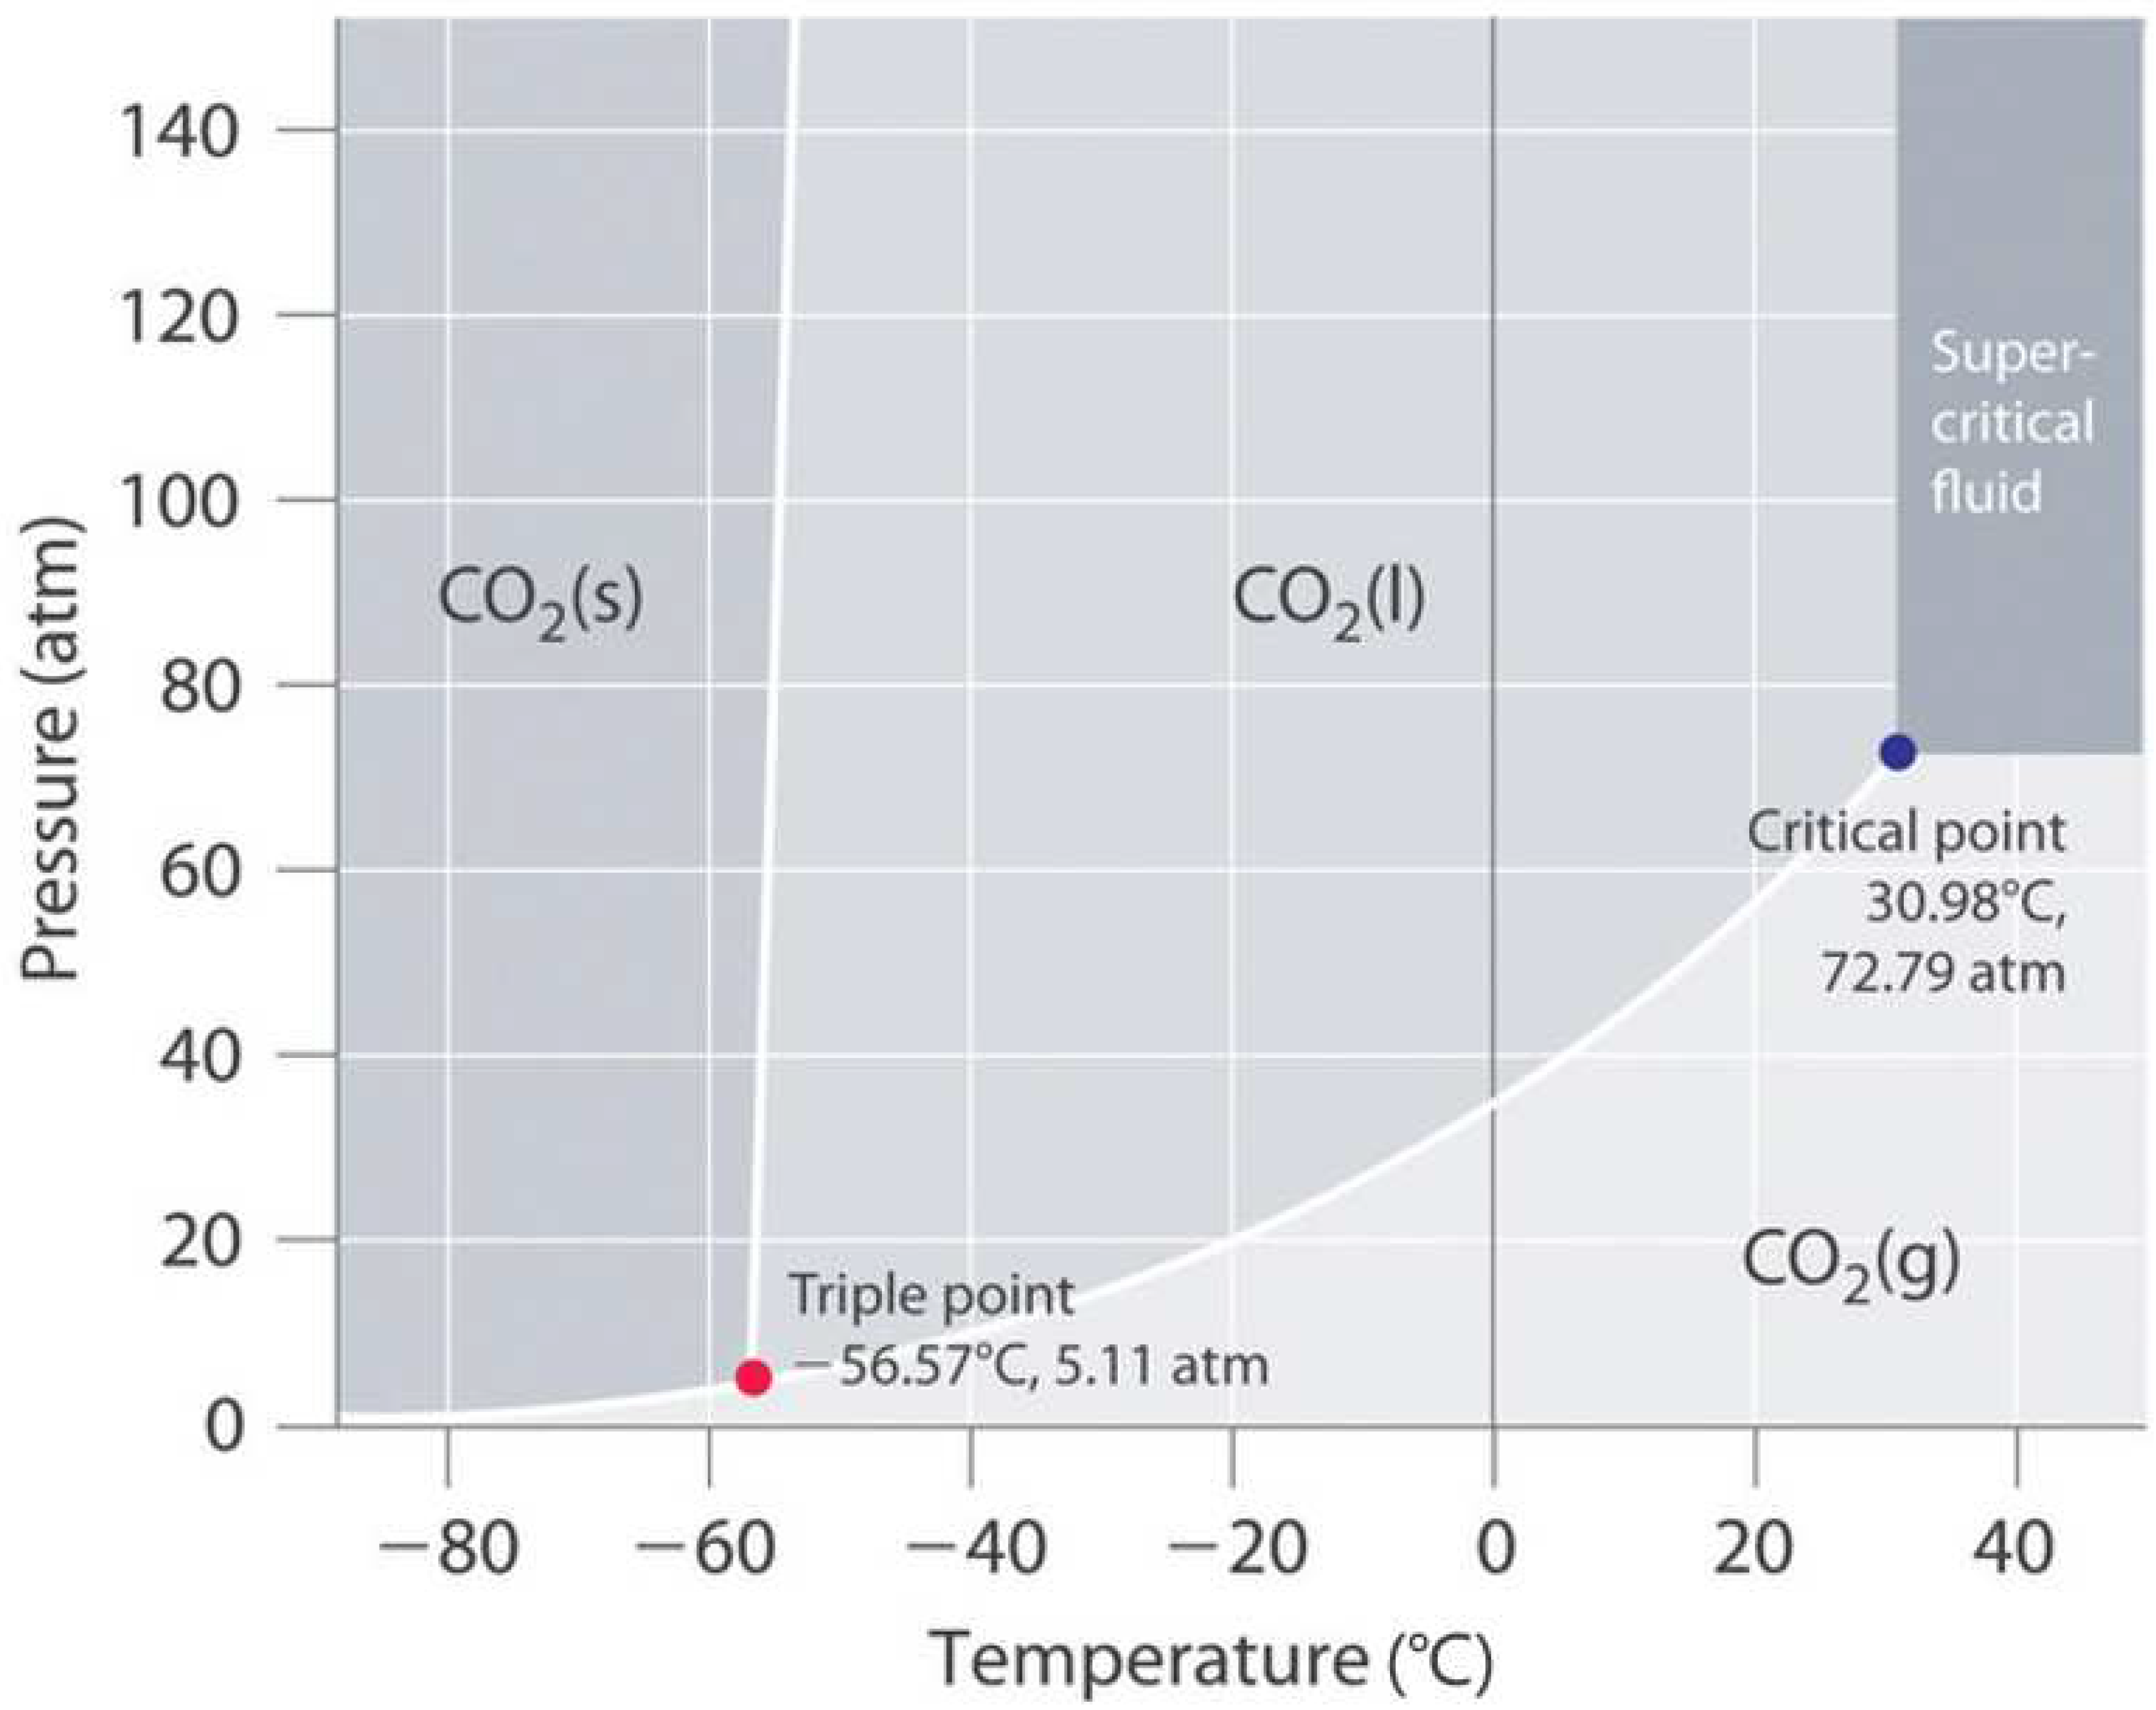
  • Considered the application of the carbonated polymer composite given the results found—potential utility of the printed carbonated composite as a personal, portable, and on-demand CO2 phase transformation storage medium. The critical point to transform the gas into a supercritical fluid occurs at a minimum temperature and pressure of 30.98 °C and 72.79 atm (7.38 MPa), respectively. The thermo-mechanical results of this study determined that the manufactured composite is thermally and mechanically suitable for this application.
Future studies will further explore the following: carbonation duration on the effect of pattern resolution and the application of this material, in addition to determining the volume fraction of microbubbles as it relates to carbonation duration, the compressive strength of carbonated polymer composites processed at the glass transition temperature, and an automated carbonation unit. Since most of the processing was performed manually, an automated unit can lead to more carbonation weight fraction control, reduced processing errors, and more optimized results.

Author Contributions

Conceptualization, F.D.; methodology, F.D., M.G and L.W.; software, F.D. and M.G.; validation, F.D. and M.G.; formal analysis, F.D. and M.G.; investigation, F.D., M.G. and L.W.; resources, P.M.; data curation, F.D. and M.G.; writing—original draft preparation, F.D.; writing—review and editing, F.D.; visualization, F.D.; supervision, F.D.; project administration, F.D. and P.M.; funding acquisition, P.M. All authors have read and agreed to the published version of the manuscript.

Funding

This research and the APC was funded by US National Science Foundation CREST Award HRD grant number 1736136.

Institutional Review Board Statement

Not applicable.

Informed Consent Statement

Not applicable.

Data Availability Statement

The data presented in this study are available on request from the corresponding author. The data are not publicly available due to legal and privacy issues.

Acknowledgments

The authors would like to thank Nicole Nash, Henry Steele, and Sanjay Kodiyalam for their laboratory assistance. This work was supported by the US National Science Foundation CREST Award HRD 1736136.

Conflicts of Interest

The authors declare no conflict of interest.

References

  1. Tjong, S.C. Structural and mechanical properties of polymer nanocomposites. Mater. Sci. Eng. R Rep. 2006, 53, 73–197. [Google Scholar] [CrossRef]
  2. Burela, R.G.; Kamineni, J.N.; Harursampath, D. 3D and 4D Printing of Polymer Nanocomposite Materials; Elsevier: Amsterdam, The Netherlands, 2020. [Google Scholar]
  3. Dawan, F.; Jin, Y.; Goettert, J.; Ibekwe, S. High functionality of a polymer nanocomposite material for MEMS applications. Microsyst. Technol. 2008, 14, 1451–1459. [Google Scholar] [CrossRef]
  4. DeArmitt, C.; Rothon, R. Particulate Fillers, Selection, and Use in Polymer Composites. Polymers and Polymeric Composites: A Reference Series. In Encyclopedia of Polymers and Composites; Springer Nature Switzerland AG: Basel, Switzerland, 2016. [Google Scholar]
  5. Xu, Z.; Chen, Y.; Chen, X.; Zhang, J.; Huang, S.; Chen, A.; Fu, X.; Wu, F.; Zhang, P. Enhanced thermal conductivity and electrically insulating of polymer composites. J. Mater. Sci. 2021, 56, 4225–4238. [Google Scholar] [CrossRef]
  6. Mooti, A.; Costa, C.; Maceiras, A.; Pereira, N.; Tubio, C.; Vilas, J.; Besbes-Hentati, S.; Lanceros-Mendez, S. Magnetic and high-dielectric-constant nanoparticle polymer tri-composites for sensor applications. J. Mater. Sci. 2020, 55, 16234–16246. [Google Scholar] [CrossRef]
  7. Mehdikhani, M.; Gorbatikh, L.; Verpoest, I.; Lomov, S.V. Voids in fiber-reinforced polymer composites: A review on their formation, characteristics, and effects on mechanical performance. J. Compos. Mater. 2018, 53, 1579–1669. [Google Scholar] [CrossRef]
  8. Biner, S. The role of interfaces and matrix void nucleation mechanism on the ductile fracture process of discontinuous fibre-reinforced composites. J. Mater. Sci. 1994, 29, 2893–2902. [Google Scholar] [CrossRef]
  9. Jezzard, P.; Wiggins, C.J.; Carpenter, T.A.; Hall, L.D.; Barnes, J.A.; Jackson, P.; Clayden, N.J. Demonstration of nuclear magnetic resonance imaging for void detection in carbon-fibre reinforced polymer composites, and comparison with ultrasound methods. J. Mater. Sci. 1992, 27, 6365–6370. [Google Scholar] [CrossRef]
  10. Levi, G.; Kaplan, W. The influence of interfacial wetting and adhesion on the formation of voids at metal-ceramic interfaces. J. Mater. Sci. 2006, 41, 817–821. [Google Scholar] [CrossRef]
  11. Li, Y.; Li, Q.; Ma, H. The voids formation mechanisms and their effects on the mechanical properties of flax fiber reinforced epoxy composites. Compos. Part A Appl. Sci. Manuf. 2015, 72, 40–48. [Google Scholar] [CrossRef]
  12. Liebig, W.; Viets, C.; Schulte, K.; Fiedler, B. Influence of voids on the compressive failure behaviour of fibre-reinforced composites. Compos. Sci. Technol. 2015, 117, 225–233. [Google Scholar] [CrossRef]
  13. DeValve, C.; Pitchumani, R. Simulation of void formation in liquid composite molding processes. Compos. Part A Appl. Sci. Manuf. 2013, 51, 22–32. [Google Scholar] [CrossRef]
  14. Afendi, M.; Banks, W.M.; Kirkwood, D. Bubble free resin for infusion process. Compos. Part A Appl. Sci. Manuf. 2013, 36, 739–746. [Google Scholar] [CrossRef]
  15. Al-Ghussain, L. Global Warming: Review on Driving Forces and Mitigation. Environ. Prog. Sustain. Energy 2019, 38, 13–21. [Google Scholar] [CrossRef] [Green Version]
  16. GLOBAL CLIMATE CHANGE Vital Signs of the Planet. Available online: https://climate.nasa.gov (accessed on 15 March 2022).
  17. Topham, S.; Bazzanella, A.; Schiebahn, S.; Luhr, S.; Zhao, L.; Otto, A.; Dioxide, D.S.C. Ullmann’s Encyclopedia of Industrial Chemistry; Wiley-VCH GmbH & Co. KgaA: Weinheim, Germany, 2014; pp. 1–43. [Google Scholar]
  18. Cooper, A.I. Porous Materials and Supercritical Fluids. Adv. Mater. 2003, 15, 1049–4059. [Google Scholar] [CrossRef]
  19. Song, B.; Qin, A.; Tang, B.Z. Syntheses, properties, and applications of CO2-based functional polymers. Cell Rep. Phys. Sci. 2022, 3, 100719. [Google Scholar] [CrossRef]
  20. Kim, J.; Kitagaki, R.; Choi, H. Pore Filling Effect of Forced Carbonation Reactions Using Carbon Dioxide Nanobubbles. Materials 2020, 13, 4343. [Google Scholar] [CrossRef]
  21. Puttonen, T.; Salmi, M.; Partanen, J. Mechanical properties and fracture characterization of additive manufacturing polyamide 12 after accelerated weathering. Polym. Test. 2021, 104, 107376. [Google Scholar] [CrossRef]
  22. Samsudin, S.S.; Ariff, Z.; Zakaria, Z.; Bakar, A. Development and characterization of epoxy syntactic foam filled with epoxy hollow spheres. Express Polym. Lett. 2011, 5, 653–660. [Google Scholar] [CrossRef]
  23. Zimmerman, D.L.; Jones, R.W. SEM Analysis of Polymeric Mechanical Failures in Polyetherimide. Int. J. Polym. Mater. Polym. Biomater. 1994, 23, 151–165. [Google Scholar] [CrossRef]
  24. Khosravani, M.R.; Berto, F.; Ayatollahi, M.R.; Reinicke, T. Fracture behavior of additively manufactured components: A review. Theor. Appl. Fract. Mech. 2020, 109, 102763. [Google Scholar] [CrossRef]
  25. Haugen, H.; Bertold, S.I. Characterization of morphology—3D porous structure. Charact. Polym. Biomater. 2017, 21–53. [Google Scholar]
  26. Wolok, E.; Pakaya, F. Experimental Investigation of Epoxy/Poly (amino amide)/Phthalic Anhydride: Mechanical Properties and Thermal Stability. Int. J. Adv. Sci. Technol. 2020, 29, 1011–1021. [Google Scholar] [CrossRef]
  27. ASTM D4892; Standard Test Method for Density of Solid Pitch (Helium Pycnometer Method). American Society for Testing and Materials: West Conshohocken, PA, USA, 2019.
  28. E1269–11; Standard Test Method for Determining Specific Heat Capacity by Differential Scanning Calorimetry. American Standards for Testing Materials: West Conshohocken, PA, USA, 2011.
  29. Richardson, M. Thermal Analysis of Polymers using Quantitative Differential Scanning Calorimetry. Polym. Test. 1984, 4, 101–115. [Google Scholar] [CrossRef]
  30. Bilyeu, B.; Brostow, W.; Menard, K.P. Epoxy Thermosets and Their Applications. II. Thermal Analysis. J. Mater. Educ. 2000, 22, 107–129. [Google Scholar]
Figure 1. Pressure—temperature phase diagram for CO2.
Jmmp 06 00066 g001
Figure 2. (a) Illustration of lab-made carbonation setup, (b) Image of a 3D-printed carbonated polymer coupon, and (c) Image of some printed samples for testing.
Jmmp 06 00066 g002
Figure 3. Optical microscopy of oxygenated and carbonated polymer samples at increasing mixing durations.
Jmmp 06 00066 g003
Figure 4. Scanning electron microscopic image of a cross-sectional view of a carbonated 3D-printed polymer sample.
Jmmp 06 00066 g004
Figure 5. Effect of carbonation duration and post-UV exposure time on polymer weight.
Jmmp 06 00066 g005
Figure 6. Thermogravimetric analysis of the neat polymer as-printed.
Jmmp 06 00066 g006
Figure 7. Carbonation duration (circled value) and curing (post-heat treatment) effects on polymer porosity. The error bars are plotted for each point.
Jmmp 06 00066 g007
Figure 8. Illustration showing void formation due to carbonation, pycnometer He gas displacement, and void collapse due to post-heat treatment.
Jmmp 06 00066 g008
Figure 9. Thermal curing profiles via differential scanning calorimetry (DSC) of as-printed and cured versus carbonated samples.
Jmmp 06 00066 g009
Figure 10. Linear fit approximations of the thermal curing profiles. The lower slope of the carbonated samples indicates increased thermal stability over a wide temperature range, whereas the higher slope (as-printed and neat cured) indicates decreased thermal stability.
Jmmp 06 00066 g010
Figure 11. Specific heat capacity (CP) of as-printed, neat-cured, and carbonated samples. Error bars of ±2%.
Jmmp 06 00066 g011
Figure 12. Average specific heat capacity values for carbonated samples. Error bars of ±2%.
Jmmp 06 00066 g012
Figure 13. Stress–strain curves of 3D-printed carbonated polymer composite and 3D-printed neat polymer. Inset shows average E’ for neat and carbonated samples.
Jmmp 06 00066 g013
Figure 14. E’ varying as a function of temperature for a 15 s carbonated sample.
Jmmp 06 00066 g014
Table 1. Process parameters for test samples.
ProcessThickness (µm)UV Dose/Time
Carbonation duration-0 to 45 s
Printed base layer20086 mJcm−2
Printed sub-layers503.8 mJcm−2
IPA Rinse-2 min spray
Air dry and storage-5 min + 24 h dry dark storage
Publisher’s Note: MDPI stays neutral with regard to jurisdictional claims in published maps and institutional affiliations.

