
A Novel Apparatus for the Simulation of Powder Spreading Procedures in Powder-Bed-Based Additive Manufacturing Processes: Design, Calibration, and Case Study

Abstract
:1. Introduction

| Degree of the Process Representativity | Spreading Mechanism | Level of Motorization | Multi-Layer Possibility | Controlled Process Variables | Measured Metrics | In-Situ Measurement Possibility | Ref. |
|---|---|---|---|---|---|---|---|
| Low | Makeshift cardboard stencil | N/A | No | Layer thickness | Surface coverage | No (SEM) | [40] |
| Scraper or Funnel | N/A | No | Powder state (as-received, air-dried, vacuum-dried, moisturized) | Apparent density | No (volume estimation using a ruler) | [42] | |
| Scraper | N/A | No | Blade type/shape/material | Surface quality | No (LSM, XMT) | [41] | |
| Scraper | N/A | No | Powder state | Surface quality | No | [43] | |
| Moderate | Hopper + scraper | Motorized spreader | No | Spreading velocity Blade type/shape/material Layer thickness | Layer thickness Surface roughness Particle density | Yes (image sensor CIS) | [44] |
| Scraper | Motorized spreader | No | Spreading velocity Layer thickness | Coverage area | Yes (camera pointed at the test platform) | [45] | |
| Scraper | Motorized spreading platform (horizontal movements) | Yes (Manual) | Spreading velocity Layer thickness | Avalanche angle | Yes (camera aligned with the recoater blade) | [46] | |
| Scraper | Motorized spreader | No | Spreading velocity Scraper material Layer thickness | Avalanche angle Surface coverage Surface roughness | Yes (microscope, camera, laser profilometer) | [47] | |
| Scraper | Motorized spreader | Yes (Manual) | Layer thickness Spreading velocity Spreader type | Surface quality Packing density | Yes (analytical balance) | [48] | |
| Scraper (adjustable angle)—roller | Motorized spreader | Yes (spreading plate thickness) | Layer thickness Spreading velocity Spreader type | Layer uniformity | Yes (microscope) | [50] | |
| Scrapper | Motorized spreader | No | Spreading velocity Scrapper gap | Powder bed density | No (analytical balance) | [49] | |
| High | Motorized dispenser + Scraper Roller Hopper | Motorized spreader Motorized dispenser Motorized spreading platform | Yes (Motorized) | Number of spread layers Layers thickness Spreading velocity Type of scraper | Layer uniformity | Yes (camera and coaxial light setup) | [17] |
| Motorized dispenser + Scraper | Motorized spreader Motorized dispenser Motorized spreading platform | Yes (Motorized) | Number of spread layers Layers thickness Spreading velocity Distance between blade and building platform Angle of recoater blade | Surface coverage Surface roughness Surface flatness | No (digital microscope) | [51] | |
| Motorized dispenser + Scraper | Motorized spreader Motorized dispenser Motorized spreading platform | Yes (Motorized) | Spreading velocity Layer thickness | Surface roughness | Yes (camera and lightning setup) | [52] | |
| Motorized scraper | Motorized spreader Motorized spreading platform | No | Spreading velocity Layer thickness | Dynamic repose angleLayer uniformity | Yes (X-ray computed tomography) | [53] | |
| Motorized dispenser + Scraper | Motorized spreader Motorized dispenser Motorized spreading platform | Yes | Spreading velocity Layer thickness Type of scraper Number of spread layers | Layer uniformity | Yes (X-ray computed tomography) | [54] |
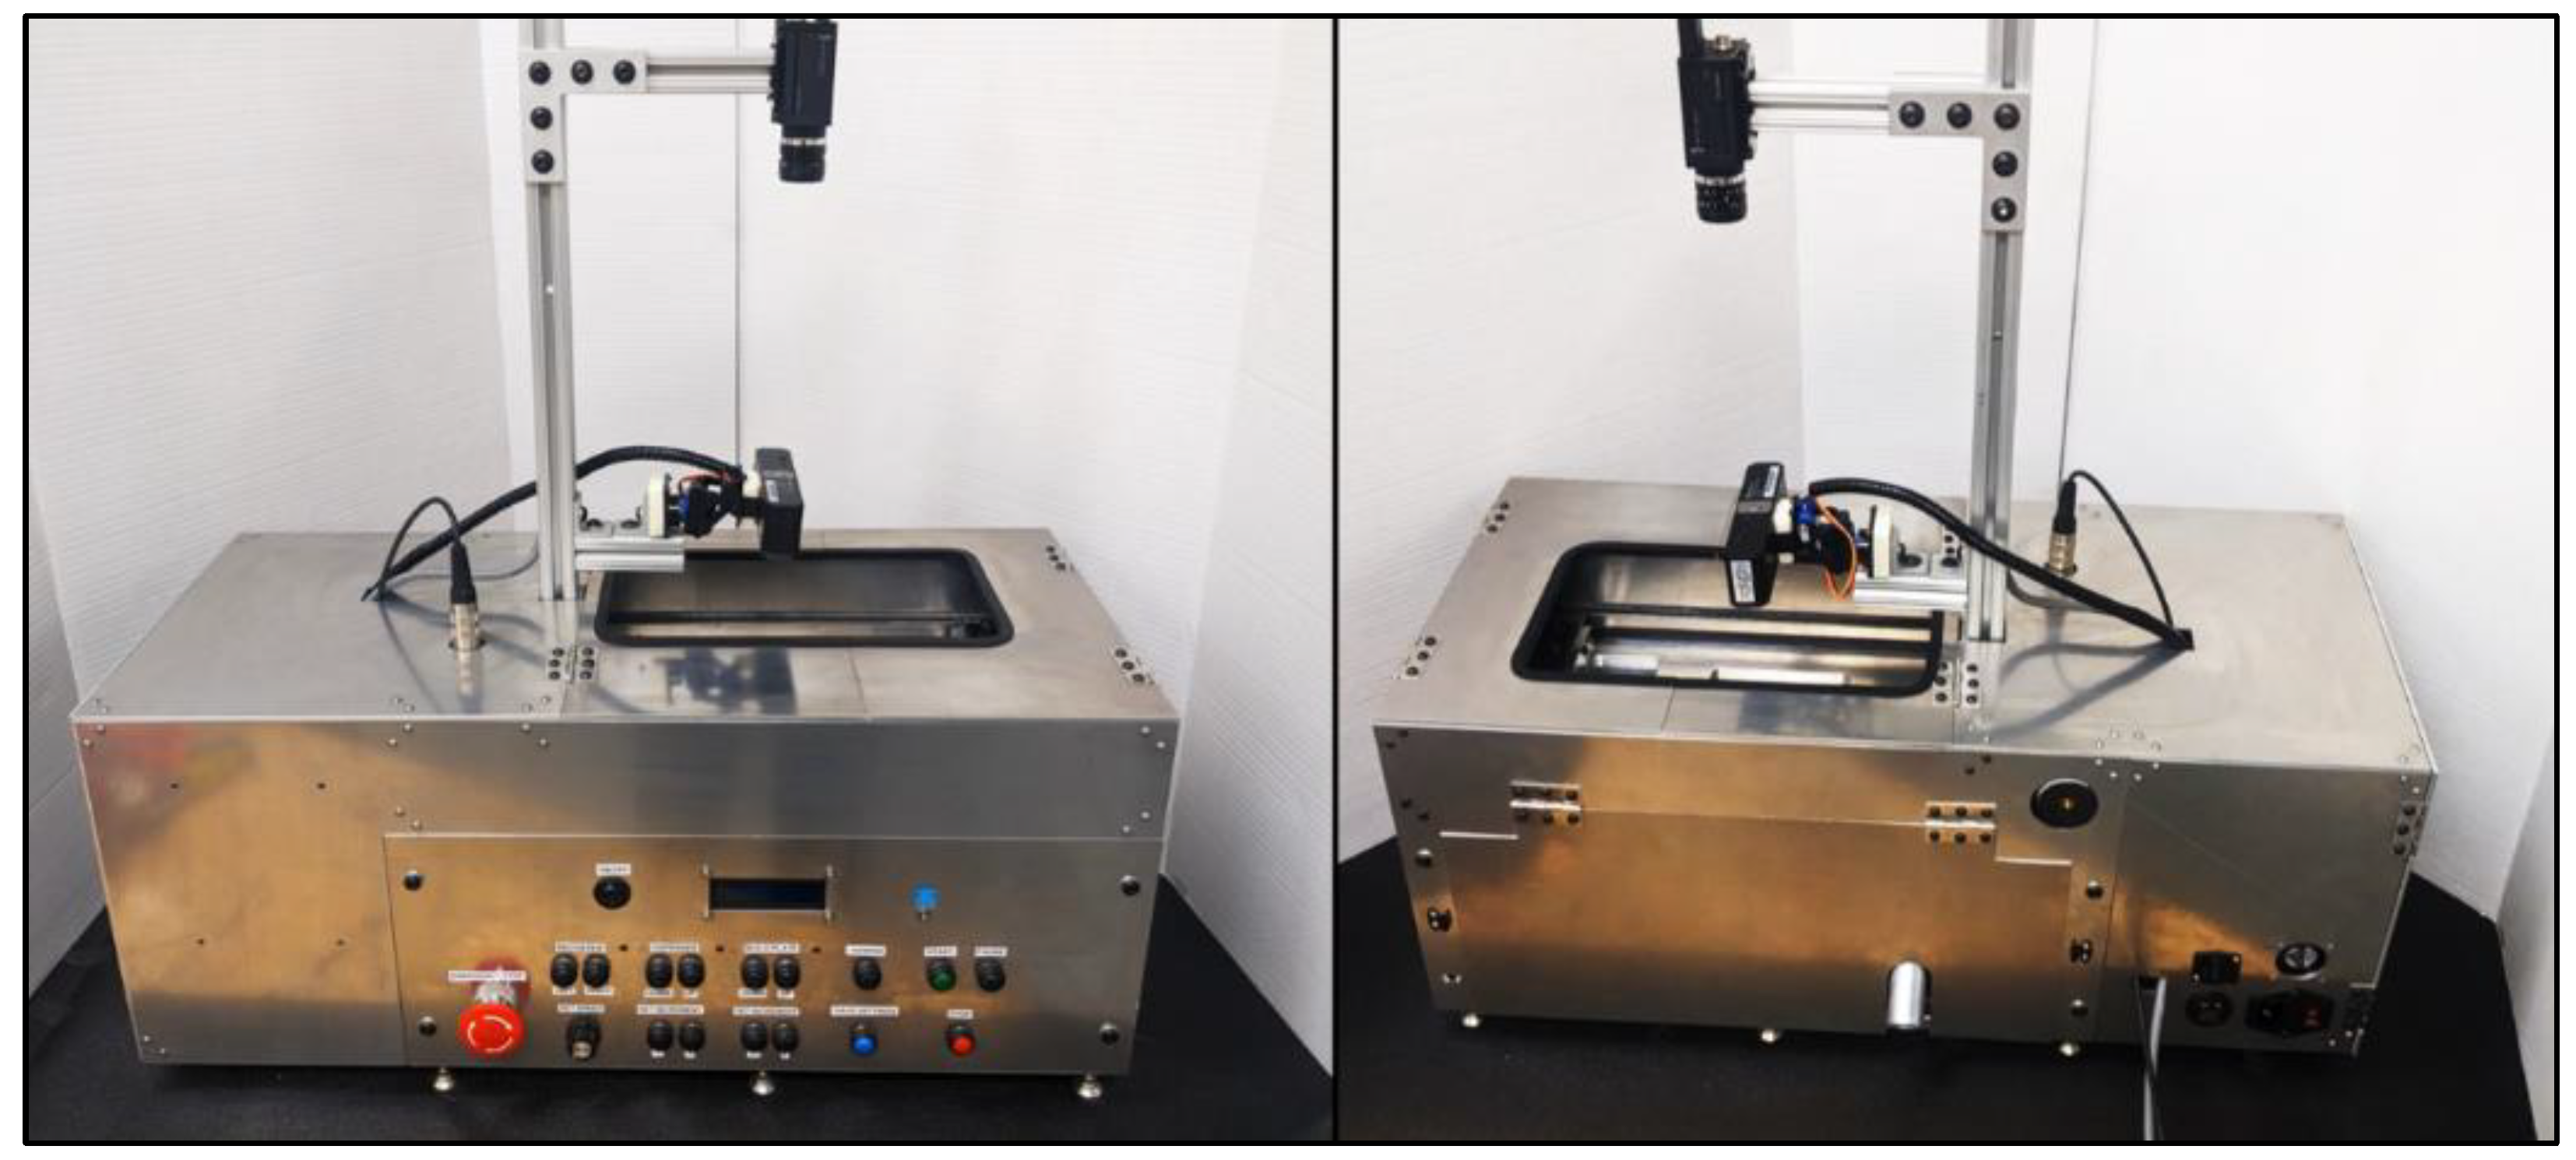
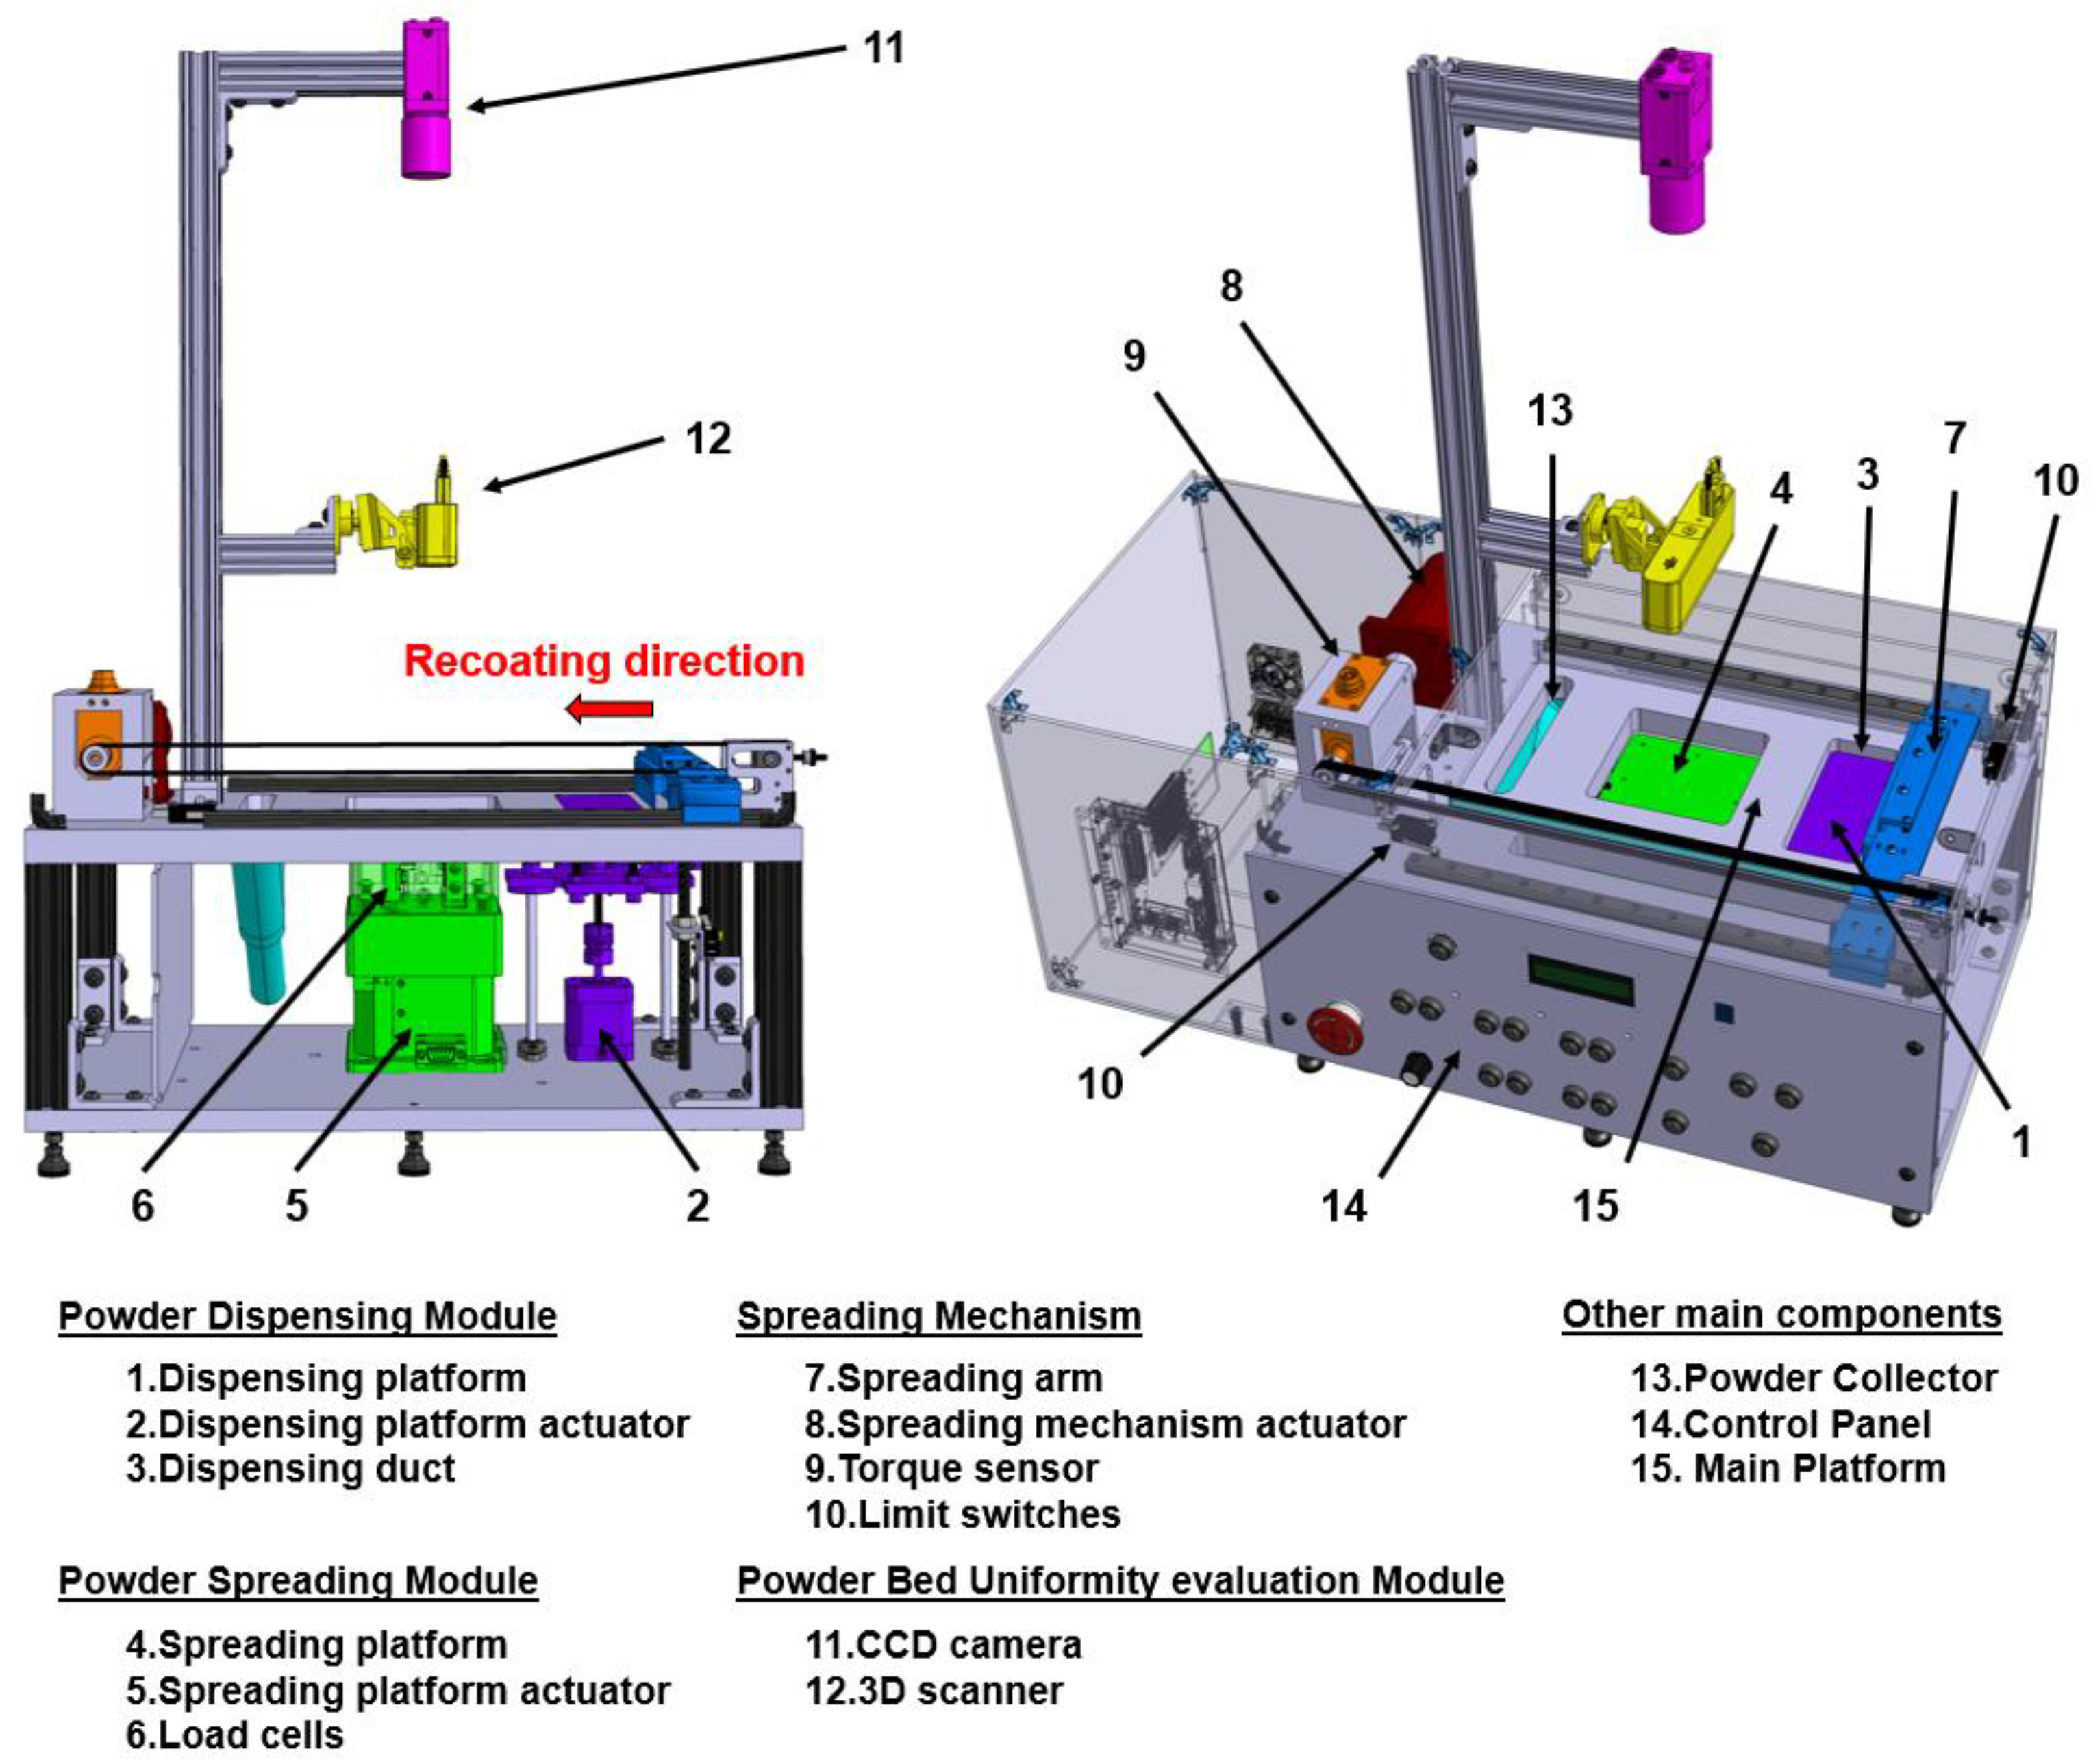
2. Design and Description of the Powder Spreading Apparatus
2.1. Powder Dispensing Module
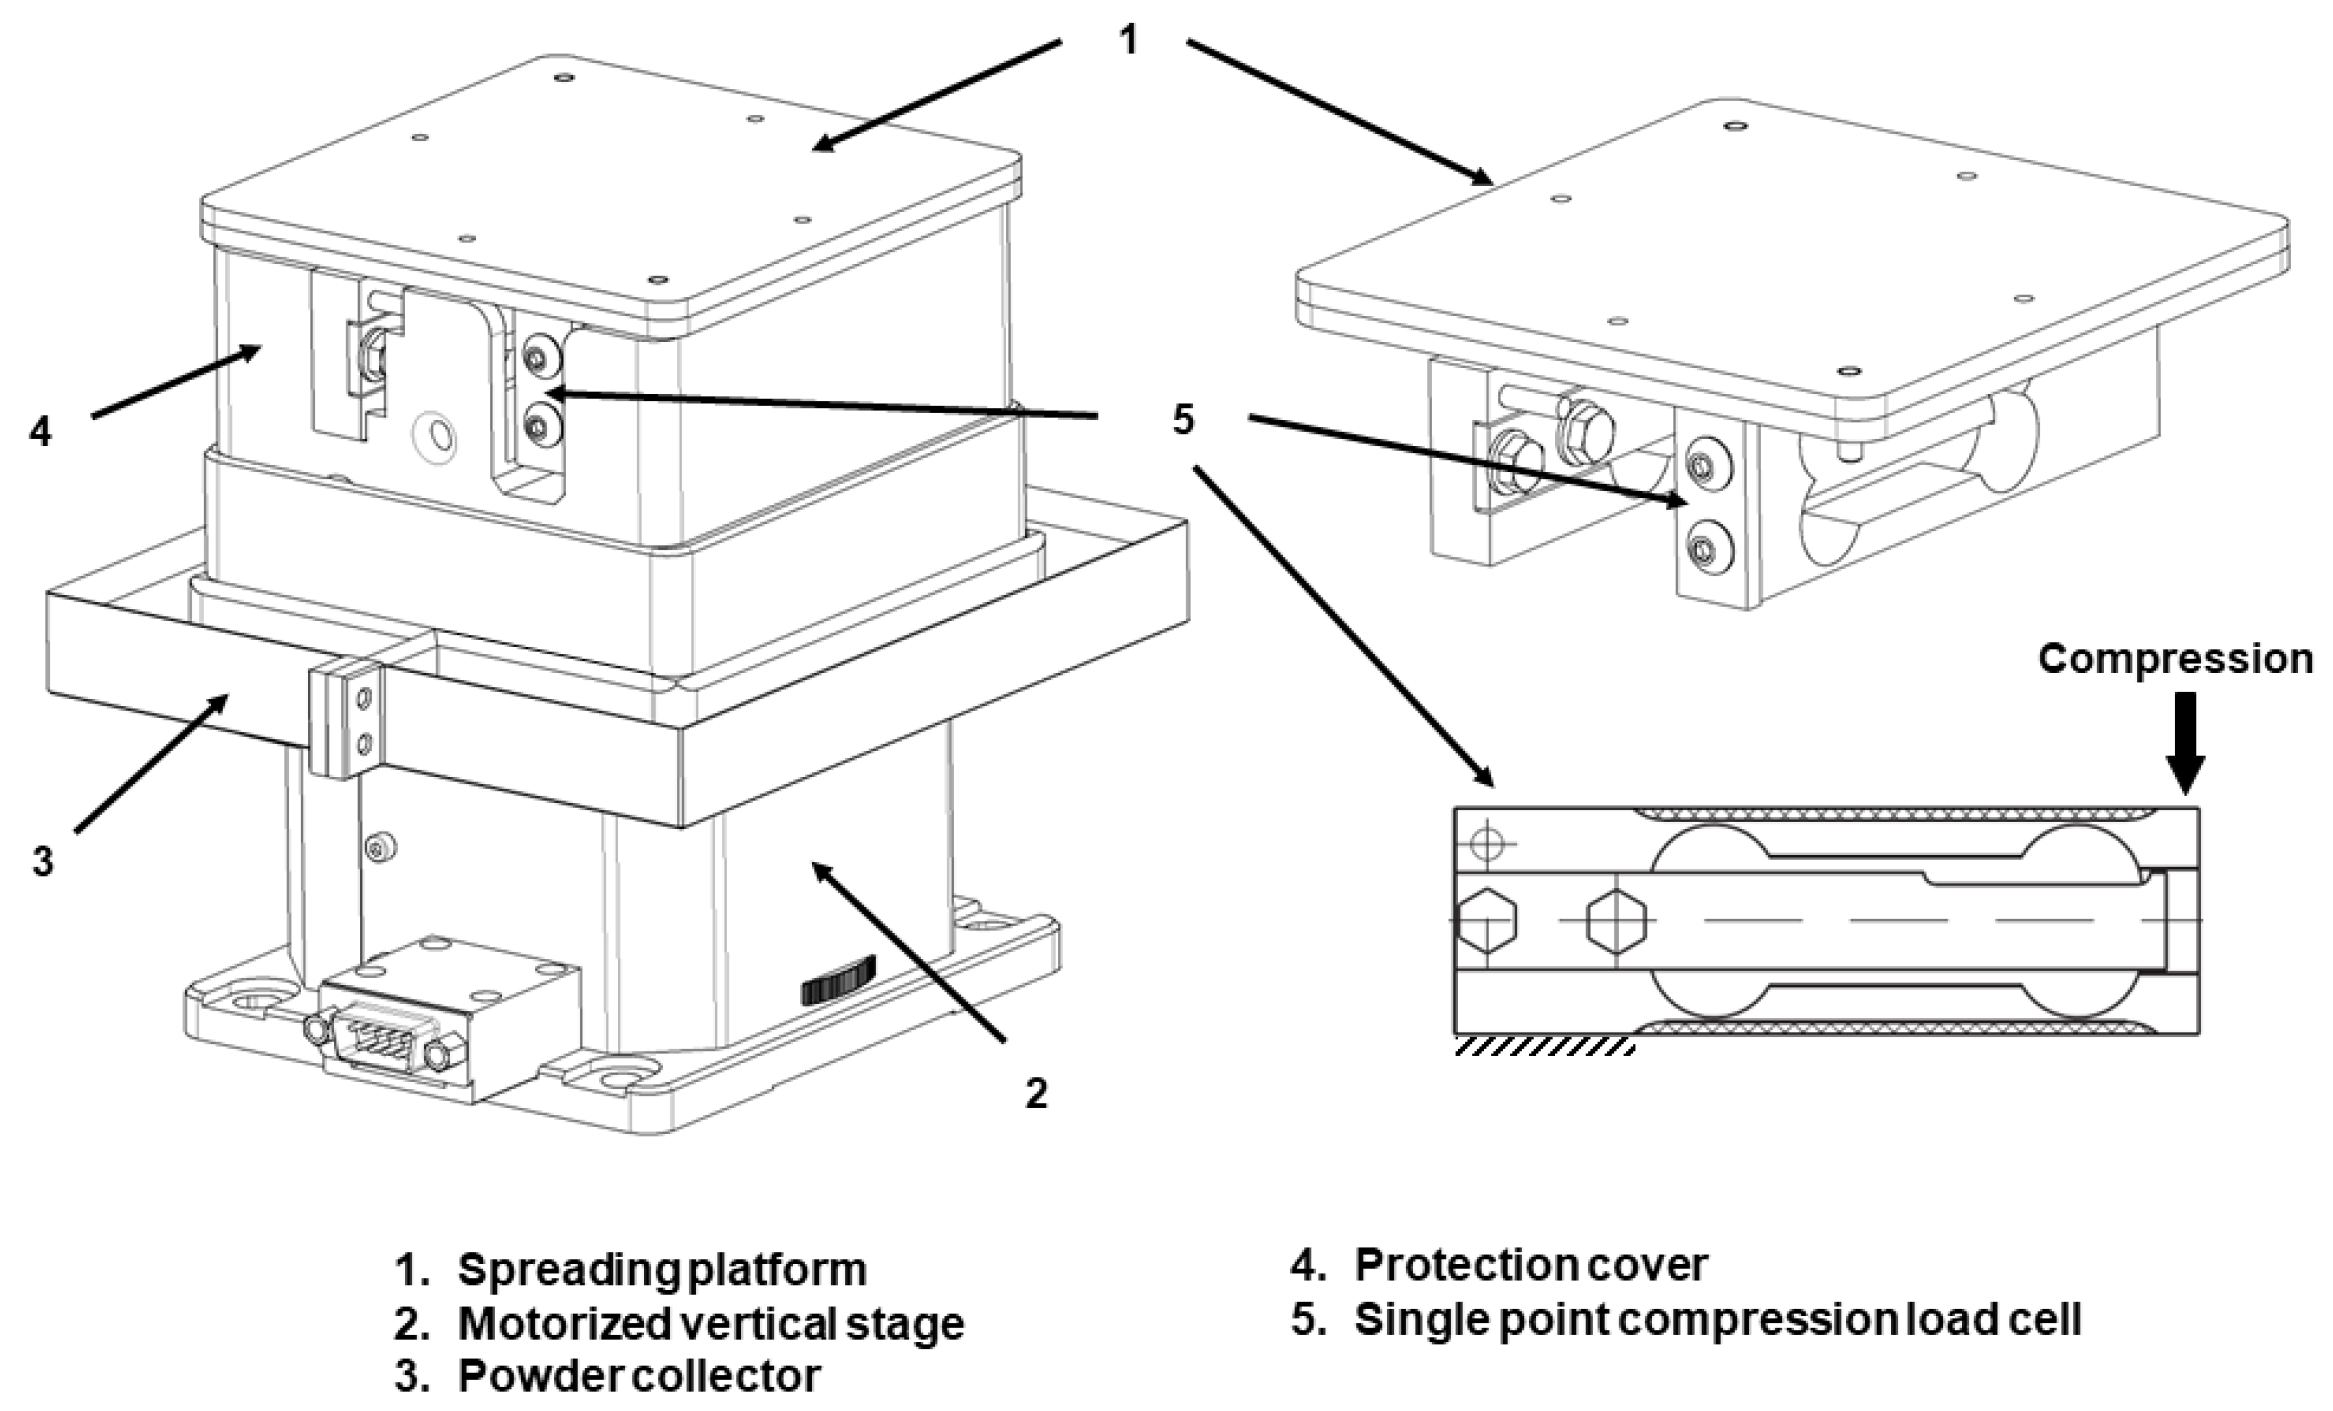
2.2. Powder Spreading Module with Weighing Unit
2.3. Spreading Mechanism with Recoating Forces Measurement Unit
2.4. Powder Bed Uniformity Evaluation Module
3. Testing Procedure
4. Validation and Calibration
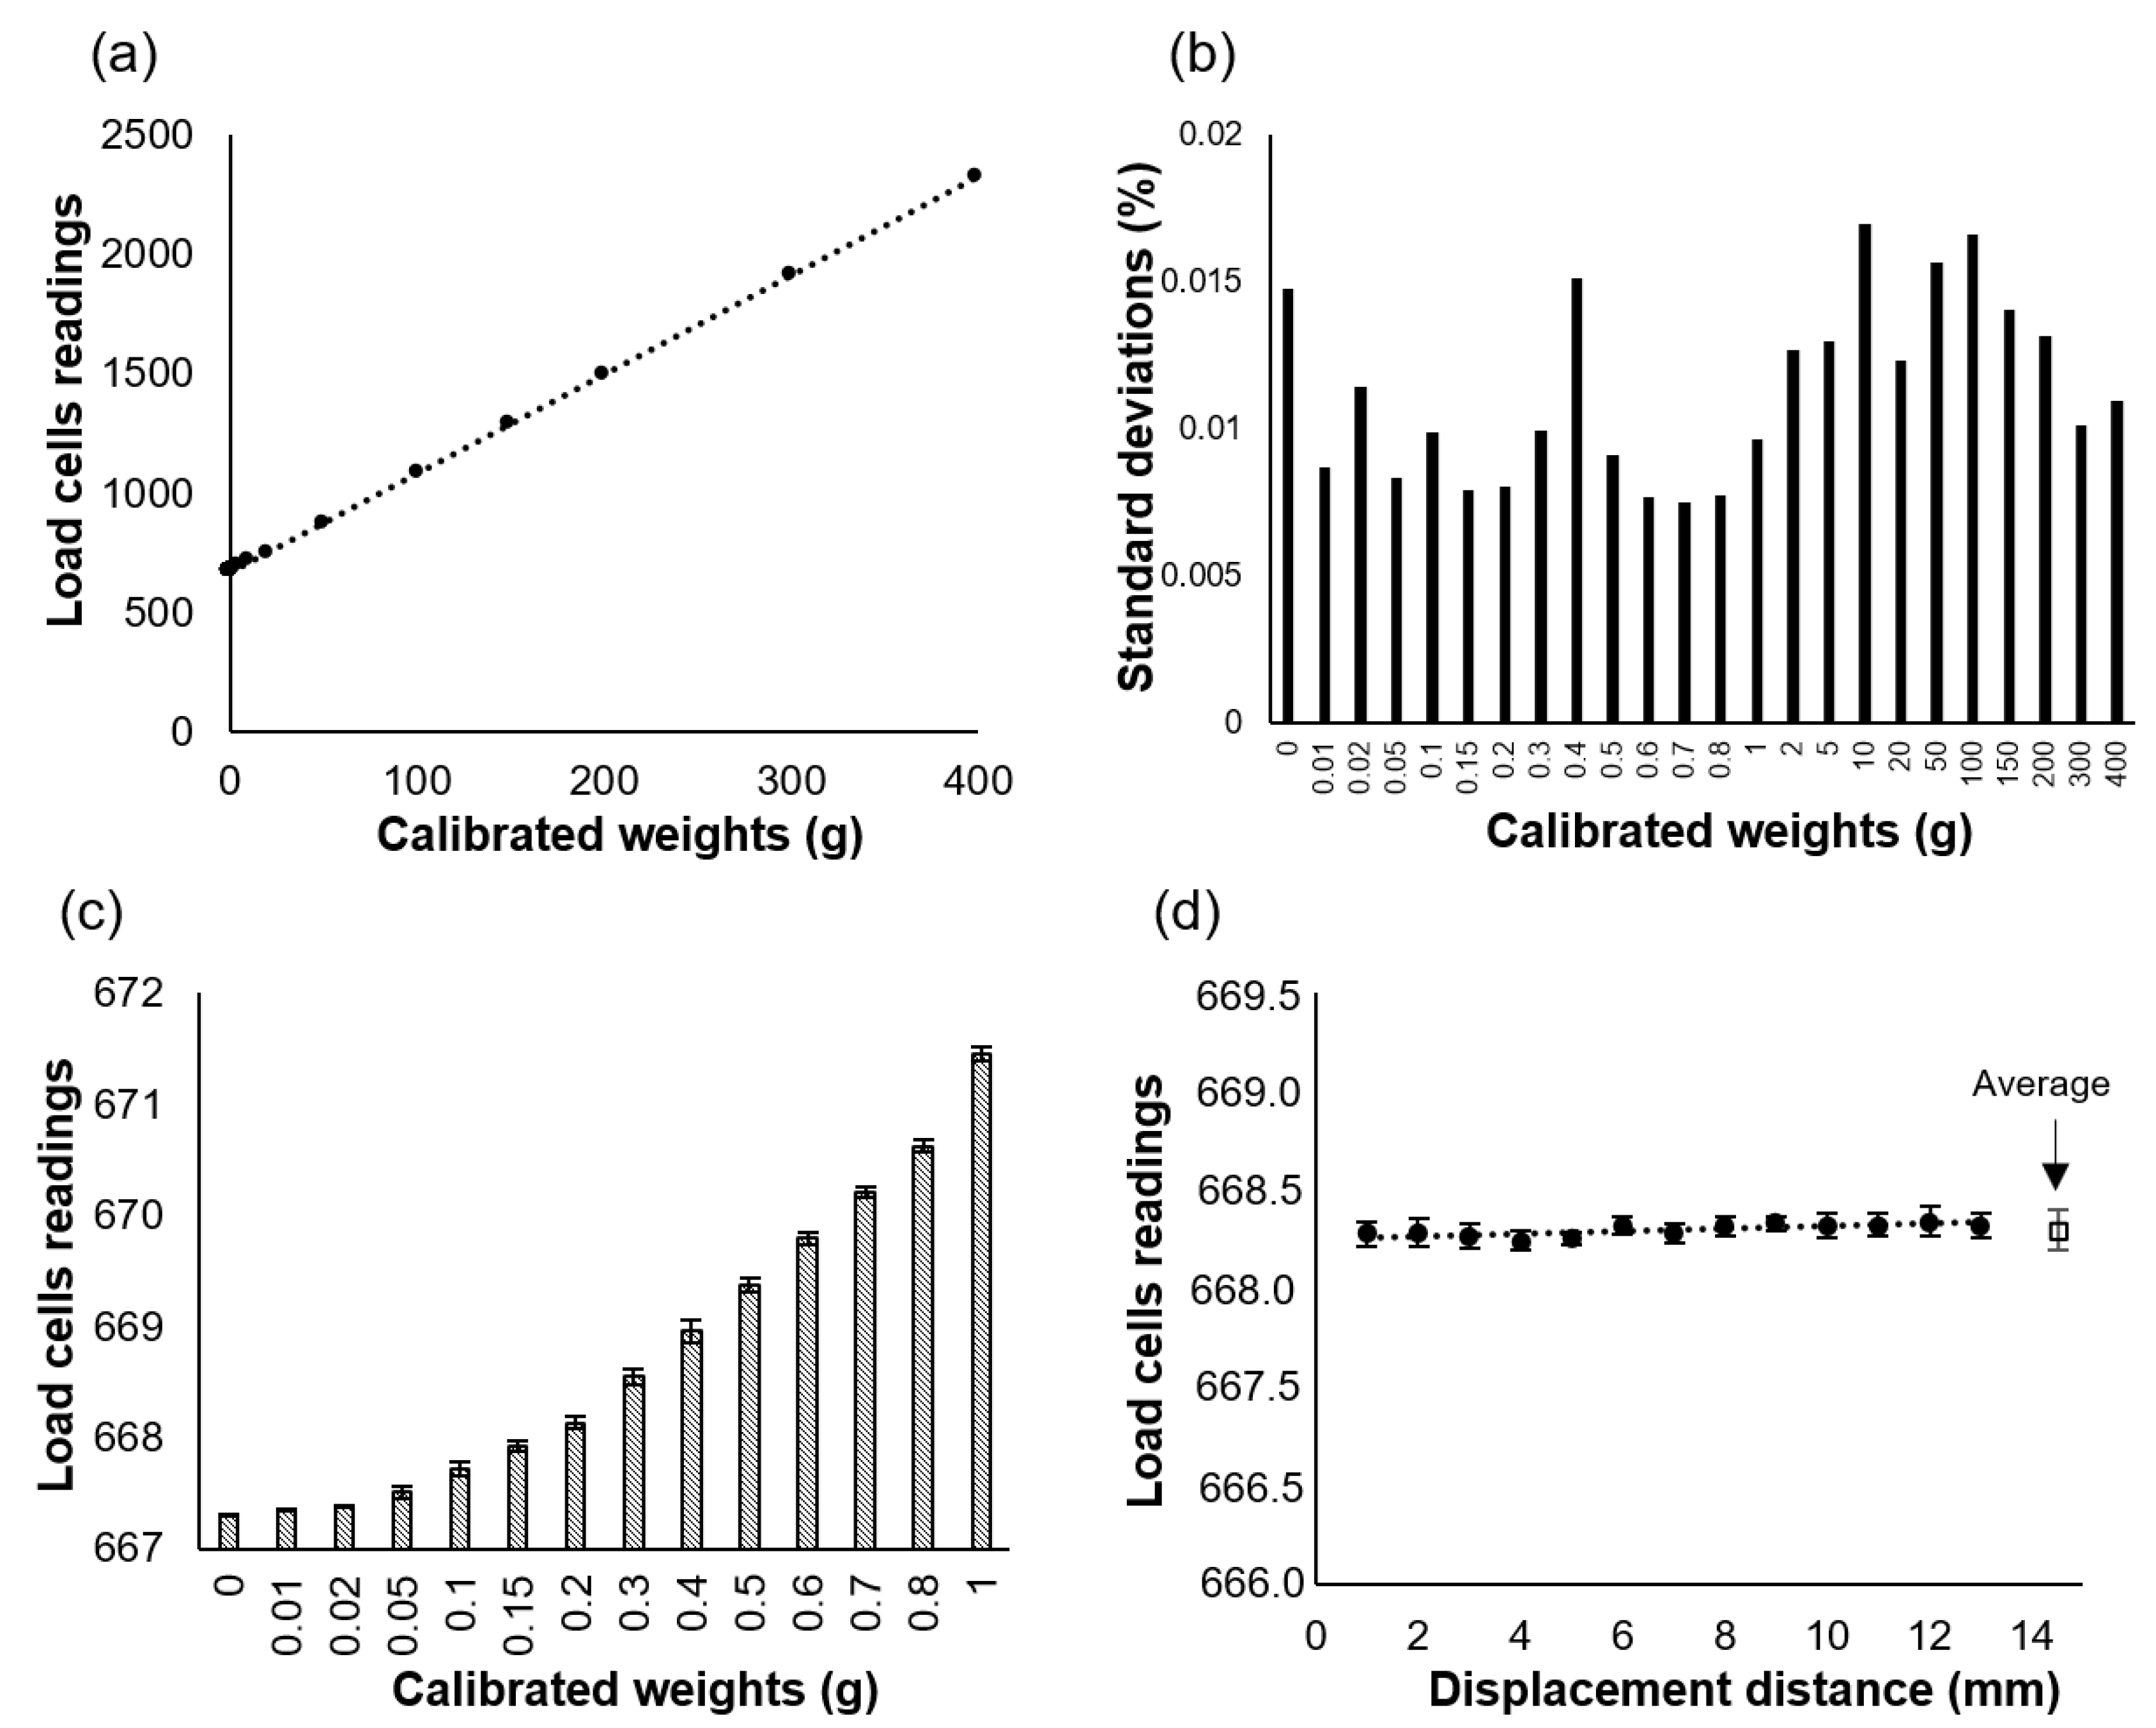
4.1. Weighing Unit
4.2. Displacements of the Dispensing and Spreading Platforms
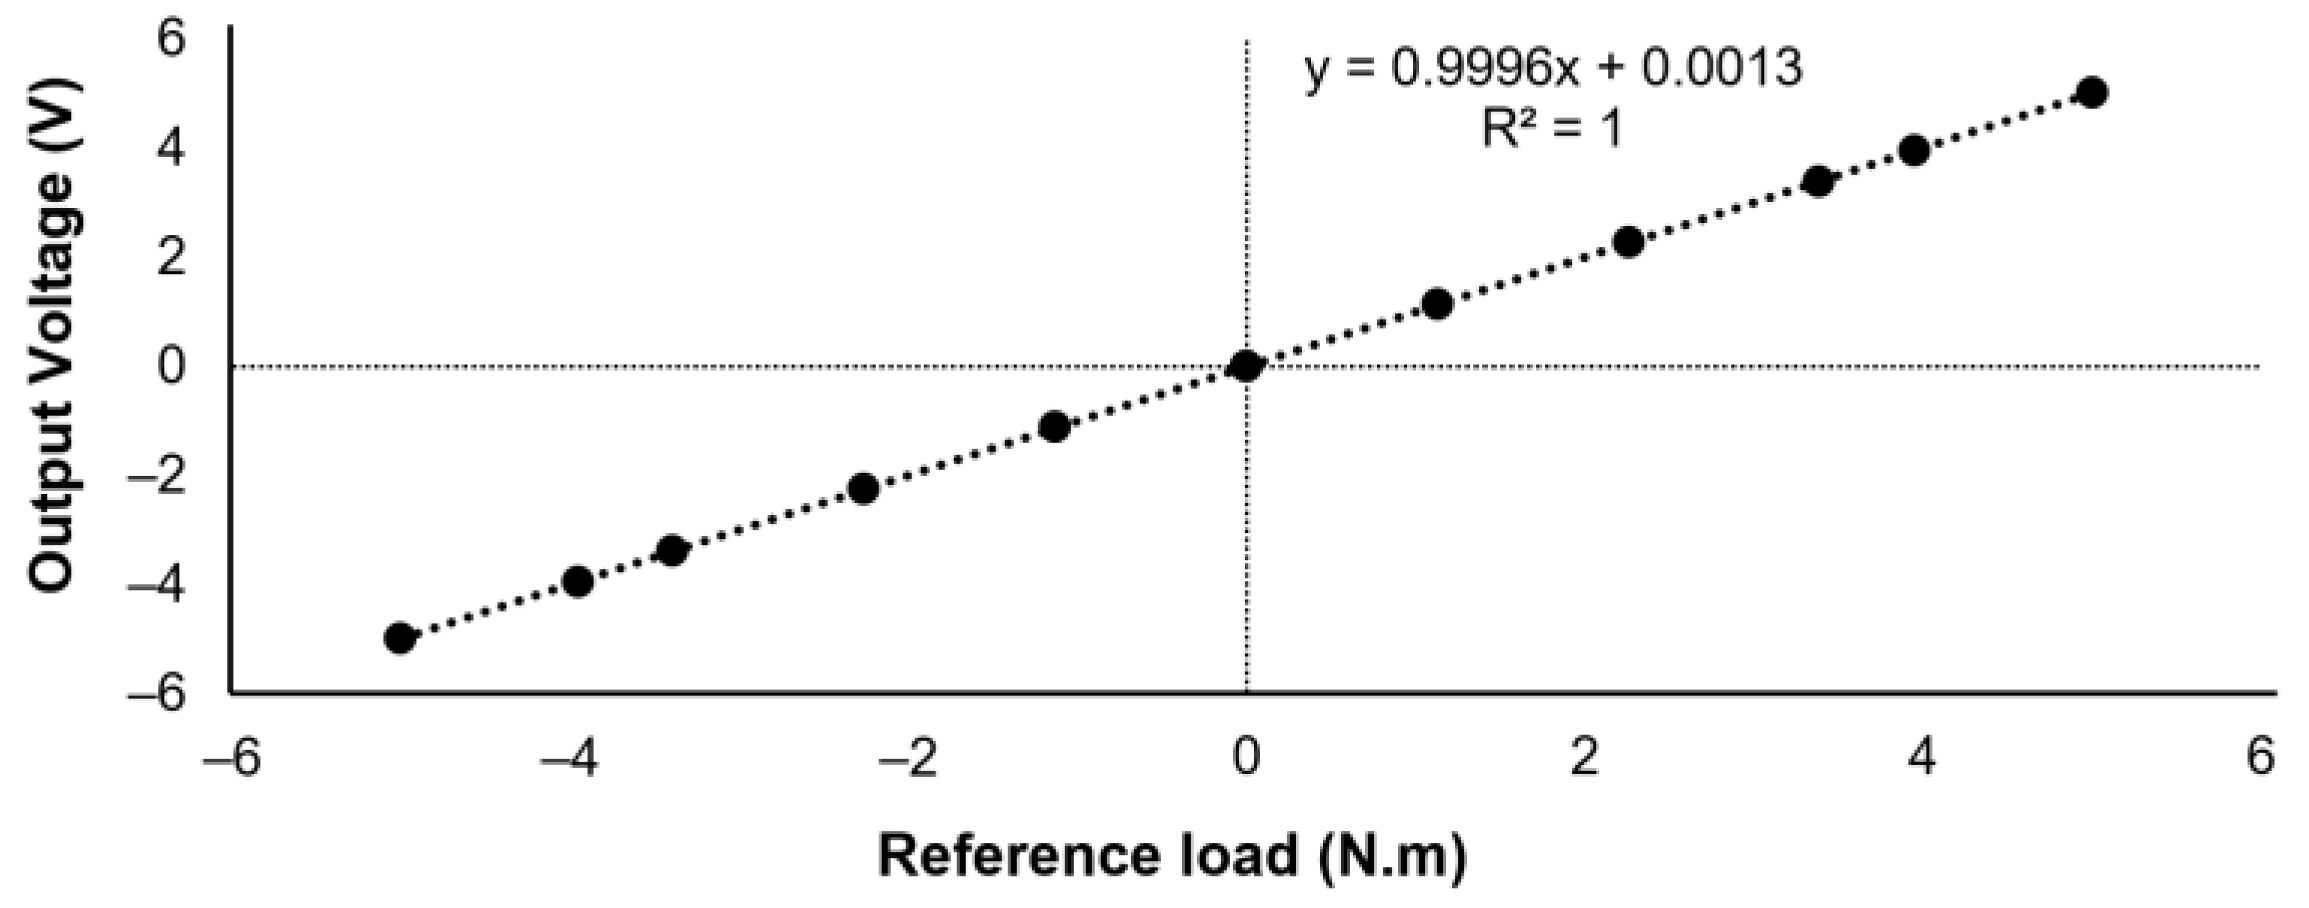
4.3. Spreading Forces Measurements
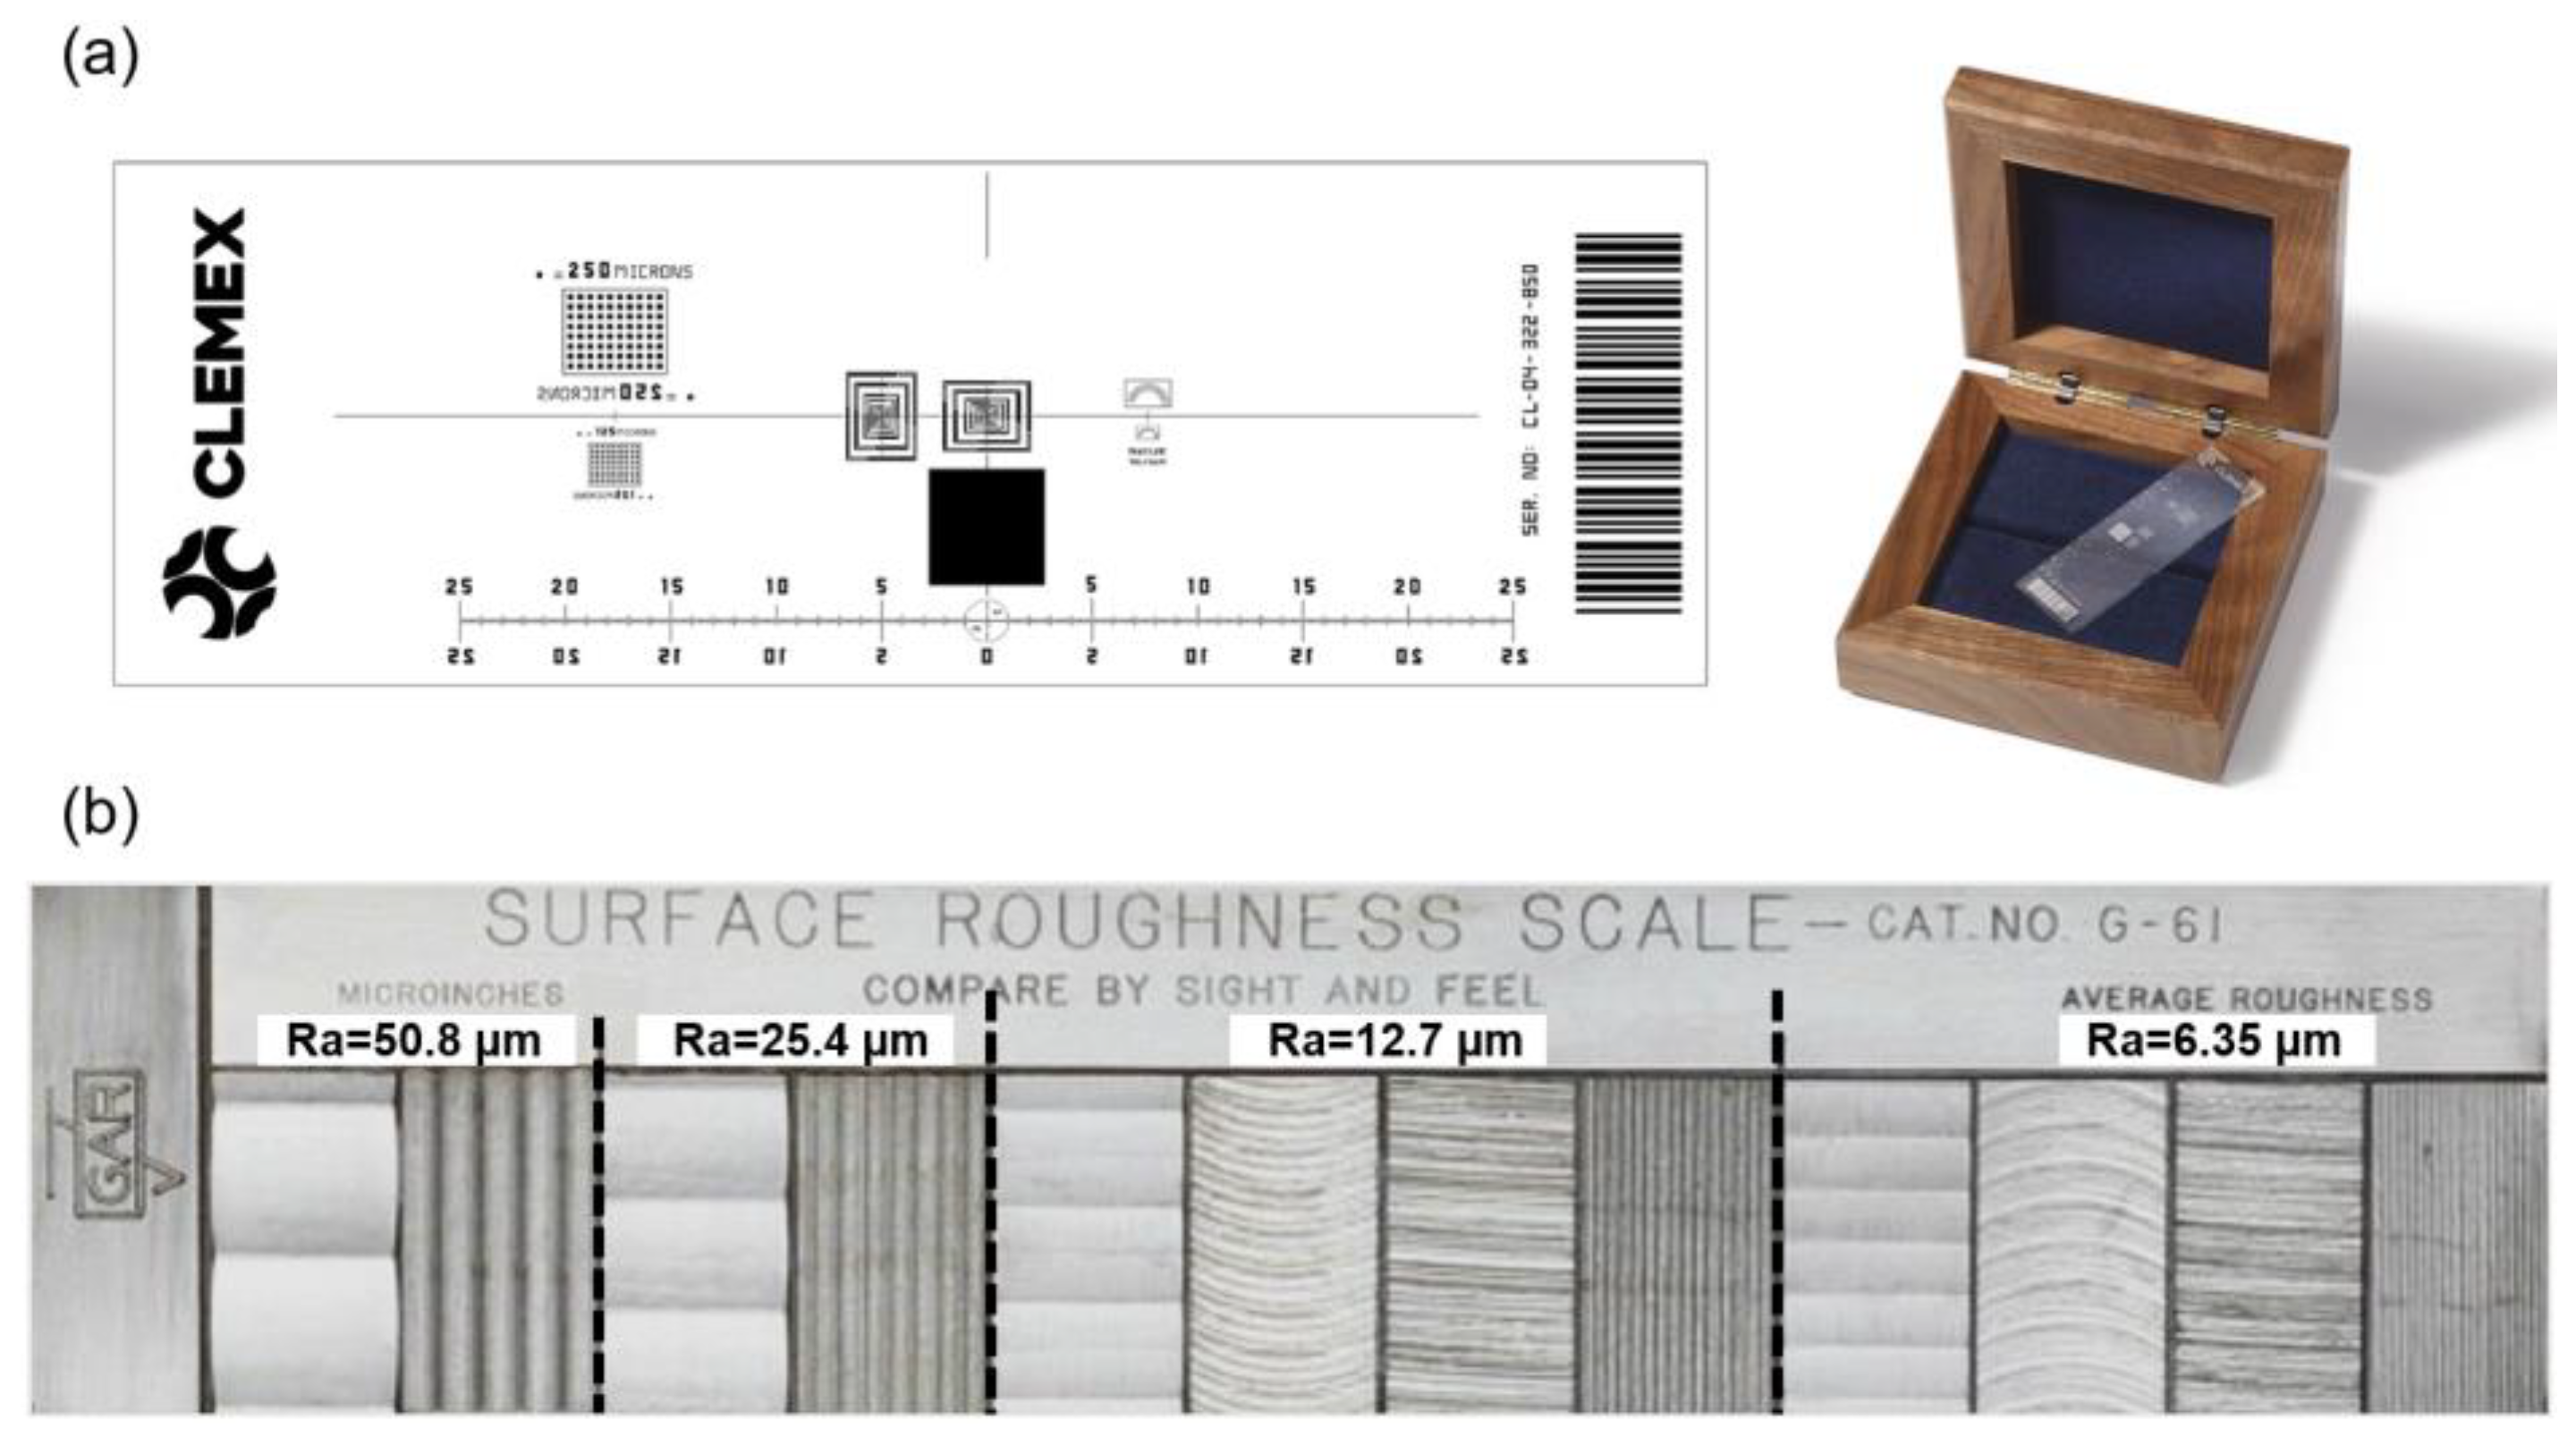
4.4. Powder Bed Uniformity Assessment
4.5. Summary of the Powder Spreading Apparatus Characteristics
5. Case Study
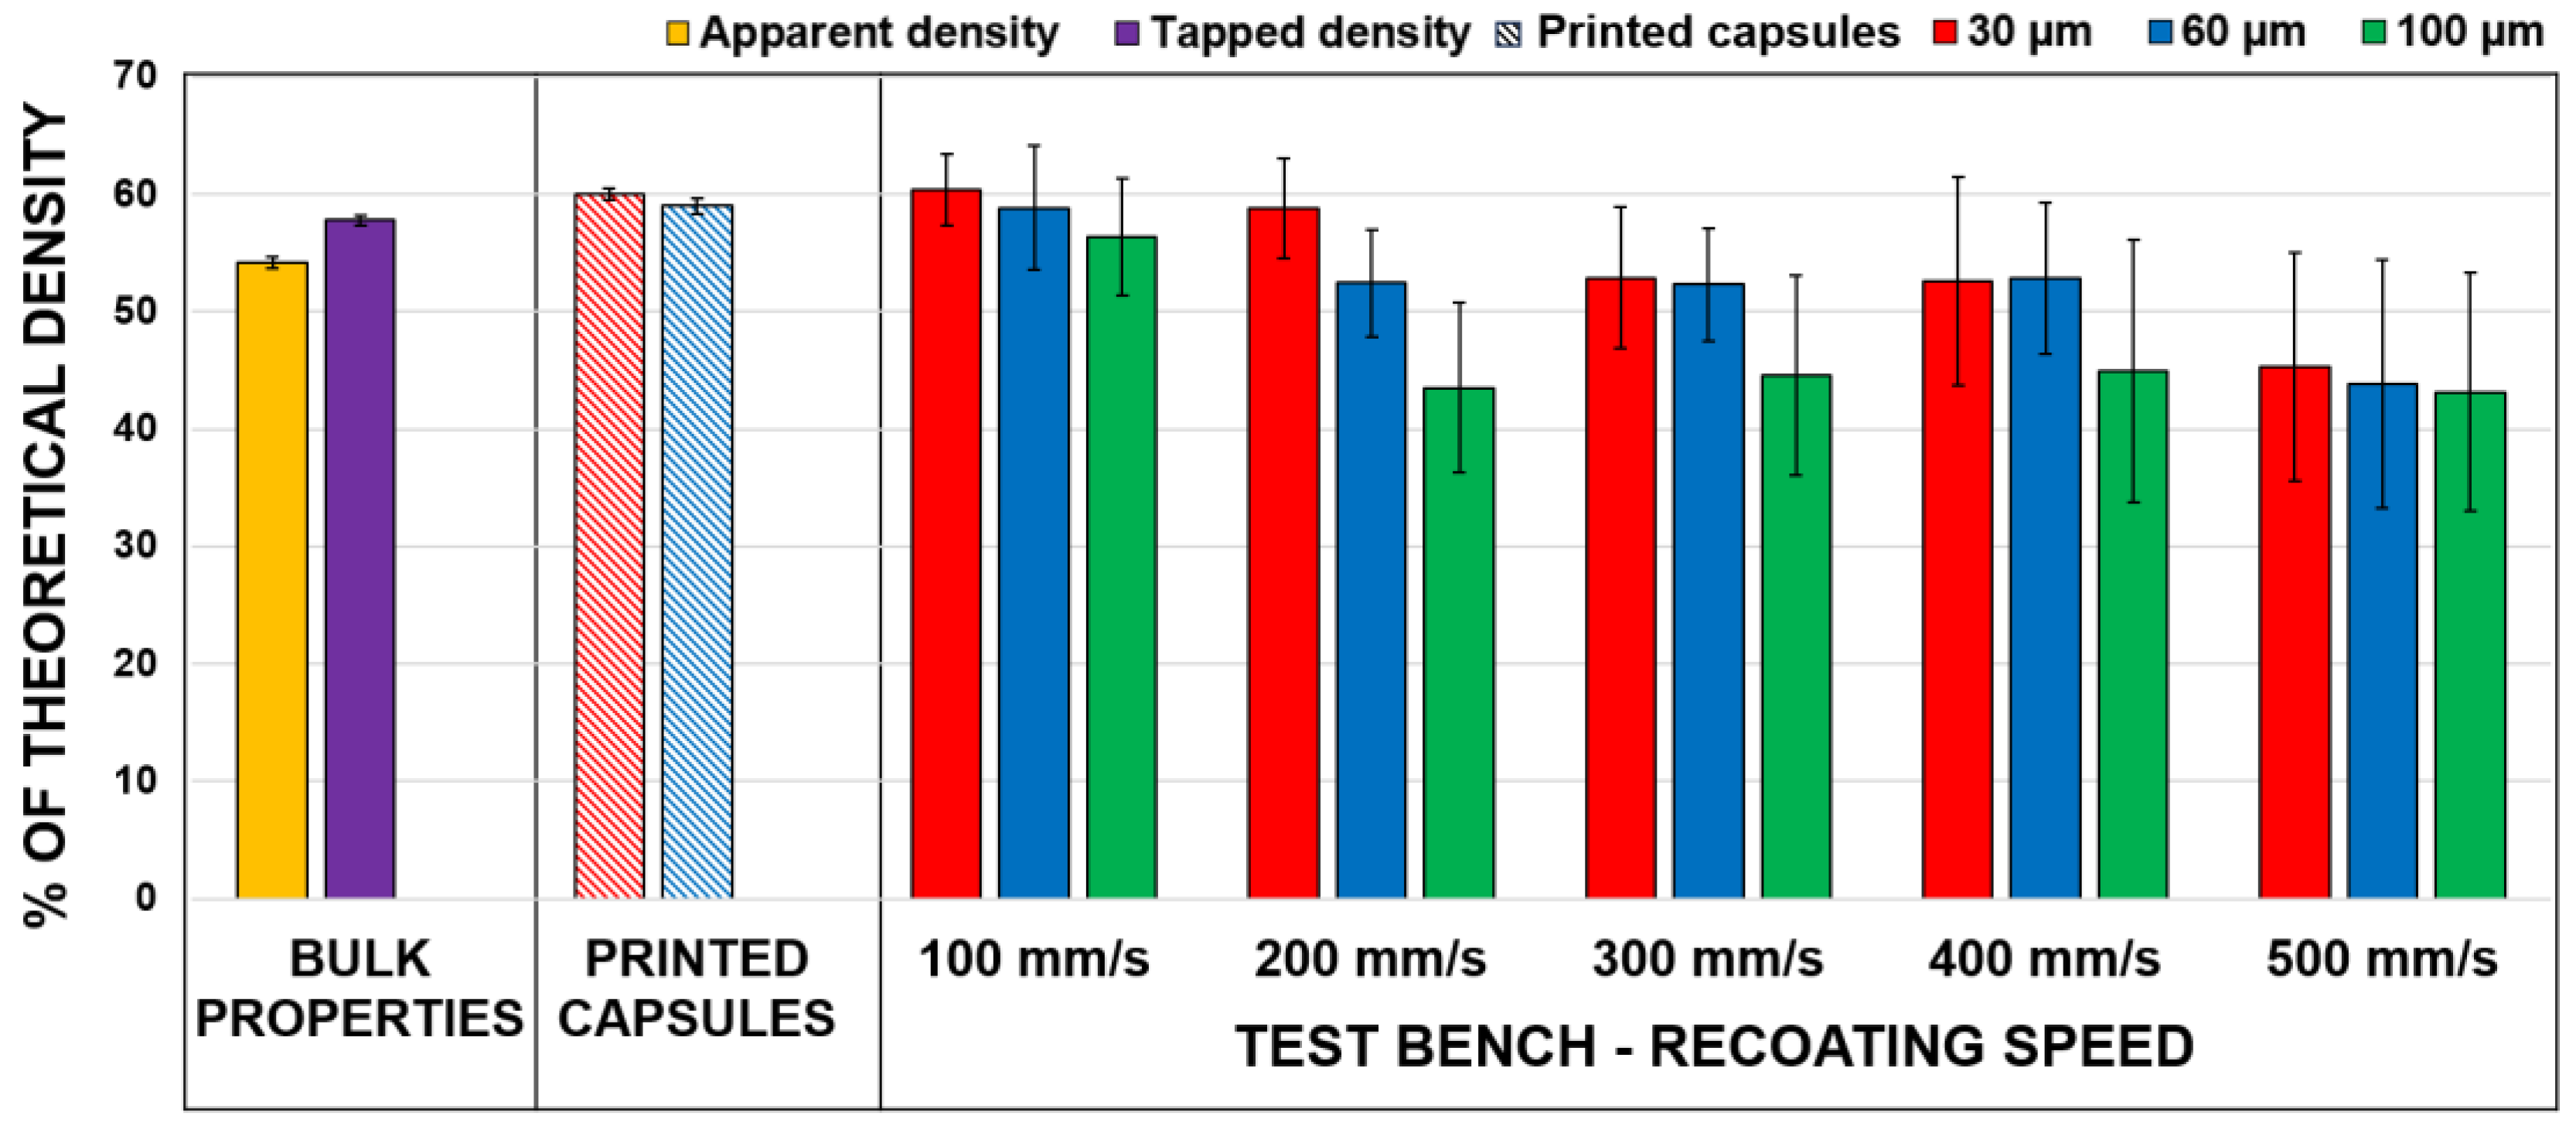
5.1. Powder Bed Density
5.2. Spreading Forces
5.3. Powder Bed Uniformity
5.4. Discussion of the Case Study
6. Conclusions
Author Contributions
Funding
Data Availability Statement
Acknowledgments
Conflicts of Interest
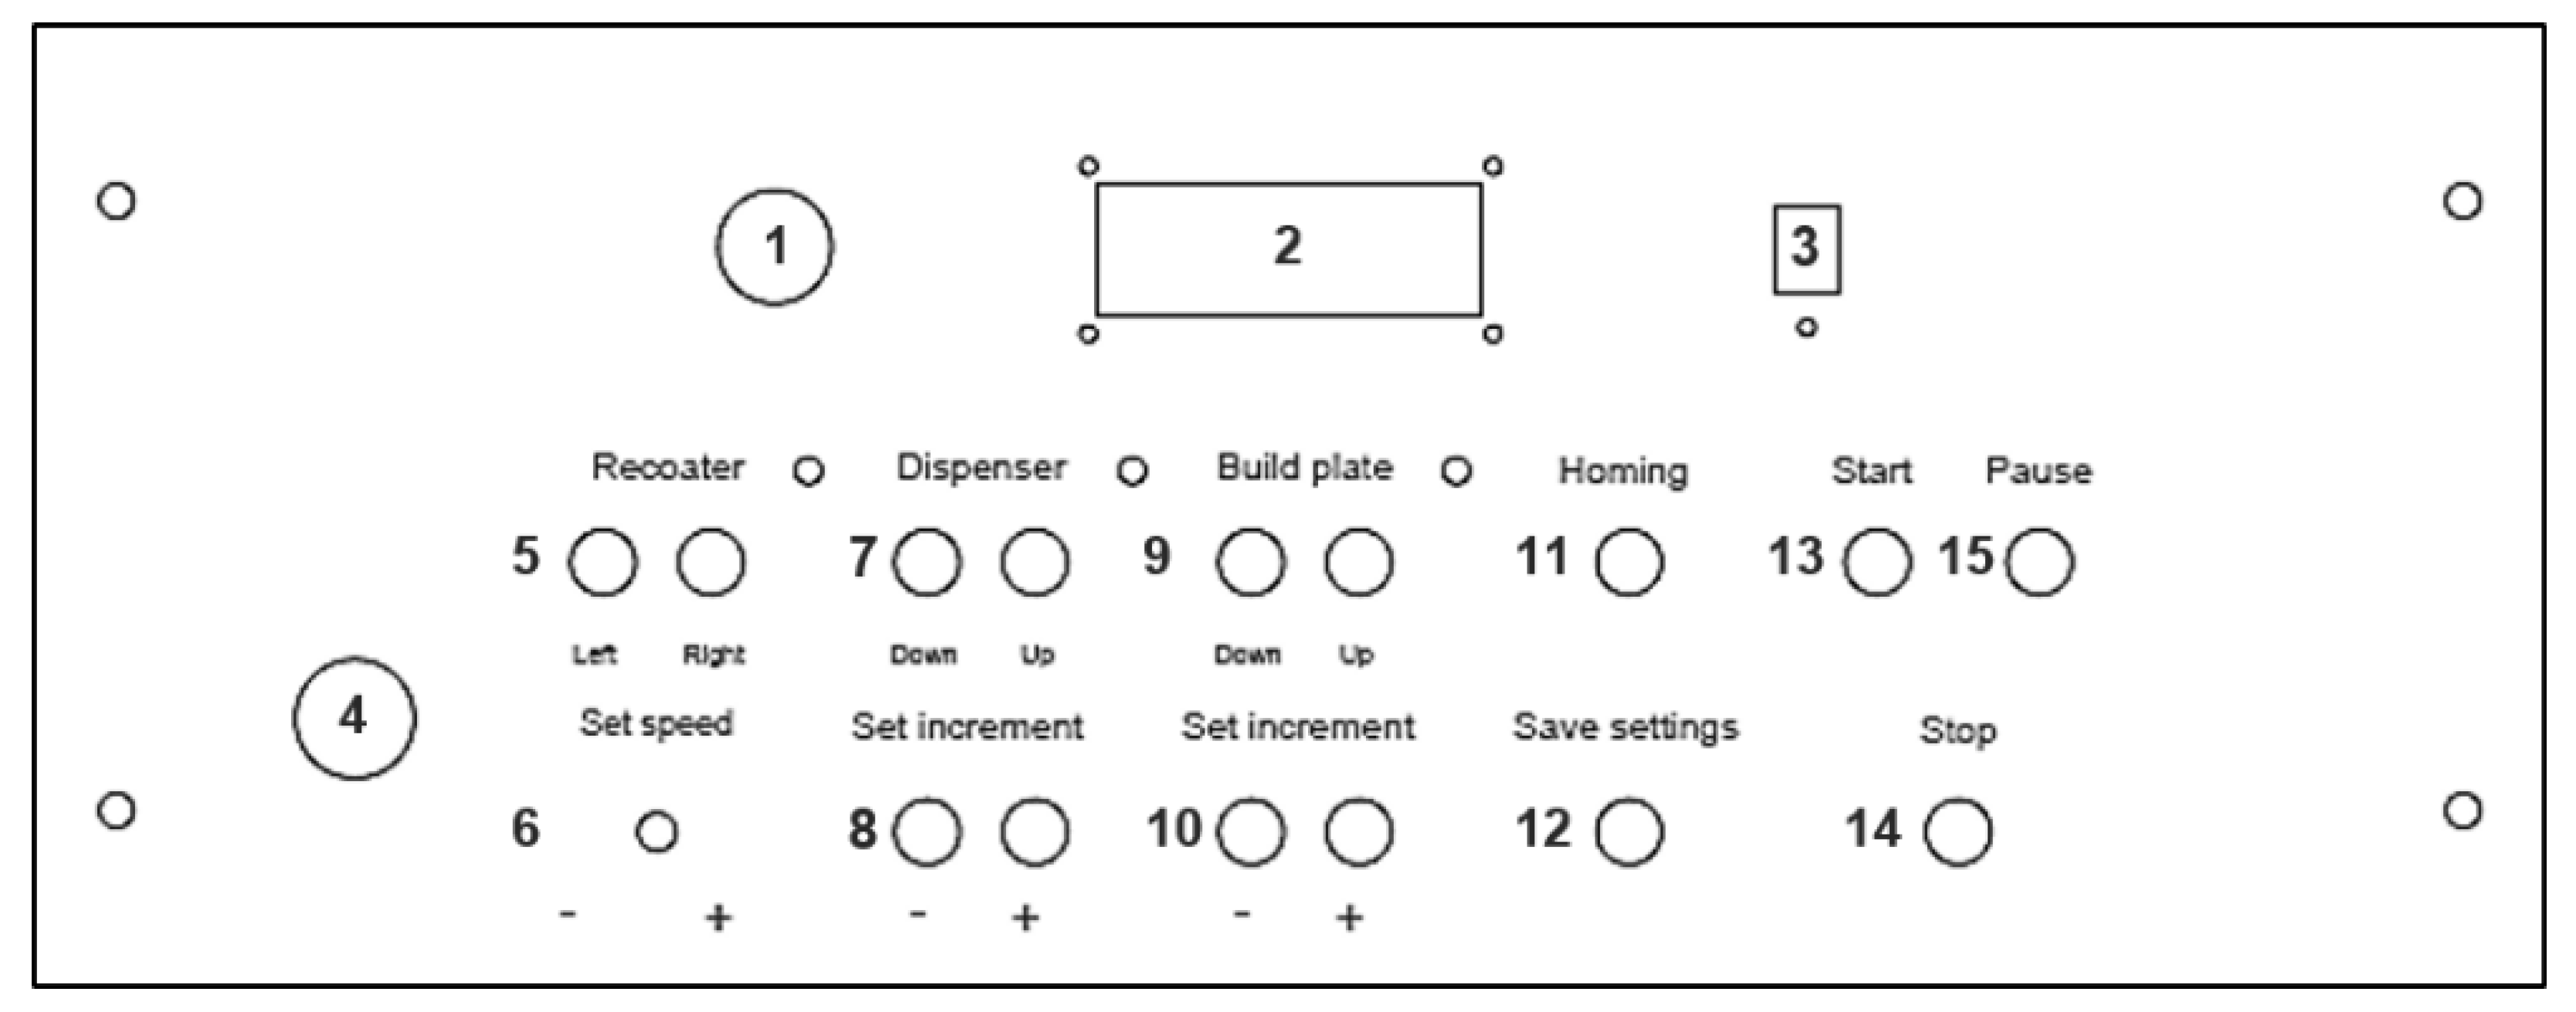
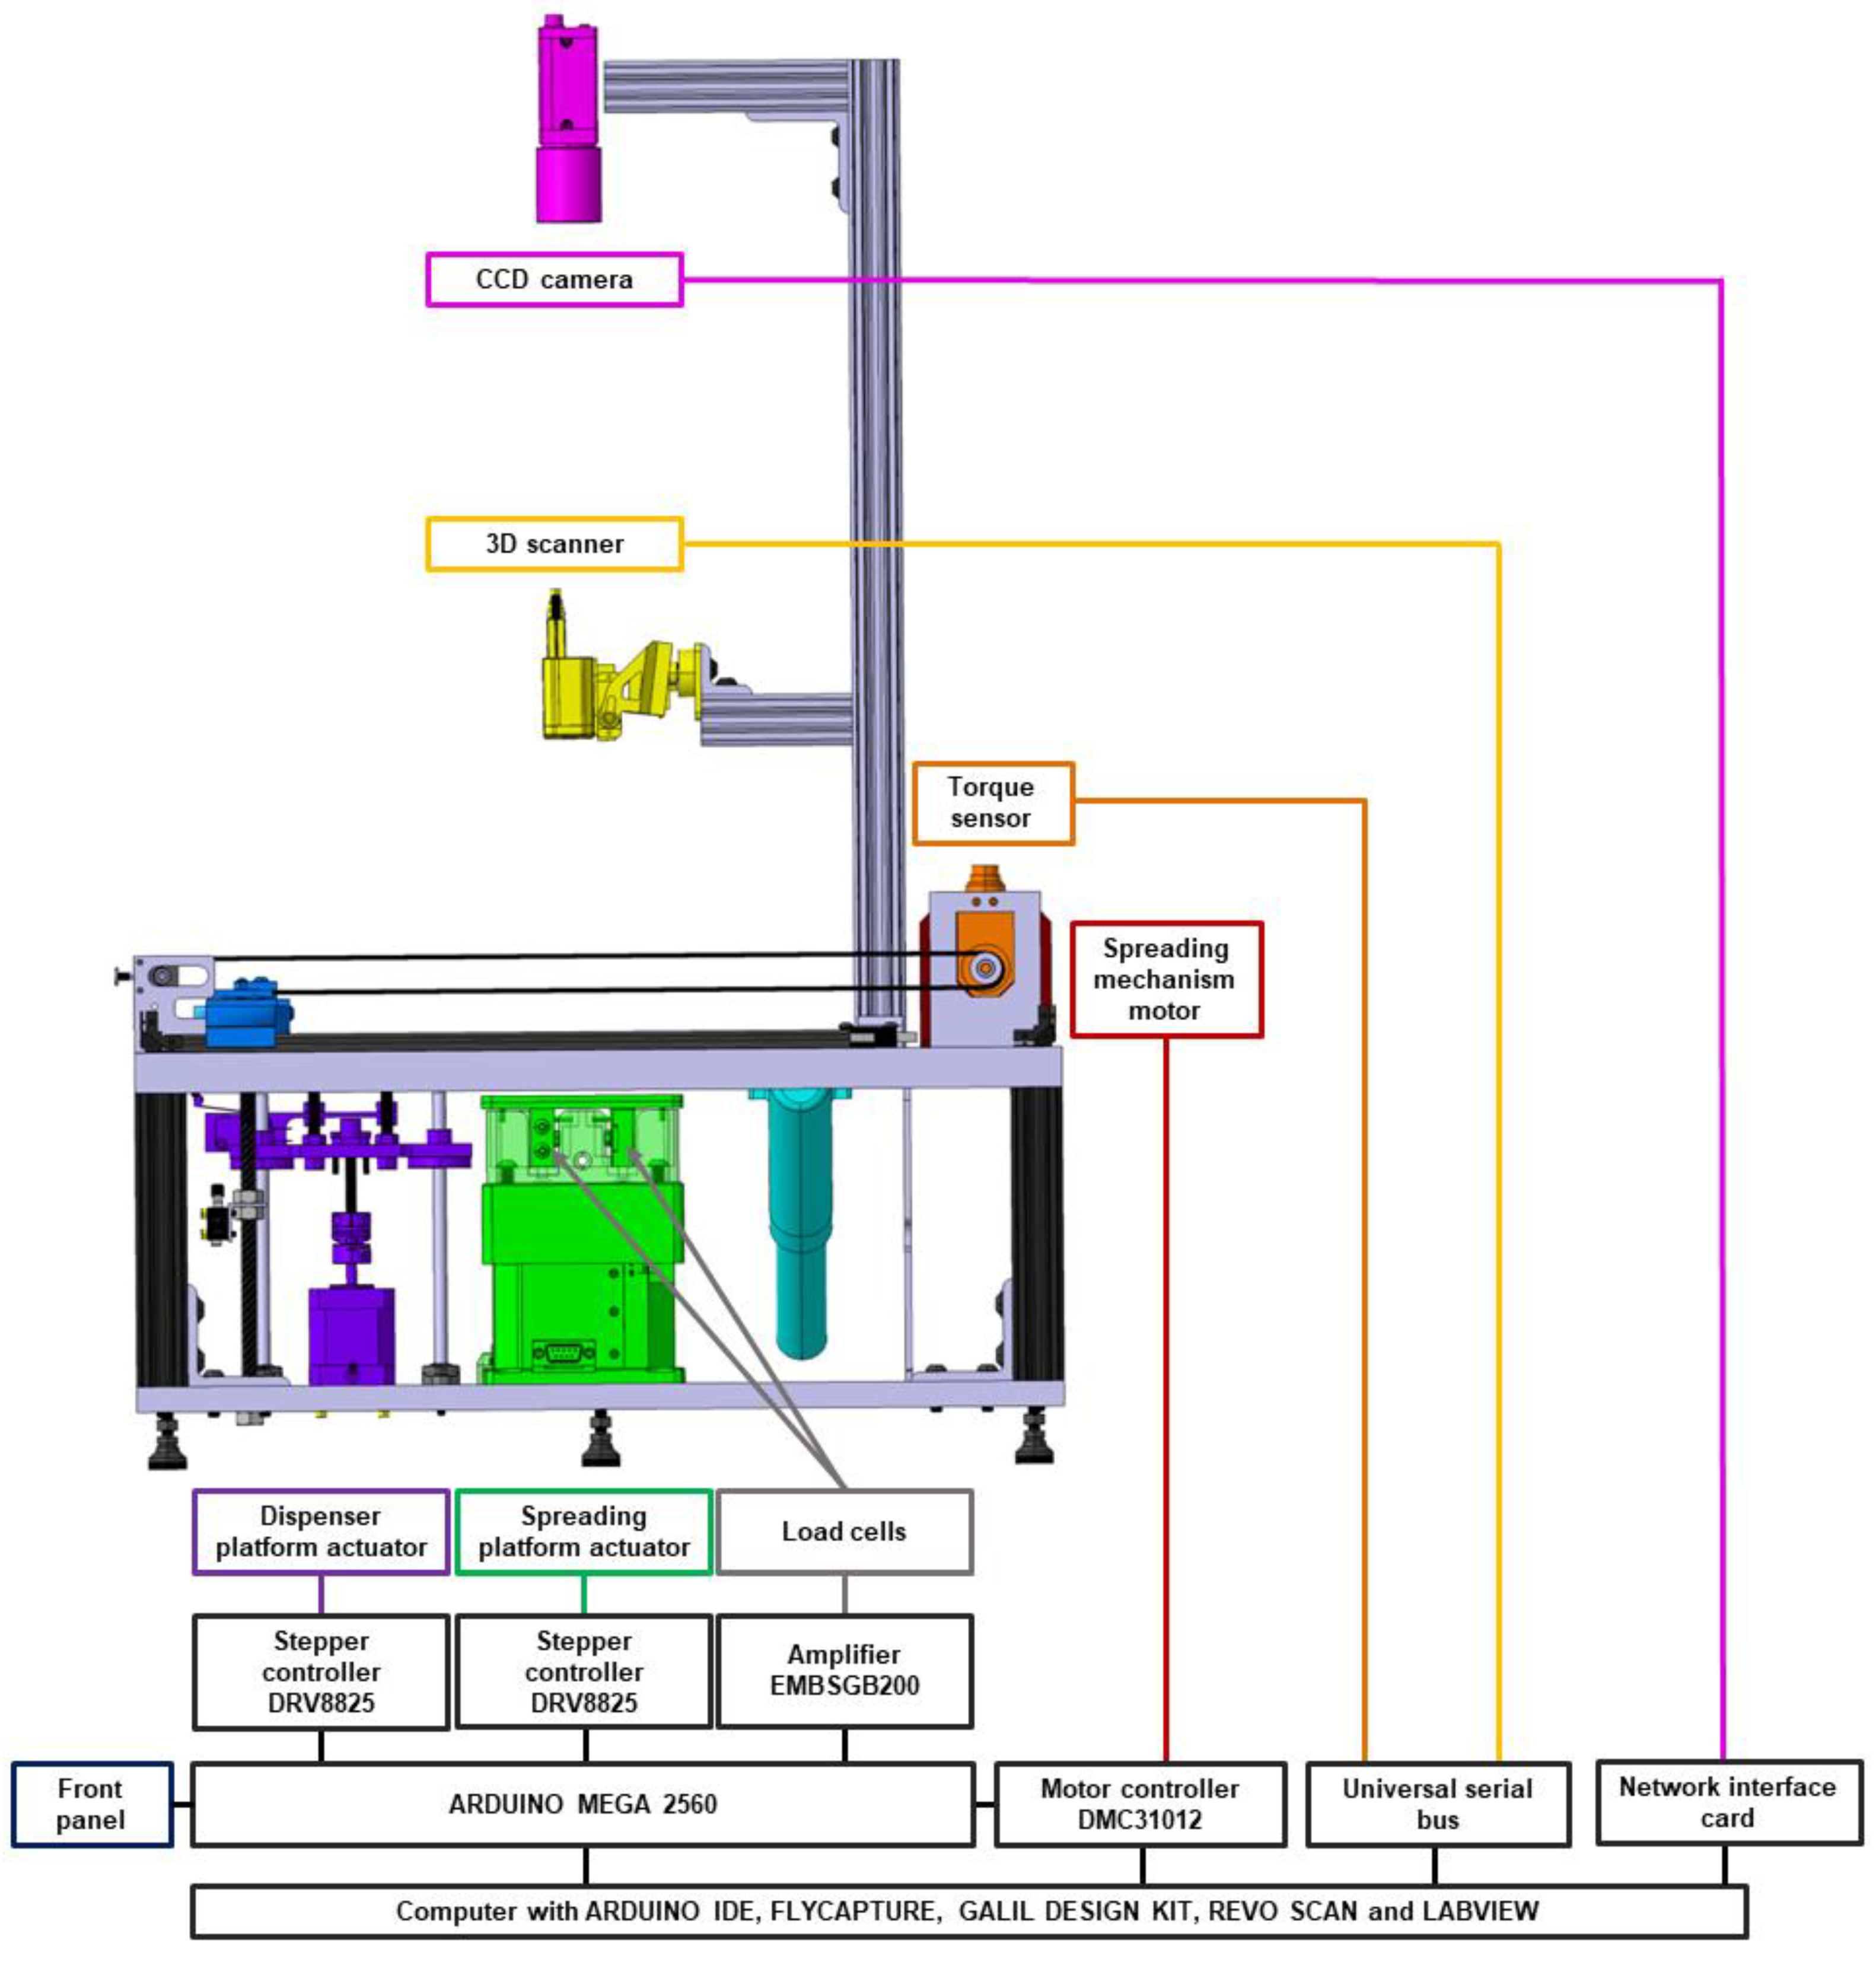
Appendix A. Control Architecture
| N° | Item | Description |
|---|---|---|
| 1 | ON/OFF button | Button to switch on and off the test bench |
| 2 | LCD screen | Screen to display the recoating speed, increment settings, temperature, humidity, and test status |
| 3 | Temperature and humidity sensor | DHT11 sensor to monitor the temperature and humidity during the test |
| 4 | Emergency stop button | Button to shut off the test in case of emergency |
| 5 | Spreading arm control | Buttons to control the movements of the spreading arm horizontally (right and left) |
| 6 | Spreading speed setting | Potentiometer to control the spreading arm’s speed of advance (recoating speed) |
| 7 | Dispensing platform control | Buttons to control the movements of the dispensing platform vertically (up and down) |
| 8 | Dispensing increment control | Defines the increment of the dispensing platform displacement (+ and −) |
| 9 | Spreading platform control | Buttons to control the movements of the spreading platform vertically (up and down) |
| 10 | Spreading platform increment control | Defines the increment of the spreading platform displacements (+ and −) |
| 11 | Homing button | Button to bring back the different moving elements of the test bench to their initial positions (safe positions) |
| 12 | Save settings | Button to save the defined settings (recoating speed, dispensing and spreading platforms’ increments) on the internal memory of the microcontroller |
| 13 | Start test button | Button to start the test sequence defined in Section 3 |
| 14 | Stop test button | Button to stop the test sequence (test progress is lost) |
| 15 | Pause test button | Button to pause the test sequence (test sequence is on hold until the start button is pressed again) |
Appendix B. Detailed Testing Procedure

Appendix C. Detailed Results
| Layer Thickness, µm | 30 | 60 | 100 | NA |
|---|---|---|---|---|
| Test apparatus measurements | ||||
| Powder bed density (%) for a recoating speed (mm/s) of: | ||||
| 100 | 60.4 ± 3.1 | 58.8 ± 5.3 | 56.4 ± 5.0 | -- |
| 200 | 58.8 ± 4.3 | 52.4 ± 4.5 | 43.5 ± 7.3 | -- |
| 300 | 52.9 ± 6.0 | 52.3 ± 4.8 | 44.6 ± 8.5 | -- |
| 400 | 52.6 ± 8.9 | 52.8 ± 6.4 | 44.9 ± 11.2 | -- |
| 500 | 45.3 ± 9.7 | 43.8 ± 10.6 | 43.1 ± 10.1 | -- |
| Printed capsules measurements [32] | ||||
| Powder bed density (%) for a recoating speed 80 mm/s | 60.0 ± 0.5 | 59.0 ± 0.7 | -- | -- |
| Bulk properties | ||||
| Apparent density (%) | -- | -- | -- | 54.2 ± 0.003 |
| Tapped density (%) | -- | -- | -- | 57.8 ± 0.005 |
| Layer Thickness, µm | 30 | 60 | 100 | NA |
|---|---|---|---|---|
| Test bench measurements | ||||
| Spreading force per contact length (N/cm) for a recoating speed (mm/s) of: | ||||
| 100 | 0.008 ± 0.005 | 0.008 ± 0.002 | 0.006 ± 0.005 | -- |
| 200 | 0.010 ± 0.001 | 0.016 ± 0.002 | 0.016 ± 0.004 | -- |
| 300 | 0.018 ± 0.003 | 0.019 ± 0.006 | 0.030 ± 0.001 | -- |
| 400 | 0.035 ± 0.004 | 0.034 ± 0.002 | 0.041 ± 0.006 | -- |
| 500 | 0.033 ± 0.002 | 0.034 ± 0.002 | 0.038 ± 0.004 | -- |
| FT4 rheometer (shear cell) (N/cm) for a shearing speed of 20 mm/s | -- | -- | -- | 0.016 ± 0.003 |
References
- Wohlers, T.; Associates, W.; Campbell, R.I.; Diegel, O.; Huff, R.; Kowen, J. Wohlers Report 2020: 3D Printing and Additive Manufacturing State of the Industry; Wohlers Associates: Washington DC, USA, 2020. [Google Scholar]
- Popov, V.V.; Grilli, M.L.; Koptyug, A.; Jaworska, L.; Katz-Demyanetz, A.; Klobčar, D.; Balos, S.; Postolnyi, B.O.; Goel, S. Powder Bed Fusion Additive Manufacturing Using Critical Raw Materials: A Review. Materials 2021, 14, 909. [Google Scholar] [PubMed]
- Bhavar, V.; Kattire, P.; Patil, V.; Khot, S.; Gujar, K.; Singh, R. A review on powder bed fusion technology of metal additive manufacturing. In Additive Manufacturing Handbook; Routledge Taylor & Francis Group: London, UK, 2017; pp. 251–253. [Google Scholar]
- Yadroitsev, I.; Yadroitsava, I. A step-by-step guide to the L-PBF process. In Fundamentals of Laser Powder Bed Fusion of Metals; Elsevier: Amsterdam, The Netherlands, 2021. [Google Scholar]
- Haeri, S. Optimisation of blade type spreaders for powder bed preparation in Additive Manufacturing using DEM simulations. Powder Technol. 2017, 321, 94–104. [Google Scholar] [CrossRef] [Green Version]
- Haeri, S.; Wang, Y.; Ghita, O.; Sun, J. Discrete element simulation and experimental study of powder spreading process in additive manufacturing. Powder Technol. 2017, 306, 45–54. [Google Scholar] [CrossRef] [Green Version]
- Budding, A.; Vaneker, T.H.J. New Strategies for Powder Compaction in Powder-based Rapid Prototyping Techniques. Procedia CIRP 2013, 6, 527–532. [Google Scholar] [CrossRef] [Green Version]
- Wang, L.; Yu, A.; Li, E.; Shen, H.; Zhou, Z. Effects of spreader geometry on powder spreading process in powder bed additive manufacturing. Powder Technol. 2021, 384, 211–222. [Google Scholar] [CrossRef]
- Yang, L.; Hsu, K.; Baughman, B.; Godfrey, D.; Medina, F.; Menon, M.; Wiener, S. Additive Manufacturing of Metals: The Technology, Materials, Design and Production; Springer: Berlin/Heidelberg, Germany, 2017. [Google Scholar]
- Zhang, J.; Tan, Y.; Bao, T.; Xu, Y.; Xiao, X.; Jiang, S. Discrete Element Simulation of the Effect of Roller-Spreading Parameters on Powder-Bed Density in Additive Manufacturing. Materials 2020, 13, 2285. [Google Scholar] [CrossRef] [PubMed]
- Daňa, M.; Zetková, I.; Hanzl, P. The Influence of a Ceramic Recoater Blade on 3D Printing using Direct Metal Laser Sintering. Manuf. Technol. 2019, 19, 23–28. [Google Scholar] [CrossRef]
- Kayacan, M.Y.; Özsoy, K.; Duman, B.; Yilmaz, N.; Kayacan, M.C. A study on elimination of failures resulting from layering and internal stresses in Powder Bed Fusion (PBF) additive manufacturing. Mater. Manuf. Process. 2019, 34, 1467–1475. [Google Scholar] [CrossRef]
- Shamsdini, S.; Ghoncheh, M.H.; Mohammadi, M. Effect of recoater-blade type on the mechanical properties and microstructure of additively manufactured maraging steels. Mater. Sci. Eng. A 2021, 812, 141104. [Google Scholar] [CrossRef]
- Ziaee, M.; Crane, N.B. Binder jetting: A review of process, materials, and methods. Addit. Manuf. 2019, 28, 781–801. [Google Scholar]
- Mostafaei, A.; Elliott, A.M.; Barnes, J.E.; Li, F.; Tan, W.; Cramer, C.L.; Nandwana, P.; Chmielus, M. Binder jet 3D printing—Process parameters, materials, properties, modeling, and challenges. Prog. Mater. Sci. 2021, 119, 100707. [Google Scholar]
- Mirzababaei, S.; Pasebani, S. A review on binder jet additive manufacturing of 316L stainless steel. J. Manuf. Mater. Process. 2019, 3, 82. [Google Scholar]
- Oropeza, D.; Roberts, R.; Hart, A.J. A modular testbed for mechanized spreading of powder layers for additive manufacturing. Rev. Sci. Instrum. 2021, 92, 015114. [Google Scholar] [CrossRef]
- Oropeza, D.; Penny, R.W.; Gilbert, D.; Hart, A.J. Mechanized spreading of ceramic powder layers for additive manufacturing characterized by transmission X-ray imaging: Influence of powder feedstock and spreading parameters on powder layer density. Powder Technol. 2022, 398, 117053. [Google Scholar] [CrossRef]
- Foster, B.; Reutzel, E.; Nassar, A.; Hall, B.; Brown, S.; Dickman, C. Optical, layerwise monitoring of powder bed fusion. In Proceedings of the Solid Freeform Fabrication Symposium, Austin, TX, USA, 10 August 2015; pp. 10–12. [Google Scholar]
- Vlasea, M.L.; Lane, B.; Lopez, F.; Mekhontsev, S.; Donmez, A. Development of powder bed fusion additive manufacturing test bed for enhanced real-time process control. In Proceedings of the International Solid Freeform Fabrication Symposium, Austin, TX, USA, 10 August 2015; pp. 13–15. [Google Scholar]
- Kolossov, S.; Boillat, E.; Glardon, R.; Fischer, P.; Locher, M. 3D FE simulation for temperature evolution in the selective laser sintering process. Int. J. Mach. Tools Manuf. 2004, 44, 117–123. [Google Scholar]
- Gusarov, A.; Yadroitsev, I.; Bertrand, P.; Smurov, I. Model of radiation and heat transfer in laser-powder interaction zone at selective laser melting. J. Heat Transf. 2009, 131, 072101. [Google Scholar]
- Patil, R.B.; Yadava, V. Finite element analysis of temperature distribution in single metallic powder layer during metal laser sintering. Int. J. Mach. Tools Manuf. 2007, 47, 1069–1080. [Google Scholar]
- Matsumoto, M.; Shiomi, M.; Osakada, K.; Abe, F. Finite element analysis of single layer forming on metallic powder bed in rapid prototyping by selective laser processing. Int. J. Mach. Tools Manuf. 2002, 42, 61–67. [Google Scholar]
- Jacob, G.; Jacob, G.; Brown, C.U.; Donmez, A. The Influence of Spreading Metal Powders with Different Particle Size Distributions on the Powder Bed Density in Laser-Based Powder Bed Fusion Processes; U.S. Department of Commerce, National Institute of Standards and Technology: Gaithersburg, MD, USA, 2018.
- Brika, S.E.; Zhao, Y.F.; Brochu, M.; Mezzetta, J. Multi-objective build orientation optimization for powder bed fusion by laser. J. Manuf. Sci. Eng. 2017, 139, 111011. [Google Scholar]
- Baumers, M.; Tuck, C.; Wildman, R.; Ashcroft, I.; Rosamond, E.; Hague, R. Combined build-time, energy consumption and cost estimation for direct metal laser sintering. In Proceedings of the Twenty Third Annual International Solid Freeform Fabrication Symposium—An Additive Manufacturing Conference, Austin, TX, USA, 15 August 2012. [Google Scholar]
- Piili, H.; Happonen, A.; Väistö, T.; Venkataramanan, V.; Partanen, J.; Salminen, A. Cost estimation of laser additive manufacturing of stainless steel. Phys. Procedia 2015, 78, 388–396. [Google Scholar]
- Seyda, V.; Herzog, D.; Emmelmann, C. Relationship between powder characteristics and part properties in laser beam melting of Ti–6Al–4V, and implications on quality. J. Laser Appl. 2017, 29, 022311. [Google Scholar]
- Chen, G.; Zhao, S.; Tan, P.; Wang, J.; Xiang, C.; Tang, H. A comparative study of Ti-6Al-4V powders for additive manufacturing by gas atomization, plasma rotating electrode process and plasma atomization. Powder Technol. 2018, 333, 38–46. [Google Scholar]
- Brika, S.E.; Brailovski, V. Influence of Powder Particle Morphology on the Static and Fatigue Properties of Laser Powder Bed-Fused Ti-6Al-4V Components. J. Manuf. Mater. Process. 2020, 4, 107. [Google Scholar]
- Brika, S.E.; Letenneur, M.; Dion, C.A.; Brailovski, V. Influence of particle morphology and size distribution on the powder flowability and laser powder bed fusion manufacturability of Ti-6Al-4V alloy. Addit. Manuf. 2020, 31, 100929. [Google Scholar]
- Spierings, A.B.; Levy, G. Comparison of density of stainless steel 316L parts produced with selective laser melting using different powder grades. In Proceedings of the Annual International Solid Freeform Fabrication Symposium, Austin, TX, USA, 15 September 2009; pp. 342–353. [Google Scholar]
- Spierings, A.B.; Herres, N.; Levy, G. Influence of the particle size distribution on surface quality and mechanical properties in AM steel parts. Rapid Prototyp. J. 2011, 17, 195–202. [Google Scholar]
- Badrossamay, M.; Yasa, E.; Van Vaerenbergh, J.; Kruth, J.-P. Improving productivity rate in SLM of commercial steel powders. Tech. Pap. Soc. Manuf. Eng. 2009, 13, 1–13. [Google Scholar]
- Abd-Elghany, K.; Bourell, D. Property evaluation of 304L stainless steel fabricated by selective laser melting. Rapid Prototyp. J. 2012, 18, 420–428. [Google Scholar]
- Liu, B.; Wildman, R.; Tuck, C.; Ashcroft, I.; Hague, R. Investigation the effect of particle size distribution on processing parameters optimisation in selective laser melting process. In Proceedings of the 2011 International Solid Freeform Fabrication Symposium, Austin, TX, USA, 8 August 2011. [Google Scholar]
- Lutter-Günther, M.; Horn, M.; Seidel, C.; Reinhart, G. Influence of Particle Size Distribution on Powder Flowability and Part Properties in Laser Beam Melting: Einfluss der Korngrößenverteilung auf Fließfähigkeit und Bauteilqualität beim Laserstrahlschmelzen. In Proceedings of the Rapid. Tech—International Trade Show & Conference for Additive Manufacturing, Proceedings of the 14th Rapid. Tech Conference, Erfurt, Germany, 20 June 2017; pp. 20–22. [Google Scholar]
- Baitimerov, R.; Lykov, P.; Zherebtsov, D.; Radionova, L.; Shultc, A.; Prashanth, K.G. Influence of powder characteristics on processability of AlSi12 alloy fabricated by selective laser melting. Materials 2018, 11, 742. [Google Scholar]
- Ahmed, M.; Pasha, M.; Nan, W.; Ghadiri, M. A simple method for assessing powder spreadability for additive manufacturing. Powder Technol. 2020, 367, 671–679. [Google Scholar]
- Beitz, S.; Uerlich, R.; Bokelmann, T.; Diener, A.; Vietor, T.; Kwade, A. Influence of powder deposition on powder bed and specimen properties. Materials 2019, 12, 297. [Google Scholar] [PubMed] [Green Version]
- Cordova, L.; Bor, T.; de Smit, M.; Campos, M.; Tinga, T. Measuring the spreadability of pre-treated and moisturized powders for laser powder bed fusion. AddItive Manuf. 2020, 32, 101082. [Google Scholar]
- Lefebvre, L.; Dai, J.; Thomas, Y.; Martinez-Rubi, Y. Metal powder flowability: Effect of humidity and impact on the reproducibility of the measurements. In Proceedings of the Additive Manufacturing with Powder Metallurgy Conference, Phoenix, AZ, USA, 23 June 2019. [Google Scholar]
- Le, T.-P.; Wang, X.; Davidson, K.P.; Fronda, J.E.; Seita, M. Experimental analysis of powder layer quality as a function of feedstock and recoating strategies. Addit. Manuf. 2021, 39, 101890. [Google Scholar]
- Hulme-Smith, C.N.; Hari, V.; Mellin, P. Spreadability Testing of Powder for Additive Manufacturing. BHM Berg-Und Hüttenmännische Mon. 2021, 166, 9–13. [Google Scholar]
- Lee, Y.; Simunovic, S.; Gurnon, K.A. Quantification of Powder Spreading Process for Metal Additive Manufacturing; Oak Ridge National Lab. (ORNL): Oak Ridge, TN, USA, 2019.
- Snow, Z.K. Understanding Powder Spreadability in Powder Bed Fusion Additive Manufacturing. Master’s Thesis, The Pennsylvania State University, State College, PA, USA, 2018. [Google Scholar]
- Van den Eynde, M.; Verbelen, L.; Van Puyvelde, P. Assessing polymer powder flow for the application of laser sintering. Powder Technol. 2015, 286, 151–155. [Google Scholar]
- Mehrabi, M.; Gardy, J.; Talebi, F.A.; Farshchi, A.; Hassanpour, A.; Bayly, A.E. An investigation of the effect of powder flowability on the powder spreading in additive manufacturing. Powder Technol. 2023, 413, 117997. [Google Scholar] [CrossRef]
- Lupo, M.; Ajabshir, S.Z.; Sofia, D.; Barletta, D.; Poletto, M. Experimental metrics of the powder layer quality in the selective laser sintering process. Powder Technol. 2023, 419, 118346. [Google Scholar] [CrossRef]
- Mitterlehner, M.; Danninger, H.; Gierl-Mayer, C.; Gschiel, H. Investigation of the Influence of Powder Moisture on the Spreadability Using the Spreading Tester. BHM Berg Hüttenmännische Mon. 2021, 166, 14–22. [Google Scholar]
- Yee, I. Powder Bed Surface Quality and Particle Size Distribution for Metal Additive Manufacturing and Comparison with Discrete Element Model. Master’s Thesis, California Polytechnic State University, San Luis Obispo, CA, USA, 2018. [Google Scholar]
- Escano, L.I.; Parab, N.D.; Xiong, L.; Guo, Q.; Zhao, C.; Fezzaa, K.; Everhart, W.; Sun, T.; Chen, L. Revealing particle-scale powder spreading dynamics in powder-bed-based additive manufacturing process by high-speed x-ray imaging. Sci. Rep. 2018, 8, 15079. [Google Scholar]
- Lhuissier, P.; Bataillon, X.; Maestre, C.; Sijobert, J.; Cabrol, E.; Bertrand, P.; Boller, E.; Rack, A.; Blandin, J.-J.; Salvo, L. In situ 3D X-ray microtomography of laser-based powder-bed fusion (L-PBF)—A feasibility study. Addit. Manuf. 2020, 34, 101271. [Google Scholar]
- Ali, U.; Mahmoodkhani, Y.; Shahabad, S.I.; Esmaeilizadeh, R.; Liravi, F.; Sheydaeian, E.; Huang, K.Y.; Marzbanrad, E.; Vlasea, M.; Toyserkani, E. On the measurement of relative powder-bed compaction density in powder-bed additive manufacturing processes. Mater. Des. 2018, 155, 495–501. [Google Scholar]
- Nan, W.; Ghadiri, M. Numerical simulation of powder flow during spreading in additive manufacturing. Powder Technol. 2019, 342, 801–807. [Google Scholar] [CrossRef]
- Nan, W.; Pasha, M.; Bonakdar, T.; Lopez, A.; Zafar, U.; Nadimi, S.; Ghadiri, M. Jamming during particle spreading in additive manufacturing. Powder Technol. 2018, 338, 253–262. [Google Scholar] [CrossRef]
- Haferkamp, L.; Liechti, S.; Spierings, A.; Wegener, K. Effect of bimodal powder blends on part density and melt pool fluctuation in laser powder bed fusion. Prog. Addit. Manuf. 2021, 6, 407–416. [Google Scholar] [CrossRef]
- Haferkamp, L.; Haudenschild, L.; Spierings, A.; Wegener, K.; Riener, K.; Ziegelmeier, S.; Leichtfried, G.J. The Influence of Particle Shape, Powder Flowability, and Powder Layer Density on Part Density in Laser Powder Bed Fusion. Metals 2021, 11, 418. [Google Scholar] [CrossRef]
- Balbaa, M.A.; Ghasemi, A.; Fereiduni, E.; Elbestawi, M.A.; Jadhav, S.D.; Kruth, J.P. Role of powder particle size on laser powder bed fusion processability of AlSi10mg alloy. Addit. Manuf. 2021, 37, 101630. [Google Scholar] [CrossRef]
- Phua, A.; Doblin, C.; Owen, P.; Davies, C.H.; Delaney, G.W. The effect of recoater geometry and speed on granular convection and size segregation in powder bed fusion. Powder Technol. 2021, 394, 632–644. [Google Scholar]
- Xue, K.; Zheng, Y.; Fan, B.; Li, F.; Bai, C. The origin of granular convection in vertically vibrated particle beds: The differential shear flow field. Eur. Phys. J. E 2013, 36, 8. [Google Scholar]
- Chen, H.; Chen, Y.; Liu, Y.; Wei, Q.; Shi, Y.; Yan, W. Packing quality of powder layer during counter-rolling-type powder spreading process in additive manufacturing. Int. J. Mach. Tools Manuf. 2020, 153, 103553. [Google Scholar] [CrossRef]
- Yao, D.; An, X.; Fu, H.; Zhang, H.; Yang, X.; Zou, Q.; Dong, K. Dynamic investigation on the powder spreading during selective laser melting additive manufacturing. Addit. Manuf. 2021, 37, 101707. [Google Scholar] [CrossRef]


| Powder Dispensing Module | Powder Spreading Mechanism | Weighing Module | |||
|---|---|---|---|---|---|
| Travel distance (mm) | 20 | Travel distance (mm) | 20 | Maximum capacity (g) | 465 |
| Dimensions (mm) | 120 × 50 | Dimensions (mm) | 100 × 100 | Sensitivity (g) | 0.01 |
| Displ. resolution (µm) | 10 ± 3 | Displ. resolution (µm) | 5 ± 1.5 | Max. system error (%) | ±0.017 |
| Spreading Arm Module | Spreading Forces Measurements Module | ||
|---|---|---|---|
| Speed range (mm/s) | 20–800 | Maximum capacity (N·m) | 20 |
| Mechanism | Modular, customizable | Sensitivity (N·mm) | 100 × 100 |
| Displ. resolution (µm) | 10 ± 3 | Maximum system error (%) | 5 ± 1.5 |
| Powder Bed Uniformity Evaluation Module | |
|---|---|
| 3D scanner sensitivity (µm) | 20 |
| Optical camera resolution (µm) | 100 × 100 |
| Evaluated area (mm) | 5 ± 1.5 |
| Layer Thickness (µm) | |||
|---|---|---|---|
| Recoating Speed (mm/s) | 30 | 60 | 100 |
| 100 | 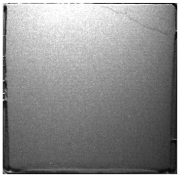 |  | 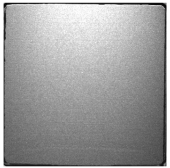 |
| 200 | 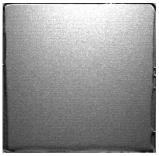 | 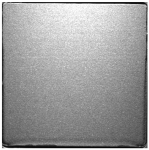 | 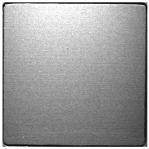 |
| 300 | 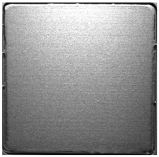 | 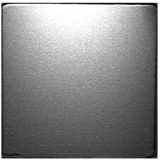 | 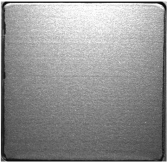 |
| 400 | 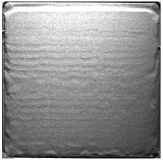 | 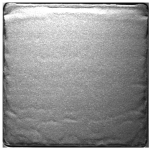 |  |
| 500 | 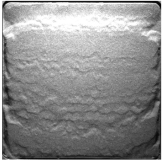 | 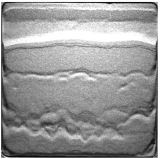 |  |
Disclaimer/Publisher’s Note: The statements, opinions and data contained in all publications are solely those of the individual author(s) and contributor(s) and not of MDPI and/or the editor(s). MDPI and/or the editor(s) disclaim responsibility for any injury to people or property resulting from any ideas, methods, instructions or products referred to in the content. |
© 2023 by the authors. Licensee MDPI, Basel, Switzerland. This article is an open access article distributed under the terms and conditions of the Creative Commons Attribution (CC BY) license (https://creativecommons.org/licenses/by/4.0/).
Share and Cite
Brika, S.E.; Brailovski, V. A Novel Apparatus for the Simulation of Powder Spreading Procedures in Powder-Bed-Based Additive Manufacturing Processes: Design, Calibration, and Case Study. J. Manuf. Mater. Process. 2023, 7, 135. https://doi.org/10.3390/jmmp7040135
Brika SE, Brailovski V. A Novel Apparatus for the Simulation of Powder Spreading Procedures in Powder-Bed-Based Additive Manufacturing Processes: Design, Calibration, and Case Study. Journal of Manufacturing and Materials Processing. 2023; 7(4):135. https://doi.org/10.3390/jmmp7040135
Chicago/Turabian StyleBrika, Salah Eddine, and Vladimir Brailovski. 2023. "A Novel Apparatus for the Simulation of Powder Spreading Procedures in Powder-Bed-Based Additive Manufacturing Processes: Design, Calibration, and Case Study" Journal of Manufacturing and Materials Processing 7, no. 4: 135. https://doi.org/10.3390/jmmp7040135