Article

Chemical Composition Effects on the Microstructure and Hot Hardness of NiCrSiFeB Self-Fluxing Alloys Manufactured via Gravity Casting

1
Foundation AZTERLAN, Basque Research and Technology Alliance (BRTA), Aliendalde Auzunea 6, 48200 Durango, Spain
2
LORTEK, Basque Research and Technology Alliance (BRTA), Arranomendia Kalea 4A, 20240 Ordizia, Spain
3
Instituto Universitario de Tecnología de Materiales (IUTM), Universitat Politècnica de València, Cami de Vera s/n., 46022 Valencia, Spain
4
CIDETEC, Basque Research and Technology Alliance (BRTA), Pº. Miramón 196, 20014 Donostia-San Sebastián, Spain
5
Ecole Centrale de Lyon, CNRS, ENTPE, Laboratoire de Tribologie et Dynamique des Systèmes, UMR5513, University of Lyon, 69130 Ecully, France
*
Author to whom correspondence should be addressed.
J. Manuf. Mater. Process. 2023, 7(6), 196; https://doi.org/10.3390/jmmp7060196
Submission received: 13 September 2023 / Revised: 31 October 2023 / Accepted: 1 November 2023 / Published: 4 November 2023

Abstract

:
Ni-Cr-Si-Fe-B self-fluxing alloys are commonly used in hardfacing applications; in addition, they are subjected to conditions of wear, corrosion, and high temperatures, but are not used in casting applications. In this work, gravity casting is presented as a potential manufacturing route for these alloys. Three alloys with different chemical compositions were investigated with a focus on microstructure characterization, solidification path, and strengthening mechanisms. Phases and precipitates were characterized using a field emission scanning electron microscope employing energy-dispersive X-ray spectroscopy, wavelength dispersive spectroscopy, and electron backscatter diffraction. Nano- and microhardness indentations were performed at different phases to understand their contribution to the overall hardness of the studied alloys. Hardness measurements were performed at room temperature and high temperature (650 °C). The borides and carbides were the hardest phases in the microstructure, thus contributing significantly to the overall hardness of the alloys. Additional hardening was provided by the presence of hard Ni3B eutectics; however, there was also a small contribution from the solid solution hardening of the γ-Ni dendrites in the high-alloy-grade sample. The amount and size of the different phases and precipitates depended mainly on the contents of the Cr, C, and B of the alloy.

1. Introduction

Nickel-based alloys of the NiCrSiFeB type are among the most widely used alloys for hardfacing applications that require corrosion and wear resistances at elevated temperatures [1]. Therefore, these alloys are excellent candidates (when the aim is to overcome the potential health issues caused by the presence of particles in cabin air that are produced due to the wear of cobalt alloys) for replacing cobalt-based alloys (stellites) in aeronautical components [2], such as sealing rings, valve seats, and sliding bearing seats.
The common coating techniques used for these alloys are flame spraying [3,4,5,6], plasma spraying [7,8,9], high-velocity oxygen fuel spraying (HVOF) [10,11,12], laser cladding [13,14,15,16,17], laser metal deposition (LMD) [18,19], non-vacuum electron beam cladding [20,21], laser powder bed fusion (LPBF) [22], and the plasma transferred arc welding (PTAW) processes [23]. All of these techniques have high solidification rates that can lead to different types of defects, and they can also enhance the porosity and cracking susceptibility of these materials [24].
The common defects in thermal spray coatings (flame, plasma, electric arc, HVOF, etc.) are oxide inclusions, unmolten particles, cracks, and porosity. Porosity appears due to splats that do not touch each other completely and are due to the presence of unmelted particles [25]. The approaches used to reduce porosity seek to optimize the process parameters, such as the nozzle diameter, neutral flame, and spray distance [4]. However, to achieve a dense and well-adhered coating, common post-treatments, such as flame [3,26], furnace [3,26], laser treatment [23,26,27,28,29], or induction remelting [30], have to be performed. These treatments reduce porosity, homogenize the microstructure, and improve the coating adherence. Also, the use of designed experiments and statistical methods has been widely applied so as to improve the performance of the Ni-based self-fluxing alloy coatings that are deposited by flame spraying, high-velocity oxy/air fuel spraying, plasma spraying, plasma-transferred arc welding, and laser cladding processes, as presented in the review of Simunovic et al. [31].
In laser metal depositions, a strong relation between the internal porosity of the powder particles and the resulting porosity in the deposited material has been observed [18]. Furthermore, in deposition technologies such as laser cladding and plasma-transferred arc welding, and also after remelting at elevated temperatures, the dissolution of the phases and dilution can be observed [2,32,33,34]. Dilution occurs when elements from the substrate penetrates into the deposit, and this may affect the properties of the alloy. Dissolution occurs due the decomposition of the hard reinforcement particles, such as WC, TiC, and TiN, at elevated temperatures, or due to the dissolution of some elements into the substrate or the coating [24,35].
On the other hand, the localized heating, rapid cooling, thermal cycles, and large thermal gradients induce severe residual stresses that can lead to cracks, especially at high alloy grades [24]. There have been many attempts to tackle the cracking problem by reducing the cooling rate of the deposits via pre-heating and post-heating [18,36,37], or via increasing the toughness of the alloys via compositional modification [38,39]. The gravity casting process could be a good alternative to the conventional manufacturing processes, since it shows several advantages, as shown in the SWOT analysis in Figure 1. The lower cooling rate in the gravity casting process could help reduce the cracking susceptibility and porosity. Additionally, there are no issues regarding coating adherence, dissolution, and dilution, and there is also no need for pre- and post-heat treatments. To the authors’ knowledge at the present time, this alloy family was not used as a fabrication material for this type of manufacturing process. Thus, there exists a great opportunity to introduce these materials into the gravity casting products and their respective markets, as well as in generating new knowledge regarding the microstructures and properties of these materials in casting applications.
Since no publications regarding the microstructures and properties of these alloys have been found in the literature, the microstructures observed in the materials fabricated using laser metal deposition techniques will be discussed in the following paragraph.
The microstructure of NiCrSiFeB alloys usually consists of a Ni solid solution matrix; Ni-B-Si binary and ternary eutectic phases that include Ni3B, Ni2B, and Ni3Si; Ni5Si2; as well as Cr-rich precipitates (borides and carbides) that have different sizes and morphologies depending on their chemical compositions and cooling rates. Hemmati et al. [40] reported that the phase formation in Ni-Cr-B-Si laser-deposited coatings mainly depends on the Cr content and Si/B ratio of the alloy. The Cr content of the alloys determines the quantity of the Cr-rich precipitates, while the Si/B ratio determines the nature of the eutectic structures. For the Si/B ratios that are less than three, the predominant eutectic will be the hard and brittle Ni-Ni3B, and when the ratio is above three, the eutectic will change to the soft Ni-Si type and Ni-Ni3Si.
The quantity and nature of the precipitates and eutectic phases are also affected by the cooling rate [13,19]. Wang et al. [19] observed that, at a faster cooling rate, eutectics take a larger proportion; meanwhile, Cr-rich precipitates are refined and dispersed uniformly. Hemmati et al. [13] studied the effects of the cooling rate on phase formations in Colmonoy 69 in DTA samples at different cooling rates (10 and 100 K/s). They found that increasing the cooling rate suppressed the formation of blocky primary borides, and that most of the microstructure consisted of floret-shape structures in a matrix of Ni along with Ni-B-Si eutectics.
In this work, the potential of using NiCrSiFeB alloys as manufacturing material in gravity casting with a low cooling rate was investigated. To the authors’ knowledge, this manufacturing process is not currently used for these types of alloys, and thus there is no research regarding the microstructure, strengthening mechanism, hardness, and wear properties of this alloy at elevated temperatures. In this investigation, the influence of the chemical composition on the microstructure, the hardness at room temperature and at high temperatures (up to 650 °C), and the hardening mechanisms of three NiCrSiFeB alloys (low and high alloy grades) were studied (the wear properties will be presented elsewhere). A maximum temperature of 650 °C was chosen for the hardness tests because these alloys were intended to be used as a manufacturing material for the sealing rings of butterfly valves used in the bleed system of aircrafts. The sealing rings suffer wear at high temperatures (up to 650 °C), what leads to leakage and the presence of oxidized Co wear particles (from the currently used Stellite 6 alloy) in the cabin air.

2. Materials and Methods

2.1. Casting Process

The melting of the alloys was carried out in an induction furnace with a capacity of 100 kg. The raw materials (pure graphite, nickel boron, pure silicon, pure chromium, and pure nickel) were introduced into the furnace and heated to a temperature of 1450 + 10 °C. Once the temperature was reached and the metal was molten, a steel sample was cast for chemical analysis, and—in the case it was necessary—the chemical composition was adjusted. Then, the metal was transferred to a preheated ladle with a capacity of 70 kg, and the metal was poured into cone-shaped sand molds (Figure 2a). The dimensions of the cone were as follows: height = 170 mm, Ø superior = 160 mm, and Ø inferior = 110 mm. The disc shape samples had a Ø = 25 mm and a height = 5 mm, and these were extracted from the lower part of the castings for microstructure analysis and hardness tests (Figure 2b). This area provided sound samples for testing.
The chemical compositions of the studied alloys are shown in Table 1. The content of each alloying element was determined in the cast samples with the following analytic techniques. The C contents were measured via combustion and infrared absorption, and the Fe, Ni, Cr, Si, and B contents were determined via spark atomic emission spectrometry.

2.2. Microstructural Analysis

For the metallographic analysis, transversal cross sections were prepared by grinding and polishing the alloys using standard procedures. To reveal the microstructure, a chemical reagent composed of 7 mL of HF, 3 mL of HNO3, and 5 mL of H2O (according to the ASTM E407 standard) was used. The transversal sections were extracted as indicated in Figure 2b, and they were characterized via light optical microscopy (OM) with a LEICA MEF4 microscope (LEICA MICROSYSTEMS GmbH, Wetzlar, Germany), as well as field emission scanning electron microscopy (FESEM) with a ZEISS Ultra Plus microscope (CARL ZEISS AG, Oberkochen, Germany). The FESEM was equipped with an EDS (Energy-Dispersive X-ray Spectroscopy) detector (X-Max) from Oxford Instruments, which allowed us to analyze the chemical composition of the phases and precipitates. In addition, with a WDS (Wavelength-Dispersive Spectroscopy) detector, we analyzed the lightweight element boron. Three measurements were performed for each phase. The phase identification was performed with an EBSD (Electron Backscatter Diffraction) detector (Symmetry) from Oxford Instruments. The area fraction and equivalent diameter of the carbides and borides were determined through the analysis of ten FESEM images taken at 80x (alloy C) and 150x (alloy A and B) using the Leica application suite V4.2 software. Figure 3 shows an example of the image analysis performed on Alloy C. The borides and carbides can be distinguished by morphology (borides have eutectics and carbides have a compact morphology) and color (borides are slightly darker than carbides), and they were analyzed separately, as shown in Figure 3b,c.
Thermo-Calc software (using the TCNI10 database) was used to perform the equilibrium and Scheil simulations to study the phases formed, their precipitation sequence, and the segregation phenomena during solidification.

2.3. Phase Identification Using X-ray Diffraction

Phase identification using X-ray diffraction (XRD) was carried out with a PANalytical Xpert PRO diffractometer, which was equipped with a copper tube (λCuKαmedia = 1.5418 Å, λCuKα1 = 1.54060 Å, and λCuKα2 = 1.54439 Å), a vertical goniometer (Bragg–Brentano geometry), a programmable divergence slit, a secondary graphite monochromator, and a PixCel detector. The instrumental conditions used were the following: the generator voltage and current were 40 KV and 40 mA, respectively; for the identification of the phases, the PANalytical X’pert HighScore software was used in combination with the PDF2 database of the ICDD (International Centre of Diffraction Data).

2.4. Micro- and Nanohardness Measurements of the Phases

It was considered interesting to measure the microhardness of the different phases formed during solidification, with the aim of understanding the hardness results and microstructures obtained. For these tests, an ultra microdurometer was used (model FISCHER HM2000) with a Vickers indenter (HV) and a load of 100 mN (HV0.01) for 10 s. A total of five indents were made for each phase. Microhardness analyses were performed on the phases of Alloy A and C (at room temperature (RT) and at 650 °C (HT)) in the transverse sections.
Additionally, nanoindentations were conducted on Samples A and C using an Agilent Technologies G-200 nanoindenter, with the aim to evaluate if both techniques (micro- and nanohardness) are suitable for the characterization of micro-precipitates, as well as determine the hardness of the nano-precipitates. The indentation tests were performed with a newly equipped diamond Berkovich tip. The indenter’s contact area was previously calibrated on a fused silica sample, thus ensuring a tip radius of <15 nm. The in-depth stiffness profile was obtained using the continuous stiffness measurement method. This method provides the hardness and elastic modulus profiles from the sample’s surface to the maximum indentation depth.
Two types of indentation arrays were tested on each sample. First, the square array of 100 indentations at a constant depth of 1200 nm, which were spaced 15 microns apart, was performed. This testing strategy served to obtain a statistical representation of all the phases present in each sample, as well as helped to subsequently determine the optimal depth range for averaging the results assigned to each detected phase (minimum and maximum depth for hardness (H), and the elastic modulus (E) calculation). Afterward, additional indentation arrays at a constant of a 500 nm depth were programmed on individual phases. This second testing approach aimed to enhance the precision of the results obtained for the hard and fine phases, particularly carbides and borides. In this case, the indentation localization was ensured by using an optical microscope that was coupled to nanoindenter equipment. A Poisson’s coefficient of 0.3 was employed for Young’s modulus calculation for all samples.

2.5. Hot Hardness Tests

The hot hardness measurements were performed using a MacroMet 5112 Vickers hardness tester, from Buehler, Leinfelden-Echterdingen, Germany which was modified to work at elevated temperatures. This tool incorporated a WC Vickers tip, and that material was chosen to avoid the diffusion between the nickel (or other chemical elements of the sample) and the tip. A heating system permits heating the sample up to 650 °C. A water cooling system topped by an insulating plate was installed below the heating system, and a thermal shield was installed above the sample to avoid the heating of the hardness tester components. For temperature control, a K-type thermocouple was inserted in a hole in the samples.
The samples used were disks with a 25 mm diameter and 5 mm thickness. During the test, 5–6 indentations were made at each temperature, i.e., at 25 °C, 200 °C, 300 °C, 450 °C, and 650 °C, on each sample. A 500 g load (this load staying constant for 5 s) was applied for each indentation. The hardness was obtained by measuring the diagonals of the indentations after cooling, using an optical microscope.

3. Results and Discussion

3.1. Microstructure Characterization Using Optical Microscopy

The microstructure of the three alloys is shown in Figure 4 and Figure 5. The main phases observed were γ-Ni dendrites, eutectic phases, and blocky Cr carbides; moreover, the eutectic Cr borides were identified via FESEM/EDS/WDS/EBSD analysis. In Alloys A and B, only a few Cr borides were present; meanwhile, in Alloy C, plenty of large Cr eutectic borides, as well as blocky and irregular-shaped Cr carbides, were observed (Figure 5). Furthermore, Alloy C also had particularly fine and dispersed precipitates in the center of the γ-Ni dendrites. Eutectic Cr borides were observed within the γ-Ni dendrites (Figure 5c), while carbides appeared in the interdendritic regions together with the eutectic Ni3B phases. According to the microstructure observations, the solidification sequence proposed is as follows:
Liquid → Liquid + Cr boride → Liquid + Cr boride + γ-Ni → Cr boride + γ-Ni + Cr carbide + Eutectics.
The subsequent advanced microstructural characterization via FESEM, the micro- and nano-hardness indentation, and the hot hardness tests were performed on Alloys A and C.

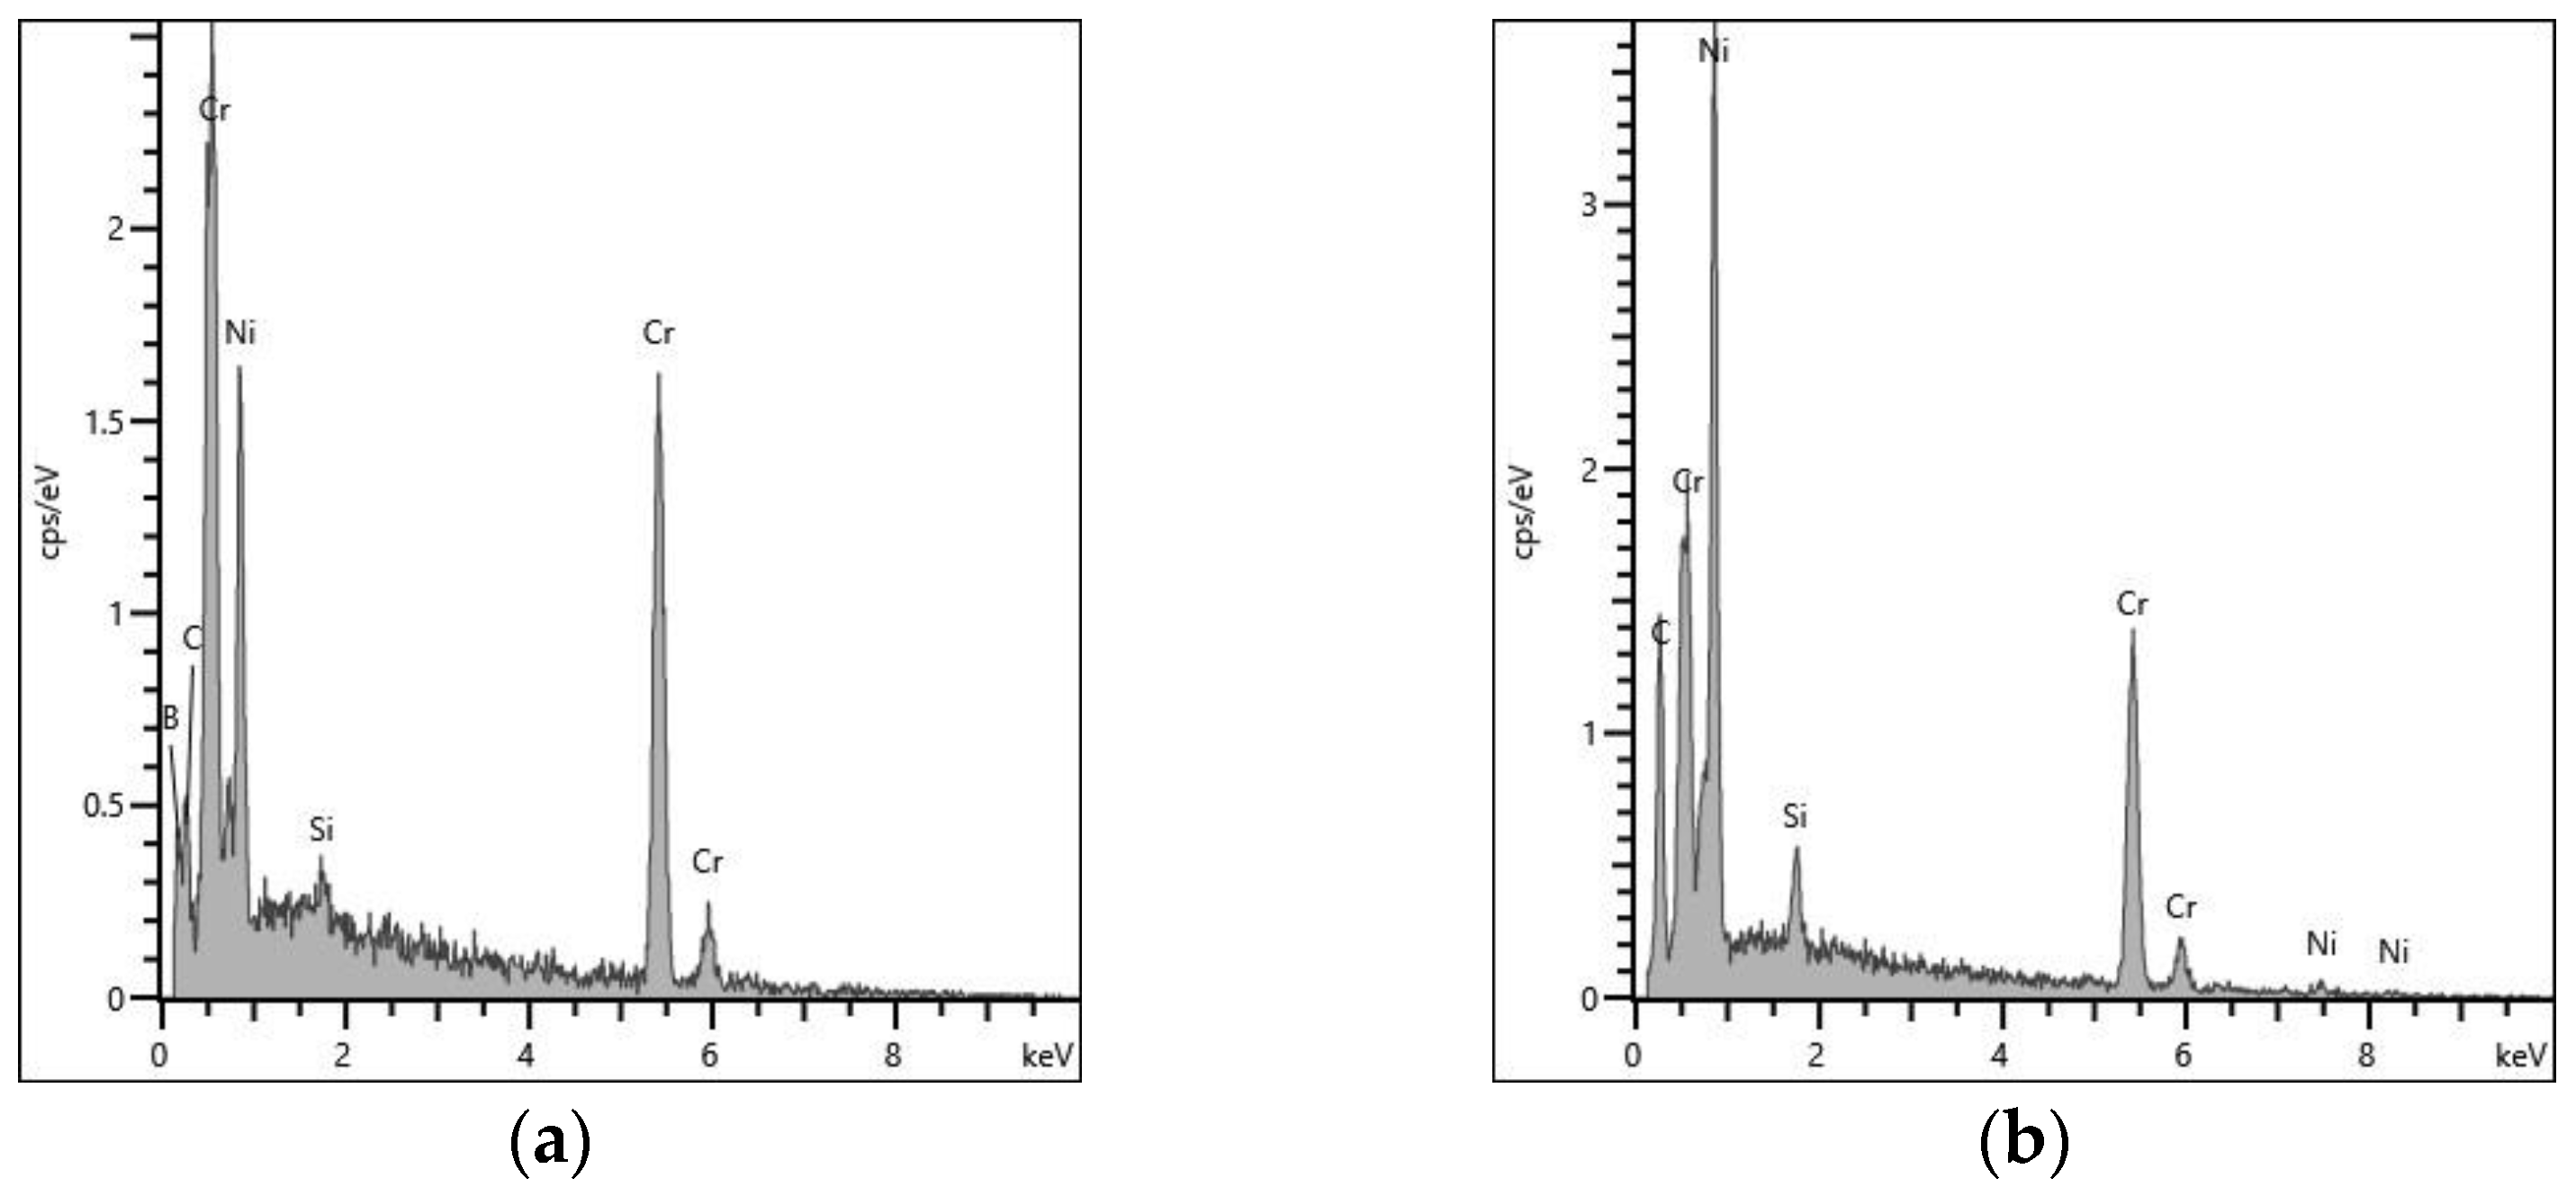
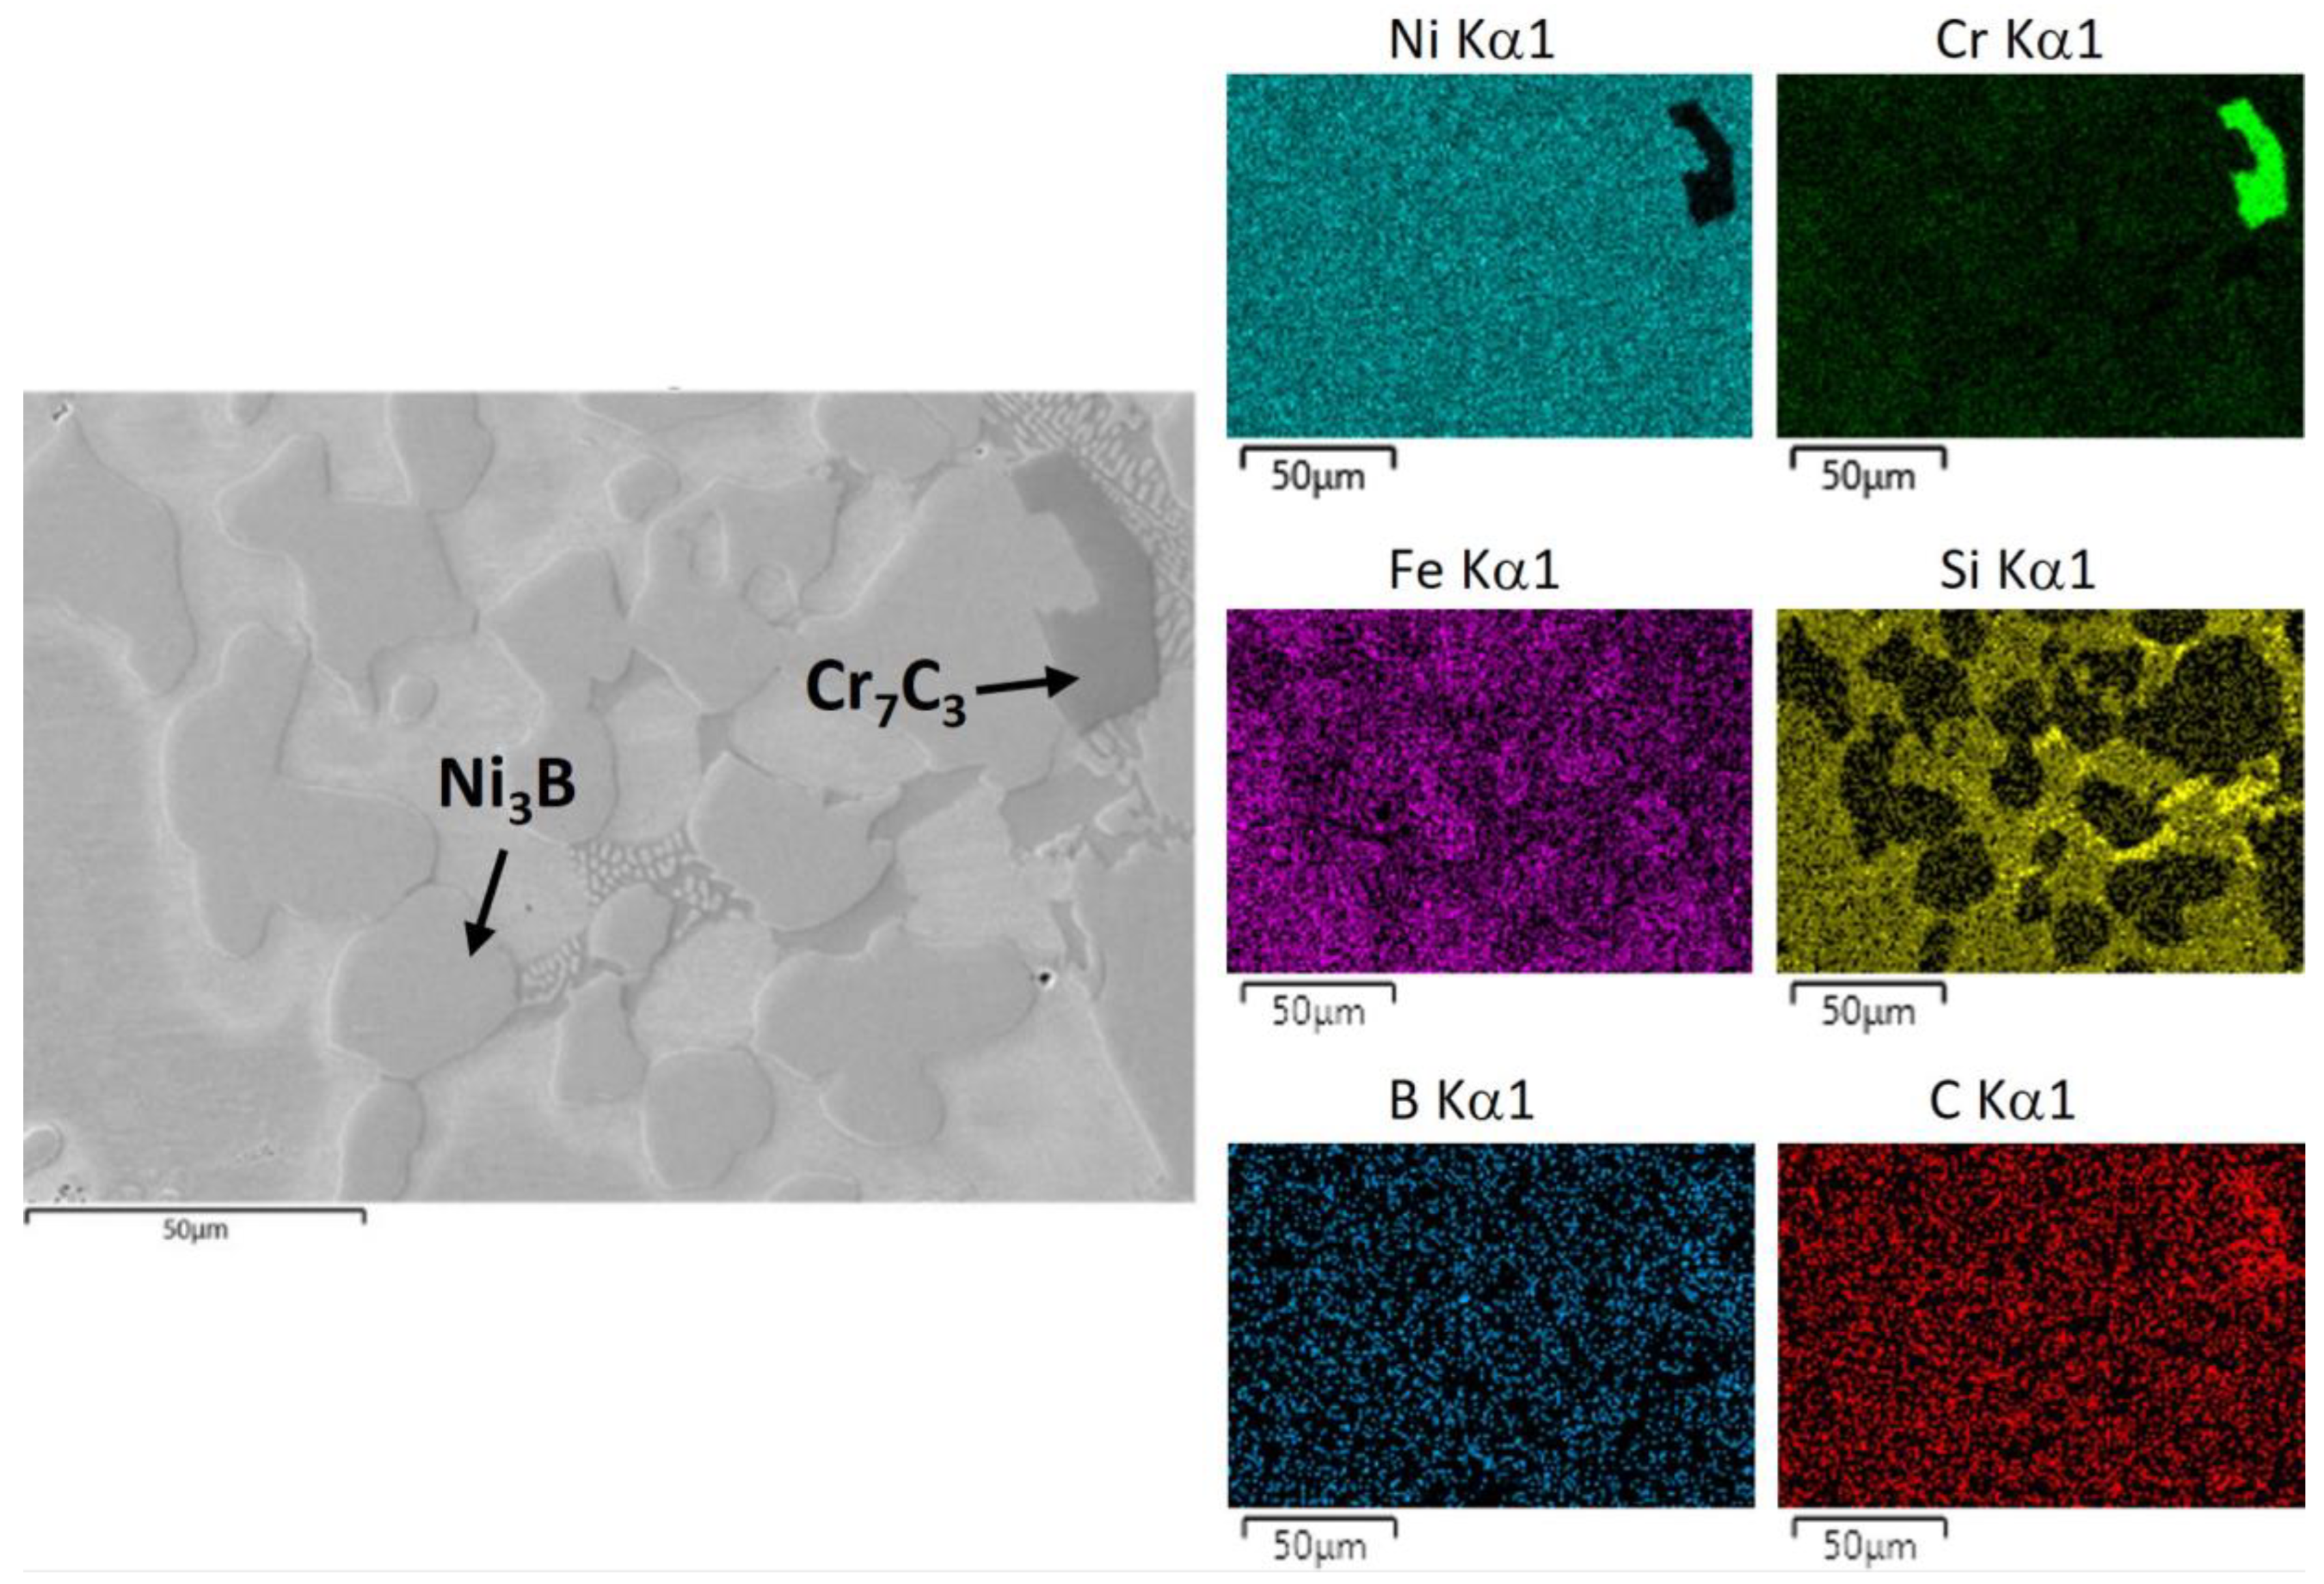
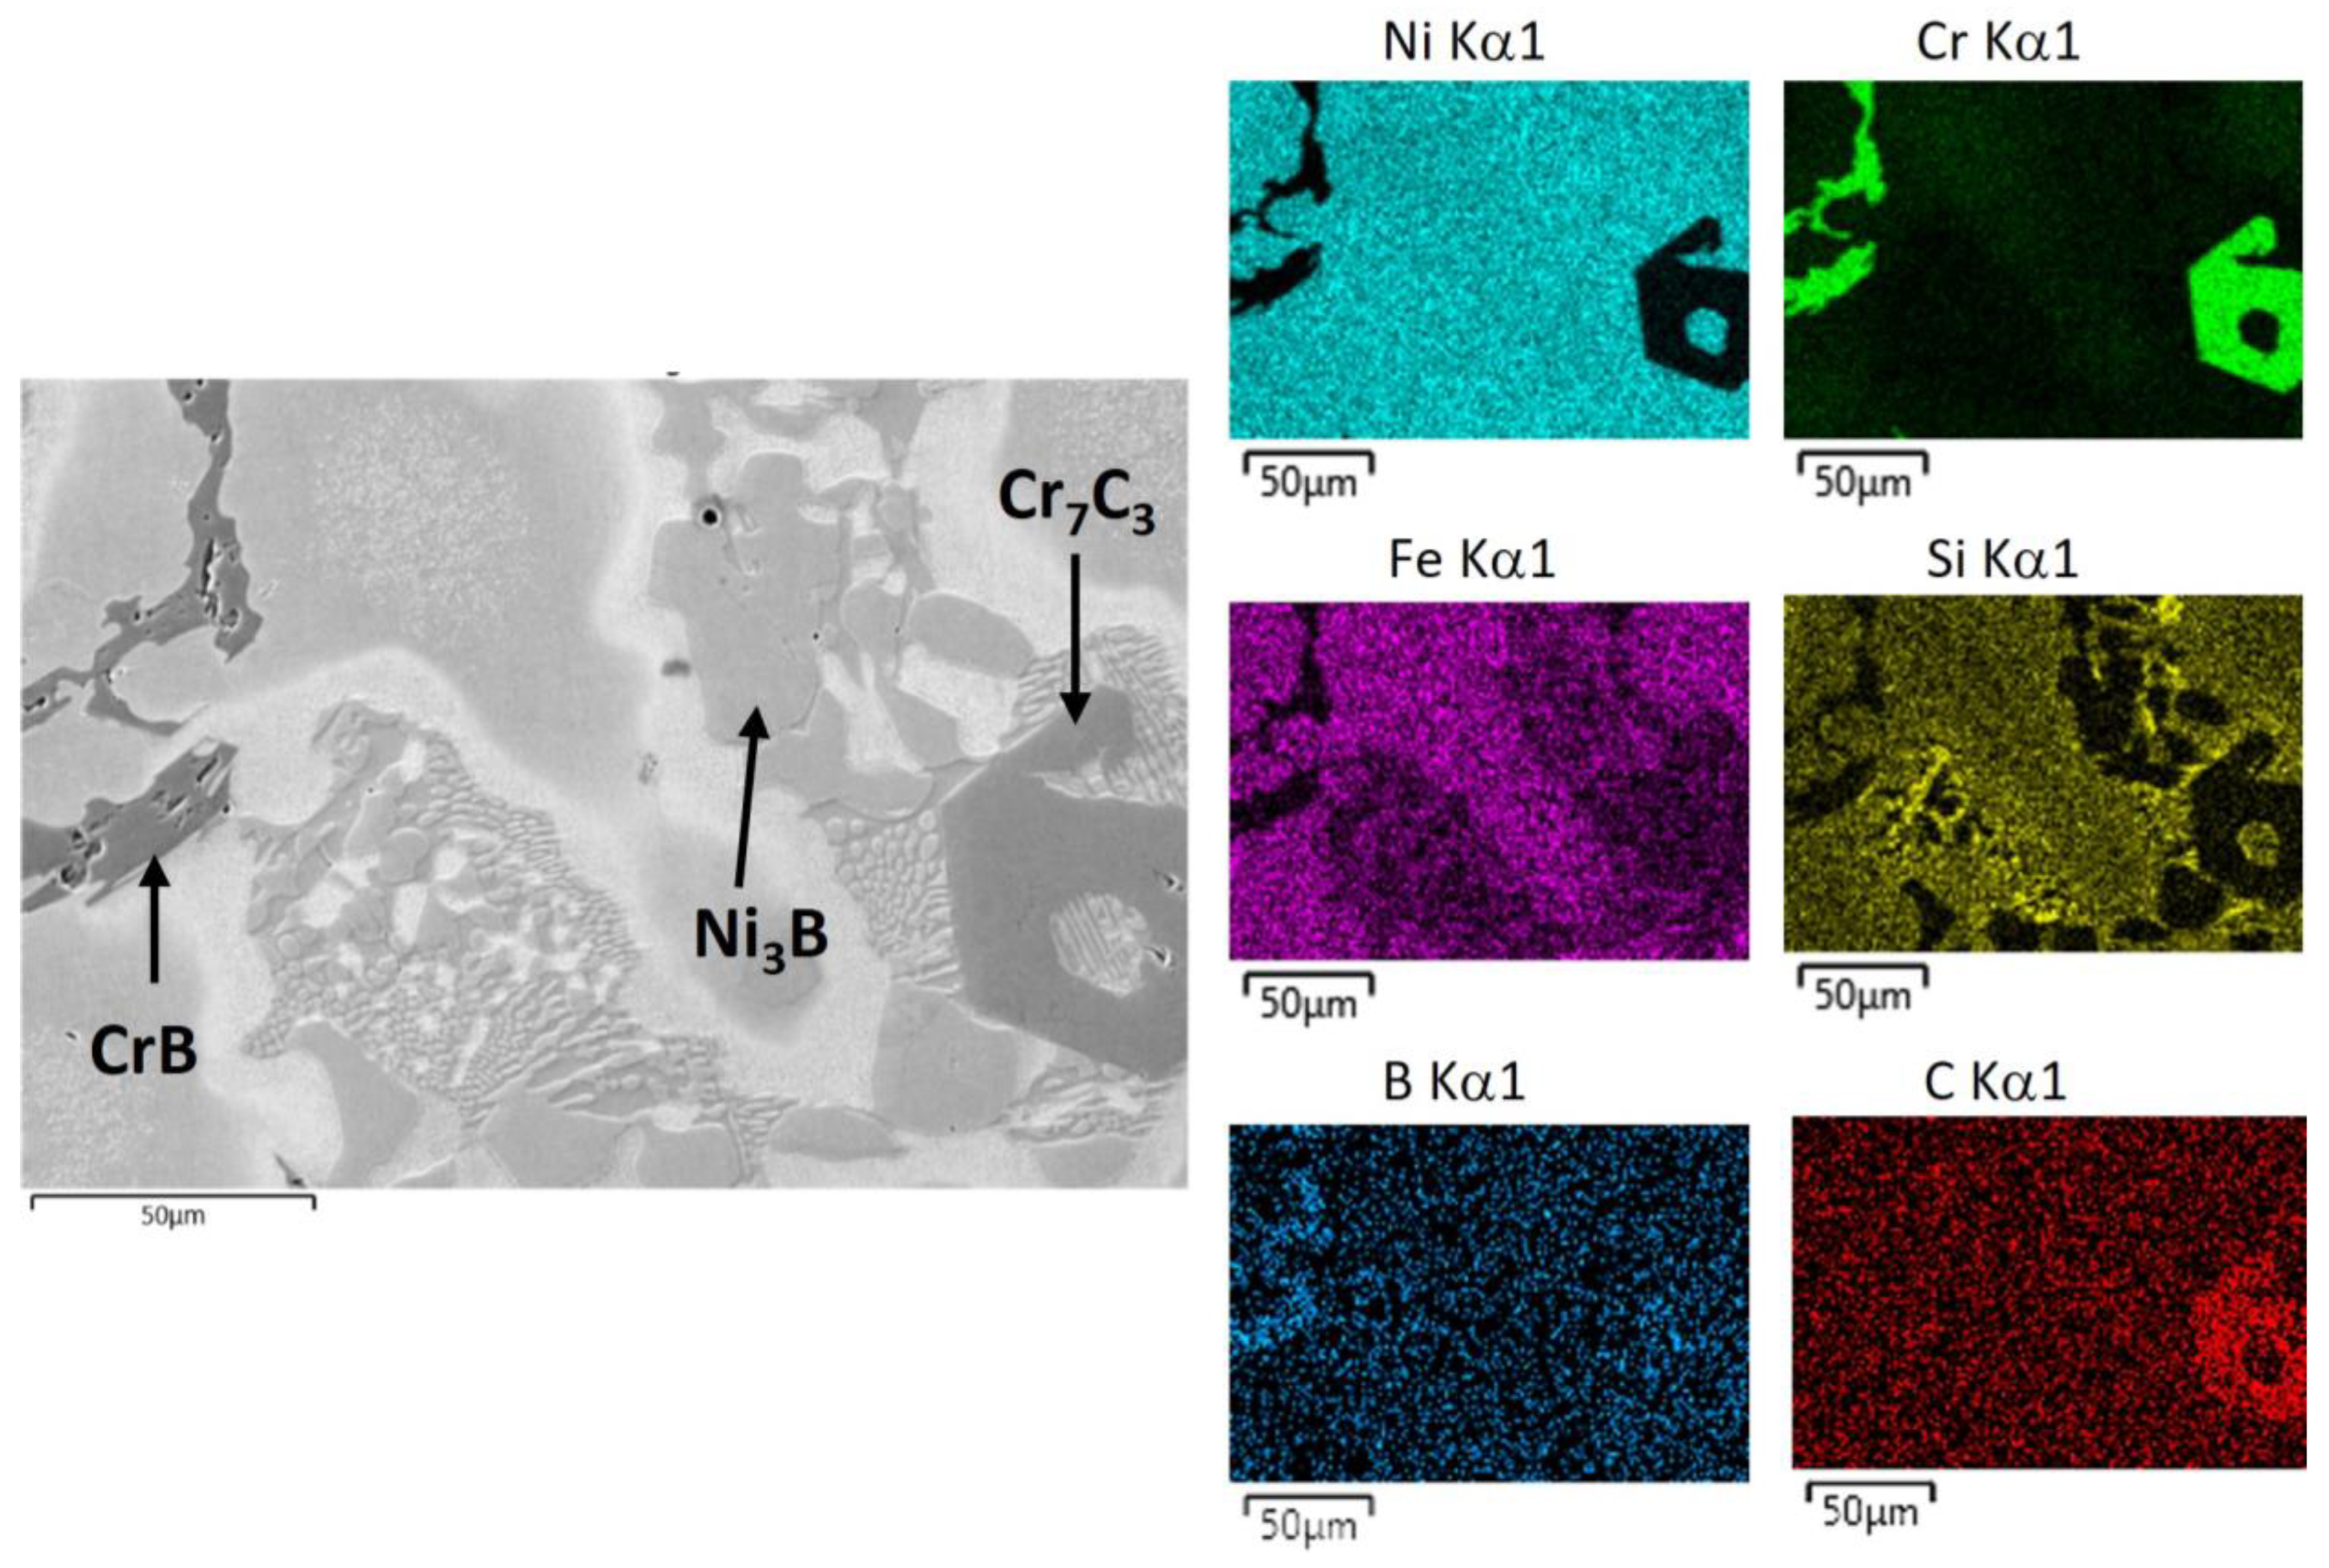
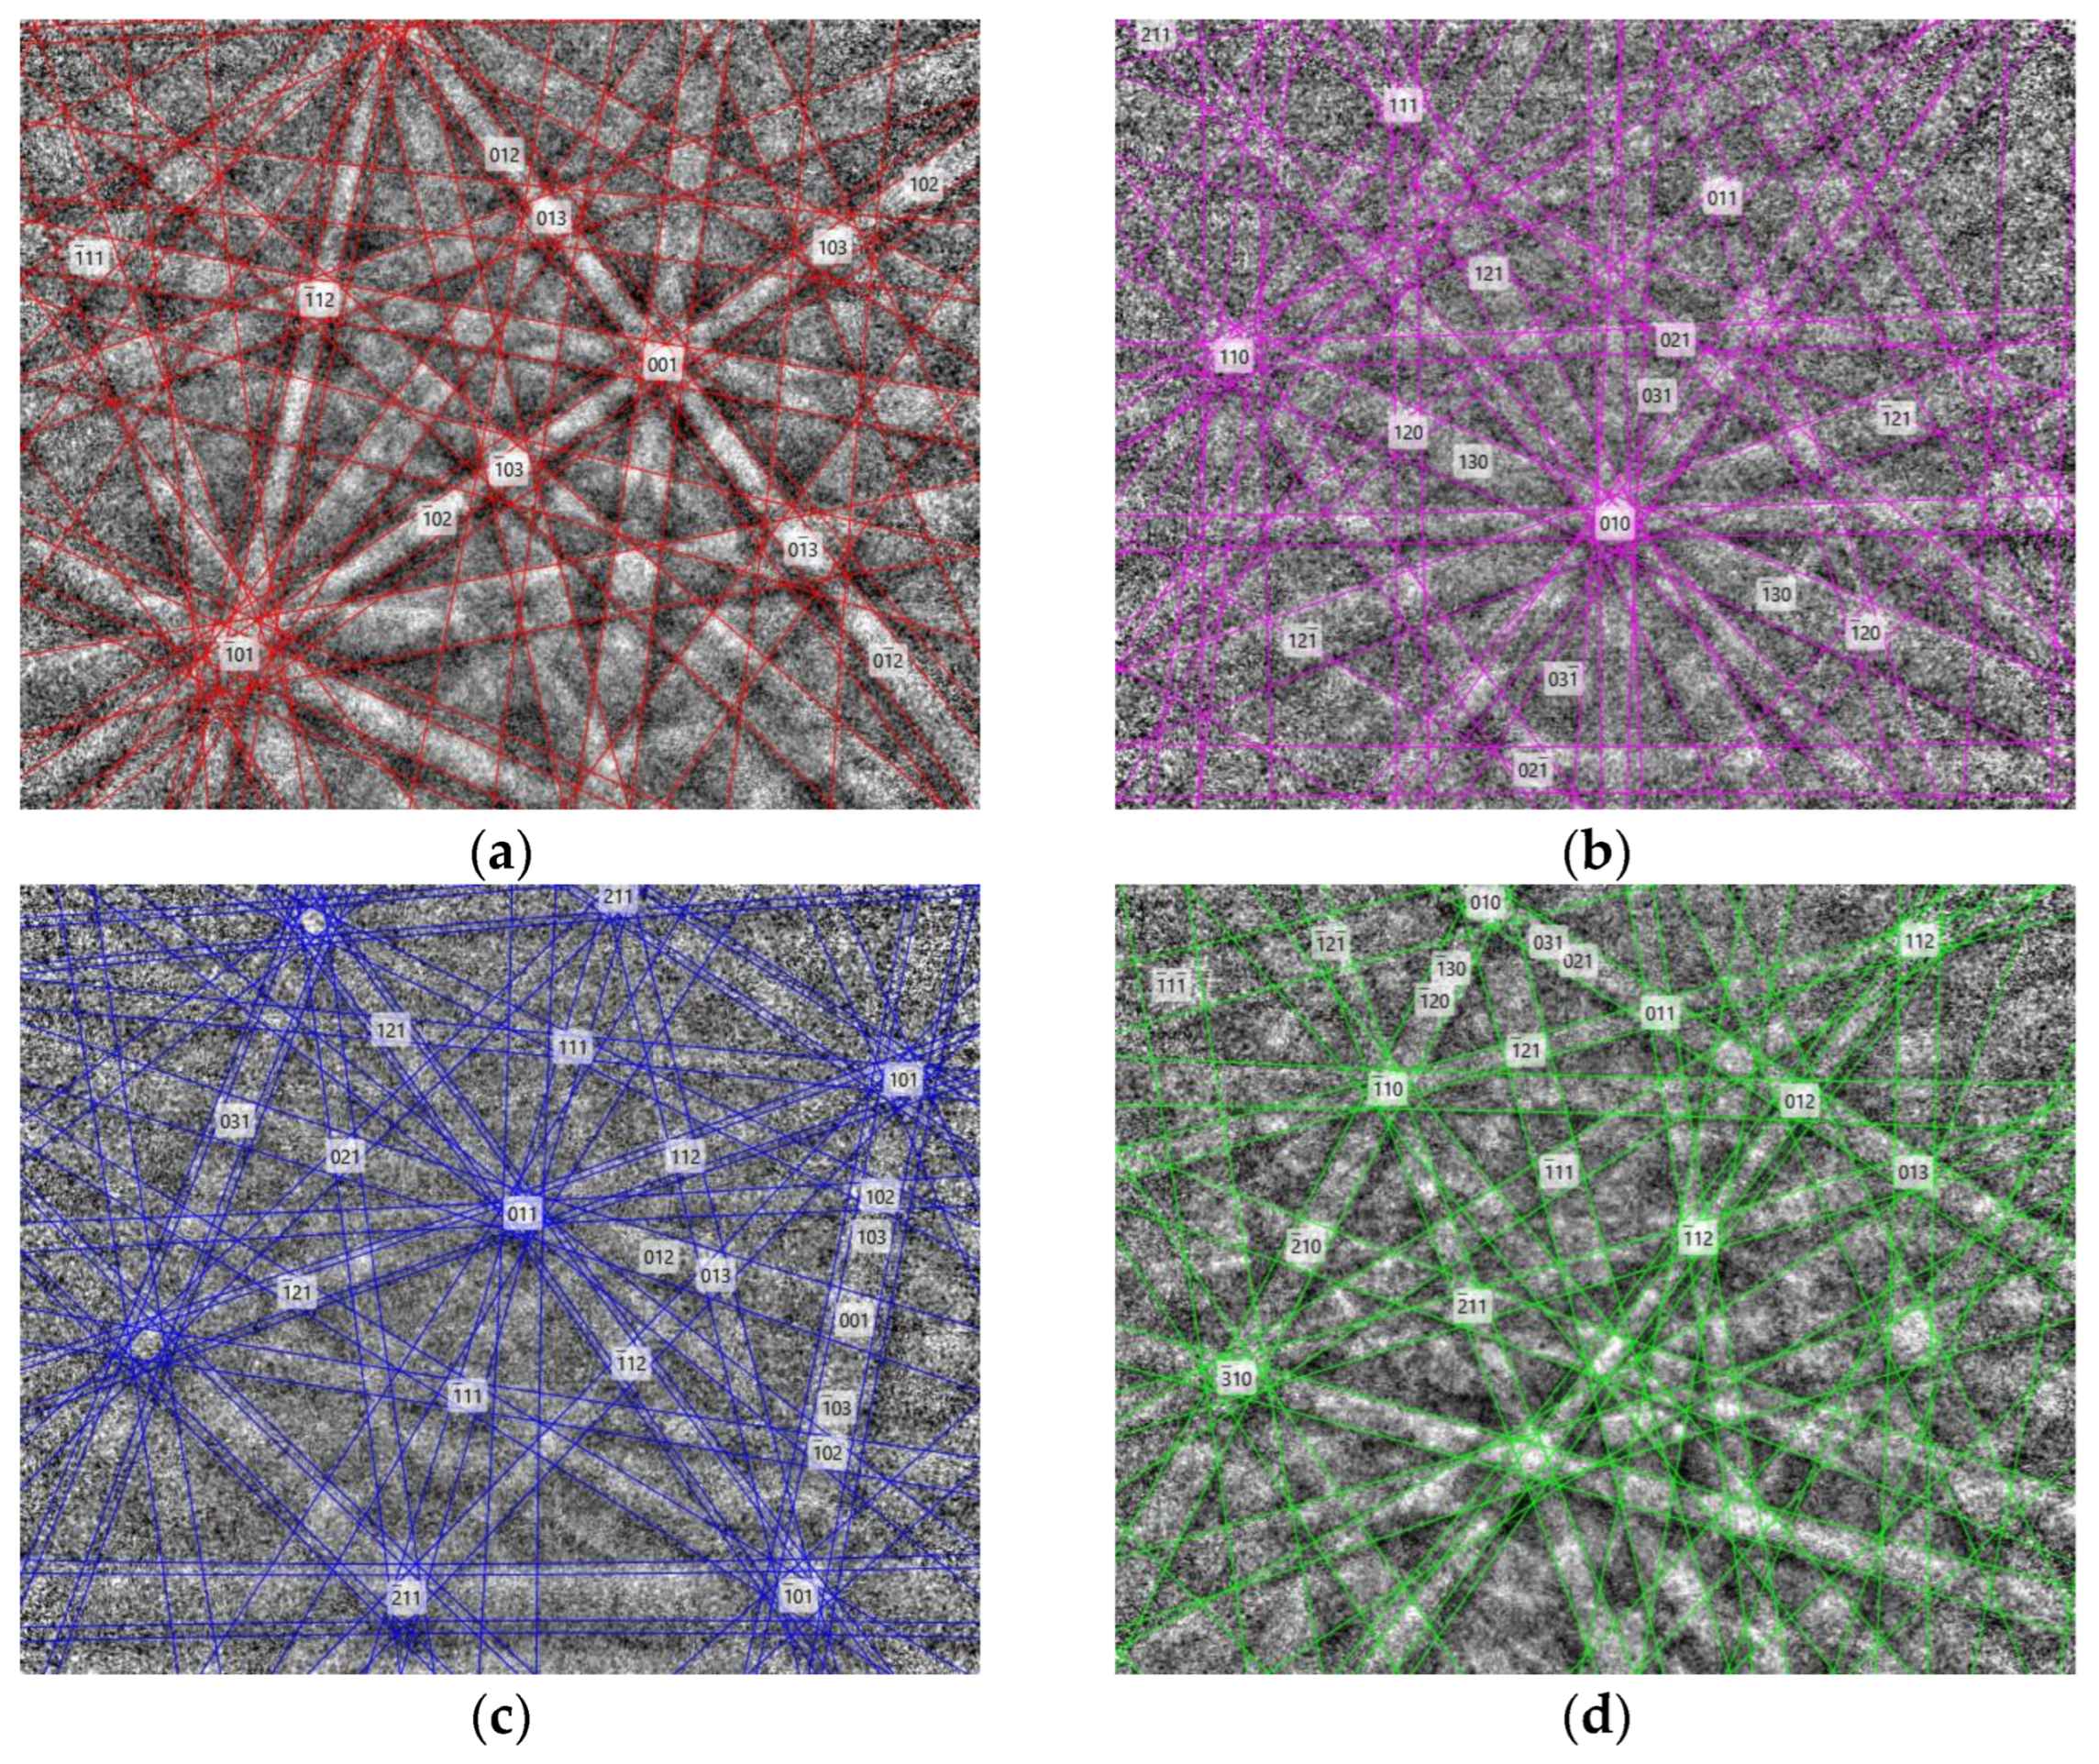
3.2. Phase Identification via FESEM/EDS/WDS/EBSD

The different phases and their chemical compositions (obtained through EDS analysis at 20 kV) are shown in Figure 6 and Figure 7, and Table 2. The matrix phase (γ-Ni) is a solid solution of Ni with some Cr, Si, and Fe. The content of Si and Fe in this phase increased with the alloying element content (Alloy C). Additionally, Alloy C showed the precipitation of especially fine rod-shaped Cr carbides (length = 0.5–3 μm) and cube-shaped Cr borides (length = 200–400 nm) in the center of the γ-Ni dendrites (Figure 7c). Due to the small size of these precipitates, which were most likely smaller than the EDS analysis volume, certain amounts of the γ-Ni matrix could be included in the EDS analysis result; therefore, only the spectra obtained at the low voltage of 10 kV are shown in Figure 8. These precipitates were not observed by Pereira et al. [18] when they were studying an alloy with a similar chemical composition that was fabricated via laser metal deposition (LMD); it is most likely that the faster solidification rate suppressed the formation of these precipitates. Furthermore, in both alloys, nano-sized precipitates (100–300 nm) with a butterfly or cube shape were detected at the borders of the γ-Ni matrix, which was close to the eutectic phases (Figure 6b and Figure 7b). These precipitates were also not detected in the LMD samples. Due to their small size, it was not possible to determine their chemical composition. Higher-resolution techniques such as TEM could be used to clearly identify this phase. Butterfly-shaped precipitates were identified as Cr5B3 in the study of [13] in Colmonoy 69 (Ni bal., Cr = 16.5 wt.%, Fe = 3 wt.%, Si = 4.8 wt.%, C = 0.55 wt.%, B = 3.6 wt.%, Mo = 3.5 wt.%, and Cu = 2.1 wt.%). However, in that study, these phases also had a larger size than in our study. It is possible that these precipitates were formed due to the segregation of boron, while the fine borides and carbides in the center could have been precipitated directly in the initial liquid.
Furthermore, large eutectic borides (boride/γ-Ni) and primary carbides were observed in Alloy C, and both precipitates were rich in Cr. In Alloy A, it was mainly Cr carbides that were observed, as well as a very small number of Cr borides. The Cr carbides showed an irregular blocky morphology, and they were precipitated in the interdendritic spaces along with the eutectic phases, thus indicating that they formed during a late stage of solidification. In Alloy C, plenty of eutectic borides with a star-shape structure were observed, but no primary borides. According to the results obtained by Hemmati et al. [13], in DTA samples, an increase in the cooling rate from 10 to 100 K/s suppressed the formation of primary borides. At 100 K/s, they observed a eutectic floret-shape structure consisting of Ni and borides. However, in the LMD samples of Alloy C, which were produced at a rapid solidification rate, only fine and blocky primary borides were observed [18].
Furthermore, two eutectics with different morphologies were observed: a coarse eutectic with a globular morphology and a fine eutectic with a lamellar morphology. The coarse eutectic was composed of a hard (i.e., an elevated phase in the SE image) Ni-B-Cr-Fe phase (Ni3B) and a soft γ-Ni. On the other hand, the fine eutectic consisted of Ni-B-Cr-Fe (Ni3B) and soft Ni-Si-Cr-Fe (Ni3Si) (i.e., the lower phase in the SE image in Figure 6a and Figure 7a). Nevertheless, in the hard Ni-B-Cr-Fe, the presence of boron could not be detected clearly in the EDS map at 15 kV (Figure 9d), it was detected at 5 kV (Figure 9a), as well as in the WDS map at 15 kV (Figure 9b,c). According to the literature [40], for a Si/B ratio below three, the predominant eutectic phase is Ni3B. The TEM investigations of Hemmati et al. [41] showed that the eutectic structures at the high alloy grade Colmonoy 69 were combinations of both the equilibrium and non-equilibrium binary and ternary eutectics phases such as Ni3B, Ni2B, and Ni3Si.
In Figure 10 and Figure 11, it can be observed how the alloying elements are distributed within different phases. The borides and carbides were rich in chromium. Si appears in solid solution of the γ-Ni matrix and in the fine eutectic, most likely as Ni3Si or Ni5Si2. The results of the EDS analysis (Table 2) indicate that the borides were Cr4B in Alloy A and CrB in Alloy C. Since the carbon content obtained via EDS analysis is not reliable, it was not possible to identify the carbides using stoichiometry. However, in both alloys, the carbides were indexed via EBSD as Cr7Cr3 carbides, and, in Alloy C, the borides were indexed as CrB. No borides were detected in the small EBSD analysis sample of alloy A. The hard phase in the fine and coarse eutectic was indexed as Ni3B. An example of the phase indexation in Alloy C is shown in Figure 12. Figure 13 and Figure 14 show the EBSD phase maps and the calculated area fractions of the phases of both alloys. Please note that certain areas were not indexed (zero solutions), and that these areas mainly correspond to the fine eutectic, which—at this magnification—cannot be resolved properly. Alloy C, with its higher amounts of Cr, B, and C, shows the presence of γ-Ni, Ni3B, CrB borides, and Cr7Cr3 carbides. In the analyzed images, Alloy C shows a higher area fraction of Cr-rich carbides and borides (Cr7C3 = 6.44%, CrB = 7.11%) compared with Alloy A (Cr7C3 = 4.02%), whereas the Ni3B area fraction was higher in Alloy A (Ni3B = 34.14%) than in Alloy C (23.97%).

3.3. Identification of the Phases via X-ray Diffraction (XRD)

The results of the XRD analysis of Alloy A and Alloy C are shown in Figure 15. Although the peak intensity of the different phases did not always correspond to the patterns used for phase identification, the peak positions coincided. The change in intensity was most likely related to the number of particles and their orientations with respect to those corresponding to an ideal sample (in which many particles would be randomly oriented). In Alloy A, the phases identified were γ-Ni and Ni3B. The other phases observed on FESEM examination, such as carbides and Ni3Si, were probably below the detection limit of this technique (1–3%). Additionally, in Alloy C, CrB and Cr7C3 were detected. In general, the phases identified via DRX agreed with the results of the EBSD analysis.

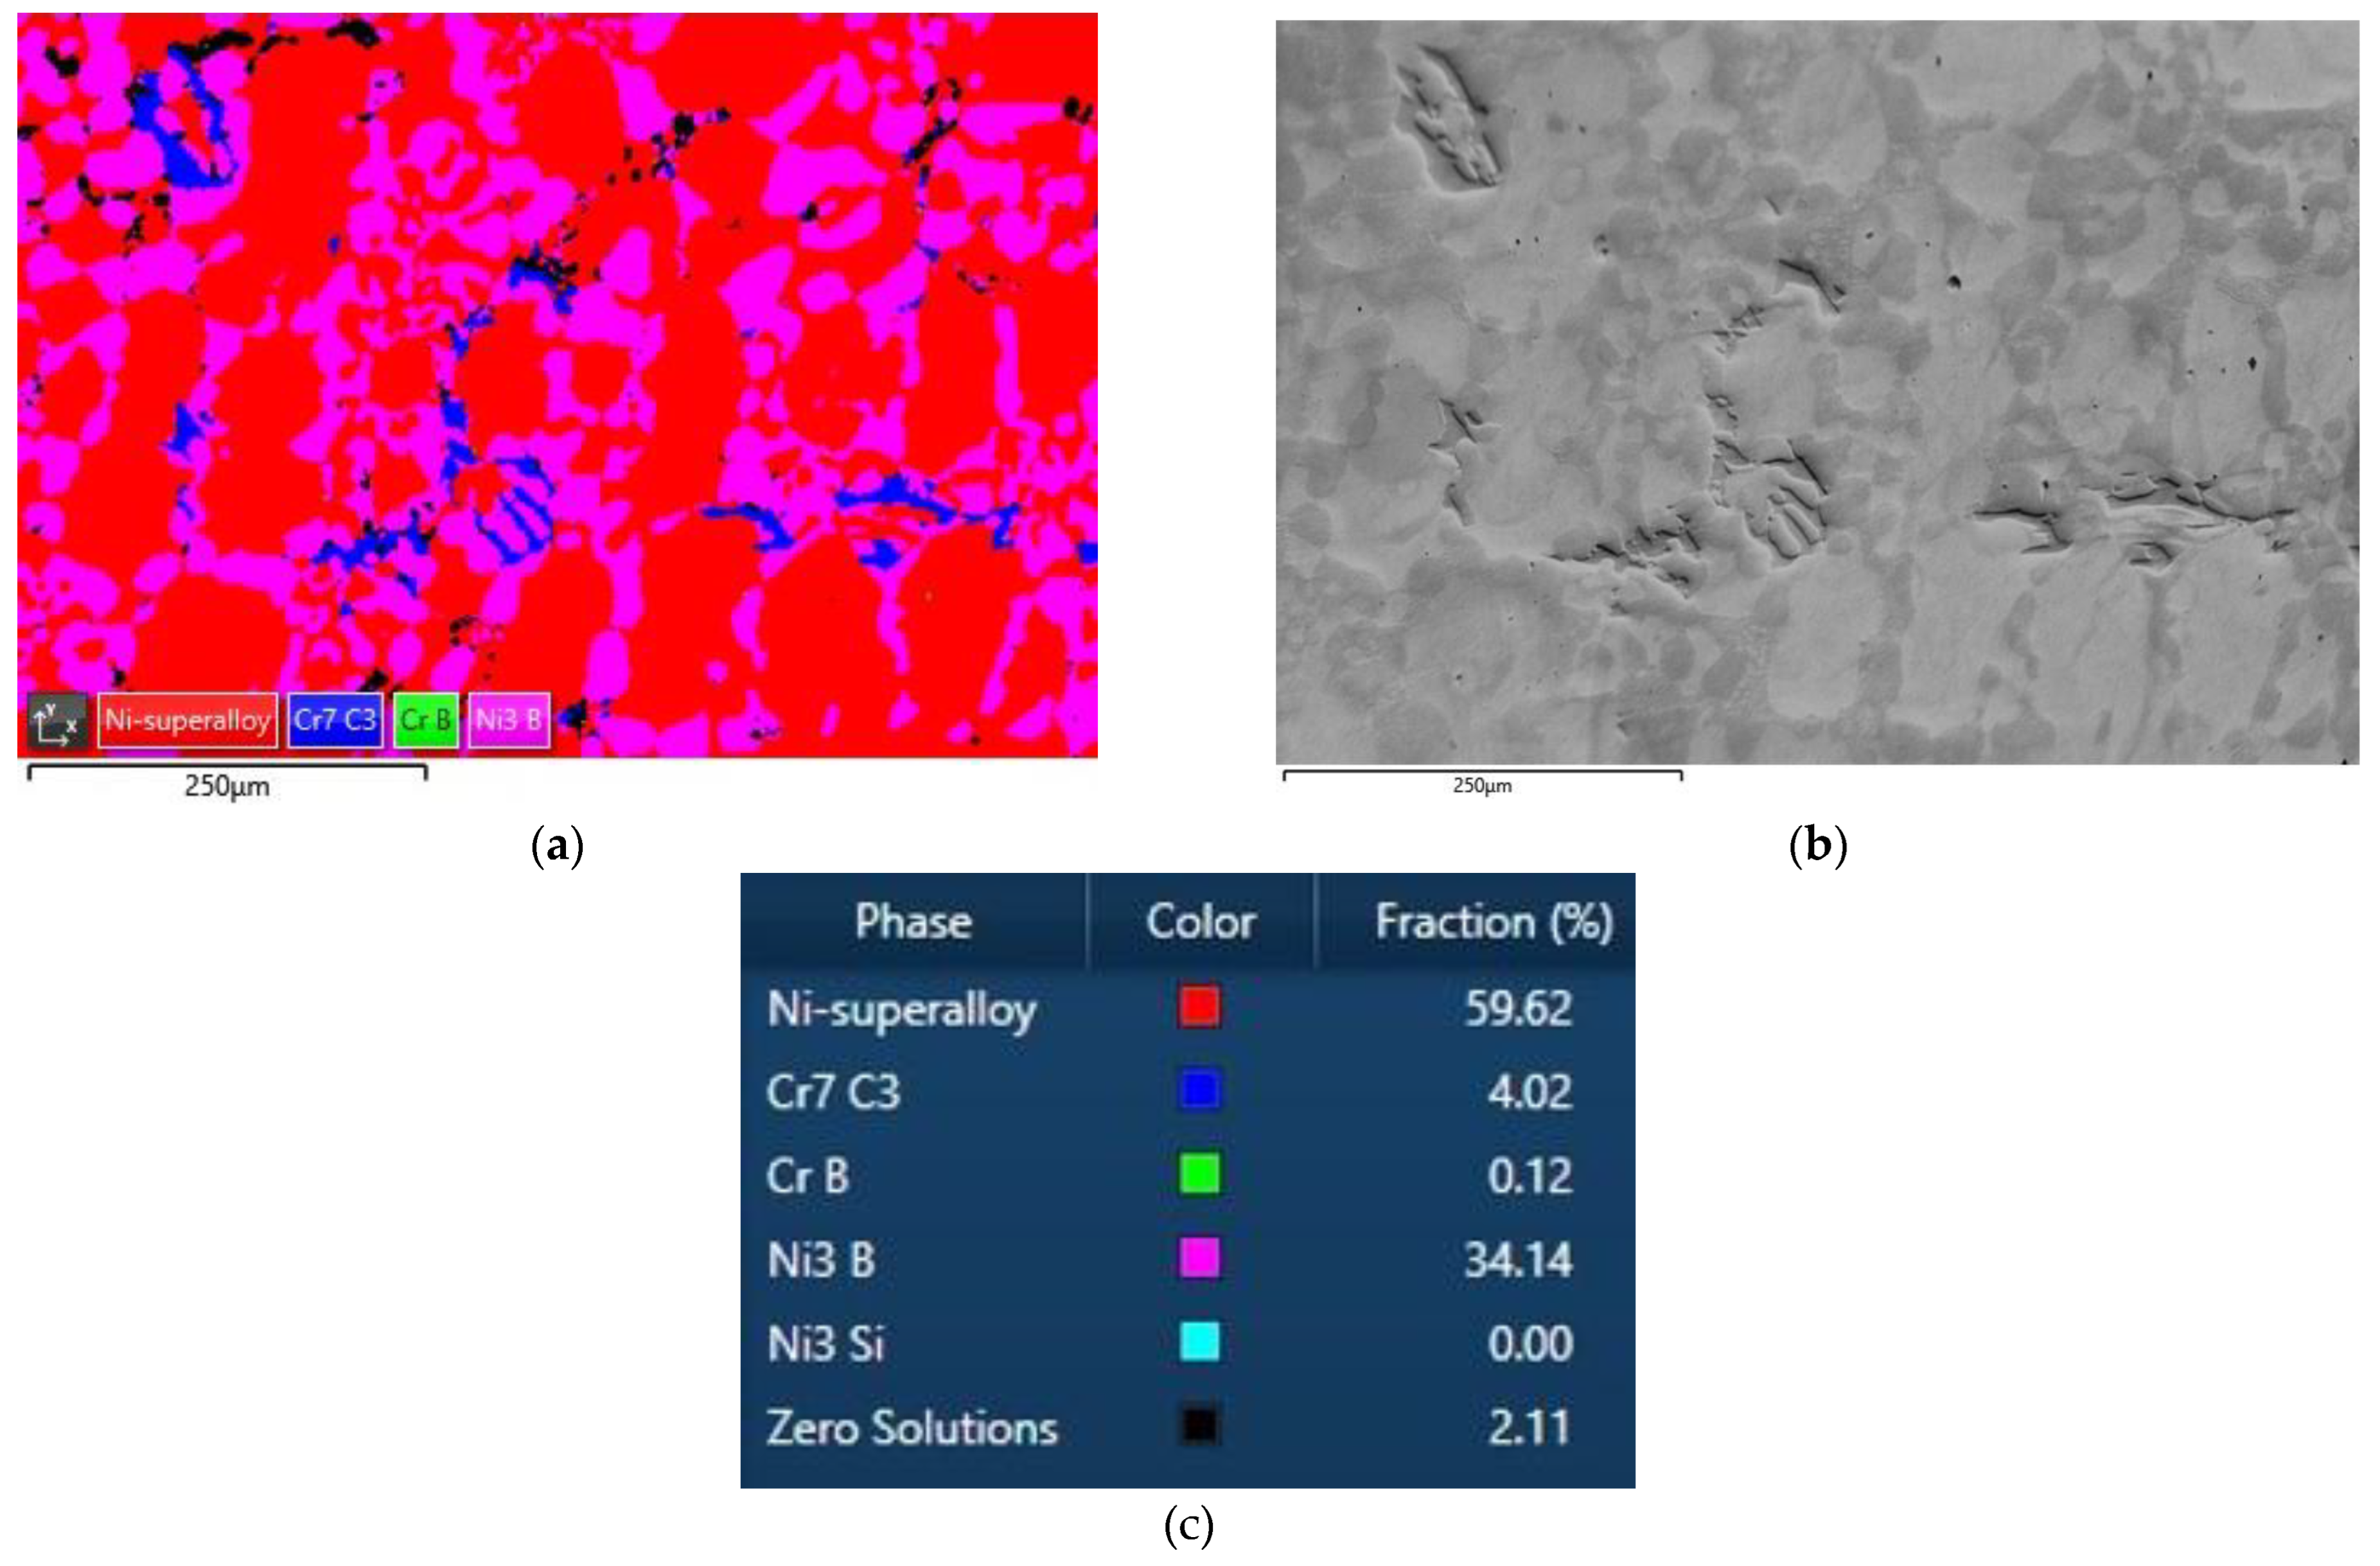
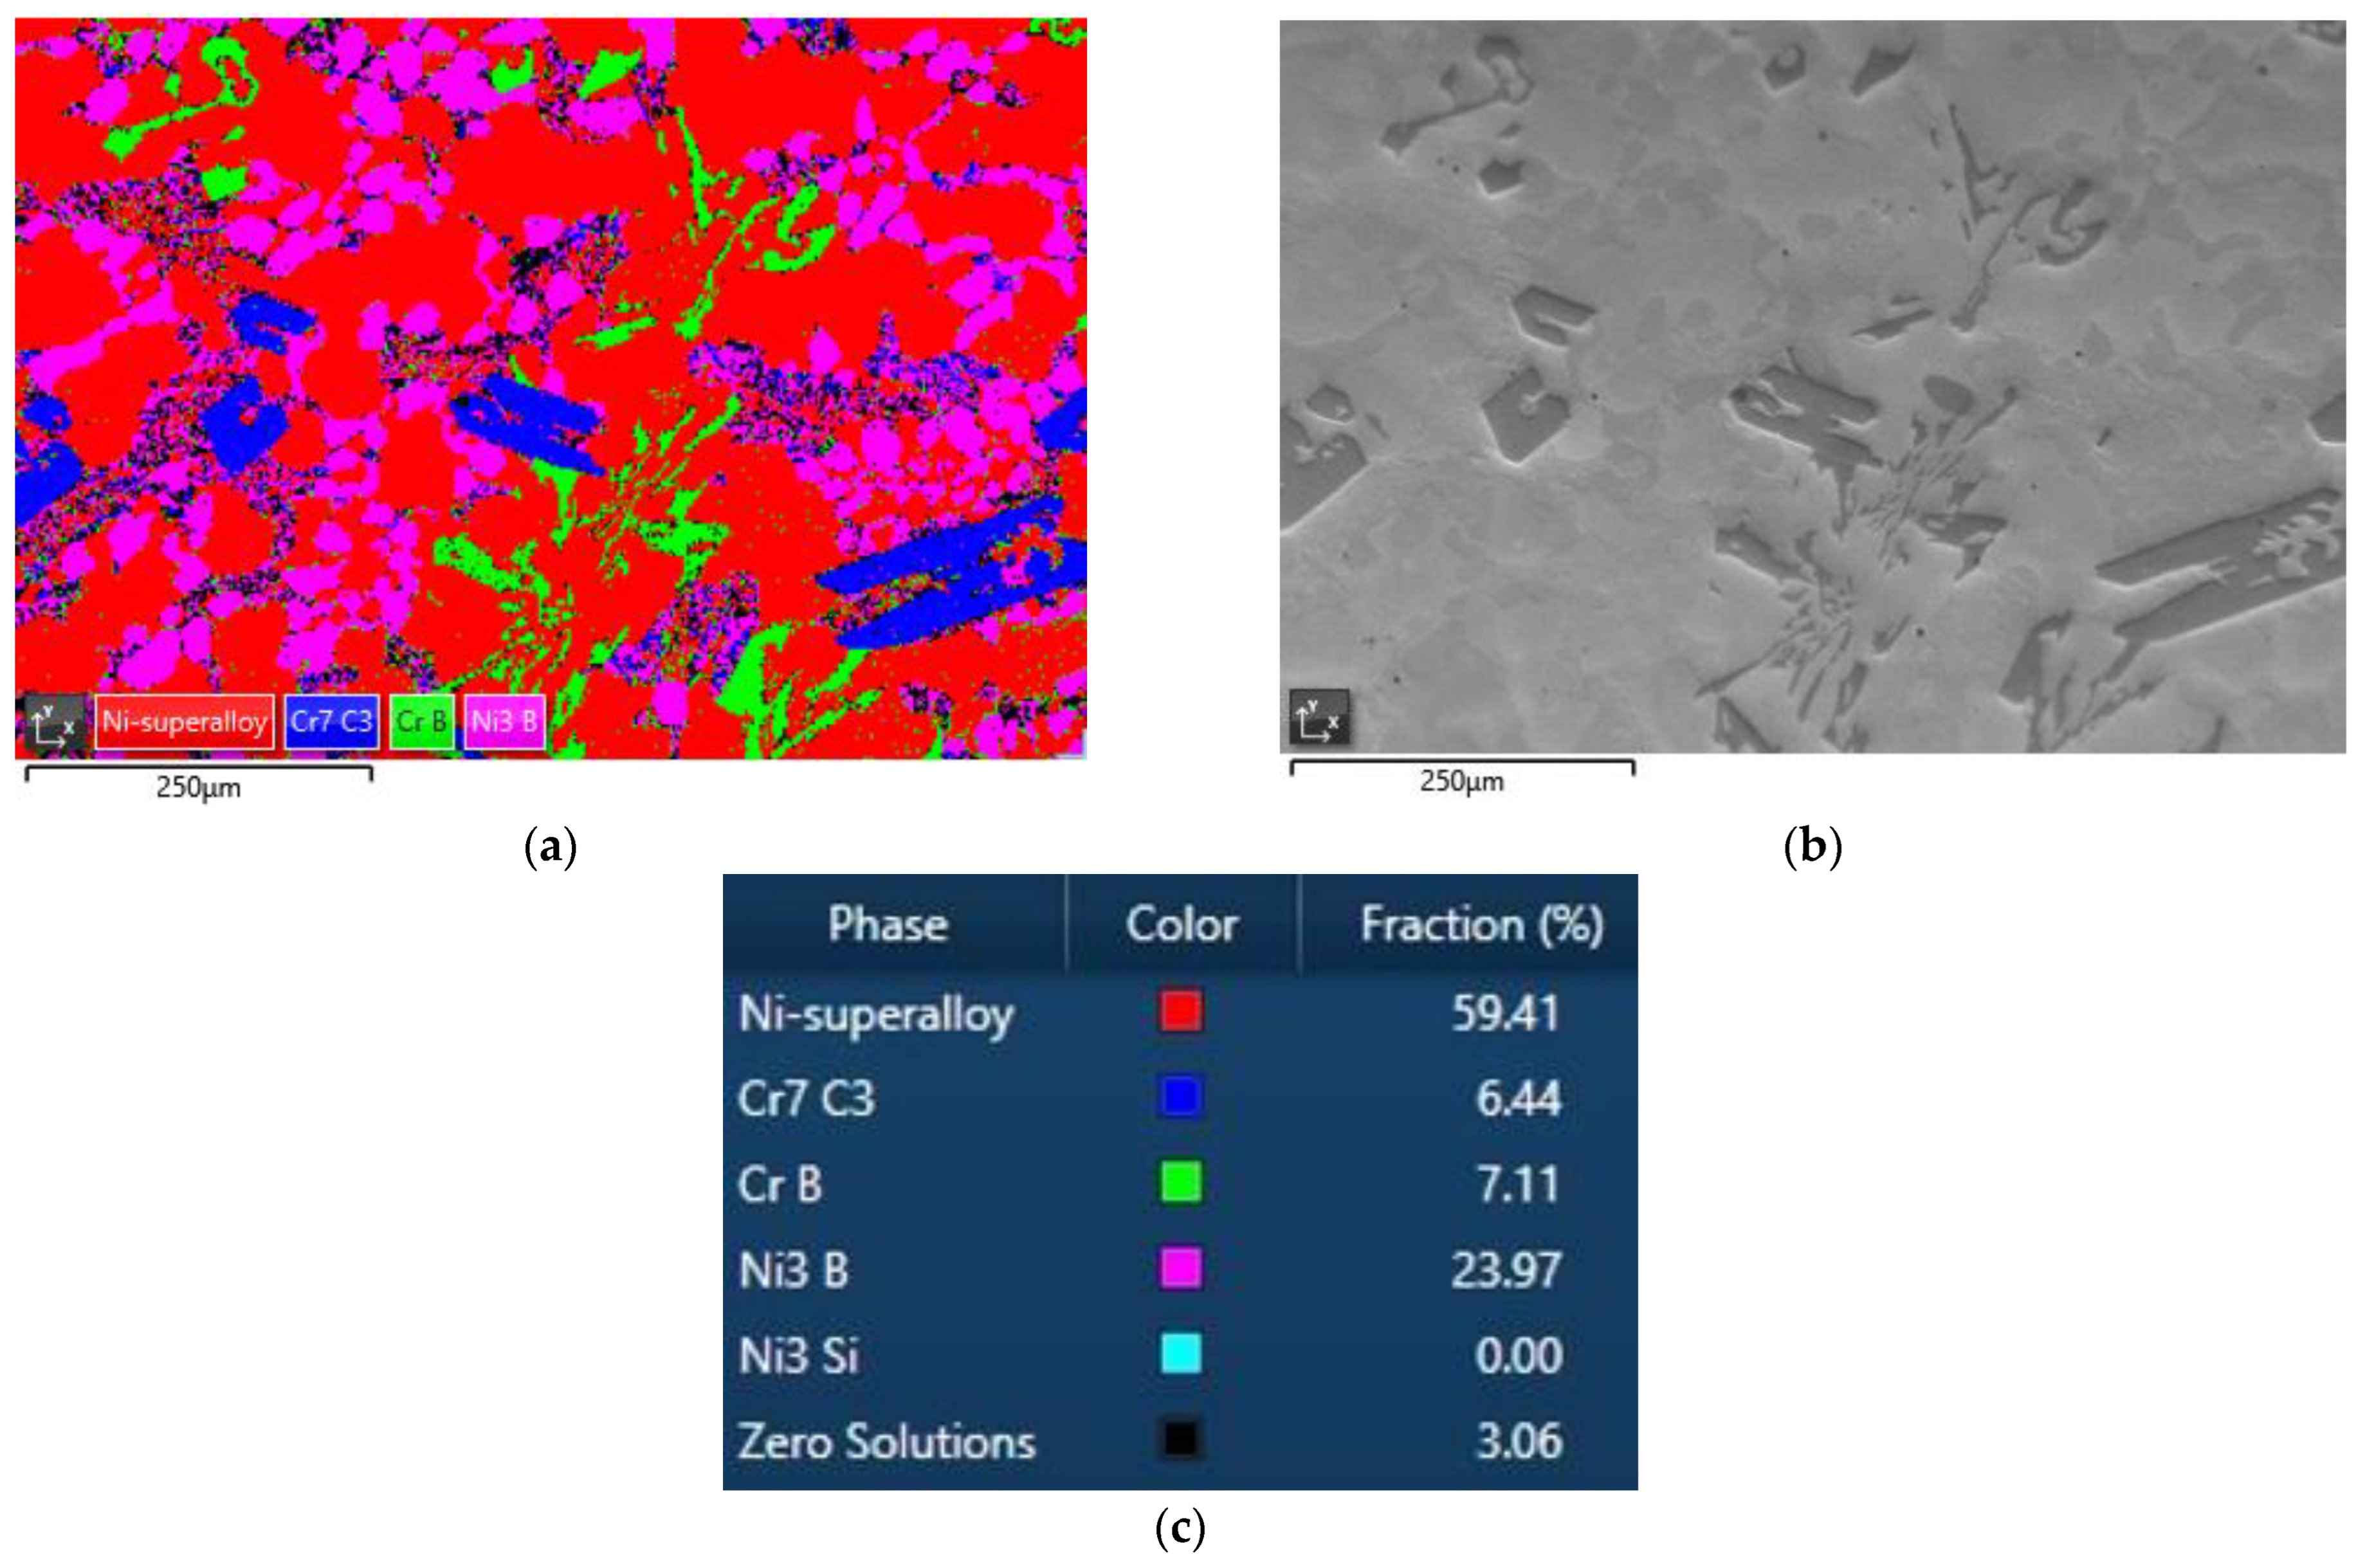
3.4. Quantification of Carbides and Borides in FESEM Images

The sizes and area fractions of the carbides and borides were quantified through image analysis (Figure 16), with the aim of evaluating how the chemical composition affects carbide and boride formation. It could be observed that the area fractions and sizes of both carbides and borides increased with increases in the Cr, C, and B content in the alloy. In Alloys A and B—which had low boron contents of 1.99 and 1.62 wt.%, respectively—the area fractions of borides were also particularly low, while Alloy C, with its high boron content (2.59 wt.%), had the highest boride area fraction and equivalent diameter. Alloys B and C, which had a similar and high content of carbon (0.39 wt.% and 0.4 wt.%, respectively), also showed similar equivalent diameters and area fractions of carbides, and these were only slightly lower in Alloy C. It is also worthwhile to mention that in Alloy C, the boride area fraction was more than twice the area fraction of the carbides in this alloy. The equivalent diameters of the borides (10.75 ± 1.12 μm) and carbides (17.92 ± 4.26 μm) in the samples of Alloy C manufactured via gravity casting were significantly larger than the ones of the samples manufactured via LMD (the equivalent diameter of borides: 0.42 ± 0.35 µm, and the equivalent diameter of carbides: 1.80 ± 1.28 µm in Sample 3C) [18]. This can be attributed to a lower solidification rate in the gravity casting samples.

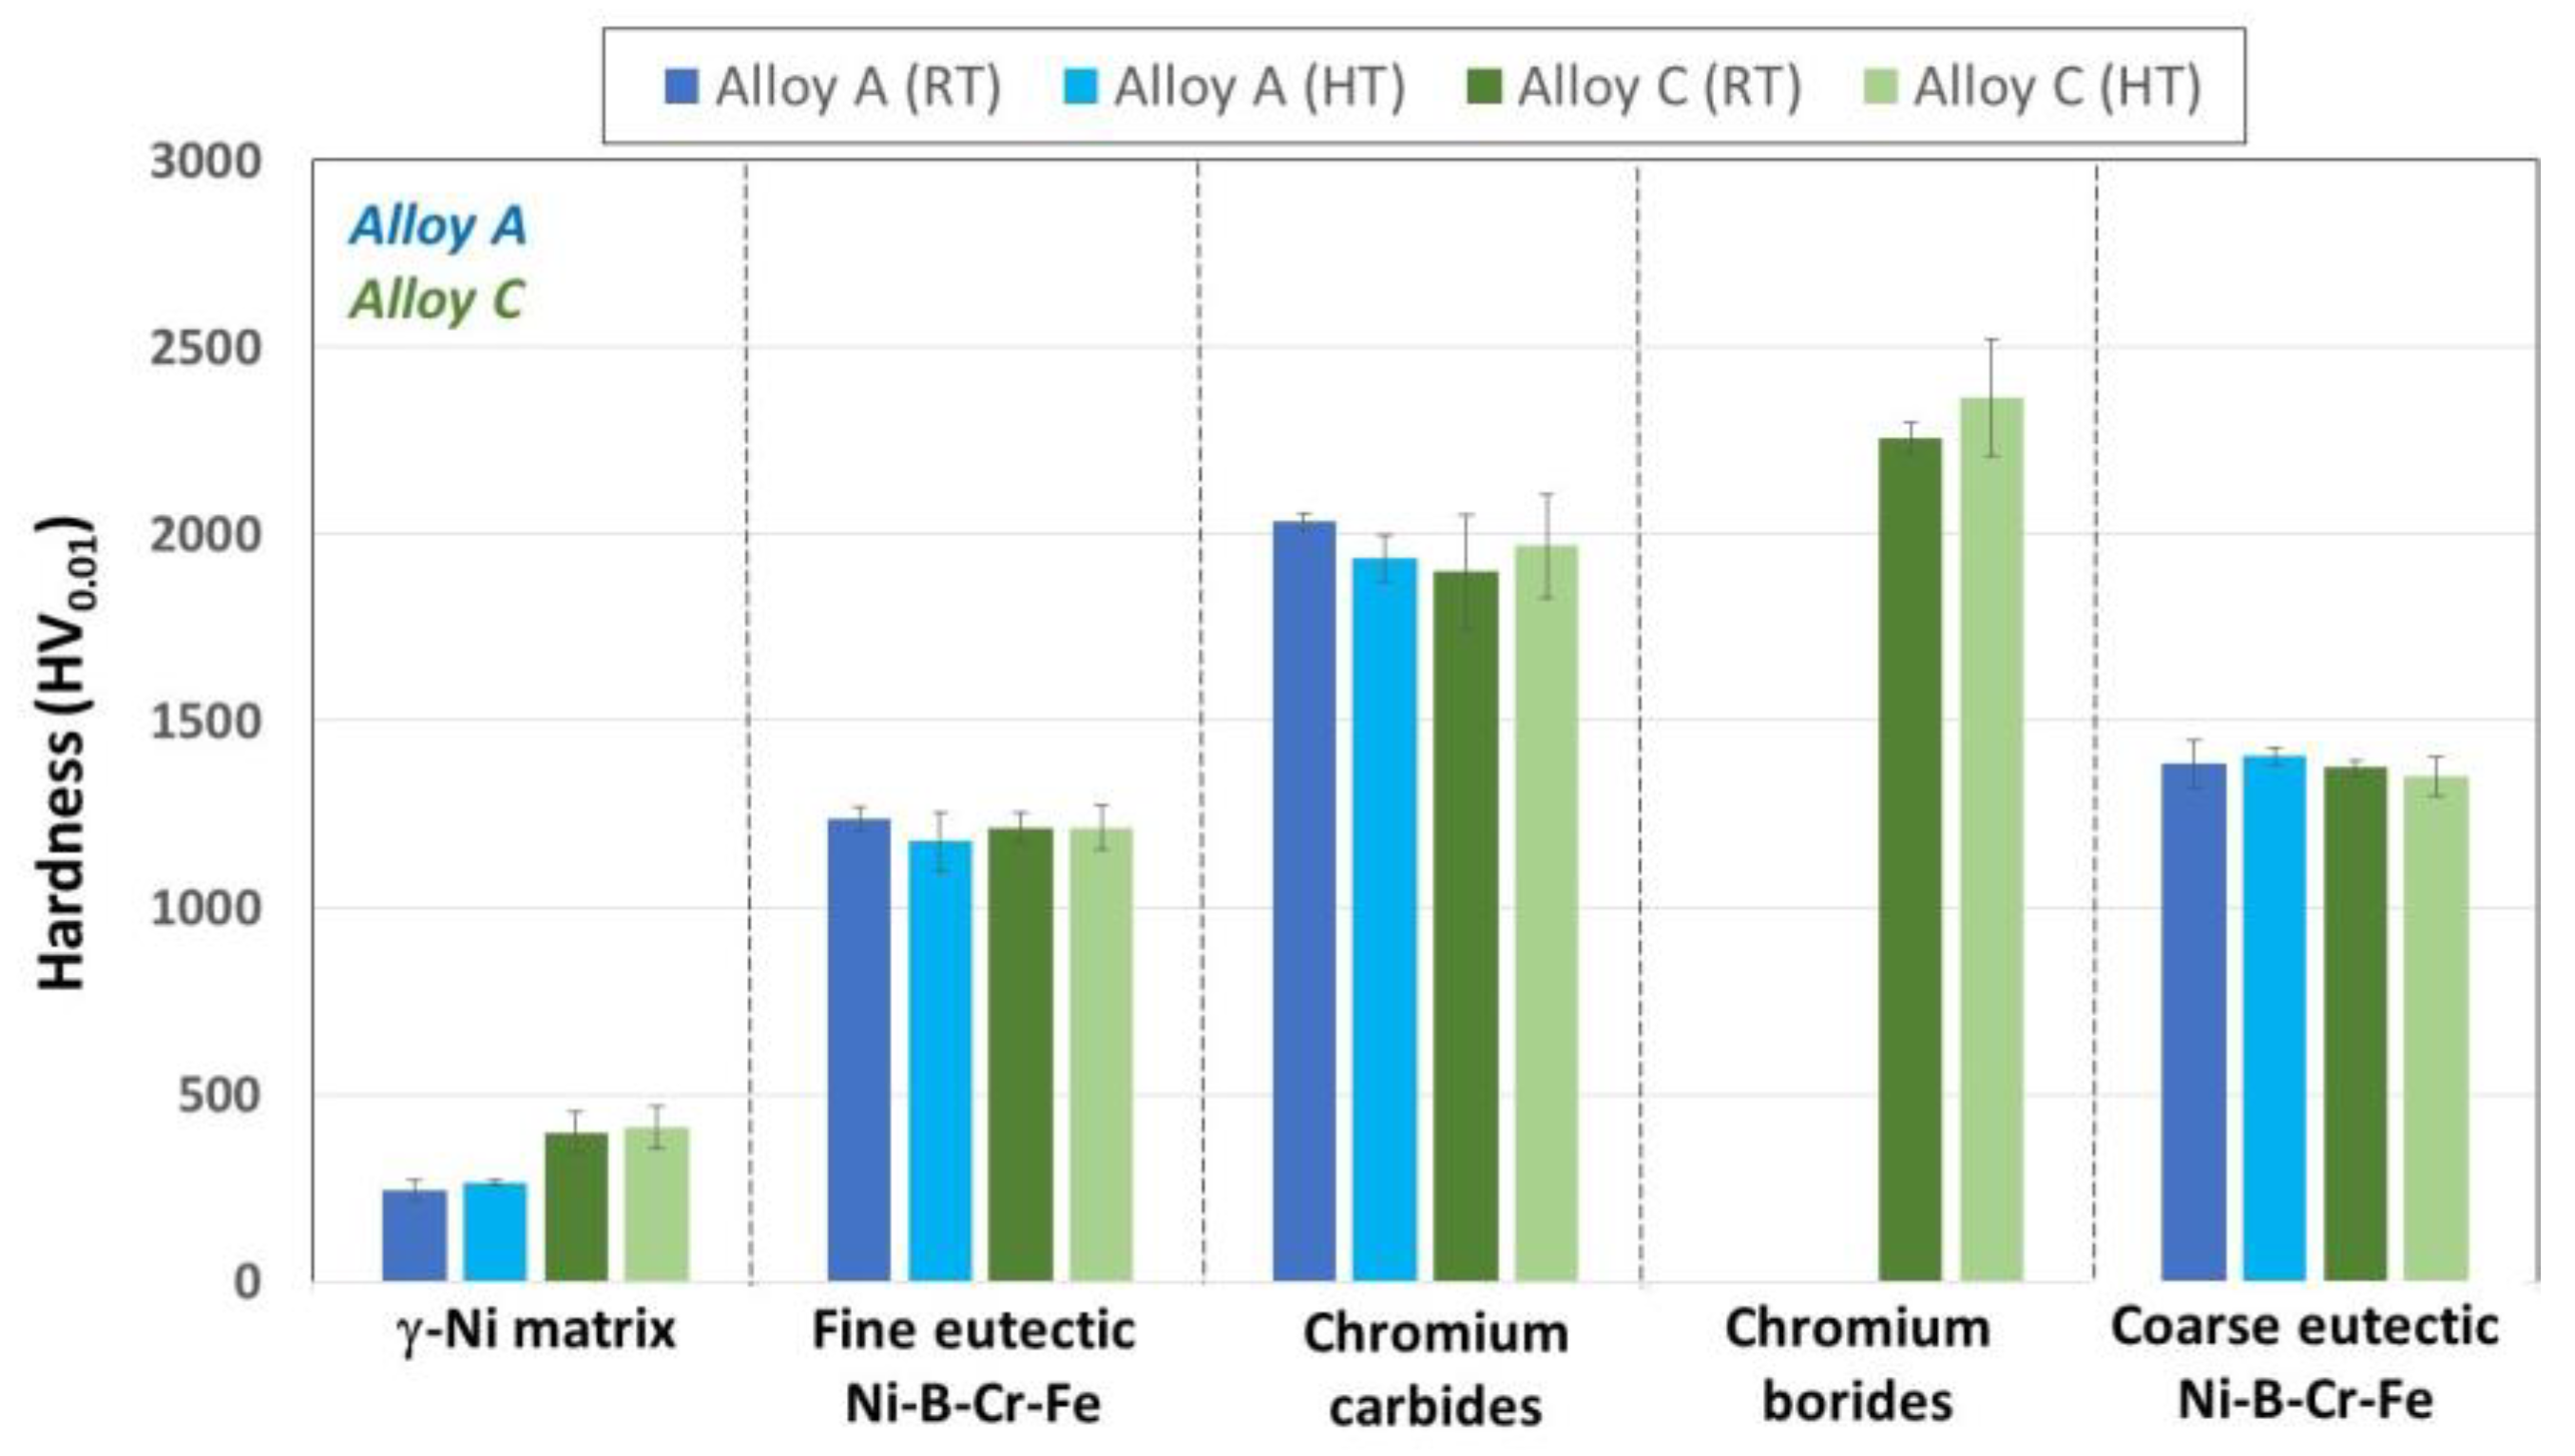
3.5. Microindentation on the Main Phases Observed in the Microstructures

To understand the strengthening mechanism and the contribution of the different phases to the overall hardness, it was considered interesting to measure their hardness. These measurements were performed at room temperature (RT) and at 650 °C (HT). The results obtained are shown in Figure 17 and Table 3. In all phases, no significant differences between the Vickers hardness, which was measured at room temperature and 650 °C, were observed. Small differences observed in Vickers hardness were within the standard deviation. The γ-Ni matrix was the softest phase in the microstructure. Alloy C (398 and 412 HV0.01) showed a higher hardness than Alloy A (244 and 265 HV0.01). This can be explained by the higher alloying element content in the composition of Alloy C and also in the γ-Ni matrix (see also Table 1 and Table 2), which provides solid solution strengthening. Carbides (up to 2033 HV0.01) and borides (up to 2366 HV0.01) were the hardest phases in the microstructure. The hard phases present in the fine and coarse eutectics (Ni-B-Cr-Fe), identified as Ni3B by EBSD, showed an intermediate hardness of 1352–1406 HV0.01. In this phase, boron could be partially substituted by Cr and Fe. Taking into account the equivalent diameter and area fractions of borides and carbides, as well as the hardness of the different phases, the main strengthening phase in Alloy A was the eutectic Ni3 (B, Fe, Cr) with a small contribution from carbides, whereas in Alloy C, the main strengthening mechanism was the precipitation hardening of particularly hard carbides and borides, as well as nano-precipitates that were distributed in the center of the γ-matrix and near the eutectics. Further strengthening was provided by the hard Ni3(B, Fe, Cr) eutectic phase, and a small contribution by the solid solution hardening of γ-nickel dendrites.

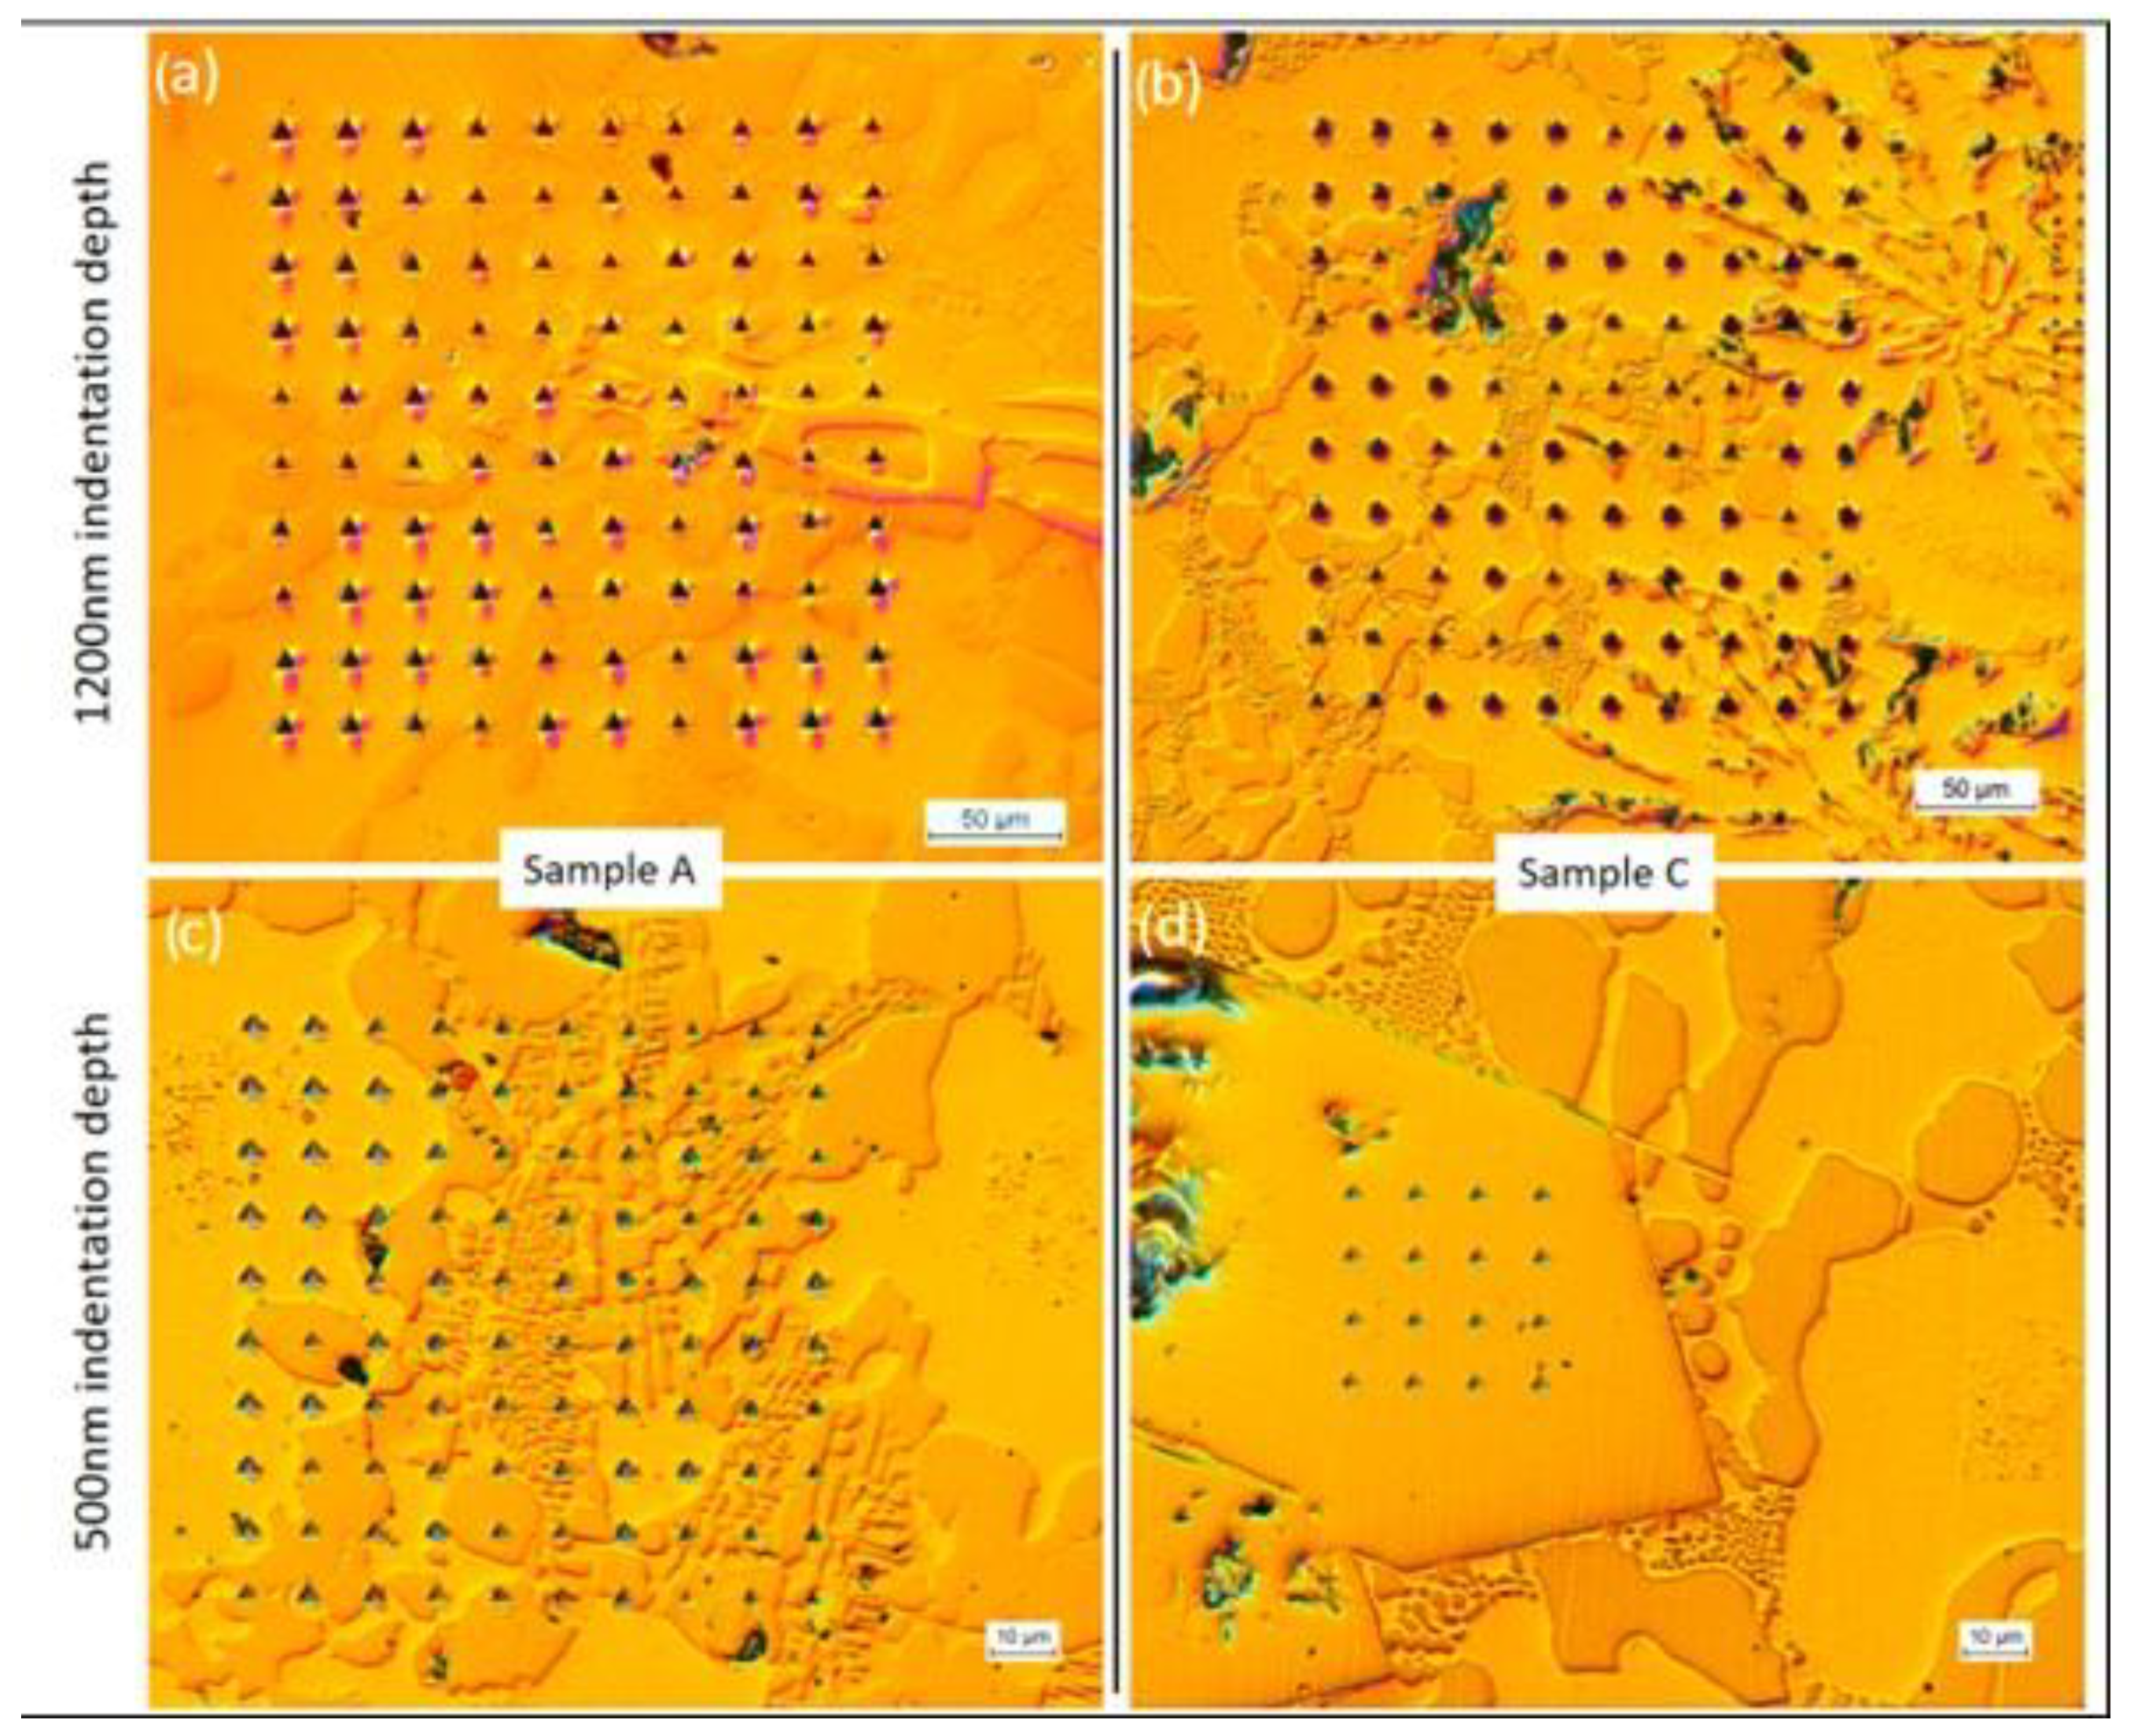
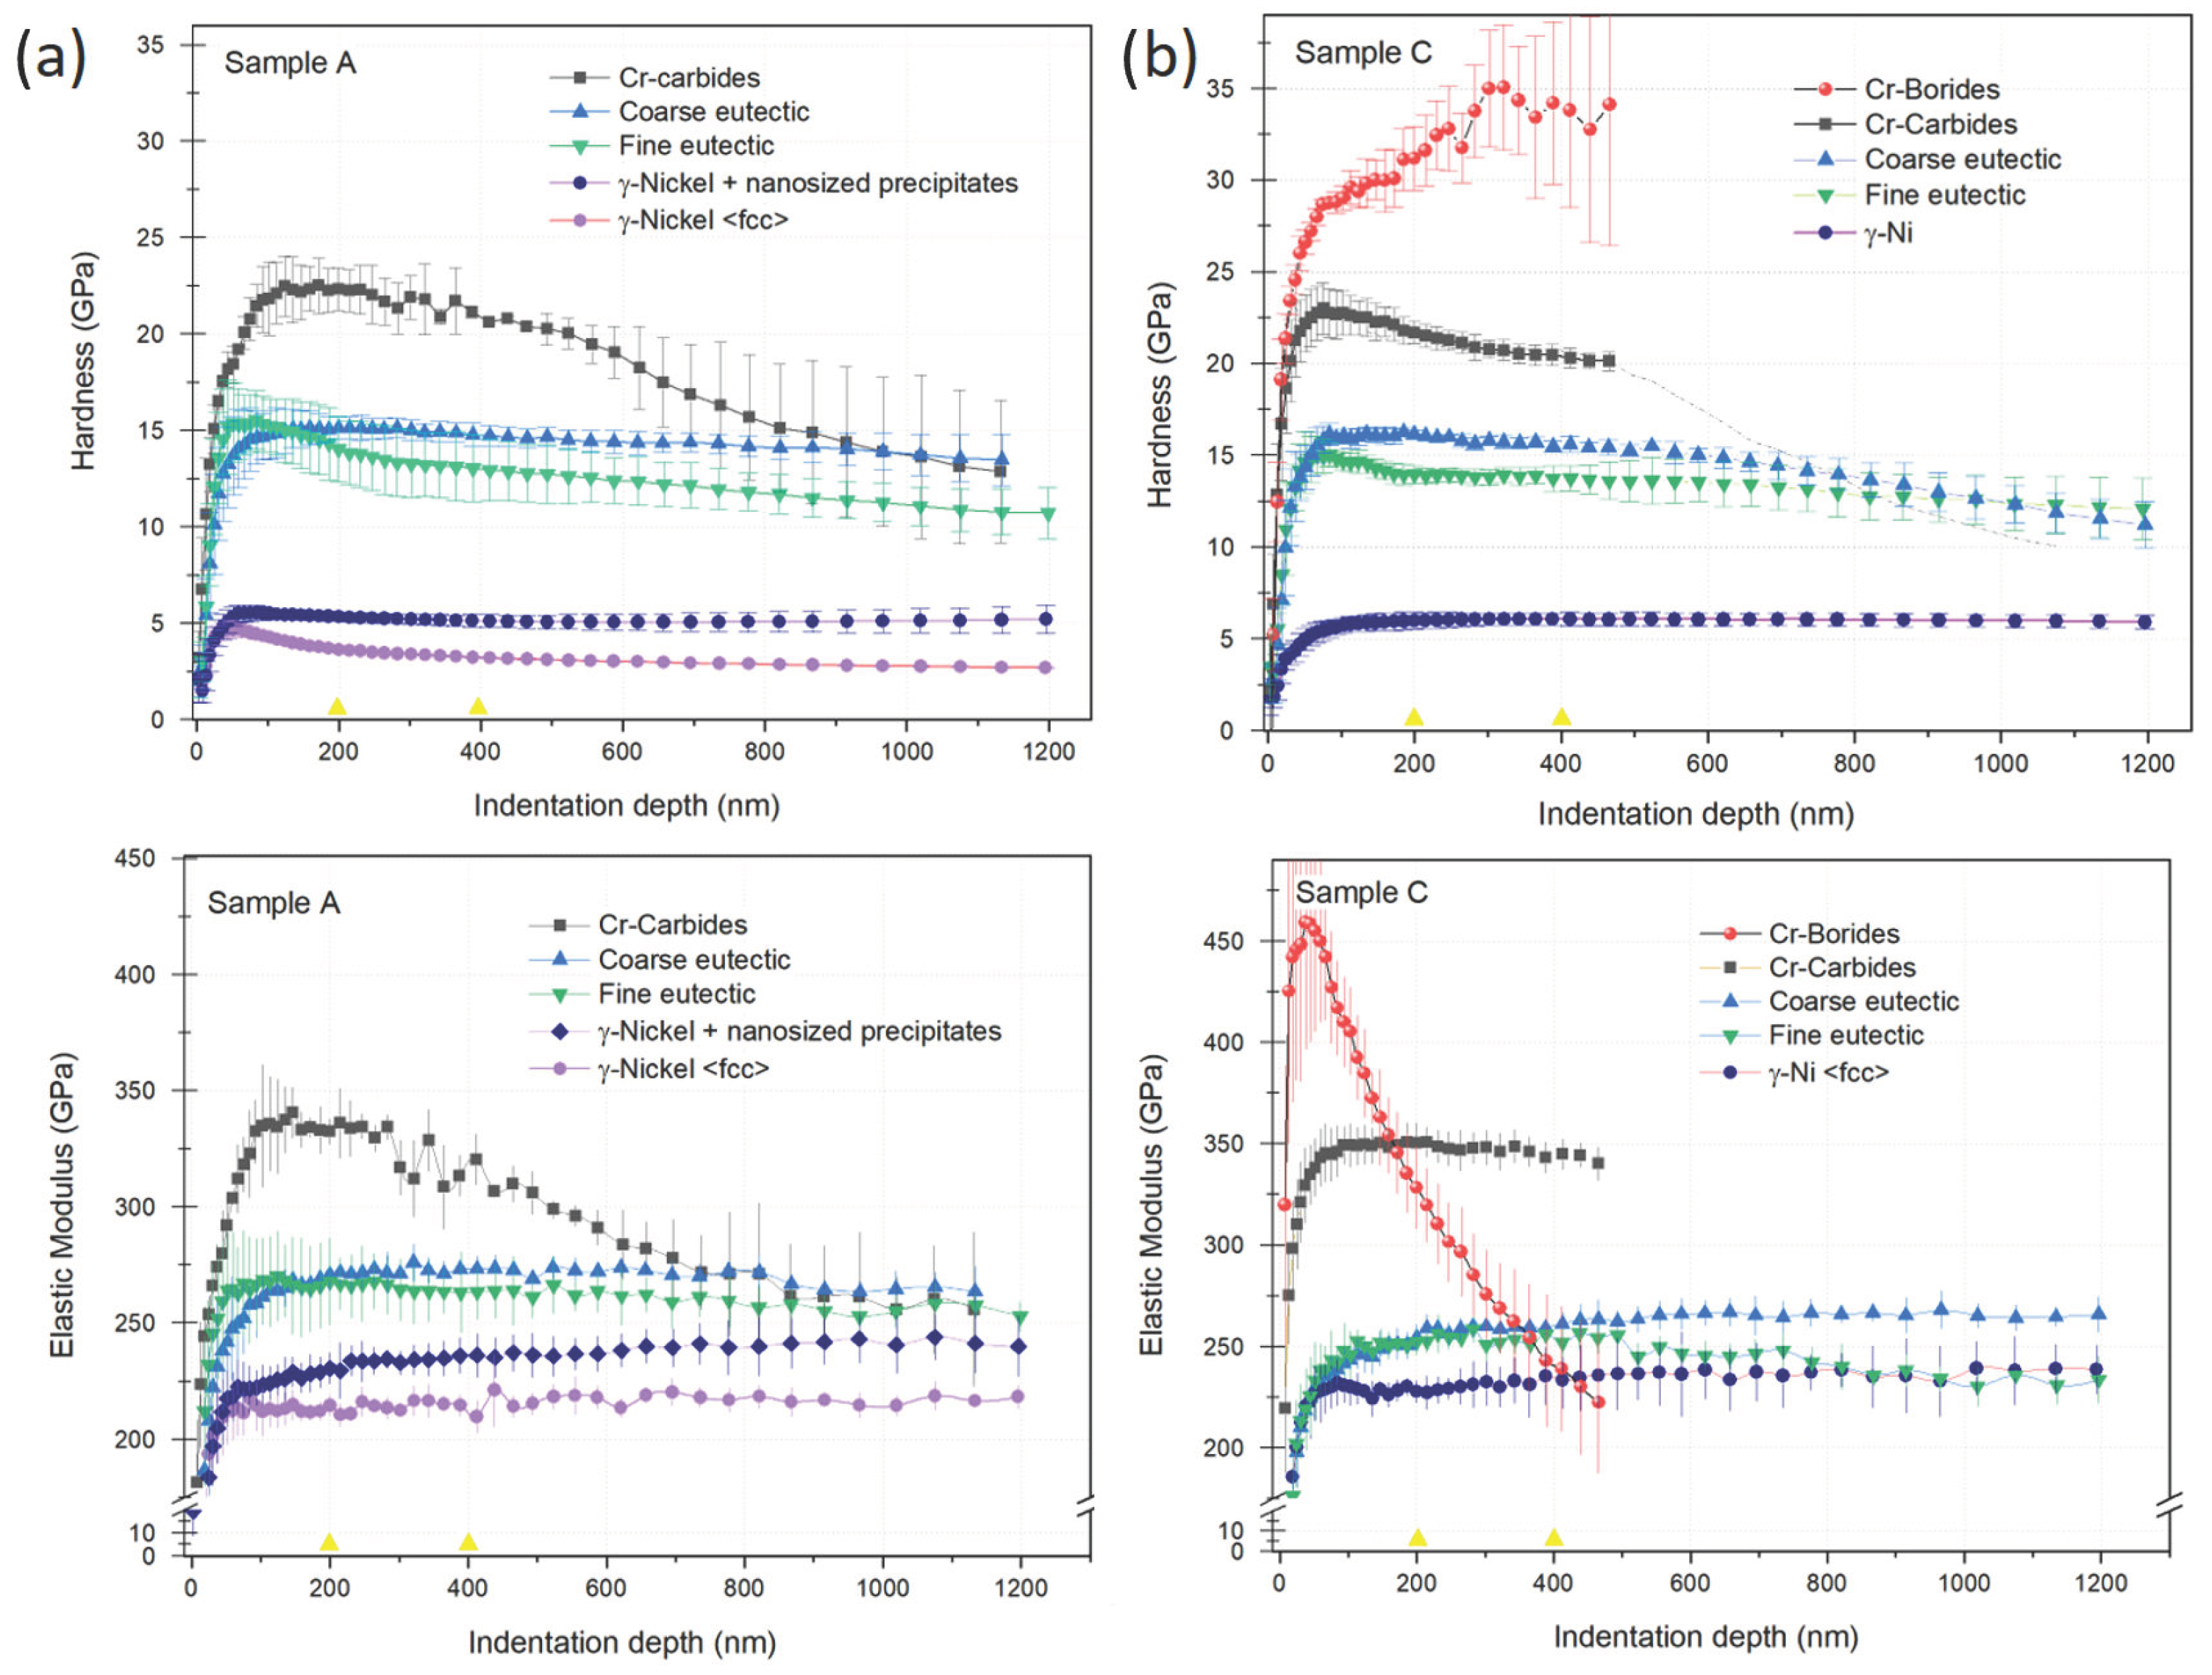
3.6. Nanoindentation on the Main Phases Observed in the Microstructures

In order to further expand the study on the distribution of mechanical properties in terms of nanohardness, as well as determine the elastic modulus of each phase, several nanoindentation tests were conducted on Samples A and C. Figure 18 displays the imprints left by the Berkovich indenter on some of the tested locations (representative images are presented). It can be observed that by employing the testing strategies described in the corresponding section, successful nanoindentation was achieved on all of the microstructures present in each sample, as well as in the different locations within the same phase. This is particularly interesting for detecting the possible compositional changes that could occur in the γ-Ni phase given the potential presence of the previously described nanosized precipitates.
The in-depth hardness (H) and elastic modulus (E) profiles obtained from Sample A and Sample C are depicted in Figure 19a and Figure 19b, respectively. In order to assign the obtained values to each of the present phases, each test result was analyzed individually according to the location of the observed imprint in the micrographs. As revealed in the depth profiles, the higher values tended to decrease with depth, and this was due to the dominant effect of the softer phase as the indentation load increased. Based on the analysis of these results, it was decided to perform the subsequent calculation of H and E in the range between 200 nm and 400 nm in depth (indicated by yellow triangles in Figure 19). Furthermore, the harder phases were analyzed up to 500 nm in depth, as previously described (the values of the Cr carbides up to 1200 nm were preserved in the Sample A graph to illustrate the effect).
The γ-Ni phase in Sample A exhibited two different responses. On the one hand, a group of tests revealed an H = ~3.5 GPa and an E = ~215 GPa. On the other hand, some of the tests conducted in locations close to the eutectic phase resulted in higher values of H and E, specifically 5 GPa and 235 GPa, respectively. This hardening in certain regions of γ-Ni can be justified by the nanosized precipitates found at the dendrite borders, which block the deformation mechanisms. Furthermore, a slight difference in response between the coarse eutectic (H = ~12 to 16 GPa) and the fine eutectic (E = ~265 to 270 GPa) was observed. In this case, the observed difference between the eutectic phase and the fine eutectic phase could be attributed to the nanoindenter’s capability to detect the soft γ-Ni phase at low loads due to the smaller size of the fine eutectic. This led to an averaged value for both phases.
The results acquired from Sample C revealed a single response for γ-Ni (H = 6 GPa and E = 260 GPa), which closely agrees with the values obtained for the γ-Ni near the dendrite borders in Sample A. This response suggests a γ-Ni phase composition that is uniformly saturated with nanosized crystals and other fine precipitates, thus resulting in the hardening effect of the whole γ-Ni phase. The mechanical response for γ-Ni was similar in locations where fine precipitates were observed through microscopy. Furthermore, the results associated with the Cr-carbide phase exhibited the same values as those obtained in Sample A, i.e., H = ~25 GPa and E = ~340 GPa, which was as expected. However, the response of the harder phase of the Cr borides was also resolved. While the hardness of the Cr borides was H = ~36 GPa, the elastic modulus could not be rigorously calculated for the 200–400 nm depth range due to the significant drop in modulus values within the initial nanometers of testing, as illustrated in Figure 16b. This phenomenon was attributed to the presence of a particularly hard, fine-grained phase that was surrounded by a much softer phase. This affected the modulus measurement from the very first nanometer, thereby recording E values of approximately 450 GPa, which was only achievable under extremely low-load testing conditions.
Table 4 summarizes the H and E values that were calculated for each phase/compound in the range of 200 nm to 400 nm (indicated by yellow triangles in Figure 19). The obtained H values for each analyzed phase aligned with the trend observed in the microhardness measurements, thereby confirming the strengthening effect in γ-Ni due to the precipitates and alloying elements, as well as the presence of a higher content of harder phases in Sample C. Furthermore, the elastic modulus values closely resembled those that were reported in previous studies for the analyzed phases [18].
Finally, the micro and nanohardness values showed a similar tendency. Small differences between both tests could be due to the lower indentation depth of the Berkovich tip, which analyzes less of the matrix below the hard phase. Hardness tests with low loads (nanoindentation) (1) have a lower contribution of the softer phase (matrix) when a dispersed hard phase is tested and (2) because of the low load, different deformation mechanisms are activated due to the lower tension field generated, causing an effect called the indentation size effect, which justifies certain deviations with respect to HV hardness.

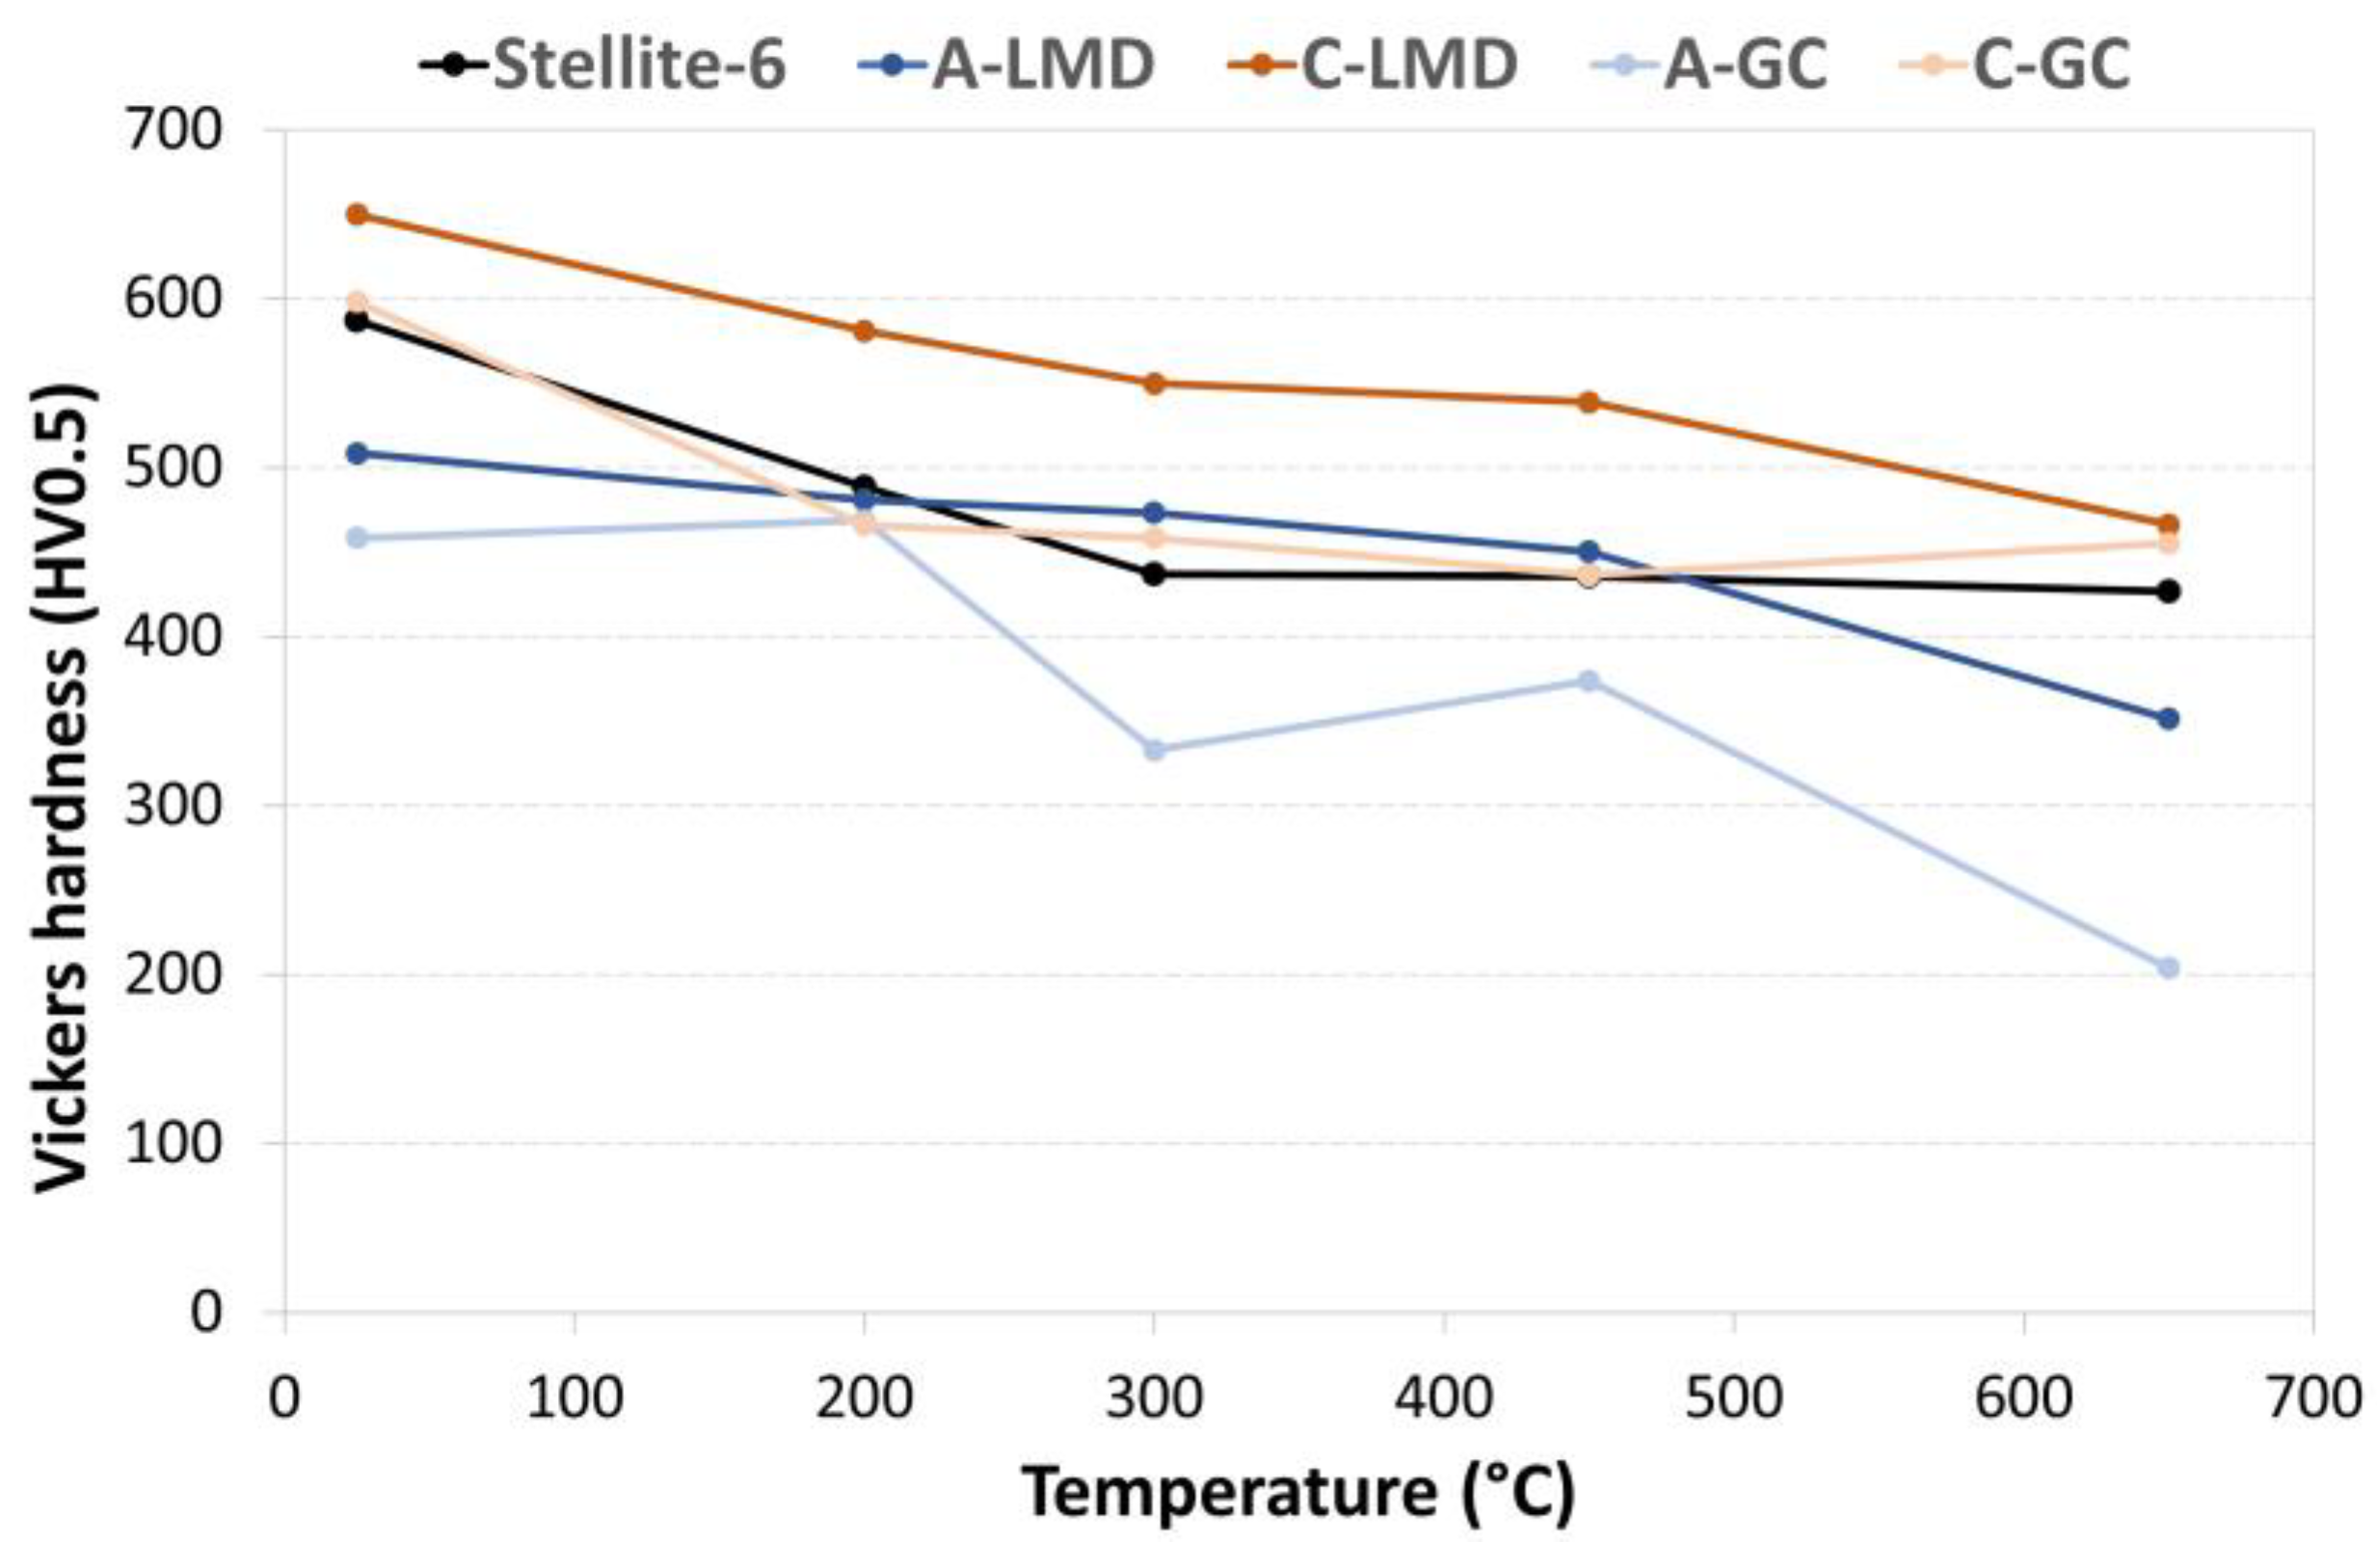
3.7. Hot Hardness Tests

The evolution of the Vickers hardness (HV0.5) in Alloys A and C that was obtained at different temperatures, i.e., between 25 and 650 °C, is shown in Figure 20. For comparison, the data of the samples (Alloys A and C), which were produced via laser metal deposition (LMD) [18] and Stellite 6, were also included in the graph. It can be observed that the hot hardness of the samples of both alloys (A and C) that were manufactured via LMD was higher than the one of the samples that were manufactured via gravity casting. Alloy C shows an even higher hardness than Stellite 6. The higher hardness of the LMD samples compared with the GC samples can be attributed to the fine size and homogeneous distribution of the precipitates and compounds in the microstructure (as described in a recent research work by Pereira et al. [18]), and this is due to the rapid solidification in this manufacturing process. Also, Gomez et al. [42] observed that a fine and uniform distribution of equiaxed precipitates increased the hardness of the NiCrBSi coatings produced via laser cladding, while the non-homogeneous distribution of the precipitates in coatings produced using the thermal flame spraying method decreased the hardness values.
Alloy C—which was manufactured via gravity casting—showed, across the whole temperature range, a similar hardness to Stellite 6. Thus, Alloy C could be a suitable candidate for the substitution of Stellite 6 in aircraft parts using both manufacturing routes.

3.8. Equilibrium and Scheil Solidification Simulations

An equilibrium simulation was performed in order to determine the phases that can be performed in these alloys under equilibrium conditions (Figure 21). In addition, a Scheil simulation (Figure 22) was conducted to study the solidification sequence and segregation phenomena. In both alloys, the same phases were formed under equilibrium conditions that were γ-Ni (FCC), CrB, Ni3B, Ni3Si, and CrC. However, the mass fractions changed with the alloying element content. As observed in the microstructure investigation, the fractions of the Cr-rich carbides and borides increased, while the mass fraction of Ni3B decreased in Alloy C when compared to Alloy A.
The Scheil solidification sequence of Alloy A can be described as follows:
Liquid → Liquid + γ-Ni (FCC) → Liquid + γ-Ni (FCC) + CrB → Liquid + γ-Ni (FCC) + CrB + Ni3B → Liquid + γ-Ni (FCC) + CrB + Ni3B + CrC
In Alloy C, the solidification sequence was similar, but the CrB boride started to precipitate in the liquid before γ-Ni (FCC) was formed. In general, these sequences were in agreement with the microstructure observations that were achieved via optical microscopy (Figure 5). First, γ-Ni (FCC) and the Cr borides started to form while the Ni3B eutectics and carbides formed at the end of the solidification process. In the FESEM/EDS analysis of this study, the presence of eutectic Ni3Si was also observed in the fine eutectics. However, as shown in the equilibrium phase diagram, it can be observed that this phase started to form below 500 °C in Alloy A and below 700 °C in Alloy C. Thus, the formation of Ni3Si most likely occurred during cooling when the alloy was already in the solid state.
Therefore, the sequence of the phase formation we proposed for Alloy C is as follows:
Liquid → Liquid + CrB → Liquid + γ-Ni (FCC) + CrB → Liquid + γ-Ni (FCC) + CrB + eutectic (γ-Ni/Ni3B) → Liquid + γ-Ni (FCC)+ CrB + eutectic (γ-Ni/Ni3B) + CrC → γ-Ni (FCC) + CrB + eutectic (γ-Ni/Ni3B/Ni3Si) + CrC
Furthermore, as shown in Table 5, it can be observed that the solidification range was significantly higher in Alloy C (ΔT = 344.3 °C) compared with Alloy A (ΔT = 275.8 °C). Alloy C had a higher B and Si content than Alloy A. Both elements were reported as depressing the melting temperature due to the presence of eutectic phases with a low melting point [43].

4. Conclusions

In the present work, the influence of chemical composition on the microstructure and hardness was investigated in three NiCrSiFeB composition grades that were manufactured via gravity casting. The following conclusions can be drawn:
  • Three NiCrFeSiFeB self-fluxing alloys were successfully manufactured using the gravity casting process with the aim of exploring their potential as an alternative to the materials that are produced employing conventional hardfacing and deposition technologies, as well as to substitute cobalt-based alloys in aircraft components. The microstructure evolution and strengthening mechanism was also established and compared to the LMD manufacturing route.
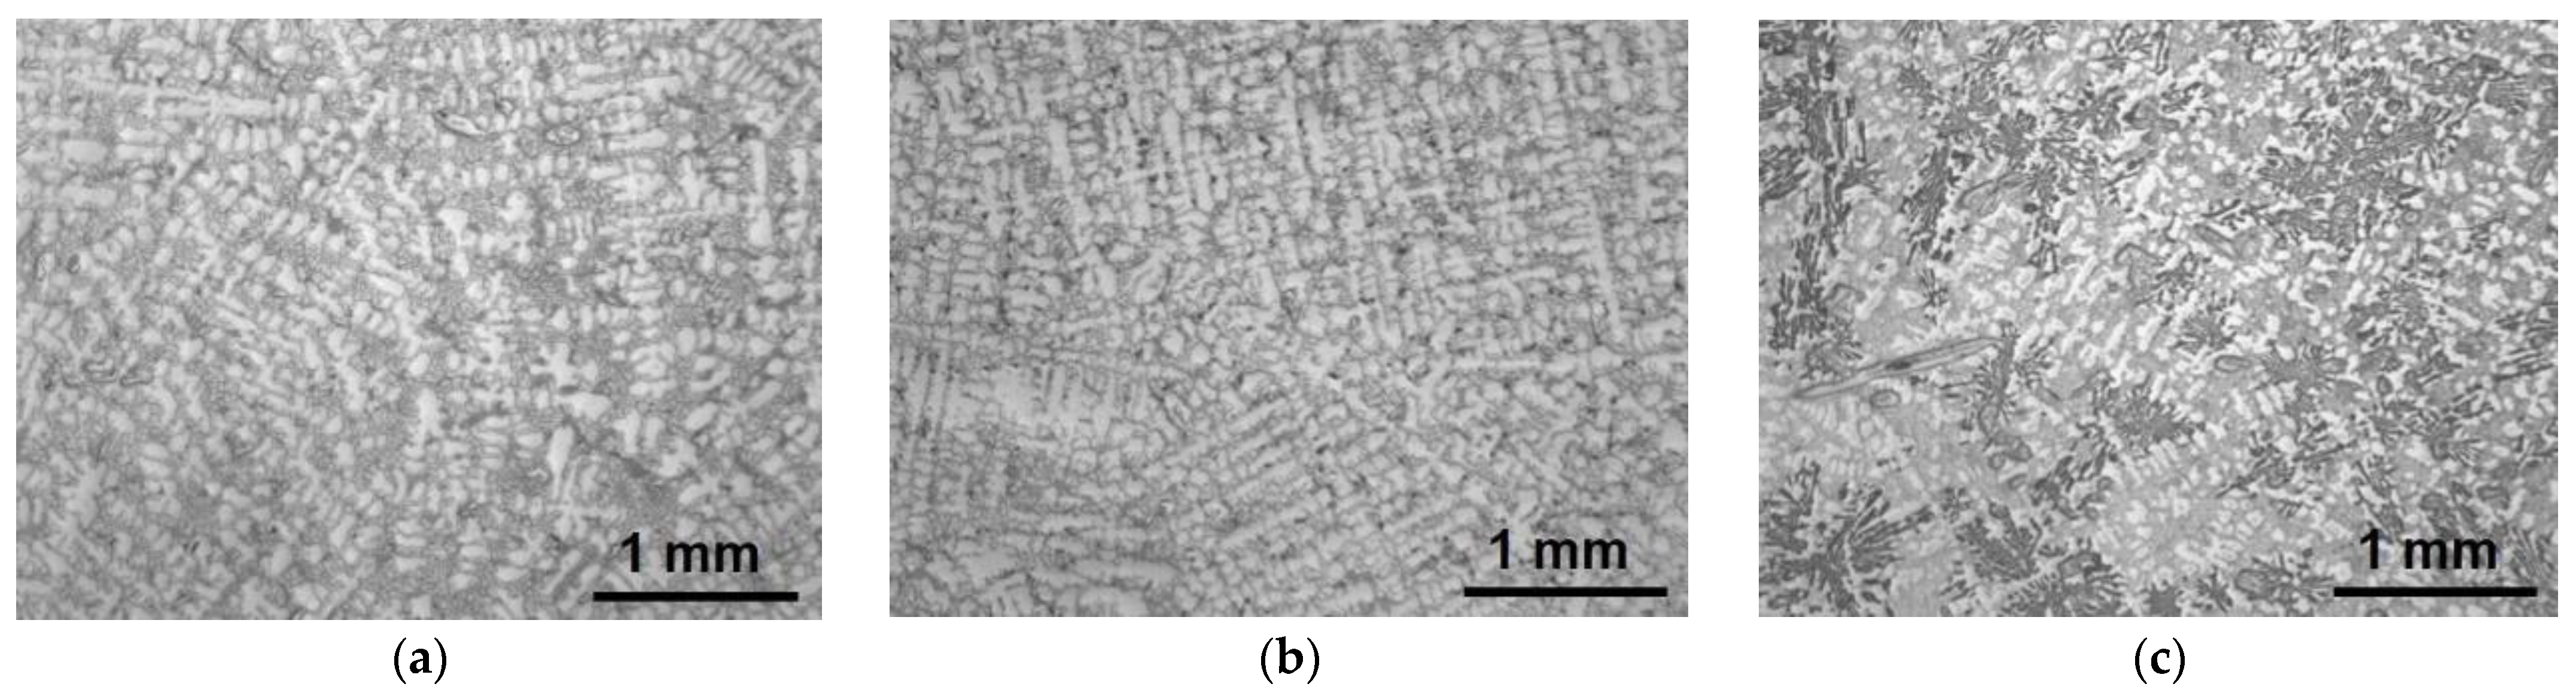
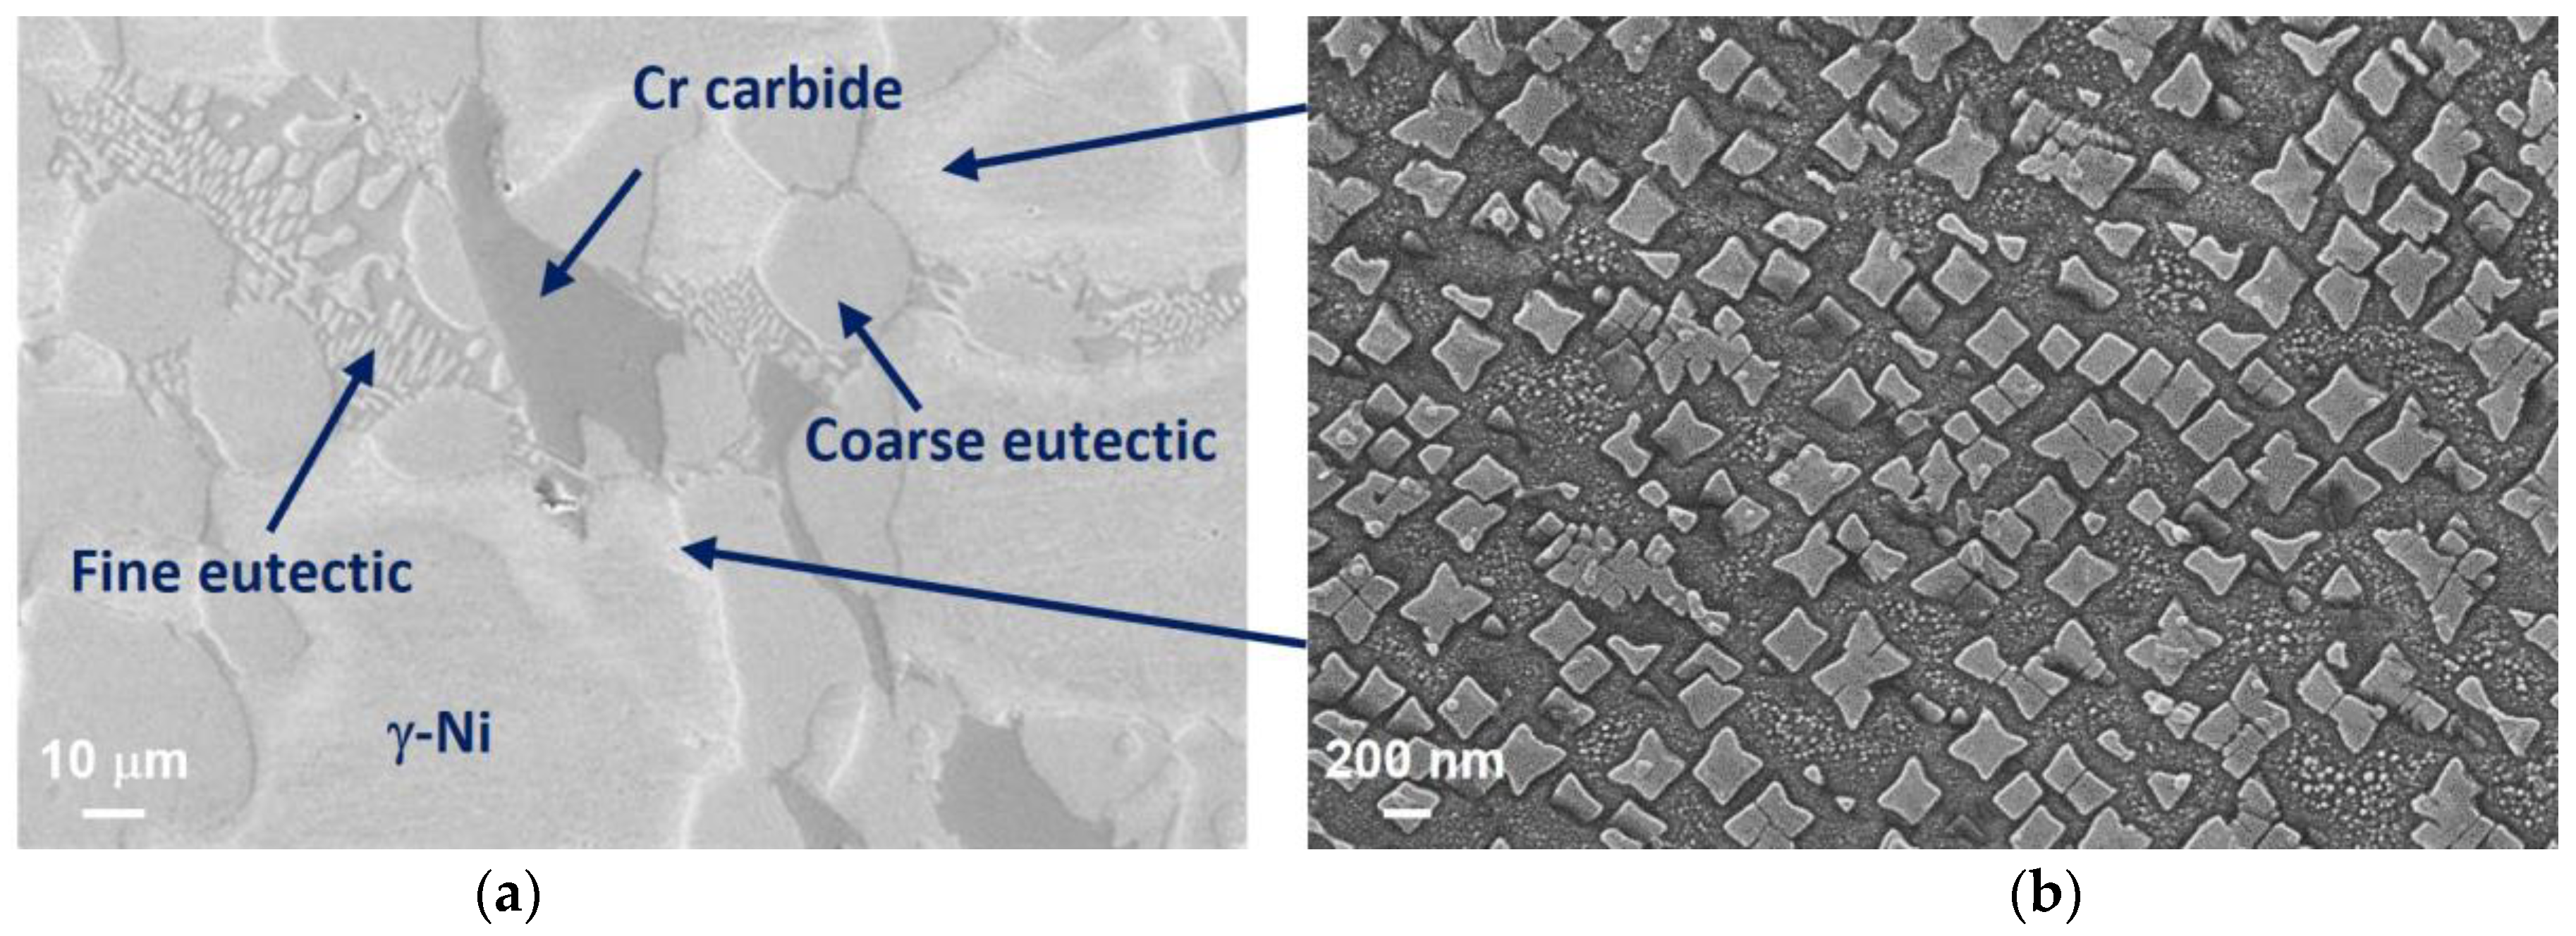
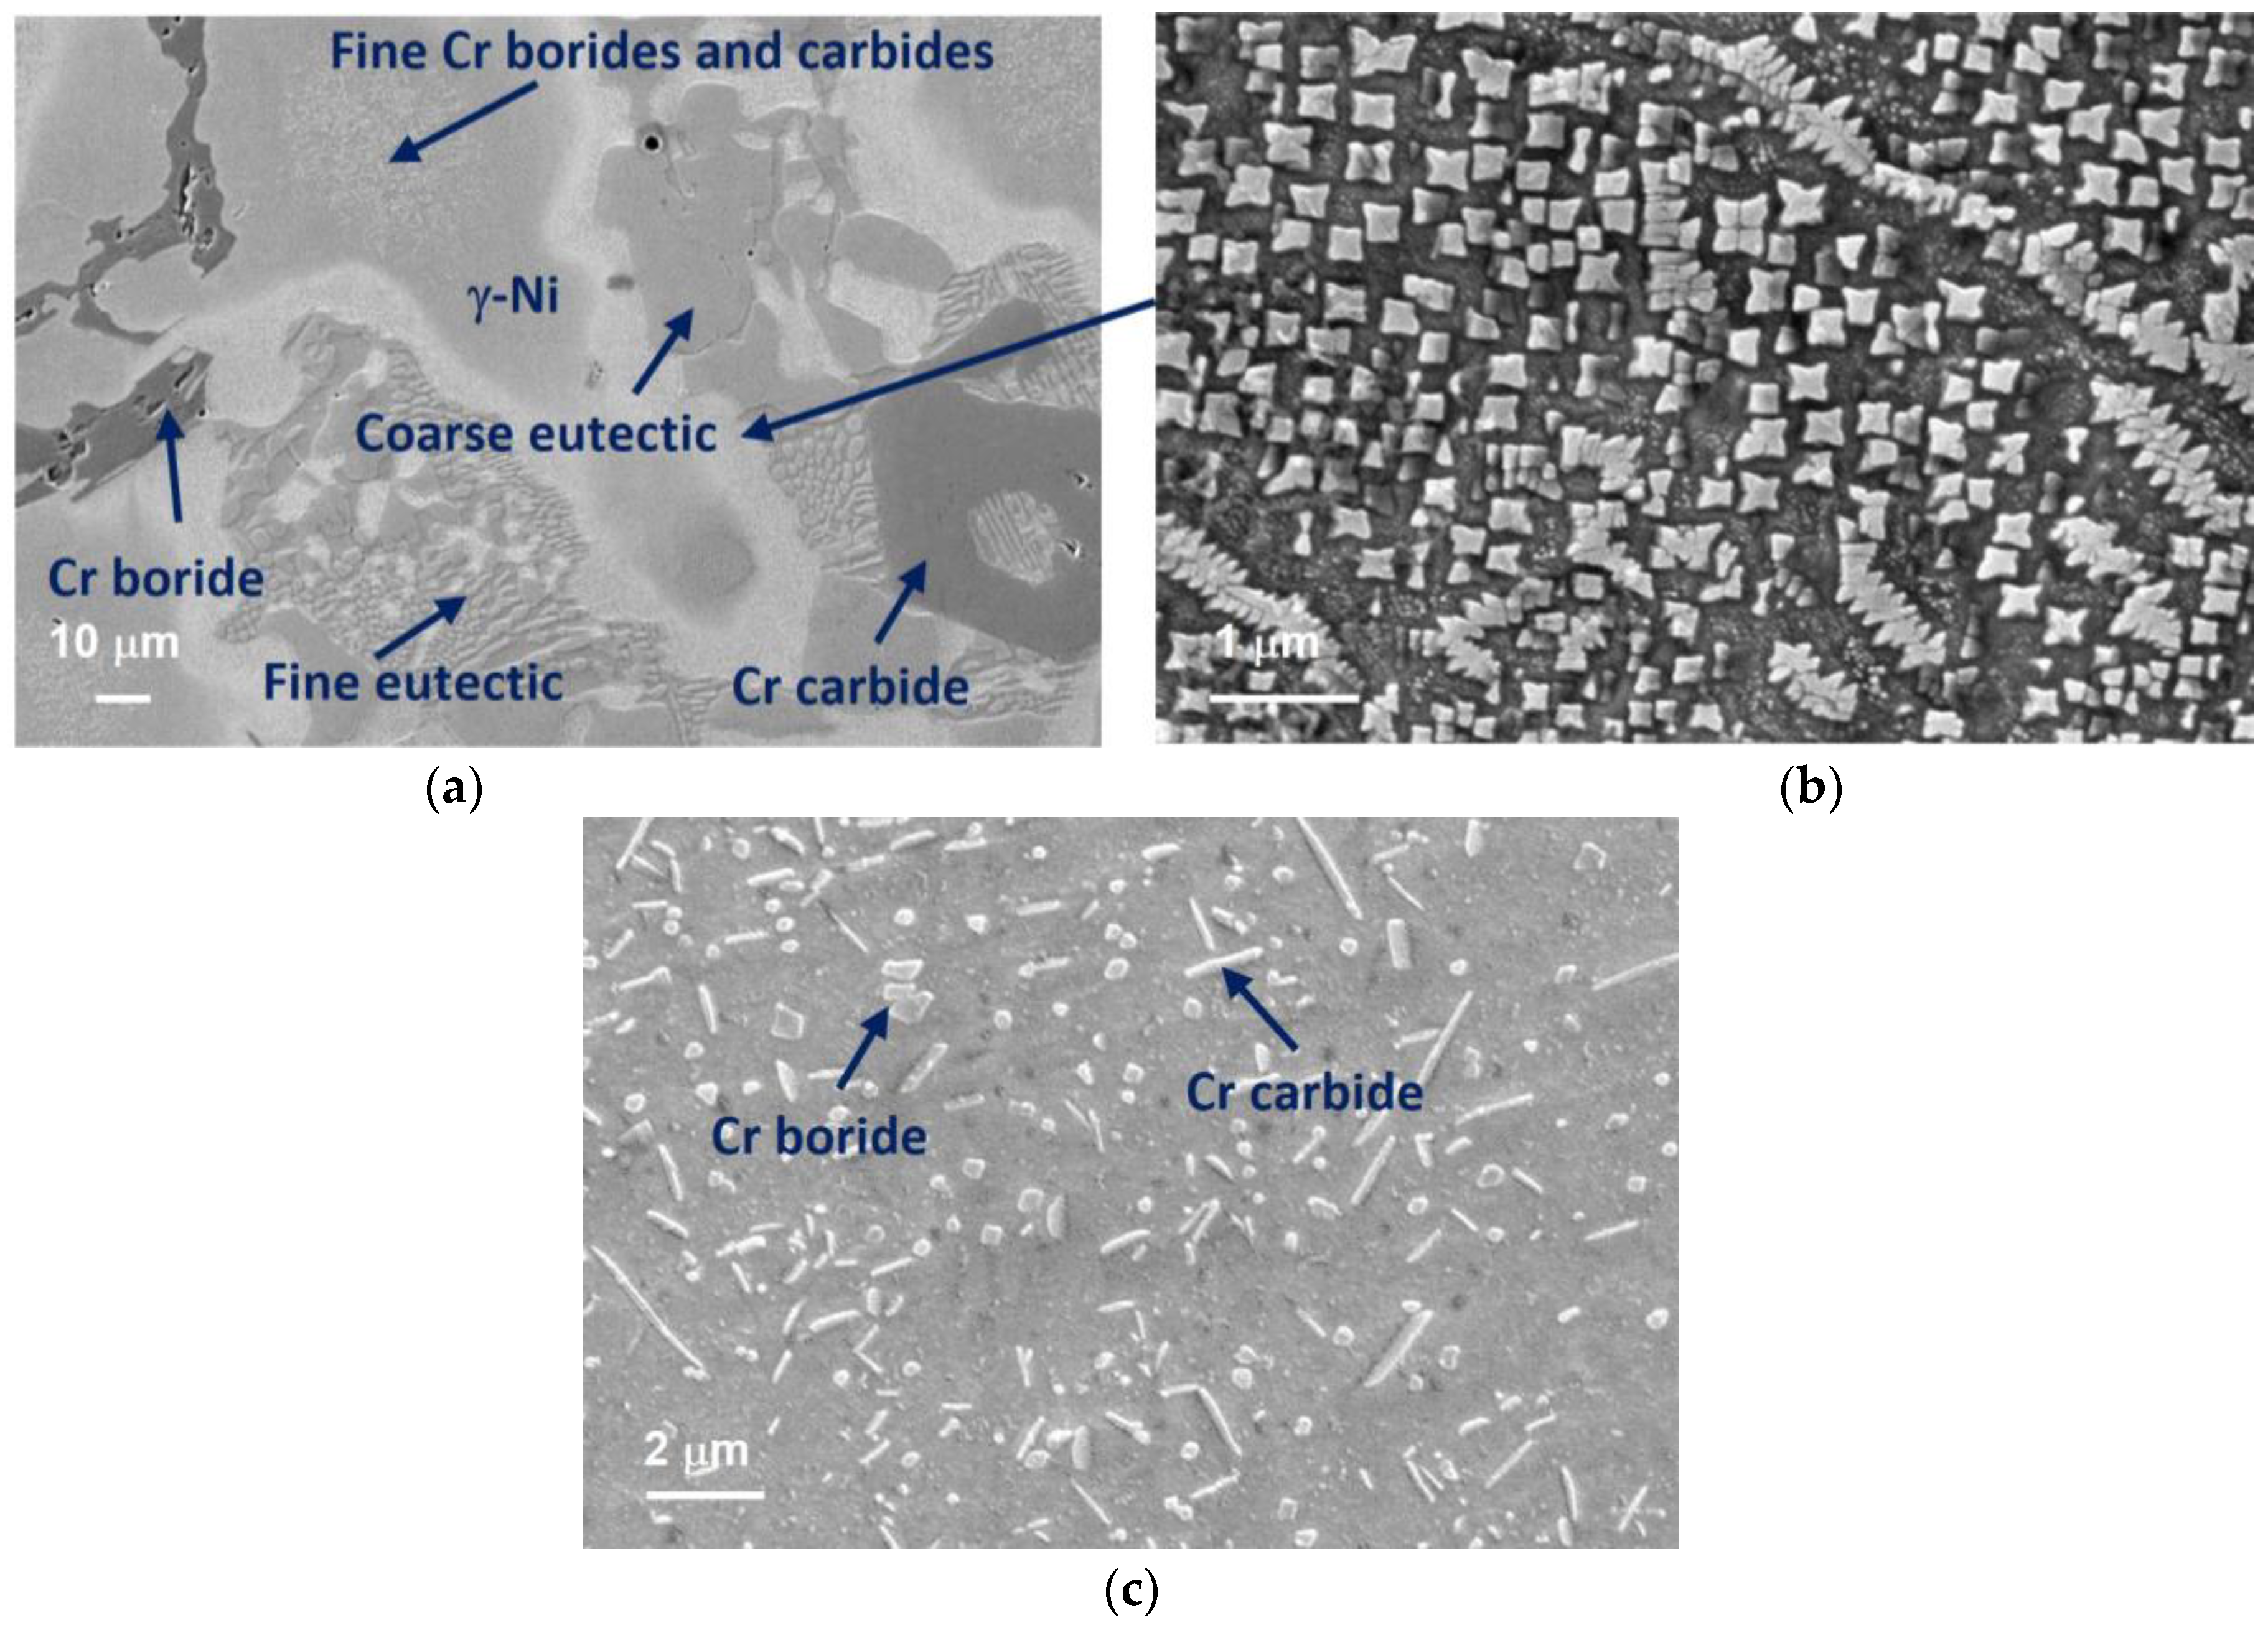
  • The microstructure of the gravity casting samples consisted of soft γ-nickel dendrites, hard Cr-rich carbides and borides, as well as hard Ni3B eutectic phases. These phases were also observed in samples manufactured using the LMD technology. However, in the gravity casting process, the Cr-rich borides and carbides had a different morphology, as they were coarser and less homogeneously distributed in the γ-nickel matrix.
  • The hardness of the studied alloys was found to be strongly related to the chemical composition, which determines the resulting phases that were formed during solidification.
  • The hardness of Alloy A, with its low content of C, B, and Cr, was mainly due to the hardness of the Ni3 (B, Fe, Cr) eutectic phase, with a small contribution from carbides.
  • In Alloy C, with its high content of C, B, and Cr, the main strengthening mechanism was found to be the precipitation hardening of the especially hard carbides and borides that were randomly distributed in the γ-Ni matrix, as well as—to a lesser extent—by the hard Ni3(B, Fe, Cr) eutectic phase and the small contribution of the solid solution hardening of the γ-nickel dendrites. Additionally, the formation of the nanosized precipitates in the center and at the borders of the γ-nickel dendrites, were also observed as contributing to the strengthening of Alloy C. These precipitates were not formed in the samples of the same alloy manufactured through the LMD process.
  • The hot hardness (in the range of 25–650 °C) of Alloys A and C (which were manufactured via gravity casting) was lower than the one of samples that were manufactured via LMD. This could be due to the coarser and less homogenously distributed Cr-rich carbides and borides that are present in the gravity casting samples.
  • However, the high alloy grade C, which was manufactured via gravity casting, showed a similar hot hardness to Stellite 6; thus, it could be a suitable candidate for the substitution of cobalt-based alloys in aircraft components.

Author Contributions

Conceptualization and methodology F.S.; nanoindentation and validation of results, E.R. and A.N.; microindentation and validation of results, P.L and A.N.; hot hardness measurements and validation of results, G.G., J.C.P. and A.N.; microstructure, FESEM, and EDS and EBSD map analysis, A.N. and R.G.-M.; solidification path simulation and analysis, D.G.; DRX analysis, test sample casting and gravity casting process optimization, M.R.; writing—original draft preparation, A.N.; writing—review and editing, J.C.P., E.R., P.L., G.G., J.C.P. and A.N; funding acquisition, F.S. and J.C.P. All authors have read and agreed to the published version of the manuscript.

Funding

This research project has received funding from the Clean Sky 2 Joint Undertaking (JU) under grant agreement no. 101007948. The JU receives support from the European Union’s Horizon 2020 research and innovation program and the Clean Sky 2 JU members outside the European Union.

Data Availability Statement

The raw/processed data required to reproduce these findings cannot be shared at this time due to technical or time limitations.

Acknowledgments

The authors would like to thank Jerome Rocchi from the Liebherr group for support and collaboration during this research project.

Conflicts of Interest

The authors declare no conflict of interest.

References

  1. Simunovic, K.; Saric, T.; Simunovic, G. Different Approaches to the Investigation and Testing of the Ni-Based Self-Fluxing Alloy Coatings—A Review. Part 1: General Facts, Wear and Corrosion Investigations. Tribol. Trans. 2014, 57, 955–979. [Google Scholar] [CrossRef]
  2. Balaguru, S.; Gupta, M. Hardfacing Studies of Ni Alloys: A Critical Review. J. Mater. Res. Technol. 2021, 10, 1210–1242. [Google Scholar] [CrossRef]
  3. Kazamer, N.; Muntean, R.; Valean, P.C.; Pascal, D.T.; Marginean, G.; Serban, V.-A. Comparison of Ni-Based Self-Fluxing Remelted Coatings for Wear and Corrosion Applications. Materials 2021, 14, 3293. [Google Scholar] [CrossRef] [PubMed]
  4. Ruiz, H.; Méndez, K.O.; Montoya, M.; Baltazar, V.H. Characterization of Flame Sprayed NiCrBSiMo Coatings Deposited with Different Spraying Parameters. Rev. De Metal. 2020, 56, e169. [Google Scholar] [CrossRef]
  5. Rachidi, R.; El Kihel, B.; Delaunois, F. Microstructure and Mechanical Characterization of NiCrBSi Alloy and NiCrBSi-WC Composite Coatings Produced by Flame Spraying. Mater. Sci. Eng. B 2019, 241, 13–21. [Google Scholar] [CrossRef]
  6. Navas, C.; Colaço, R.; de Damborenea, J.; Vilar, R. Abrasive Wear Behaviour of Laser Clad and Flame Sprayed-Melted NiCrBSi Coatings. Surf. Coat. Technol. 2006, 200, 6854–6862. [Google Scholar] [CrossRef]
  7. Dong, X.-Y.; Luo, X.-T.; Zhang, S.-L.; Li, C.-J. A Novel Strategy for Depositing Dense Self-fluxing Alloy Coatings with Sufficiently Bonded Splats by One-Step Atmospheric Plasma Spraying. J. Therm. Spray Technol. 2020, 29, 173–184. [Google Scholar] [CrossRef]
  8. Huang, S.; Zhou, J.; Sun, K.; Yang, H.; Cai, W.; Liu, Y.; Zhou, P.; Wu, S.; Li, H. Microstructural Charactistics of Plasma Sprayed NiCrBSi Coatings and Their Wear and Corrosion Behaviors. Coatings 2021, 11, 170. [Google Scholar] [CrossRef]
  9. Mrdak, M.; Vencl, A.L.; Ćosić, M. Microstructure and Mechanical Properties of the Mo-NiCrBSi Coating Deposited by Atmospheric Plasma spraying. FME Trans. 2009, 37, 27–32. [Google Scholar] [CrossRef]
  10. Krivorogova, A.S.; Ilinykh, N.I.; Ilinykh, S.A.; Gelchinskii, B.R. Theoretical and Experimental Study of Nickel-Based Self-Fluxing Materials. Russ. Metall. 2020, 8, 853–858. [Google Scholar] [CrossRef]
  11. Aoudia, K.; Retraint, D.; Verdy, C.; Langlade, C.; Creus, J.; Sanchette, F. Enhancement of Mechanical Properties and Corrosion Resistance of HVOF-Sprayed NiCrBSi Coatings Through Mechanical Attrition Treatment (SMAT). J. Therm. Spray Technol. 2020, 29, 2065–2079. [Google Scholar] [CrossRef]
  12. Singh, G.; Kaur, M.; Upadhyaya, R. Wear and Friction Behavior of NiCrBSi Coatings at Elevated Temperatures. J. Therm. Spray Technol. 2019, 28, 1081–1102. [Google Scholar] [CrossRef]
  13. Hemmati, I.; Ocelík, V.; Csach, K.L.; de Hosson, J.T.M. Microstructure and Phase Formation in a Rapidly Solidified Laser-Deposited Ni-Cr-B-Si-C Hardfacing Alloy. Metall. Mater. Trans. A 2014, 45A, 878–892. [Google Scholar] [CrossRef]
  14. Chen, J.L.; Li, J.; Song, R.; Bai, L.L.; Shao, J.Z.; Qu, C.C. Effect of the Scanning Speed on Microstructural Evolution and Wear Behaviors of Laser Cladding NiCrBSi Composite Coatings. Opt. Laser Technol. 2015, 72, 86–99. [Google Scholar] [CrossRef]
  15. Cheng, J.; Xing, Y.; Dong, E.; Zhao, L.; Liu, H.; Chang, T.; Chen, M.; Wang, J.; Lu, J.; Wan, J. An Overview of Laser Metal Deposition for Cladding: Defect Formation Mechanisms, Defect Suppression Methods and Performance Improvements of Laser-Cladded Layers. Materials 2022, 15, 5522. [Google Scholar] [CrossRef]
  16. Guo, C.; Zhou, J.; Chen, J.; Zhao, J.; Yua, Y.; Zhou, H. High Temperature Wear Resistance of Laser Cladding NiCrBSi and NiCrBSi/WC-Ni Composite Coatings. Wear 2011, 270, 492–498. [Google Scholar] [CrossRef]
  17. Conde, A.; Zubiri, F.; de Damborenea, J. Cladding of Ni–Cr–B–Si Coatings with a High Power Diode Laser. J. Mater. Sci. Eng. A 2002, 334, 233–238. [Google Scholar] [CrossRef]
  18. Pereira, J.C.; Taboada, M.C.; Niklas, A.; Rayón, E.; Rocchi, J. Influence of the Chemical Composition on the Solidification Path, Strengthening Mechanisms and Hardness of Ni-Cr-Si-Fe-B Self-Fluxing Alloys Obtained by Laser-Directed Energy Deposition. Manuf. Mater. Process. 2023, 7, 110. [Google Scholar] [CrossRef]
  19. Wang, W.; Liu, L.; Zhang, X.; Shi, Z.; Tian, Y.; Lin, J. Microstructures and Mechanical Properties of Ni60 Alloy Fabricated by Laser Metal Deposition. Mater. Res. Express 2020, 7, 016569. [Google Scholar] [CrossRef]
  20. Zimogliadova, T.-A.; Bataev, A.A.; Lazurenko, D.V.; Bataev, I.A.; Bataev, V.A.; Golkovskii, M.G.; Saage, H.; Ogneva, T.S.; Ruktuev, A.A. Structural Characterization of Layers Fabricated by Non-Vacuum Electron Beam Cladding of Ni-Cr-Si-B Self-Fluxing Alloy with Additions of Niobium and Boron. Mater. Today Commun. 2022, 33, 104363. [Google Scholar] [CrossRef]
  21. Zimoglyadova, T.A.; Saage, H.; Pasichnik, V.A.; Egorova, A.S.; Matts, O. Structure and properties of functional Sel-Fluxing Nickel Containing Coatings Obtained by Non-Vacuum Electron Beam Cladding. Met. Sci. Heat Treat. 2019, 60, 633–640. [Google Scholar] [CrossRef]
  22. Shishkovskya, I.; Kakovkina, N.; Sherbakof, V. Mechanical Properties of NiCrBSi Self-Fluxing Alloy after LPBF with Additional Heating. Procedia CIRP 2020, 94, 217–221. [Google Scholar] [CrossRef]
  23. Deenadayalan, K.; Murali, V.; Elayaperumal, A.; Arulvel, S. Effective Role of Short Time Furnace Heat Treatment and Laser Treatment on the Residual Stress and Mechanical Properties of NiCrBSieWC Weldments Produced using Plasma Transferred Arc Welding Process. J. Mater. Res. Technol. 2021, 15, 3492–3513. [Google Scholar] [CrossRef]
  24. Simunovic, K.; Saric, T.; Simunovic, G. Different Approaches to the Investigation and Testing of the Ni-Based Self-Fluxing Alloy Coatings—A Review. Part 2: Microstructure, Adhesive Strength, Cracking Behavior, and Residual Stresses Investigations. Tribol. Trans. 2014, 57, 980–1000. [Google Scholar] [CrossRef]
  25. Deshpande, S.; Kulkarni, A.; Sampath, S.; Herman, H. Application of Image Analysis for Characterization of Porosity in Thermal Spray Coatings and Correlation with Small Angle Neutron Scattering. Surf. Coat. Technol. 2004, 187, 6–16. [Google Scholar] [CrossRef]
  26. Giacomantonio, M.; Gulizia, S.; Jahedi, M.; Wong, Y.; Moore, R.; Valimberti, M. Heat Treatment of the Thermally Sprayed Ni-Based Wear and Corrosion Coatings. Mater. Forum 2011, 35, 48–55. [Google Scholar]
  27. Chun, E.-J.; Park, C.; Nishikawa, H.; Kim, M.-S. Microstructural Characterization of Ni-based Self-Fluxing Alloy after Selective Surface-Engineering using Diode Laser. Appl. Surf. Sci. 2018, 442, 726–735. [Google Scholar] [CrossRef]
  28. Škamat, J.; Černašėjus, O.; Zhetessova, G.; Nikonova, T.; Zharkevich, O.; Višniakov, N. Effect of Laser Processing Parameters on Microstructure, Hardness and Tribology of NiCrCoFeCBSi/WC Coatings. Materials 2021, 14, 6034. [Google Scholar] [CrossRef]
  29. Afanaseva, L.E.; Ratkevich, G.V.; Novoselova, M.V. Role of Structural Factor in Elevation of Wear Resistance of a Ni-Cr-B-Si Coating after Laser Treatment. Met. Sci. Heat Treat. 2020, 61, 581–587. [Google Scholar] [CrossRef]
  30. Muntean, R.; Valean, P.-C.; Kazamer, N.; Utu, I.-D.; Marginean, G.; Serban, V.A. Effect of Feedstock Powder Intrinsic Characteristics on the Tribological Behavior of Inductively Remelted NiCrBSi Flame-Sprayed Coatings. Lubricants 2023, 11, 363. [Google Scholar] [CrossRef]
  31. Simunovic, K.; Havrlisan, S.; Saric, T.; Vukelic, D. Modeling and Optimization in Investigating Thermally Sprayed Ni-Based Self-Fluxing Alloy Coatings: A Review. Materials 2020, 13, 4584. [Google Scholar] [CrossRef]
  32. Hemmati, I.; Ocelík, V.; De Hosson, J.T.M. Dilution effects in laser cladding of Ni–Cr–B–Si–C hardfacing alloys. Mater. Lett. 2012, 84, 69–72. [Google Scholar] [CrossRef]
  33. Cuculea, D.C.; Ardelean, G.L.; Stanciu, E.M.; Roata, I.C.; Pascu, A. Dilution in Laser Cladding with Ni-Based Powders. Weld. Equip. Technol. 2021, 32, 56–60. [Google Scholar] [CrossRef]
  34. Da Silva, L.J.; D’Oliveira, A.S.C.M. NiCrSiBC coatings: Effect of dilution on microstructure and high temperature tribological behavior. Wear 2016, 350–351, 130–140. [Google Scholar] [CrossRef]
  35. Wanare, S.; Kalyankar, V. Influence of Fe Dilution and W Dissolution on Abrasive Wear Resistance of NICRBSI-WC Composite Hardfacing Deposited by Plasma Transferred Arc Hardfacing. J. Adv. Manuf. Syst. 2021, 21, 695–710. [Google Scholar] [CrossRef]
  36. Sadhu, A.; Choudhary, A.; Sarkar, S.; Nair, A.M.; Nayak, P.; Pawar, S.D.; Muvvala, G.; Pal, S.K.; Nath, A.K. A study on the Influence of Substrate Pre-Heating on Mitigation of Cracks in Direct Metal Laser Deposition of NiCrSiBC-60%WC Ceramic Coating on Inconel 718. Surf. Coat. Technol. 2020, 389, 125646. [Google Scholar] [CrossRef]
  37. Dai, Q.-L.; Luo, C.-B.; You, F.-Y. Crack Restraining Methods and their Effects on the Microstructures and Properties of Laser Cladded WC/Fe Coatings. Materials 2018, 11, 2541. [Google Scholar] [CrossRef]
  38. Hemmati, I.; Ocelík, V.; De Hosson, J.T.M. Advances in Laser Surface Engineering: Tackling the Cracking Problem in Laser Deposited Ni-Cr-B-Si-C Alloys. JOM 2013, 65, 741–748. [Google Scholar] [CrossRef]
  39. Hemmati, I.; Rao, J.C.; Ocelík, V.; De Hosson, J.T.M. Phase Formation and Properties of Vanadium-Modified Ni–Cr–B-Si–C Laser-Deposited Coatings. J. Mater. Sci. 2013, 48, 3315–3326. [Google Scholar] [CrossRef]
  40. Hemmati, I.; Ocelík, V.; de Hosson, J.T.M. Effects of the alloy composition on phase constitution and properties of laser deposited Ni-Cr-B-Si coatings. Phys. Procedia 2013, 41, 302–311. [Google Scholar] [CrossRef]
  41. Hemmati, I.; Rao, J.C.; Ocelik, V.; De Hosson, J.T.M. Electron Microscopy Characterization of Ni-Cr-B-Si-C Laser Deposited Coatings. Microsc. Microanal. 2013, 19, 1–12. [Google Scholar] [CrossRef] [PubMed]
  42. Gómez-del Río, T.; Garrido, M.A.; Fernández, J.E.; Cadenas, M.; Rodríguez, J. Influence of the deposition techniques on the mechanical properties and microstructure of NiCrBSi coatings. J. Mater. Process. Technol. 2008, 204, 304–312. [Google Scholar] [CrossRef]
  43. Otsubo, F.; Era, H.; Kishitake, K. Structure and phases in nickel-base self-fluxing alloy coating containing high chromium and boron. J. Therm. Spray Technol. 2000, 9, 107–113. [Google Scholar] [CrossRef]
Figure 1. SWOT analysis of the gravity casting process as an alternative to manufacturing techniques such as flame spraying, plasma spraying, HVOF, LMD, and PTAW.
Jmmp 07 00196 g001
Figure 2. (a) Cone-shaped gravity casting (height = 170 mm, Ø superior = 160 mm, and Ø inferior = 110 mm). The test samples were extracted from the zone below the dashed line, and the (b) disc samples were used for microstructure analysis and hardness tests (Ø = 25 mm and height = 5 mm).
Jmmp 07 00196 g002
Figure 3. (a) Image used for determining the area fraction and equivalent diameter of carbides and borides in Alloy C: (b) boride analysis; and (c) carbide analysis. The different colors are used to indicate the precipitates with different sizes and morphologies.
Jmmp 07 00196 g003
Figure 4. Optical micrographs (25×) showing the dendritic structure of the different alloys: (a) Alloy A; (b) Alloy B; and (c) Alloy C.
Jmmp 07 00196 g004
Figure 5. Optical micrographs (200×) showing the distribution of the phases in the different alloys: (a) Alloy A; (b) Alloy B; and (c) Alloy C.
Jmmp 07 00196 g005
Figure 6. (a) Phases observed in Alloy A; and (b) the nanosized precipitates with butterfly and cube shapes that were observed at the γ-Ni dendrite borders (pointed with arrows in Figure 4a).
Jmmp 07 00196 g006
Figure 7. (a) Phases observed in Alloy C and analyzed via SEM/EDS; (b) the nanosized precipitates with butterfly and cube shapes that were observed at the γ-Ni dendrite borders (pointed with arrows in Figure 5a); and the (c) fine borides and carbides that were present in the center of the γ-Ni dendrite.
Jmmp 07 00196 g007
Figure 8. EDS analysis performed at 10 kV of the precipitates that were observed in the center of Alloy C. (a) The cube-shaped precipitate (Cr boride); and (b) the rod-shaped precipitate (Cr carbide).
Jmmp 07 00196 g008
Figure 9. (a) Spectrum of the Ni3 (B, Cr, and Fe) eutectic phase in Alloy C, which shows the presence of boron on EDS analysis at 5 kV. (b) Boron-rich precipitates and boron mapping at 15 kV using (c) WDS and (d) EDS detectors.
Jmmp 07 00196 g009
Figure 10. EDS element maps of Alloy A.
Jmmp 07 00196 g010
Figure 11. EDS element maps of Alloy C.
Jmmp 07 00196 g011
Figure 12. Indexed Kikuchi patterns of the different phases in Alloy C: (a) the γ-Ni matrix; (b) Ni3B; (c) Cr7C3; and (d) CrB.
Jmmp 07 00196 g012
Figure 13. Alloy A: (a) the EBSD phase map; (b) the electron image; and (c) the phase fractions.
Jmmp 07 00196 g013
Figure 14. Alloy C: (a) the EBSD phase map; (b) the electron image; and (c) the phase fractions.
Jmmp 07 00196 g014
Figure 15. X-ray diffraction patterns of (a) Alloy A; and (b) Alloy C.
Jmmp 07 00196 g015aJmmp 07 00196 g015b
Figure 16. Quantification of the carbide and boride sizes, as well as the area fractions, through image analysis.
Jmmp 07 00196 g016
Figure 17. Vickers hardness measured in the different phases of Alloys A and C at RT (25 °C) and at HT (650 °C).
Jmmp 07 00196 g017
Figure 18. Optical micrographs of the indententation arrays performed on (a,b) Sample A and Sample C under a 1200 nm indentation depth. (c) The indentations performed at a 500 nm depth on the individual phases of Sample A, such as the fine-eutectic, coarse-eutectic, and different γ-Ni zones. (d) Imprints on a single Cr-carbide phase at a 500 nm depth. The micrographs were captured using an optical microscope that was coupled to a nanoindenter at a 50× and 200× magnification.
Jmmp 07 00196 g018
Figure 19. Nanoindentation hardness and elastic modulus depth profiles obtained in different phases/compounds of (a) Sample A; and (b) Sample C.
Jmmp 07 00196 g019
Figure 20. Evolution of the Vickers hardness in the samples of Alloys A and C (which were obtained using the laser metal deposition (LMD) and gravity casting (GC) methods between 25 and 650 °C). The LMD data ref. [18] were reprinted under the terms of the Creative Commons CC BY license.
Jmmp 07 00196 g020
Figure 21. Equilibrium phase fractions of (a) Alloy A; and (b) Alloy C.
Jmmp 07 00196 g021
Figure 22. Scheil solidification simulation of (a) Alloy A; and (b) Alloy C.
Jmmp 07 00196 g022
Table 1. Chemical composition of the studied NiCrSiFeB alloys in wt.%.
AlloyChemical Composition (wt.%)
NiCrSiFeBCSi/B
A84.307.533.122.861.990.221.57
B83.508.083.432.851.620.392.03
C75.4012.603.984.782.590.401.54
Table 2. Chemical composition (in at. %) of the different phases in Alloys A and C, which were obtained via SEM/EDS analysis at 20 kV.
γ-Ni MatrixBorideCarbideCoarse EutecticFine Eutectic
Ni-B-Cr-Feγ-NiNi-B-Cr-FeNi-Si-Fe-Cr
Alloy A
B-18.05 *-*-
C--20.84----
Si3.49- -5.81-19.41
Cr7.8879.6377.846.669.025.170.86
Fe3.720.540.372.104.172.040.63
Ni84.911.781.2091.2480.9992.8079.32
Alloy C
B-48.465 *-*-
C--38.36----
Si10.580.30 -7.79-26.84
Cr7.7750.7955.484.905.924.860.85
Fe6.53-2.083.966.593.871.13
Ni75.130.444.0890.9879.6990.9771.18
* The presence of boron was only detected at 5 kV, and—at this voltage—the Alloy B content could not be quantified.
Table 3. Vickers hardness (HV0.1) of the different phases in Alloy A and Alloy C.
Phase/PrecipitateSample A Sample C
25 °C650 °C25 °C650 °C
γ-Ni fcc244 ± 26265 ± 7398 ± 54412 ± 55
Fine eutectic1238 ± 321178 ± 791215 ± 411214 ± 60
Coarse eutectic1385 ± 641406 ± 231374 ± 191352 ± 53
Cr-Carbides2033 ± 231935 ± 631899 ± 1531968 ± 138
Cr-Borides------2257 ± 442366 ± 157
Table 4. Nanoindentation results calculated at a 200 nm minimum depth and a 400 nm maximum depth for the different phases in Sample A and Sample C.
Phase/PrecipitateSample A Sample C
Hardness
(GPa)
Elastic Modulus
(GPa)
Hardness
(GPa)
Elastic Modulus
(GPa)
γ-Ni fcc3.4 ± 0.1216 ± 2.55.9 ± 0.1260 ± 2.0
γ-Ni with the presence of nano precipitates near the dendritic borders5.1± 0.1235± 2.5------
Fine eutectics12 ± 1.4266 ± 1.313.6 ± 1.3270 ± 1.0
Coarse eutectics16 ± 0.1273 ± 2.116 ± 0.2272 ± 3.2
Cr carbides23 ± 0.1329 ± 1.325 ± 0.3339 ± 2.5
Cr borides--- 35.5 ± 4.5>400
Table 5. Scheil solidification range calculated using Thermo-Calc.
AlloyT liq. (°C)T sol. (°C)ΔT (°C)
A1244.3968.5275.8
C1299.9955.6344.3
Disclaimer/Publisher’s Note: The statements, opinions and data contained in all publications are solely those of the individual author(s) and contributor(s) and not of MDPI and/or the editor(s). MDPI and/or the editor(s) disclaim responsibility for any injury to people or property resulting from any ideas, methods, instructions or products referred to in the content.

