Article

Vickers Hardness Mechanical Models and Thermoplastic Polymer Injection-Molded Products’ Static Friction Coefficients

Graduate School of Organic Materials Science, Yamagata University, Yonezawa 992-8510, Japan
J. Manuf. Mater. Process. 2024, 8(1), 11; https://doi.org/10.3390/jmmp8010011
Submission received: 13 November 2023 / Revised: 21 December 2023 / Accepted: 4 January 2024 / Published: 5 January 2024

Abstract

:
The surface mechanical properties of thermoplastics are crucially important for evaluating molded products’ vulnerability to scratching. Because surface mechanical properties reflect material performance directly in terms of durability and frictional behavior, understanding and modeling them is important for industry and research. This emphasizes the surface mechanical properties of Vickers hardness and the static friction coefficient, with attempts to model them as functions of stress at yield initiation. Vickers hardness can be related to the compressive stress at yield initiation. The static friction coefficient can be modeled as a function of the surface shear strength and Vickers hardness. This research has improved our understanding of thermoplastics’ surface mechanical properties and has enabled the prediction of the scratch performance of molded products and the provision of effective indicators for material design.

1. Introduction

Thermoplastics are widely used across various fields—from daily necessities to automobiles—due to their superior lightweight characteristics and excellent moldability [1,2]. As thermoplastics have lower melting temperatures than metals and ceramics, they can be efficiently melt-molded at relatively low energy costs. Specifically, the injection molding method is often employed as the molding process for thermoplastics because it allows for near-net-shape molding, making it ideal for mass production [3,4]. Depending on the specific application, molded products may necessitate certain surface characteristics [5,6]. For instance, scratch resistance is a crucial property for displays. The authors observed that the surface shear strength and the indenter contact area can be utilized to obtain the frictional force in a ball-on-disk test [7]. The surface shear strength can be assessed through overlapped short beam shear tests. However, a physical test is required to determine the indenter contact area. The evaluation of scratchability requires indentation hardness, which determines the indentation depth and depends on the indenter indentation depth. Rockwell hardness is the primary method for measuring surface hardness in thermoplastics [8]. This method of hardness evaluation is based on the indentation shape resulting from a spherical indenter pressed against the surface. It should be noted that the presence of sharp scratches on the surface of the molded product is not taken into account.
This study examined Vickers hardness, which is determined by the shape of an indentation formed by pressing a square pyramid with a sharp tip against an indenter. The main application of this hardness test is to evaluate the surface hardness of metals and ceramics. The indenter shape being a regular pyramid makes it useful for assessing hardness anisotropy [9,10,11]. Tabor established the correlation between yield stress and Vickers hardness, but their study focused solely on metallic materials. Since then, subsequent studies have been conducted on polymeric materials. While qualitative correlations were identified, these did not strictly follow the same patterns as those observed in metallic materials, indicating lower quantitative accuracy [12]. Therefore, it cannot currently be said that property values intrinsically correlated with the Vickers hardness of polymeric materials can be captured. Weiler tested micro-Vickers hardness on several thermoplastic polymers and obtained hardness values. Establishing a correlation between Vickers hardness and yield stress will enable the evaluation of thermoplastic molded product properties through Vickers hardness. He also determined the correlation between Vickers hardness and yield stress [13]. It was discovered that Vickers hardness is directly proportional to tensile yield stress, maintaining a constant relationship regardless of grade. The coefficient value of 2.33 is distinct from the value of 3 uncovered by Tabor in their investigation of metallic materials. Additionally, Flores et al. explored the relationship between micro-Vickers hardness and tensile/compressive yield stresses in polyethylene with varying molecular structures and forming processes [14]. The researchers reported coefficients of 3 for tensile yield stress and 2 for compressive yield stress. However, the relationship between yield stress and micro-Vickers hardness was approximated as a linear relationship that passed through the origin. However, this straight line demonstrated a large error in the region where yield stress was small.
Recently, a technique called nanoindentation has emerged as a means of evaluating hardness using loads smaller than those required for micro-Vickers testing. Utilizing this method, the hardness distribution in the thickness direction is obtainable [15,16]. Koch et al. also studied stress and compressive yield stress using this technique [17].
They only studied press-molded products in which the phase structure in the thickness direction was nearly uniform. Injection-molded products, on the other hand, were not included in their study. It is worth noting that injection-molded products have a hierarchical structure. The surface layer region in contact with the mold is referred to as the skin layer, and the interior of the molded product is widely classified as the core layer [18,19,20,21]. According to a report [22], the residual stresses near the surface of injection-molded parts can be affected by the injection molding conditions. For instance, varying mold temperatures may lead to varying levels of compressive residual stress near the part surface. It is believed that such residual stress can impact the yield stress and elastic modulus of the skin layer. When examining the correlation between indentation hardness and yield stress of injection-molded parts, it is important to evaluate the yield stress of the skin layer. When examining the correlation between indentation hardness and yield stress of injection-molded products, it is necessary to evaluate the yield stress of the skin layer. The yield stress obtained through uniaxial tensile or compression tests may not be appropriate for explaining the indentation hardness of injection-molded parts.
No mechanical model has been established to clearly explain the correlation between Vickers hardness and yield stress of injection-molded products. A precise estimation of yield stress from indentation hardness of these products can enable the estimation of anisotropy and thickness direction distribution.
The coefficient of friction is a crucial surface property. Adhesion theory posits the coefficient of friction as the ratio of indentation hardness to shear strength [23]. If one can accurately determine the indentation hardness of an injection-molded part based on its yield stress, a mechanical model for the coefficient of friction of similar parts can be developed.
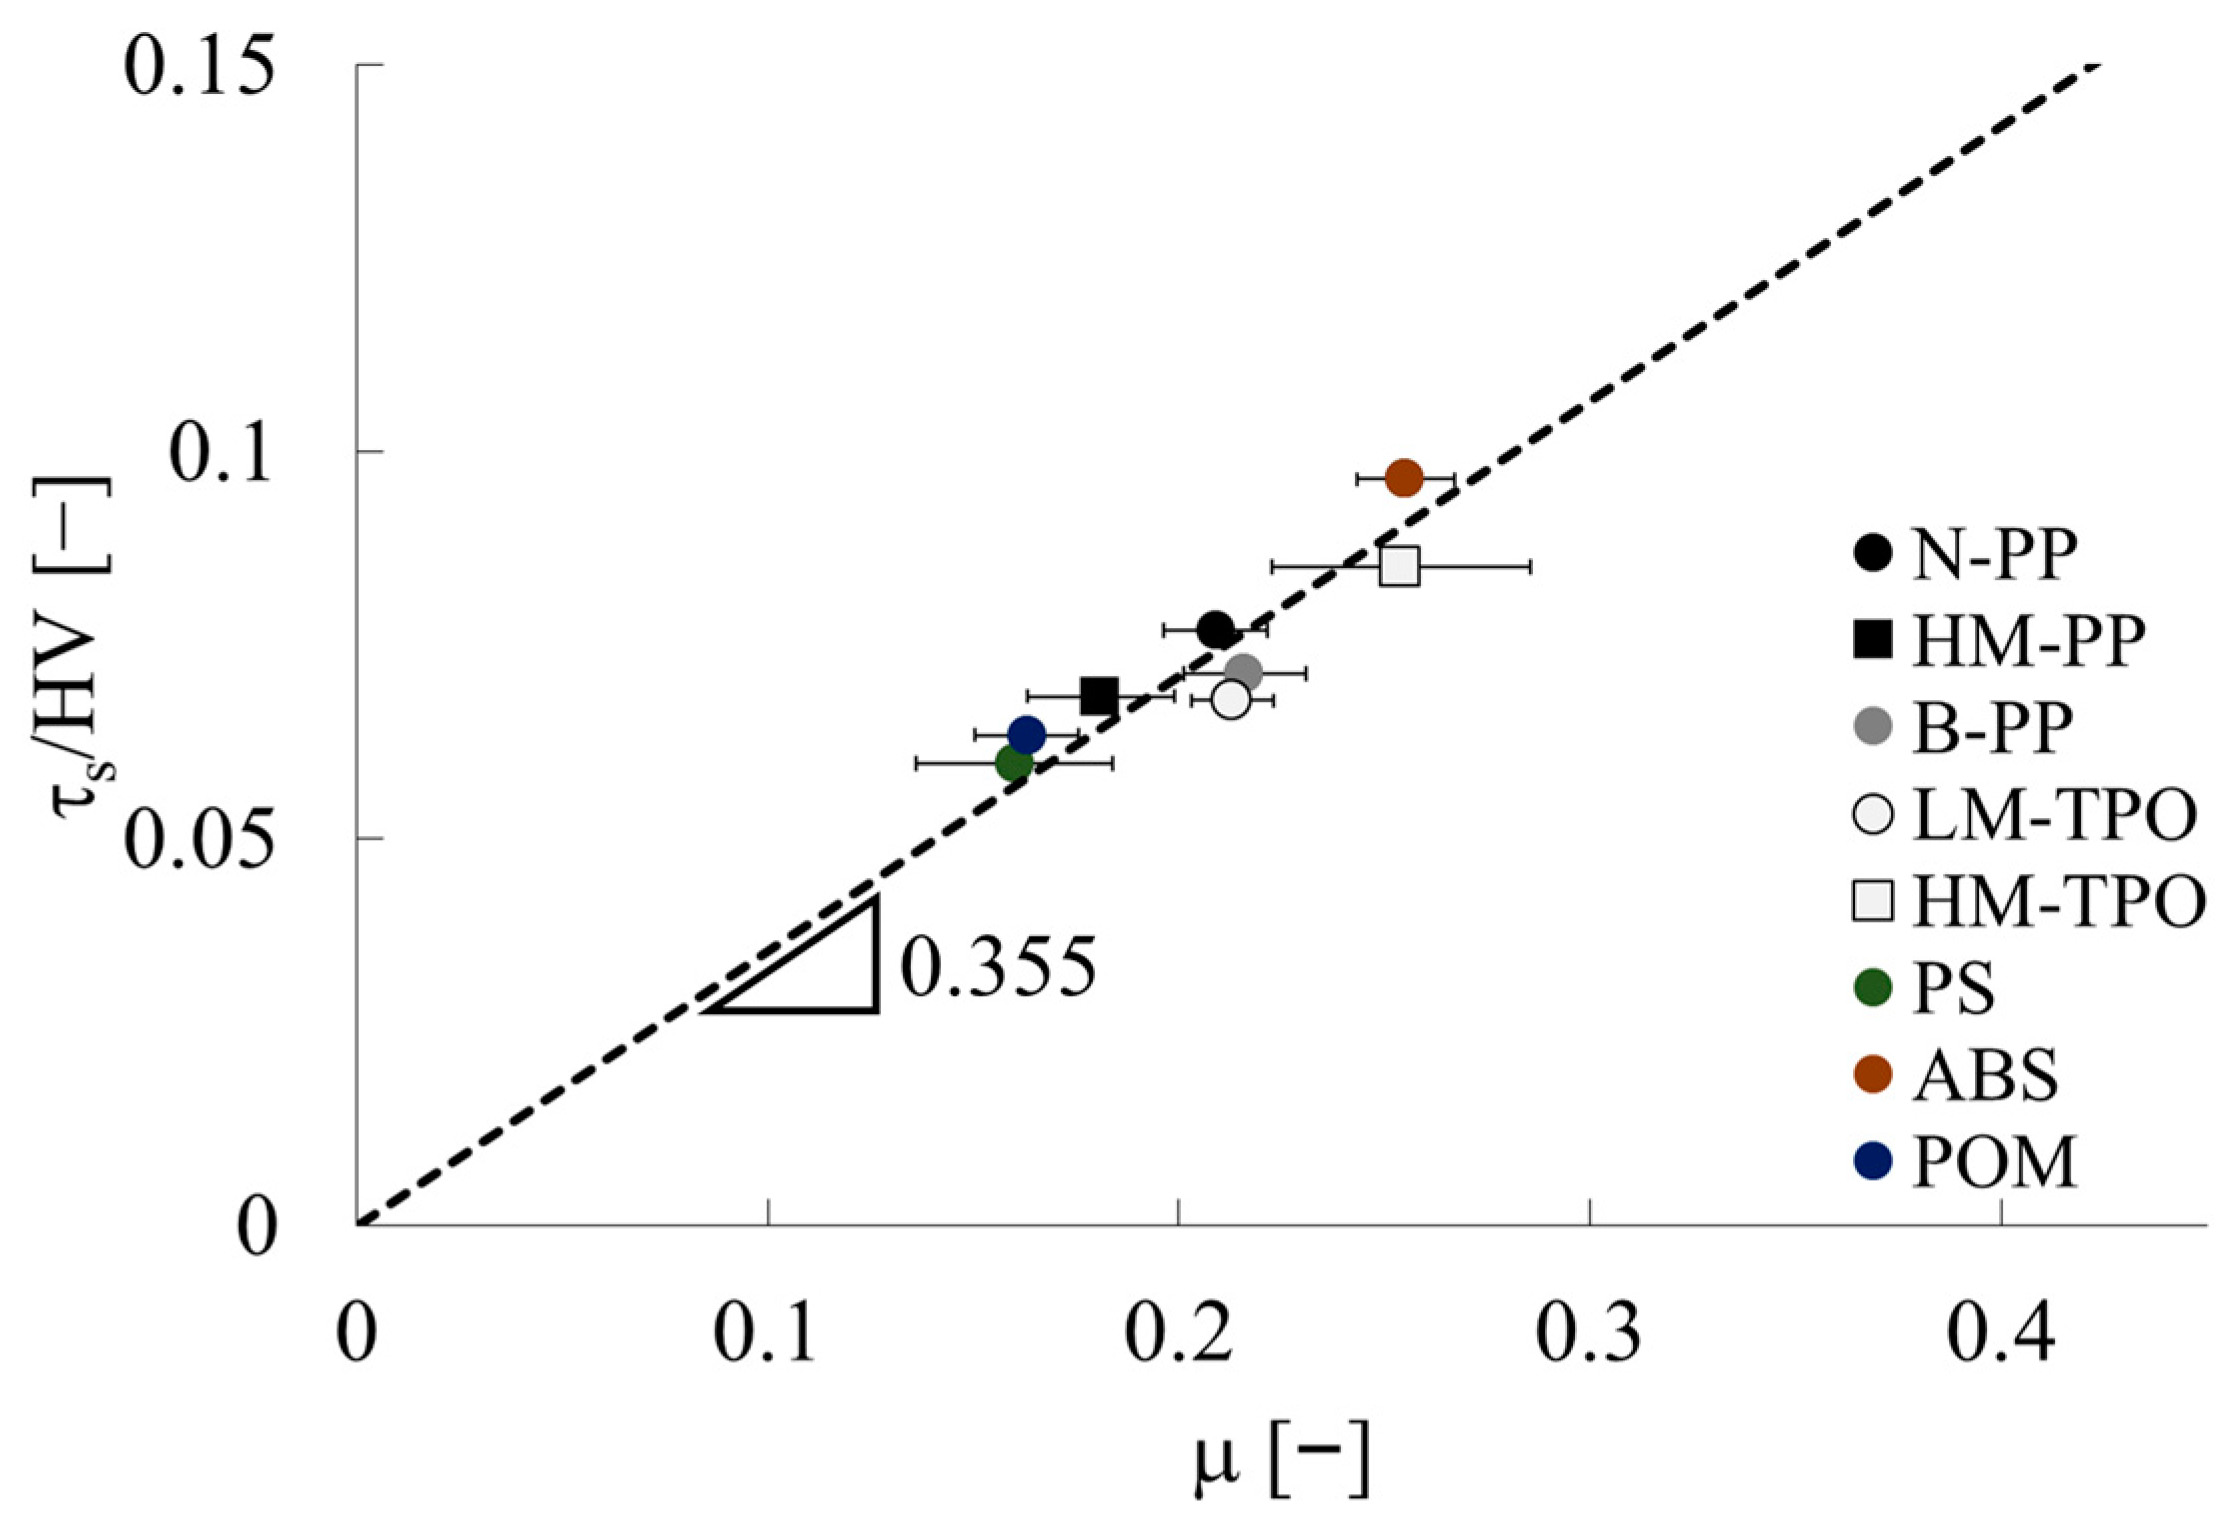
In this study, thermoplastic injection-molded parts were fabricated and the surface hardness was evaluated using a micro-Vickers hardness tester. The authors combined previous theories and their own mechanical property evaluation method to identify property values that are intrinsically correlated with the Vickers hardness of thermoplastics. Furthermore, we researched the surface’s mechanical properties including its static friction coefficient and developed a theoretical adhesion-based model for the coefficient by utilizing data from Vickers hardness and shear stress at yield initiation.

2. Materials and Methods

2.1. Materials

The specifications of the thermoplastic pellets employed in this study are outlined in Table 1, encompassing three varieties of polypropylene (PP), two variants of thermoplastic polyolefin (TPO), and a type of polystyrene (PS) categorized as general-purpose plastics. Additionally, engineering plastics and polymer alloys included a type of polyoxymethylene (POM) and a type of acrylonitrile-butadiene-styrene copolymer (ABS). Specifically focusing on polypropylene, two distinct types were examined: a block type (B-PP) and a homo type, with the homo type further categorized into two sub-types, namely a normal type (N-PP) and a high-modulus type (HM-PP). For TPO, two variations were prepared: a low-modulus type (LM-TPO) and a high-modulus type (HM-TPO).

2.2. Injection Molding

After loading the pellets into a micro-electric injection molding machine (C, Mobile0813; Shinko Sellbic Co., Ltd., Tokyo, Japan), molded products were obtained through the use of injection molding. The shapes and dimensions of the molded products are illustrated in Figure 1. Two types of molded products were prepared for this study: beam-shaped and disk-shaped molded products. The injection molding conditions, including Tinj, Tmold, Vinj, Phold, tinj, and tcool, as indicated in Table 2, represent the injection molding temperature, mold temperature, injection speed, holding pressure, filling and holding time, and cooling time, respectively. The tables indicate the conditions used to obtain moldings suitable for testing.

2.3. Three-Point Bending Tests

Three-point bending tests were executed using beam-shaped specimens in accordance with ISO 178 [24]. These tests were carried out using a tabletop tensile and compression testing machine (MCT-2150; A&D Co., Ltd., Tokyo, Japan). The loading speed was set at 10 mm/min, and the span was 40 mm. The resultant load from this test was denoted as Pf. The bending stress, σf, was computed using Equation (1).
σ f = 3 P f S 2 b h 2
In the provided equation, the symbol S represents the span, b is used for the specimen width, and h signifies the specimen thickness. The bending strain, εf, was determined by applying Equation (2) to the deflection measured in this test, denoted as δf.
ε f = 6 δ f h S 2
The flexural yield initiation stress, denoted as σfy, was determined as 2/3 of the maximum point value from the σff curve obtained in the three-point bending test. The initial slope of the curve was identified as the flexural modulus Ef.
With the obtained values of σfy and Ef, the Poisson’s ratio υ for the fabricated specimens was calculated using a method outlined by Takayama and Motoyama [25]. The yield initiation stress σy was then obtained using Equation (3).
σ y = σ f y 1 + υ 1
This equation holds true under the condition that the tensile deformation resulting from the three-point bending test is exclusively tensile in nature. Each specimen underwent five three-point bending tests, and the resulting average values for σfy and Ef are presented as the results herein. These mean values were employed to compute the Young’s modulus using a method documented by Takayama and Motoyama [25].

2.4. Micro Vickers Hardness Testing

The obtained molded product was used to evaluate Vickers hardness using a micro-Vickers hardness tester (HM-102; Mitutoyo Corp., Kanagawa, Japan). The load and loading time were, respectively, 9.8 N and 15 s. Vickers hardness was calculated with Equation (4) using the average length d of the indentation after the test as
H V = 1.854 P d 2
where P denotes the load. The test was conducted five times for each sample. The average value of the evaluated Vickers hardness was used as a result of this paper.

2.5. Friction Coefficients at Static Loading

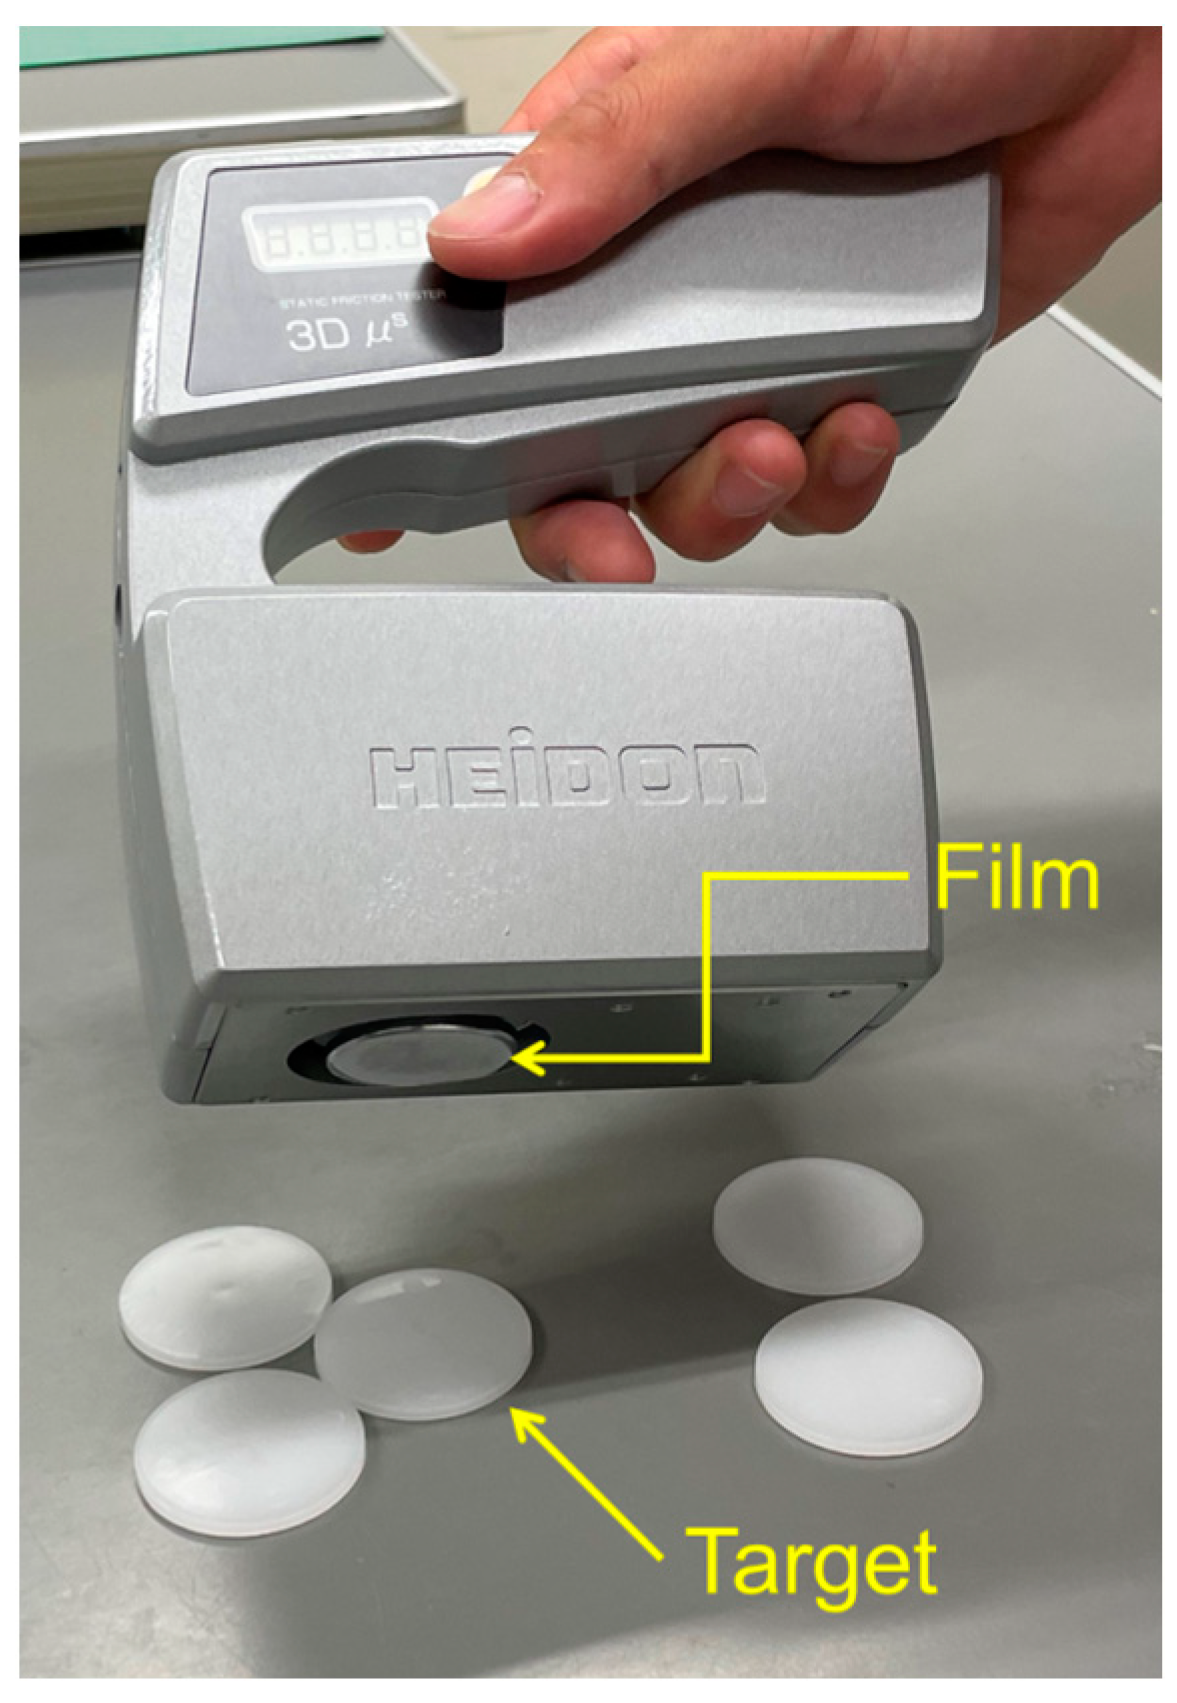
The static friction coefficient was found using a static friction meter (3D MUSE TYPE: 37i, Shinto Scientific Co., Ltd., Saitama, Japan) on a disk-shaped molded product obtained by means of injection molding. The actual measurement method is depicted in Figure 2. A film with about 100 μm thickness was produced using the heat press molding, with the material to be measured attached to the measurement surface. Therefore, the static friction coefficient evaluated as described herein represents the value obtained when the target material threads are in contact. After 20 measurements were taken, the average value was inferred as the characteristic value.

3. Results and Discussion

3.1. Correlation between Vickers Hardness and Yield Initiation Stress

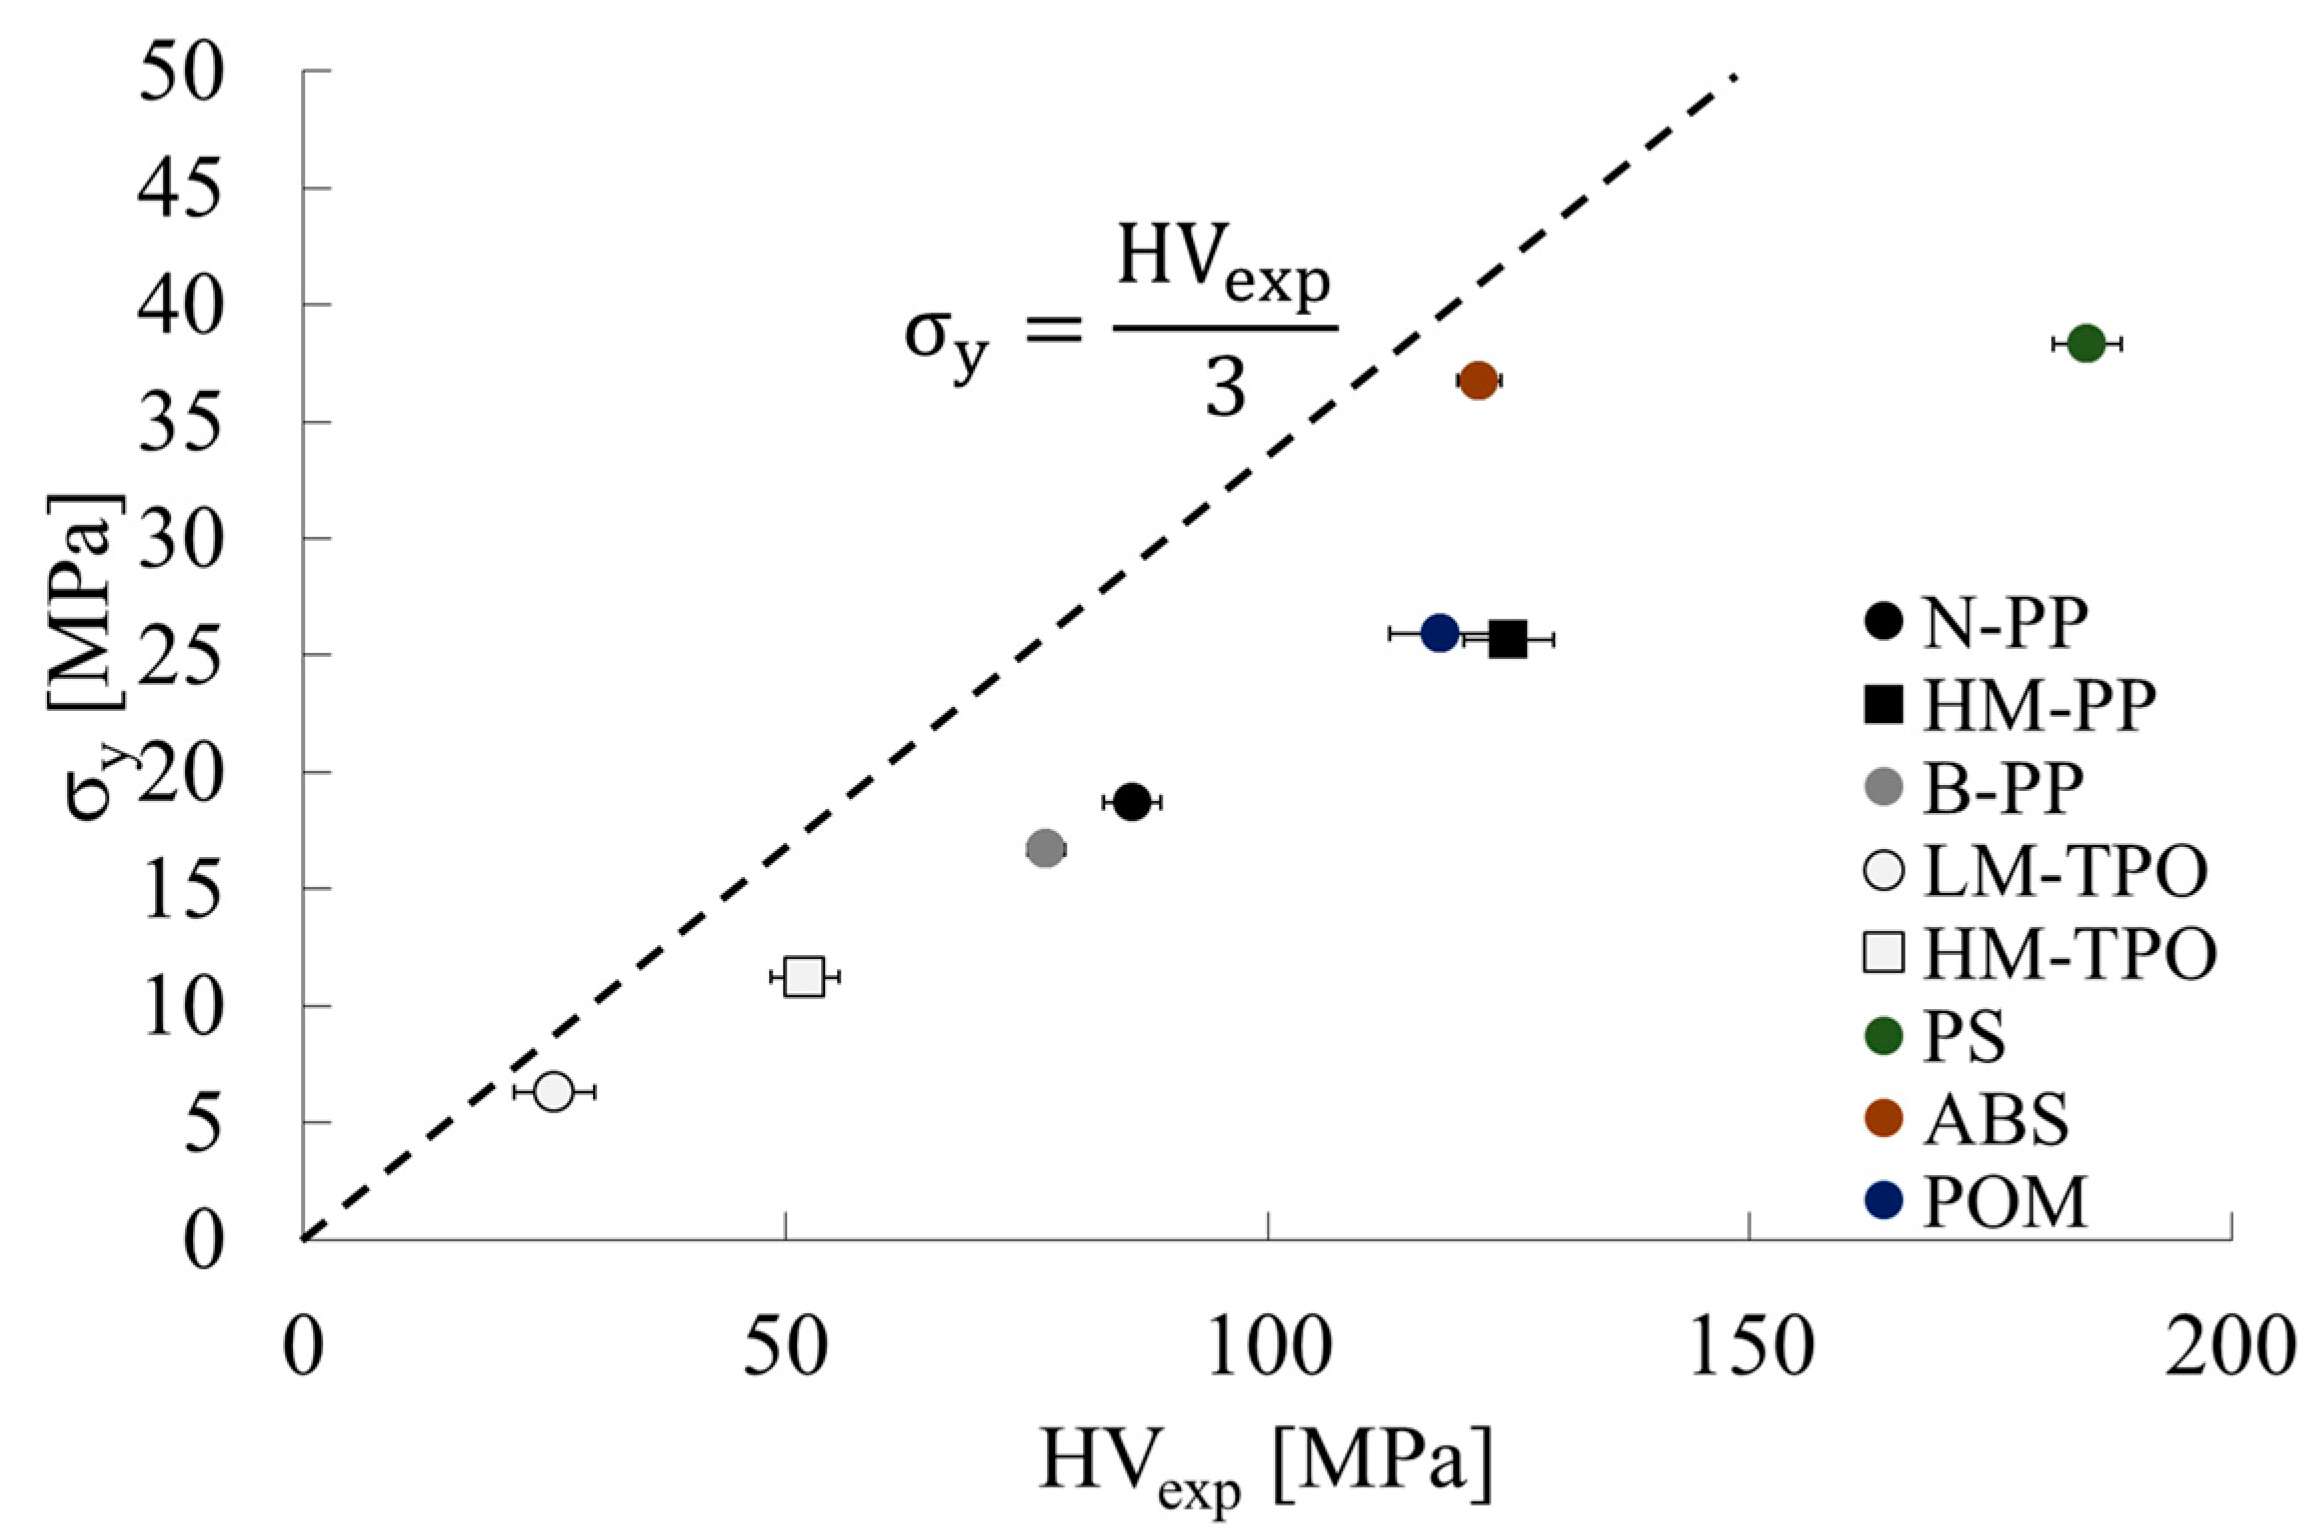
Table 3 shows results obtained from the evaluation of the flexural yield initiation stress and flexural modulus from the three-point bending test. In this table, the longitudinal modulus of elasticity and Poisson’s ratio calculated in studies reported by Takayama and Motoyama [25] are also presented. Table 4 shows the Vickers hardness obtained from the micro-Vickers hardness test. Numbers in parentheses in the table represent standard deviations. In this table, the calculation results of the stress at yield initiation obtained using Formula (3) are also shown. This table shows the positive correlation between the Vickers hardness and yield initiation stress. Tabor presented Equation (5), incorporating Vickers hardness and yield stress [12].
H V = 3 σ y
This equation has been reported as valid for metallic materials. Figure 3 shows the correlation between Vickers hardness and yield initiation stress evaluated in the present study. Error bars in the figure represent standard deviations. According to the results examined for this study, the slope between Vickers hardness and yield initiation stress does not agree quantitatively with that of the metallic material shown in Equation (5). The following discussion will address the causes for this lack of agreement.
Since the area undergoing compressive load during the Vickers hardness test is significantly smaller than the entire molded product, it can be assumed that the compressive load is applied in a plane strain state. This means that the compressive stress at yield initiation, σyc, as described by Equation (6), is closely associated with the Vickers hardness.
σ y c = σ y 1 υ + υ 2
For this equation, one assumes that Mises’s yield condition holds [26]. When Tresca’s yield condition holds, Equation (7) holds [27].
σ y c = σ y 1 υ
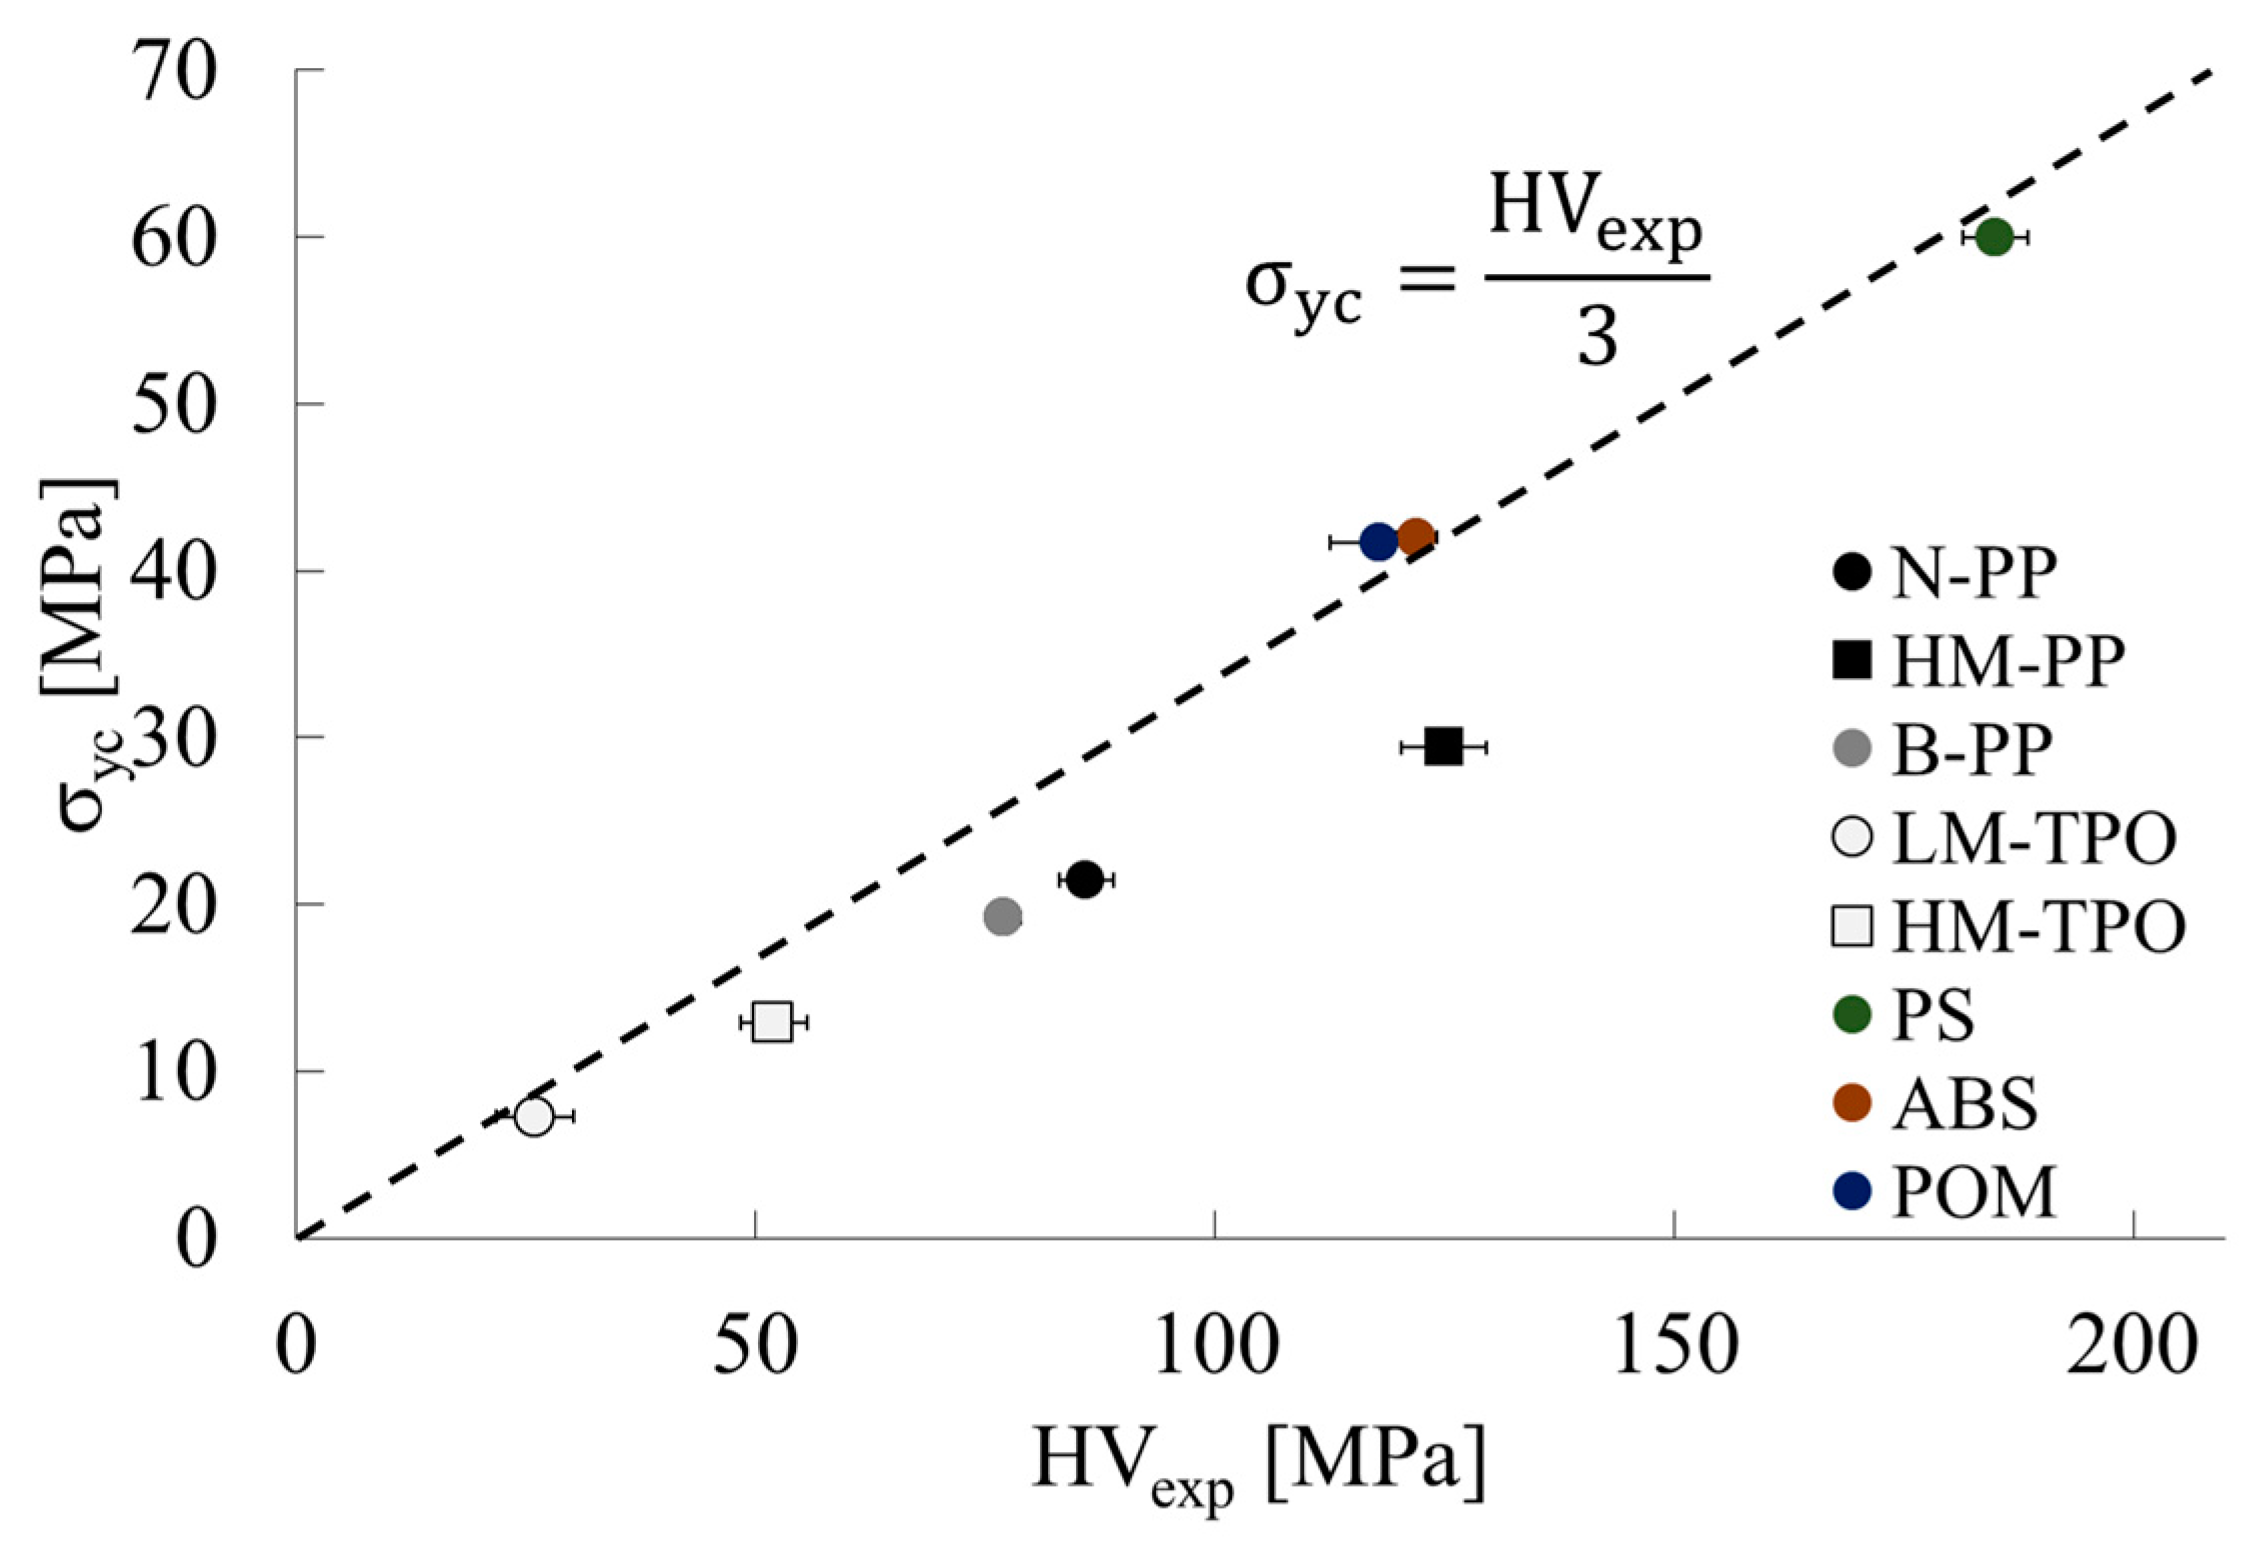
Of the materials treated in this paper, Mises’s yield conditions were applied to PP, TPO, and ABS, whereas Tresca yield conditions were applied to PS and POM. This selection clarifies the correlation between Vickers hardness and compressive stress at yield initiation, which will be discussed later. Based on these theories, it is believed that Equation (5) is roughly applicable to metallic materials when using tensile yield initiation stress due to their small Poisson’s ratio. Conversely, it is believed that polymeric materials exhibit significantly different behaviors under tensile loading and compressive loading due to their relatively large Poisson’s ratio. Figure 4 presents the correlation between Vickers hardness and compressive stress at the onset of yield. The error bars in the figure represent the standard deviation. The results show that correlation between the compressive stress at the onset of yield and Vickers hardness under plane strain conditions is approximately equal to that in Equation (5). However, the calculated results tended to be lower when PP and TPO were emphasized. The following discussion addresses the cause of this.
Among the materials used for this study, PP and TPO are classified as low-yield-stress materials. Since the load used in the conducted Vickers test was held constant at 9.8 N, it is believed that if the compressive stress at the point of yield is low, then the compressive load received during the test will result in plastic deformation from the indenter’s tip to a relatively wider area. Using only the shape of the indenter, the maximum distance of this plastic deformation (sMAX) can be expressed as Equation (8).
s M A X = ρ e x p π 2 φ 2 1
In this equation, ρ and φ represent the radius of the indenter tip and the opening angle. In the area where plastic deformation takes place, stress concentration is expected, as per Equation (9) [28].
β = 1 + ln 1 + s ρ
where s represents the distance of plastic deformation from the indenter tip and β represents the stress concentration caused by this constraint. The maximum value of β, βMAX, can be expressed by Equation (10) [28].
β M A X = 1 + π 2 φ 2
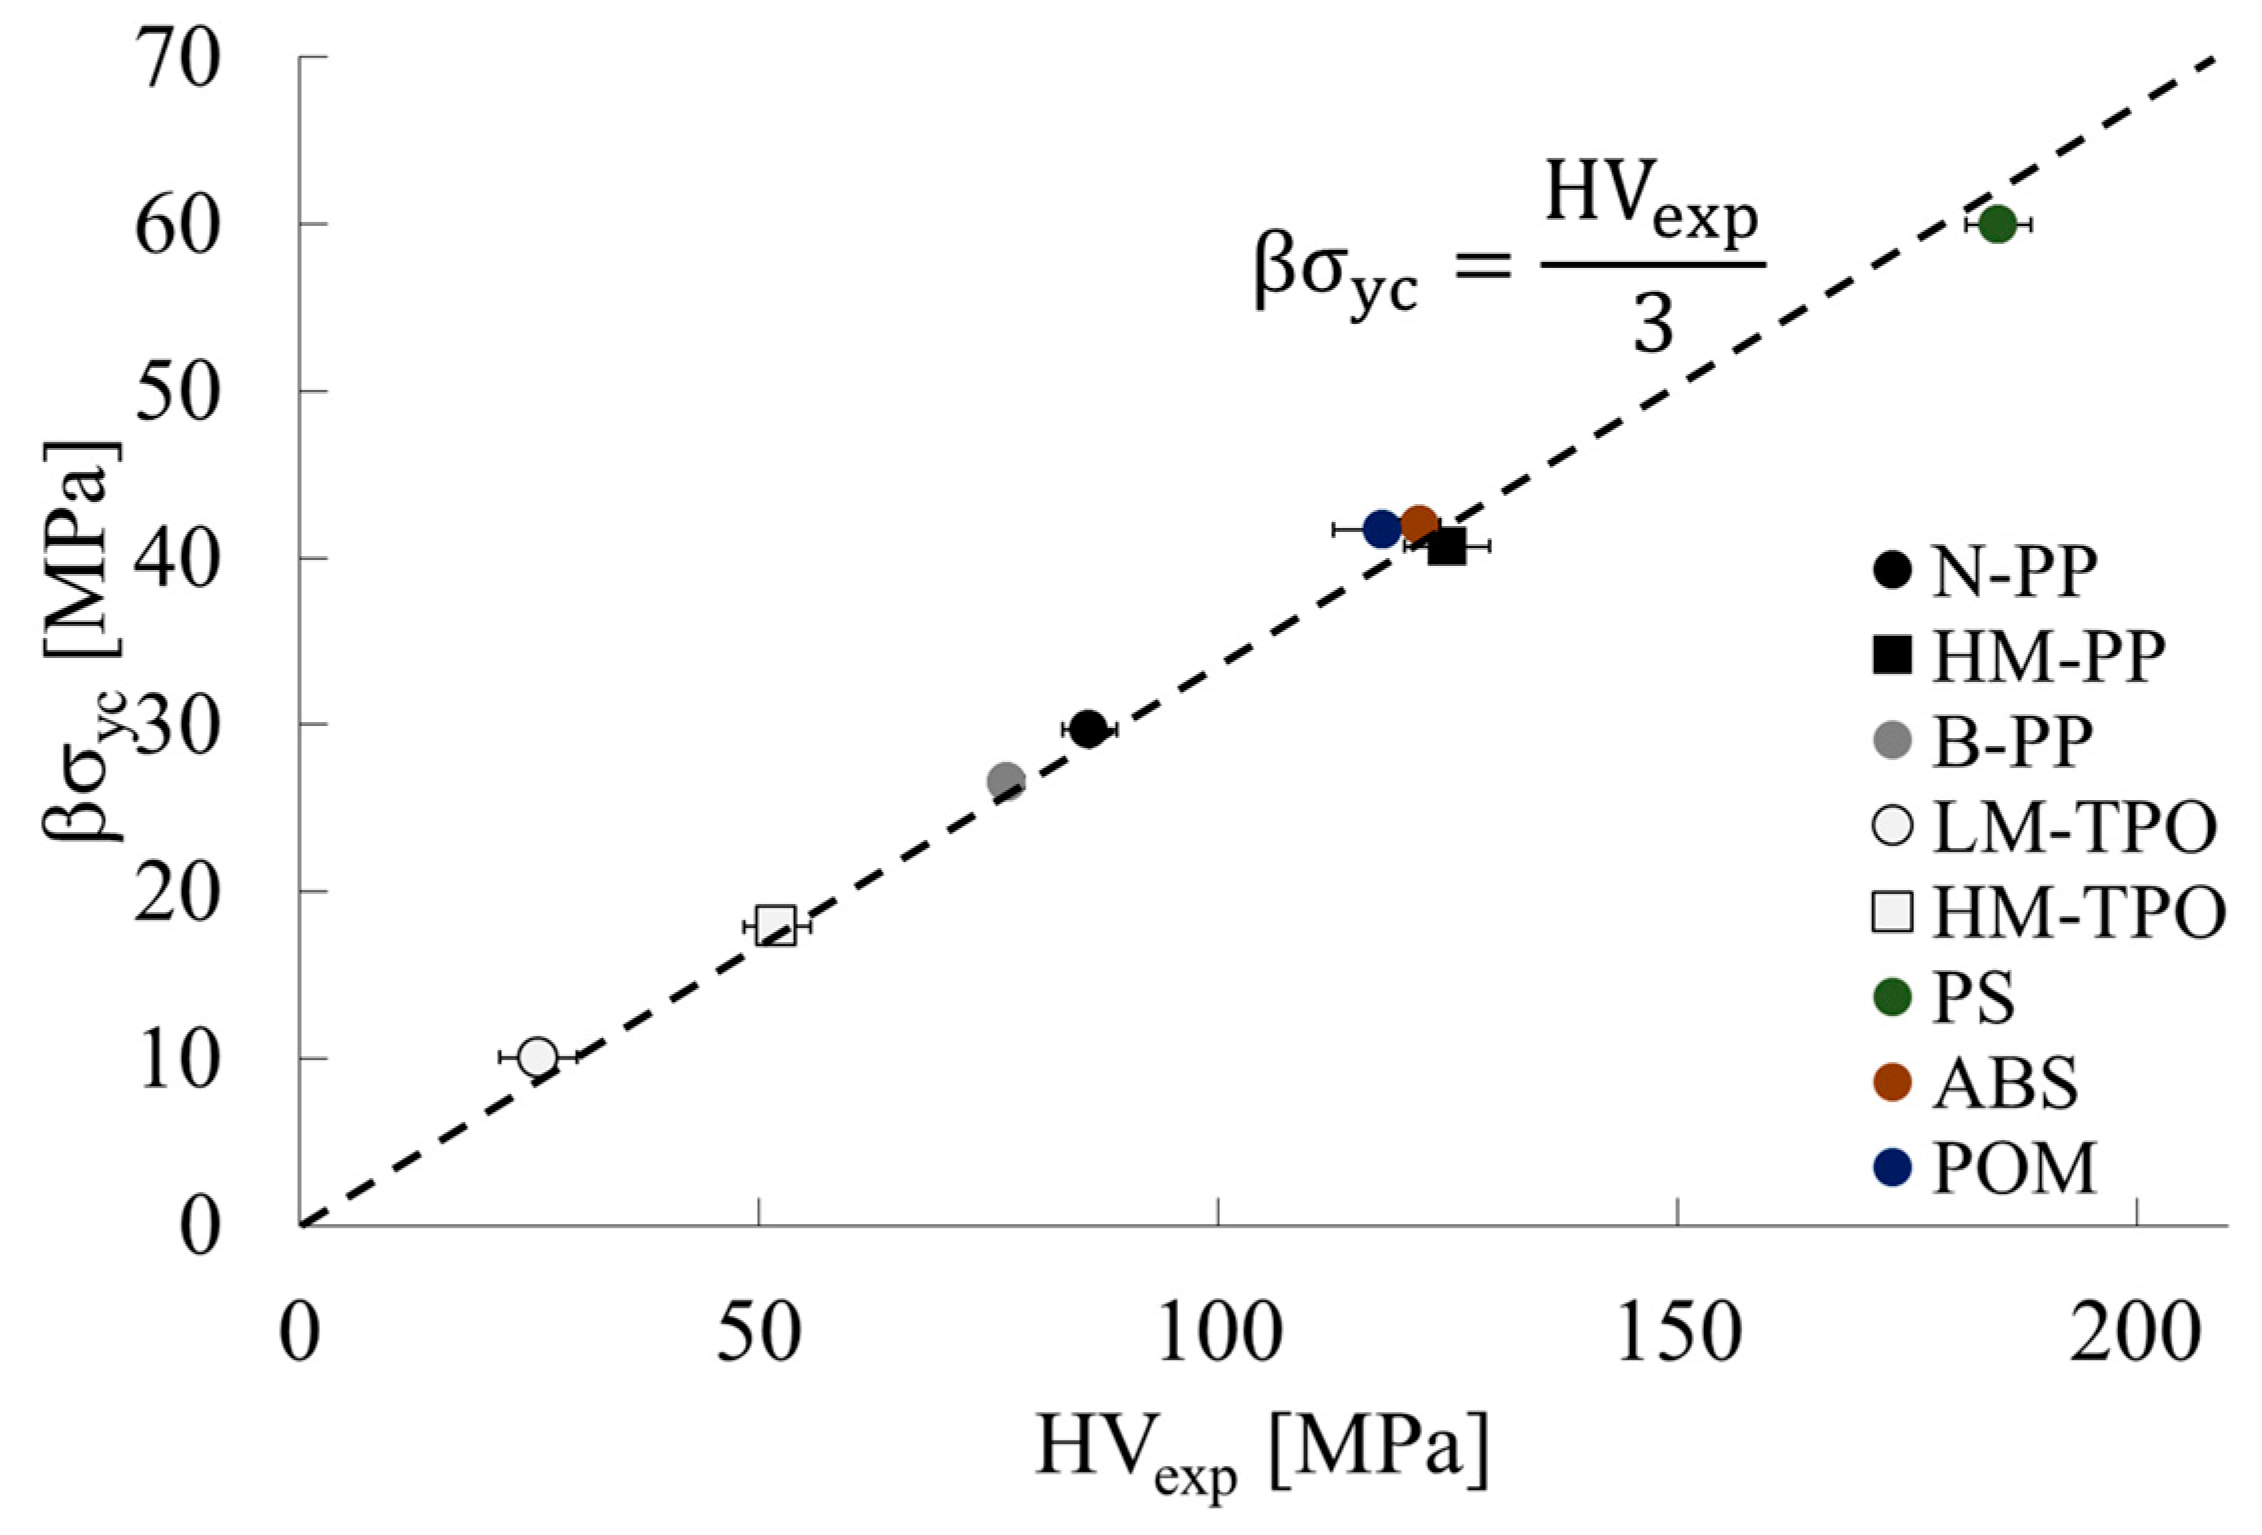
The angle of the indenter used in the Vickers hardness test is 136 degrees [29]. Therefore, the stress concentration factor because of the plastic restraint caused by the Vickers hardness test is calculated as 1.384. In light of the points presented above, for materials with small yield initiation stress, such as PP and TPO, a correlation might exist between the value of βMAX multiplied by the compressive stress at yield initiation and Vickers hardness. Figure 5 presents the correlation between the value of βMAX multiplied by the compressive stress at the onset of yield and Vickers hardness.
The correlation between the value of β multiplied by the compressive stress at the onset of yield and the Vickers hardness was obtained as shown in Equation (5). In other words, the following Equation (11) was found to be valid between Vickers hardness and compressive stress at yield initiation for polymeric materials.
H V c a l = 3 β σ y c
The coefficient β is derived from the size of the plastic zone, which is considered to depend on the applied stress. Figure 6 illustrates the relationship between β and σyc, indicating that β starts to increase when σyc is less than about 40 MPa. It is likely that this threshold depends on the loading conditions used in the test, although this point is not addressed in this paper and requires further study.

3.2. Mechanical Model for Static Friction Coefficient of Polymeric Materials

Table 5 illustrates the evaluation results of the static friction coefficient obtained via the static friction meter. Numbers in parentheses in the table represent standard deviations. In the present study, a mechanical model that relies on the theory of adhesion was utilized to reproduce these results. According to the adhesion theory, the frictional force F is described by Equation (12) [20],
F = τ y s A s
where τys denotes the surface shear strength and As is the contact area. It has been reported by the authors that τys is equal to σy divided by 3 [7]. Using the coefficient of friction, μ, to express the frictional force yields Equation (13).
F = μ N
where N denotes the indentation force. Substituting Equation (12) into Equation (13) and summarizing it for the coefficient of friction results in the following Equation (14).
μ = τ y s N A s = τ y s H i
The denominator on the right-hand side of Equation (12) represents the indentation hardness Hi, which is the indentation force divided by the contact area. This methodology provides a clear and objective means of calculating indentation hardness. Thus, Equation (15) expresses the coefficient of friction as proportional to the ratio of surface shear strength to Vickers hardness with proportionality coefficient C.
μ = τ y s C · H V
The relationship between the coefficient of static friction obtained using a static friction meter and surface shear strength/Vickers hardness is illustrated in Figure 7. This paper adopts Vickers hardness as the indentation hardness and the error bars in the figure indicate the standard deviation. Based on the aforementioned figure, it is notable that there exists a direct relationship between the coefficient of static friction and surface shear strength/indentation hardness, which supports the conclusion of Equation (15).
Based on the adhesion theory, the frictional force is determined by the surface shear strength and the contact area of the indenter. It is important to note that no frictional force will be generated if the indenter is not indented. The amount of indentation deformation can be determined by the indentation hardness. As the indentation hardness increases, the amount of indentation deformation decreases, resulting in a smaller contact area of the indenter and therefore a smaller frictional force. It is believed that as the indentation hardness increases, the amount of indentation deformation decreases, resulting in a smaller friction coefficient for the same indentation load.
If the indentation hardness in Equation (15) is defined as Vickers hardness, this value can be obtained using Equation (11). Therefore, based on the results of this study, the Vickers hardness and static friction coefficient of the polymeric material can be estimated approximately by utilizing the results of the three-point bending test. These results demonstrate the surface mechanical properties of thermoplastic polymeric materials and will be important for future material development research.
Further research on surface mechanical properties in different thermoplastic types and conditions is needed. Furthermore, it will be crucial to compare and correlate with other evaluation methods and indices and to explore additional application areas. These studies are anticipated to advance the development of high-performance thermoplastics and support sustainable industries.

4. Conclusions

The surface properties of thermoplastics are important properties for evaluating the scratchability of molded products. As described herein, we particularly examined Vickers hardness and static friction coefficient as surface properties and attempted to model these properties as a function of stress at yield initiation. The results indicate that Vickers hardness is a function of the compressive stress at yield initiation and that the static friction coefficient is a function of the surface shear strength and Vickers hardness.
It is expected that the relationship between Vickers hardness and stress at yield initiation revealed in this paper can be applied to evaluate the anisotropy of yield stress in molded polymer products and to determine the distribution of yield stress in the thickness direction. This information will be useful for determining the local mechanical properties of injection-molded products that form hierarchical structures.
The mechanical model of the static friction coefficient constructed in this paper, together with the surface shear strength reported in another paper, is expected to facilitate discussions on the scratchability of molded polymeric products.

Funding

This research received no external funding.

Data Availability Statement

The data presented in this study are available on request from the corresponding author.

Conflicts of Interest

The author declares no conflicts of interest.

References

  1. McCrum, N.G.; Buckley, C.P.; Bucknall, C.B. Principles of Polymer Engineering; Oxford University Press: New York, NY, USA, 1988. [Google Scholar]
  2. Juster, H.; Aar, B.; Brouwer, H. A Review on Microfabrication of Thermoplastic Polymer-Based Microneedle Arrays. Polym. Eng. Sci. 2019, 59, 877–890. [Google Scholar] [CrossRef]
  3. Chaudhary, B.; Li, H.; Matos, H. Long-term mechanical performance of 3D printed thermoplastics in seawater environments. Results Mater. 2023, 17, 100381. [Google Scholar] [CrossRef]
  4. Ge, J.; Luo, M.; Catalanotti, G.; Falzon, B.G.; Higgins, C.; McClory, C.; Thiebot, J.-A.; Zhang, L.; He, M.; Zhang, D.; et al. Process characteristics, damage mechanisms and challenges in machining of fibre reinforced thermoplastic polymer (FRTP) composites: A review. China Plast. 2023, 36, 140–149. [Google Scholar]
  5. Luque-Agudo, V.; Hierro-Oliva, M.; Gallardo-Moreno, A.M.; González-Martín, M.L. Effect of plasma treatment on the surface properties of polylactic acid films. Polym. Test. 2021, 96, 107097. [Google Scholar] [CrossRef]
  6. Yan, Y.; Chang, S.; Wang, T.; Geng, Y. Scratch on Polymer Materials Using AFM Tip-Based Approach: A Review. Polymers 2019, 11, 1590. [Google Scholar] [CrossRef] [PubMed]
  7. Takayama, T.; Takahashi, K. Proposal and verification of a thermoplastic surface shear-strength evaluative method. Polym. Test. 2023, 123, 108049. [Google Scholar] [CrossRef]
  8. ASTM D785-03; Standard Test Method for Rockwell Hardness of Plastics and Electrical Insulating Materials. ASTM International: West Conshohocken, PA, USA, 2003.
  9. Borc, J.; Sangwal, K.; Świetlicki, M.; Chocyk, D.; Gładyszewski, G. Vickers microindentation deformation of different cleavage faces of potassium bichromate single crystals: Anisotropy in microhardness and crack formation. Mater. Sci. Eng. A 2020, 790, 139642. [Google Scholar] [CrossRef]
  10. Wang, X.; Venkataraman, L.K.; Tan, C.; Li, Y. Fracture behavior in electrically poled alkaline bismuth- and potassium- based lead-free piezoceramics using Vickers indentation. Scr. Mater. 2021, 194, 113647. [Google Scholar] [CrossRef]
  11. Baltá-Calleja, F.J.; Bassett, D.C. Microindentation hardness of oriented chain-extended polyethylene. J. Polym. Sci. Polym. Symp. 1977, 58, 157–167. [Google Scholar] [CrossRef]
  12. Tabor, D. The Hardness of Metals; Oxford University Press: New York, NY, USA, 1951. [Google Scholar]
  13. Weiler, W. Härteprüfung an Metallen und Kunststoffen, 2nd ed.; Expert Verlag: Ehningen, Germany, 1990. [Google Scholar]
  14. Flores, A.; Baltá Calleja, F.J.; Attenburrow, G.E.; Bassett, D.C. Microhardness studies of chain-extended PE: III. Correlation with yield stress and elastic modulus. Polymer 2000, 41, 5431–5435. [Google Scholar] [CrossRef]
  15. Bano, S.; Iqbal, T.; Ramzan, N.; Farooq, U. Study of Surface Mechanical Characteristics of ABS/PC Blends Using Nanoindentation. Processes 2021, 9, 637. [Google Scholar] [CrossRef]
  16. Wang, Y.; Shang, L.; Zhang, P.; Yan, X.; Zhang, K.; Dou, S.; Zhao, J.; Li, Y. Measurement of viscoelastic properties for polymers by nanoindentation. Polym. Test. 2020, 83, 106353. [Google Scholar] [CrossRef]
  17. Koch, T.; Seidler, S. Correlations Between Indentation Hardness and Yield Stress in Thermoplastic Polymers. Strain 2009, 45, 26–33. [Google Scholar] [CrossRef]
  18. Zhou, Y.; Yu, F.; Deng, H.; Huang, Y.; Li, G.; Fu, Q. Morphology evolution of polymer blends under intense shear during high speed thin-wall injection molding. J. Phys. Chem. B 2017, 8, 6257–6270. [Google Scholar] [CrossRef] [PubMed]
  19. Li, Z.-M.; Yang, W.; Yang, S.; Huang, R.; Yang, M.-B. Morphology-tensile behavior relationship in injection molded poly(ethylene terephthalate)/polyethylene and polycarbonate/polyethylene blends (I) Part I Skin-core Structure. J. Mater. Sci. 2004, 39, 413–431. [Google Scholar] [CrossRef]
  20. Deng, S.; Payyappilly, S.S.; Huang, Y.; Liu, H. Multiscale simulation of shear-induced mechanical anisotropy of binary polymer blends. RSC Adv. 2016, 6, 41734–41742. [Google Scholar] [CrossRef]
  21. van Erp, T.B.; Govaert, L.E.; Peters, G.W.M. Mechanical performance of injection-molded poly(propylene): Characterization and Modeling. Macromol. Mater. Eng. 2013, 298, 348–358. [Google Scholar] [CrossRef]
  22. Guevara-Morales, A.; Figueroa-López, U. Residual stresses in injection molded products. J. Mater. Sci. 2014, 49, 4399–4415. [Google Scholar] [CrossRef]
  23. Straffelini, G. A simplified approach to the adhesive theory of friction. Wear 2001, 249, 78. [Google Scholar] [CrossRef]
  24. ISO 178:2019; Plastics—Determination of Flexural Properties. The British Standards Institution: London, UK, 2019.
  25. Takayama, T.; Motoyama, Y. Injection molding temperature dependence of elastic coefficients obtained using three-point bending tests to ascertain thermoplastic polymer coefficients. Mech. Eng. J. 2021, 8, 20–00414. [Google Scholar] [CrossRef]
  26. Giraldo-Londoño, O.; Paulino, G.H. A unified approach for topology optimization with local stress constraints considering various failure criteria: Von Mises, Drucker–Prager, Tresca, Mohr–Coulomb, Bresler–Pister and Willam–Warnke. Proc. R. Soc. A Math. Phys. Eng. Sci. 2020, 476, 20190861. [Google Scholar] [CrossRef] [PubMed]
  27. Unger, D.J. Generalized Tresca yield condition as a family of elliptic curves with application to mode I crack problems. Z. Angew. Math. Phys. 2022, 73, 184. [Google Scholar] [CrossRef]
  28. Ishikawa, M.; Narisawa, I.; Ogawa, H. Criterion for craze nucleation in polycarbonate. J. Polym. Sci. Polym. Phys. Ed. 1977, 36, 1791. [Google Scholar] [CrossRef]
  29. Comba, A.; Scotti, N.; Maravić, T.; Mazzoni, A.; Carossa, M.; Breschi, L.; Cadenaro, M. Vickers Hardness and Shrinkage Stress Evaluation of Low and High Viscosity Bulk-Fill Resin Composite. Polymers 2020, 12, 1477. [Google Scholar] [CrossRef]
Figure 1. Specimen geometries. (a) Beam. (b) Disk.
Jmmp 08 00011 g001
Figure 2. Method for testing the static friction coefficient using a static friction meter.
Jmmp 08 00011 g002
Figure 3. Relation between Vickers hardness and stress at yield initiation. The dashed lines show the relationship between the equations in the figure.
Jmmp 08 00011 g003
Figure 4. Relationship between Vickers hardness and compression stress at yield initiation. The dashed lines show the relationship between the equations in the figure.
Jmmp 08 00011 g004
Figure 5. Relationship between Vickers hardness and compression stress at yield initiation with the plastic constraining factor. The dashed lines show the relationship between the equations in the figure.
Jmmp 08 00011 g005
Figure 6. Relationship between β and σyc.
Jmmp 08 00011 g006
Figure 7. Relationship between the coefficient of static friction and surface shear strength/Vickers hardness. Error bars in the figure indicate the standard deviation. The dashed line indicates the approximate straight line.
Jmmp 08 00011 g007
Table 1. Material specifications.
MaterialCodeManufacturerGrade
PPN-PPJapan Polypropylene Corp., Tokyo, JapanNovatec-PP MA1B
HM-PPJapan Polypropylene Corp., Tokyo, JapanNovatec-PP MA3H
B-PPJapan Polypropylene Corp., Tokyo, JapanNovatec-PP BC03B
TPOLM-TPOJapan Polypropylene Corp., Tokyo, JapanWELNEX RFG4VA
HM-TPOJapan Polypropylene Corp., Tokyo, JapanWELNEX RMG06
PSPSToyo Styrene Co., Ltd., Tokyo, JapanToyo Styrene G100
ABSABSTechno Polymer Co., Ltd., Chiba, JapanTECHNO MUH E1500
POMPOMPolyplastics Co., Ltd., Tokyo, JapanDURACON NW-02LW
Table 2. Injection molding conditions.
(a) Beam
CodeTinj [°C]Tmold [°C]Vinj [mm/s]Phold [MPa]tinj [s]tcool [s]
N-PP230503042 10 15
HM-PP230503035 10 15
B-PP230503042 10 15
LM-TPO230503035 10 15
HM-TPO230503035 10 15
PS230603063 10 15
ABS260903077 10 15
POM230503084 10 15
(b) Disk
N-PP230503042 10 15
HM-PP230503035 10 15
B-PP230503042 10 15
LM-TPO230503035 10 15
HM-TPO230503035 10 15
PS230603042 10 15
ABS260903077 10 15
POM230503091 10 15
Table 3. Mechanical properties of injection-molded polymers.
Codeσfy [MPa]Ef [MPa]E [MPa]υ [−]
N-PP26.31530 678 0.407
HM-PP35.72190 1096 0.391
B-PP23.71570 618 0.420
LM-TPO9.1400 120 0.442
HM-TPO16.0790 298 0.424
PS52.11940 1940 0.361
ABS50.52640 1470 0.374
POM35.71840 1000 0.378
Table 4. Results from predictive analysis of Vickers hardness obtained from micro-Vickers hardness tests.
CodeHVexp
[MPa]
σfy
[MPa]
υ
[−]
σy
[MPa]
σyc
[MPa]
β
[−]
βσyc
[MPa]
HVcal
[MPa]
N-PP86 (3.0)26.30.40718.721.51.38429.789
HM-PP125 (4.6)35.70.39125.729.41.38440.7122
B-PP77 (1.9)23.70.42016.719.21.38426.679
LM-TPO26 (4.2)9.10.4426.37.31.38410.130
HM-TPO52 (3.6)16.00.42411.212.91.38417.954
PS185 (3.6)52.10.36138.359.91.00059.9181
ABS122 (2.2)50.50.37436.842.01.00042.0125
POM118 (5.4)35.70.37825.941.71.00041.7123
Table 5. Results from predictive analysis of the static friction coefficient obtained from friction tests.
Codeμ
[−]
σfy
[MPa]
υ
[−]
τys
[MPa]
HV
[MPa]
N-PP0.209 (0.013)26.30.4076.281
HM-PP0.181 (0.018)35.70.3918.6125
B-PP0.216 (0.015)23.70.4205.678
LM-TPO0.213 (0.010)9.10.4422.131
HM-TPO0.254 (0.032)16.00.4243.744
PS0.16 (0.023)52.10.36112.8185
ABS0.255 (0.012)50.50.37414.1127
POM0.163 (0.013)35.70.3788.6118
Disclaimer/Publisher’s Note: The statements, opinions and data contained in all publications are solely those of the individual author(s) and contributor(s) and not of MDPI and/or the editor(s). MDPI and/or the editor(s) disclaim responsibility for any injury to people or property resulting from any ideas, methods, instructions or products referred to in the content.