Article

Improving Deposited Surface Quality in Additive Manufacturing Using Structured Light Scanning Characterization and Mechanistic Modeling

1
Department of Mechanical Engineering, Iowa State University, Ames, IA 50011, USA
2
Department of Industrial and Systems Engineering, University of Wisconsin—Madison, Madison, WI 53706, USA
3
Department of Industrial and Manufacturing Systems Engineering, Iowa State University, Ames, IA 50011, USA
*
Author to whom correspondence should be addressed.
J. Manuf. Mater. Process. 2024, 8(3), 124; https://doi.org/10.3390/jmmp8030124
Submission received: 26 April 2024 / Revised: 11 June 2024 / Accepted: 13 June 2024 / Published: 14 June 2024

Abstract

:
The surface quality of parts fabricated using laser-directed energy deposition additive manufacturing significantly affects the fatigue life, corrosion resistance, and performance of the components. Surface quality improvements remain a key challenge in laser-directed energy deposition because of the involvement of multiple simultaneously occurring physical phenomena controlling the surface characteristics. Here, a unique combination of structured light scanning characterization and mechanistic modeling was used to identify three key physical factors that affect surface quality. These factors include a geometric factor, an instability factor, and a disintegration factor, which were calculated using a mechanistic model and correlated with the surface characteristics data obtained from the structured light scanning characterization. It was found that these factors can precisely explain the variations in the average surface roughness. In addition, skewness and kurtosis of the surfaces made by laser-directed energy deposition were found to be significantly better than those observed in traditional manufacturing. Based on the experimental and modeling results, a surface quality process map was constructed that can guide engineers in selecting appropriate sets of process variables to improve deposit surface quality in additive manufacturing.

1. Introduction

Additive manufacturing (AM), particularly laser-directed energy deposition (LDED), has revolutionized the production of complex components with intricate geometries [1,2]. However, the surface quality of deposits produced using LDED remains a critical concern [3,4] as it directly impacts the fatigue life [5,6], corrosion resistance [7], and overall performance of the manufactured components. For example, rough surfaces of additively manufactured parts were shown to act as fatigue crack initiation sites and degrade fatigue life [5]. In addition, rough surfaces generally have a larger interfacial area with the corrosive environment during service, which can increase the rate of corrosion [7]. Therefore, part surface quality improvement is a formidable challenge for manufacturing superior parts using LDED, which is the main motivation behind this work.
Several attempts have been made to improve the surface quality in LDED (Table 1). Both experimental [8,9,10,11,12,13,14,15,16] and computational [17,18,19,20,21,22,23] approaches have been used. It is evident from Table 1 that the overall limitation of the experimental approach [8,9,10,11,12,13,14,15,16] is that it needs time-consuming and expensive trial-and-error adjustments of many process variables. Post-process machining and grinding add an extra cost and often cannot be applicable to the internal surfaces. Post-process laser polishing [8,9,10,12] is also expensive and can promote other defects and undesirable microstructure. The surface quality of LDED parts is affected by multiple simultaneously occurring physical phenomena [1]. An in-depth fundamental understanding of these phenomena is still evolving, and the available computational models [17,18,19,20] are often inadequate to predict surface characteristics accurately. Among the existing computational approaches, mechanistic modeling of LDED processes is important. Mechanistic modeling includes part-scale finite element models, molten-pool-level computational fluid dynamics models, and powder scale models. These existing models are often inadequate in providing a detailed insight into the evolution of surface characteristics and are computationally expensive. In LDED, the part surface quality is affected by the deposit geometry and deposition pattern [24,25]. Hydrodynamic instability [26,27,28] of the molten pool can form a wavy deposit surface, often resulting in a rough part surface. Under certain circumstances, the molten pool can disintegrate into small islands, which, upon solidification, can form balls on the deposit surface and degrade surface quality [29,30]. Once these physics-based factors can be quantified and calculated, they can be correlated with the experimentally measured surface characteristics data to reveal insights into surface quality and ways to improve it. With the progress in non-contact measurements [31,32,33,34,35,36], it is now possible to extract high-quality data on surface quality. Therefore, what is needed and not available is a method to identify, quantify, and calculate the most important physical factors that affect deposit surface quality and establish a correlation between them and the experimentally measured surface characteristics.
Here, a unique combination of structured light scanning characterizations of the deposited surfaces and mechanistic modeling was used to identify three key physical factors that affect the surface quality, including a geometric factor, an instability factor, and a disintegration factor. These factors were calculated using a mechanistic model that was rigorously tested using independent experimental data of LDED of stainless steel 316. The computed values of the three physical factors were correlated with the surface characteristics data obtained from the structured light scanning characterization. Apart from the average surface roughness, the skewness and kurtosis of the deposit surfaces made by laser-directed energy deposition were compared with those observed in traditional manufacturing. Based on the experimental and modeling results, a surface quality process map was constructed that can be used to select appropriate sets of process parameters to improve the deposited surface quality. The mechanistic modeling used in this work, although simplified, is computationally efficient and can provide an in-depth scientific understanding of physical factors affecting surface quality in additive manufacturing. Providing scientific insights into surface quality development based on physical factors is a unique contribution to the field. Although the methodology was developed and tested for LDED, a similar approach can also be used to improve surface quality for other additive manufacturing processes, such as laser and electron beam powder bed fusion and wire arc additive manufacturing.

2. Methodology

In this work, several parts were fabricated using laser-directed energy deposition. The surface profiles of the parts were measured by a structured light scanning method. A mechanistic model of the LDED process was validated against the experimental data and used to calculate the three physical factors responsible for determining the surface qualities of parts. The methodology used in this work is schematically represented in Figure 1 and is explained in detail below.

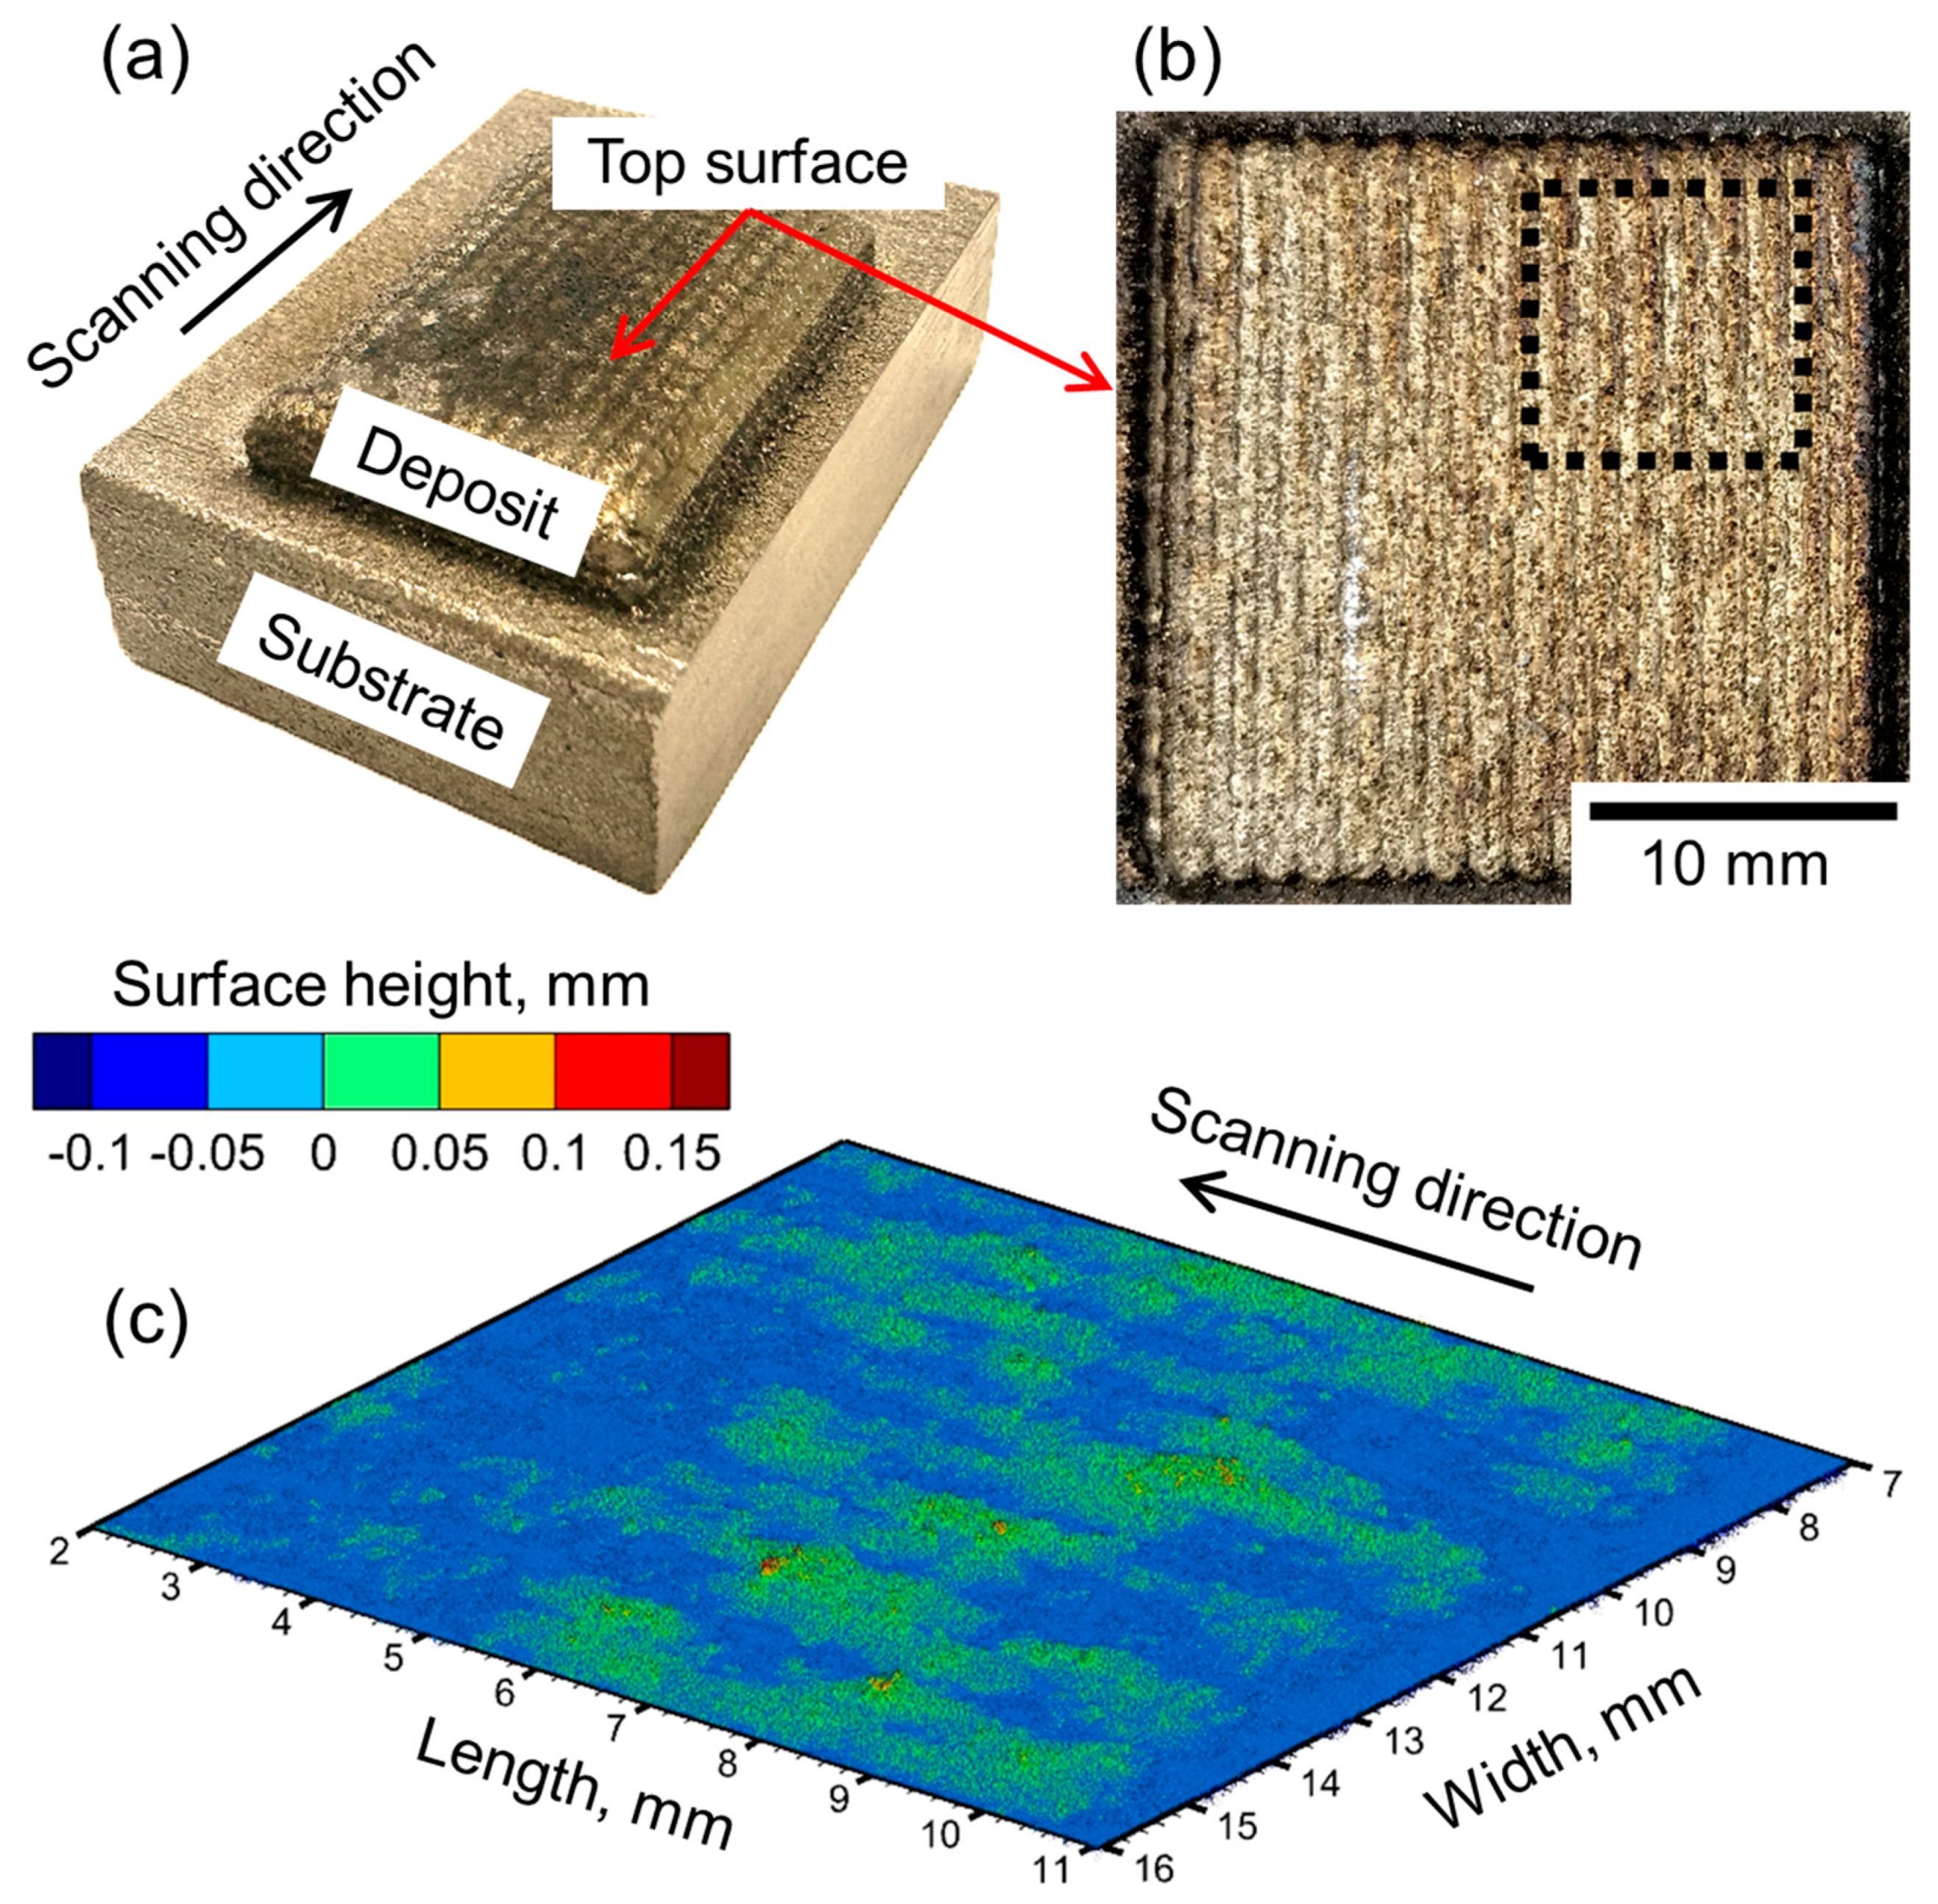
2.1. Fabrication of Parts Using Laser DED

The samples were fabricated using the AMBIT Directed Energy Deposition/HAAS UMC 750 hybrid system, incorporating gas-atomized stainless steel 316 powder sourced from Carpenter Additive, U.K. During the fabrication of 18 samples, the laser power varied between 400 and 700 W with a step of 100 W, and the scanning speed varied between 450 and 750 mm/min with a step of 50 mm/min. The powder mass flow rate was kept constant at 0.083 g/s. All other process parameters remained constant (Table 2). The experiments were designed to investigate the variations in the surface characteristics of AM components with the intricate interplay of laser power and scanning speed. The square samples with a dimension of 22 × 22 mm were prepared by depositing consecutive layers oriented perpendicular to each other on a stainless steel 316 substrate. Since the surface features or anomalies formed after the deposition of a layer are redefined as the layer is remelted during the building of subsequent layers, the surface characteristics are measured only for the final deposited surfaces, as described below.

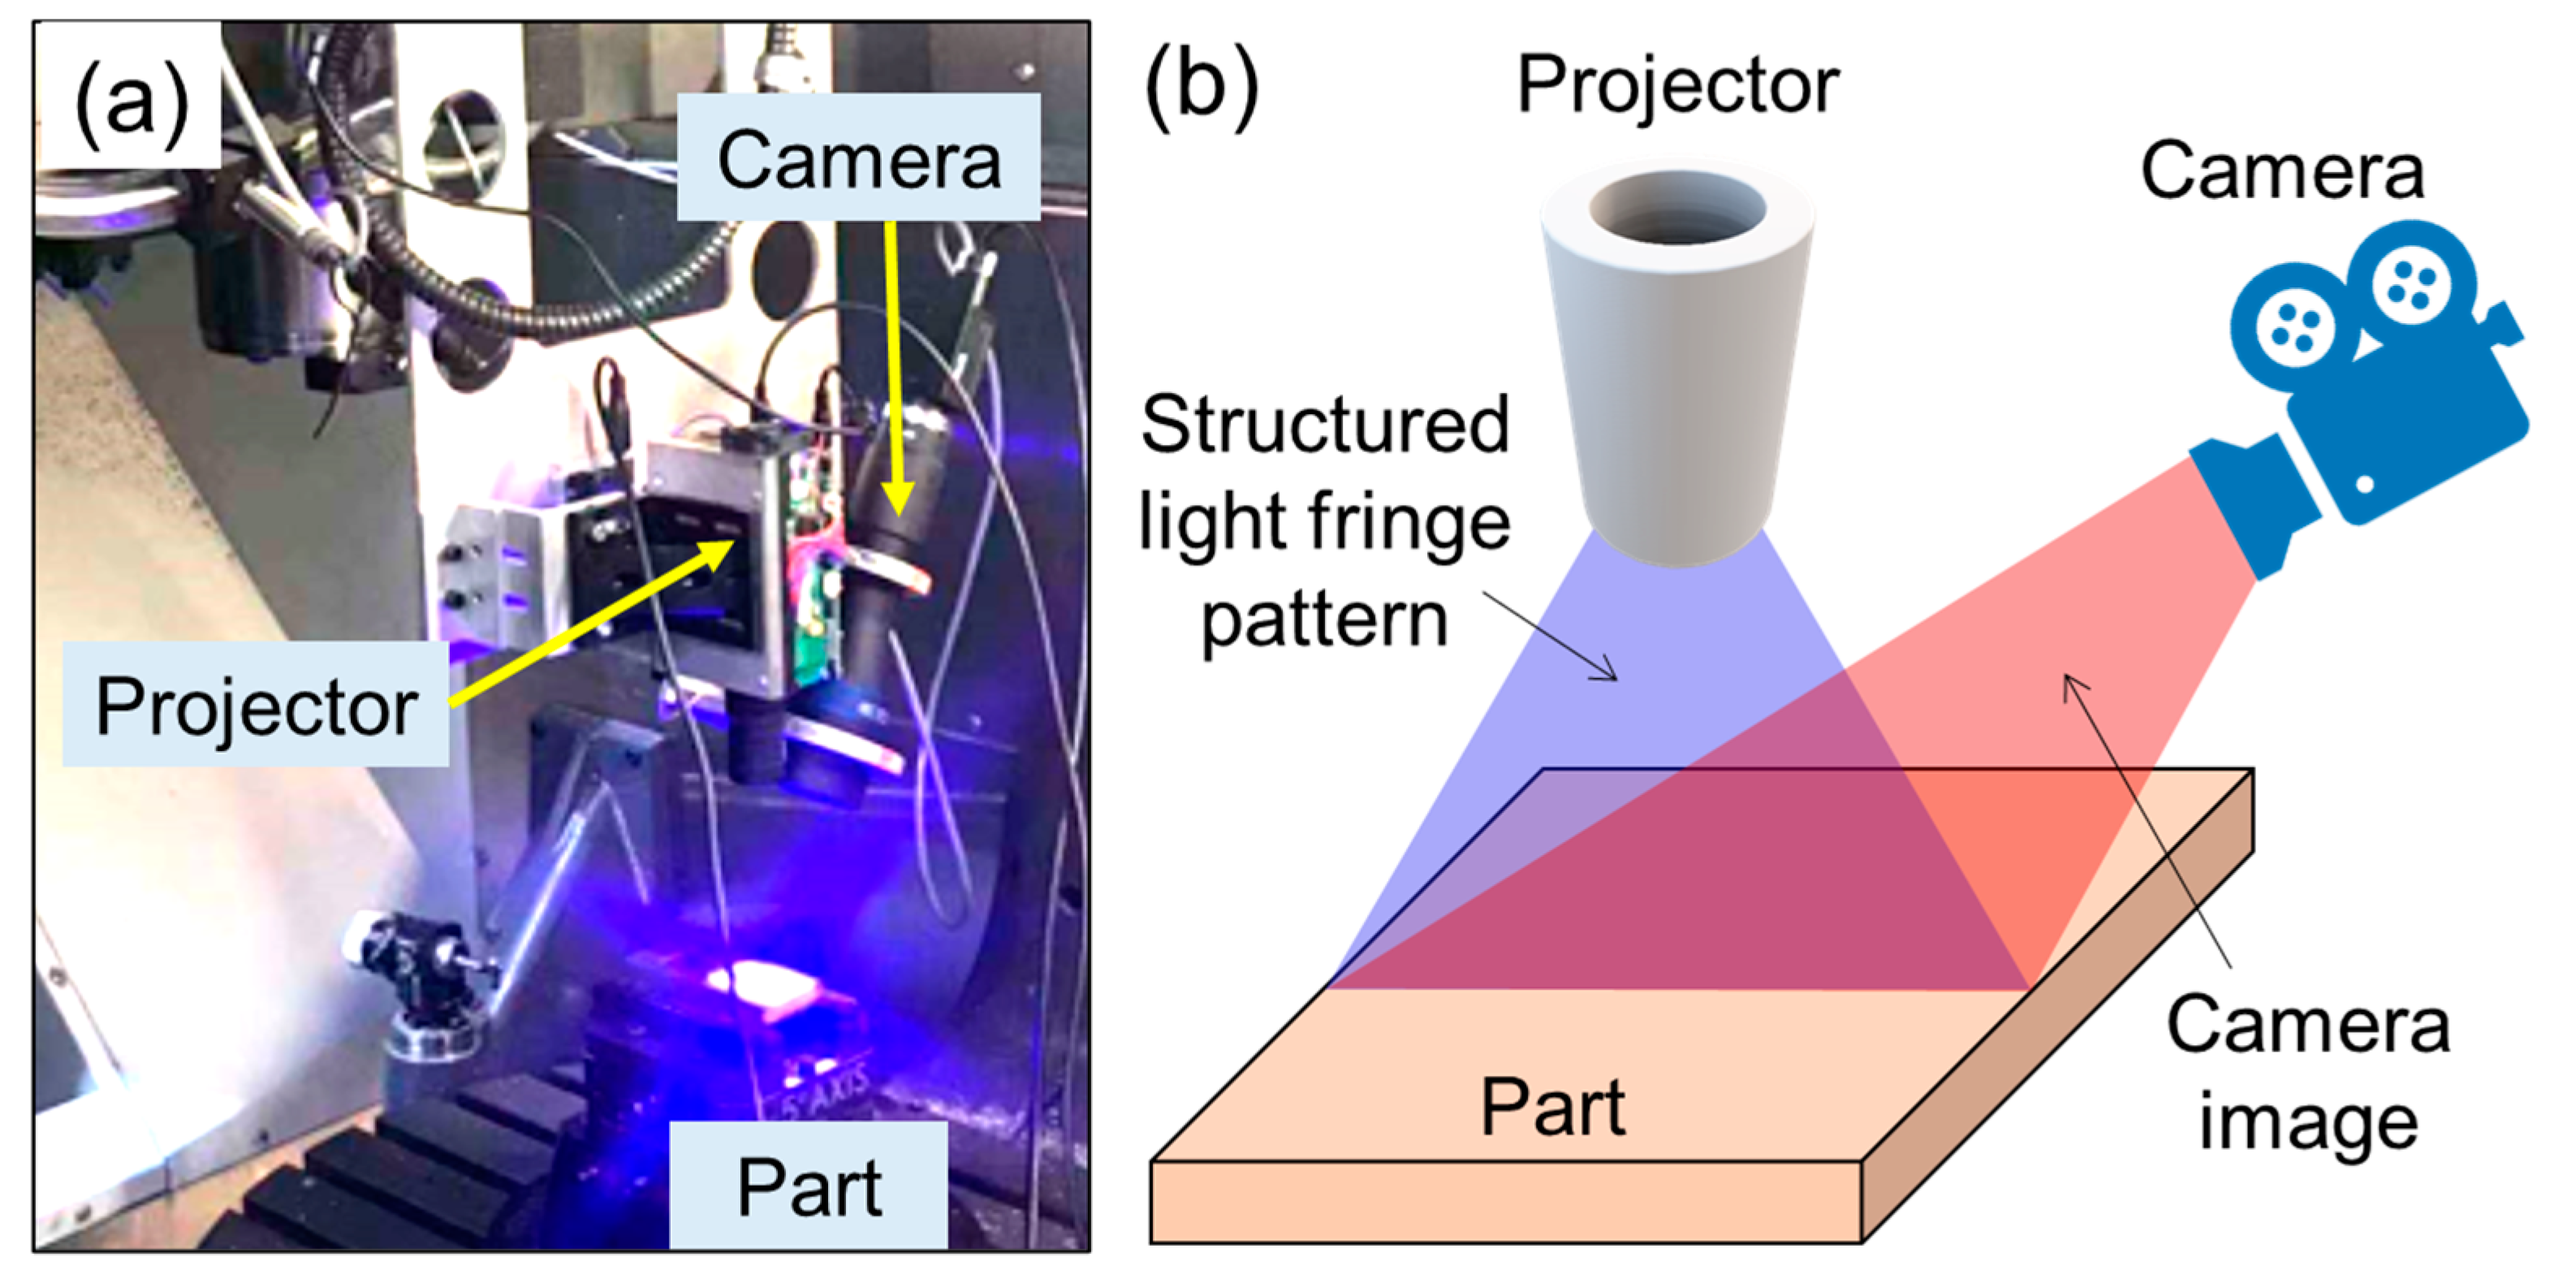
2.2. Structured Light Scanning Characterization of Part Surfaces

After the parts were fabricated, the surface characteristics were measured using a lab-built structured light scanning (SLS) system [33,34], consisting of a camera for image capture and a projector for fringe pattern projection, as depicted in Figure 2. Coded fringe patterns were projected onto the part surface, and the camera captured distorted phase lines for 3D reconstruction into point cloud data. The camera, equipped with a telecentric lens at a 0.486 magnification rate and a resolution of 1280 × 960 pixels, worked in tandem with a projector with a 912 × 1140 pixels resolution. Phase retrieval employed 18-step phase-shifted patterns, enabling the lab-built SLS system to achieve a surface topography measurement with a ±5 µm accuracy at a scanning rate of 30 Hz. Figure 3a,b illustrates the sample scanned using SLS, and Figure 3c shows the resulting reconstructed 3D image.
For every part, the point cloud data representing the surface were measured in the x-y plane (horizontal) and were stored as the matrix Z ( x ,   y ) , with Z indicating the surface height. The mean plane was computed based on all the captured points on the surface. For each measured surface, the three surface characteristic descriptors, S a (average surface roughness represented by the arithmetical mean height), S s k (skewness of surfaces), and S k u (kurtosis of surfaces), were calculated following ISO 25178 [37] as
S a = 1 A | Z ( x ,   y ) | d x d y
S s k = 1 S q 3 1 A Z 3 x ,   y d x d y
S k u = 1 S q 4 1 A Z 4 x ,   y d x d y
where A is the area of the measured surface and Z ( x ,   y ) is the matrix of the surface height. S q represents the root mean square value of the surface height and is represented as [37]
S q = 1 A Z 2 ( x ,   y ) d x d y
Surface skewness ( S s k ) measures the deviation in height distribution from the mean plane with a positive S s k , indicating a deviation below the mean plane and a negative value signifying a deviation above [37]. This information is valuable in determining whether the prominent features on the surface are peaks or valleys [37]. The surface kurtosis ( S k u ) serves as an indicator of the sharpness of peaks and valleys. A S k u value exceeding 3 suggests sharper features, while a value below 3 indicates more rounded peaks or valleys on the surface [37].
In this work, the primary interest was to understand the evolution of only the deposited surface qualities. That is the reason why the average roughness, skewness, and kurtosis of the surfaces were measured, as discussed above. The dimensional accuracy of additively manufactured parts is affected by thermal distortion, which is beyond the scope of this work. In addition, the data for intermediate layers do not affect the final surface quality for the two following reasons. First, the surface features formed after the deposition of a layer are redefined as it is remelted during the building of subsequent layers. Therefore, to obtain a detailed understanding of the surface quality of the part, it is sufficient to study only the top or open surfaces. Second, surface characteristics have negligible effects on the heat absorption and the formation of the molten pool compared to process parameters and alloy properties. Therefore, the surface characteristics of the intermediate layers do not contribute to the molten pool formation and the final part surface quality.
It is worth noting that due to the capability of measuring surface topography in real time, the system can capture each melting layer during the entire printing process. For this study, the top surfaces were specifically measured since the external surfaces directly impact product quality. In the meantime, apart from characterizing the areal surface roughness parameters, it is also possible to identify visual printing defects on surfaces (e.g., cracks and pits) through morphological 3D point cloud data processing, though this is not the focus of this present work.
Table 2. Thermophysical properties [38] of stainless steel 316 and constant process variables.
ParametersValues
Thermal conductivity of alloy, W/mK15
Specific heat, J/kgK500
Density, kg/m37800
Latent heat of fusion, J/kg272,000
Surface tension, N/m1.5
Surface tension gradient with temperature, N/mK0.0004
Solidus temperature, K1693
Liquidus temperature, K1733
Viscosity, Pa·s0.007
Laser beam diameter, mm2.0
Average powder diameter, microns75
Shielding gas (Argon) velocity, m/s5
Shielding gas (Argon) flow rate, L/min4
Hatch spacing, mm0.5
Ambient temperature, K298
Laser absorptivity0.3

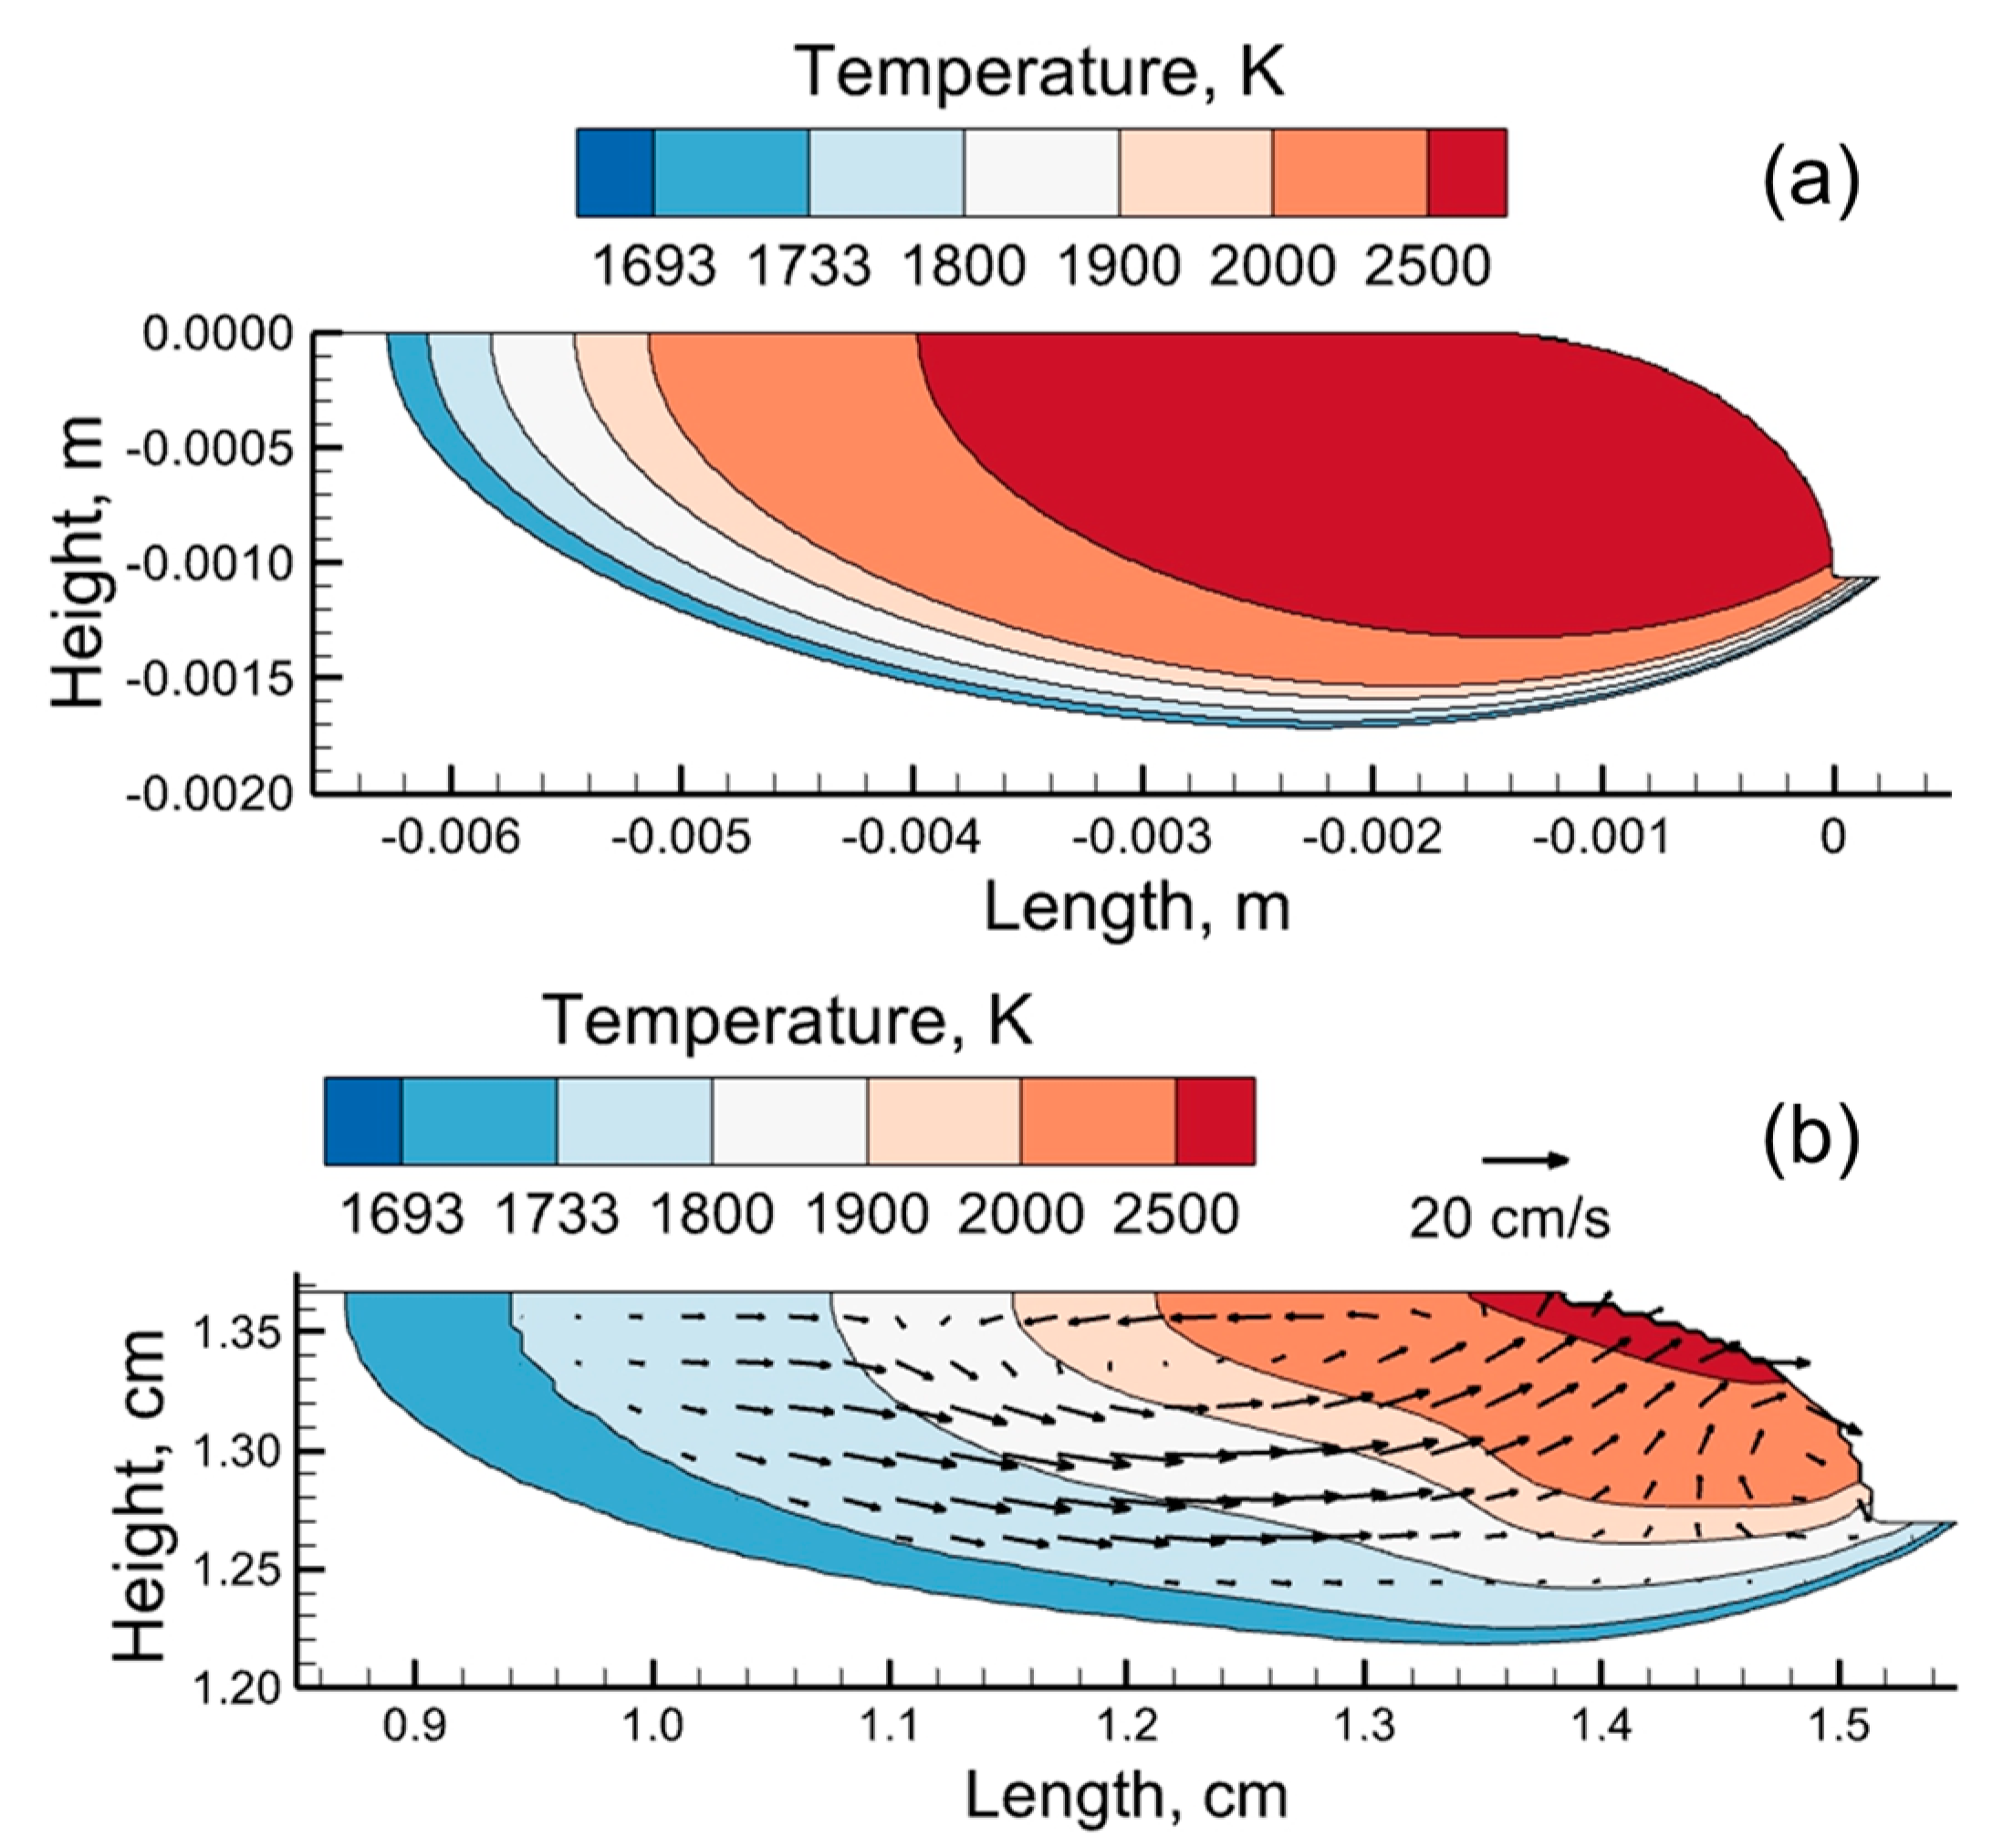
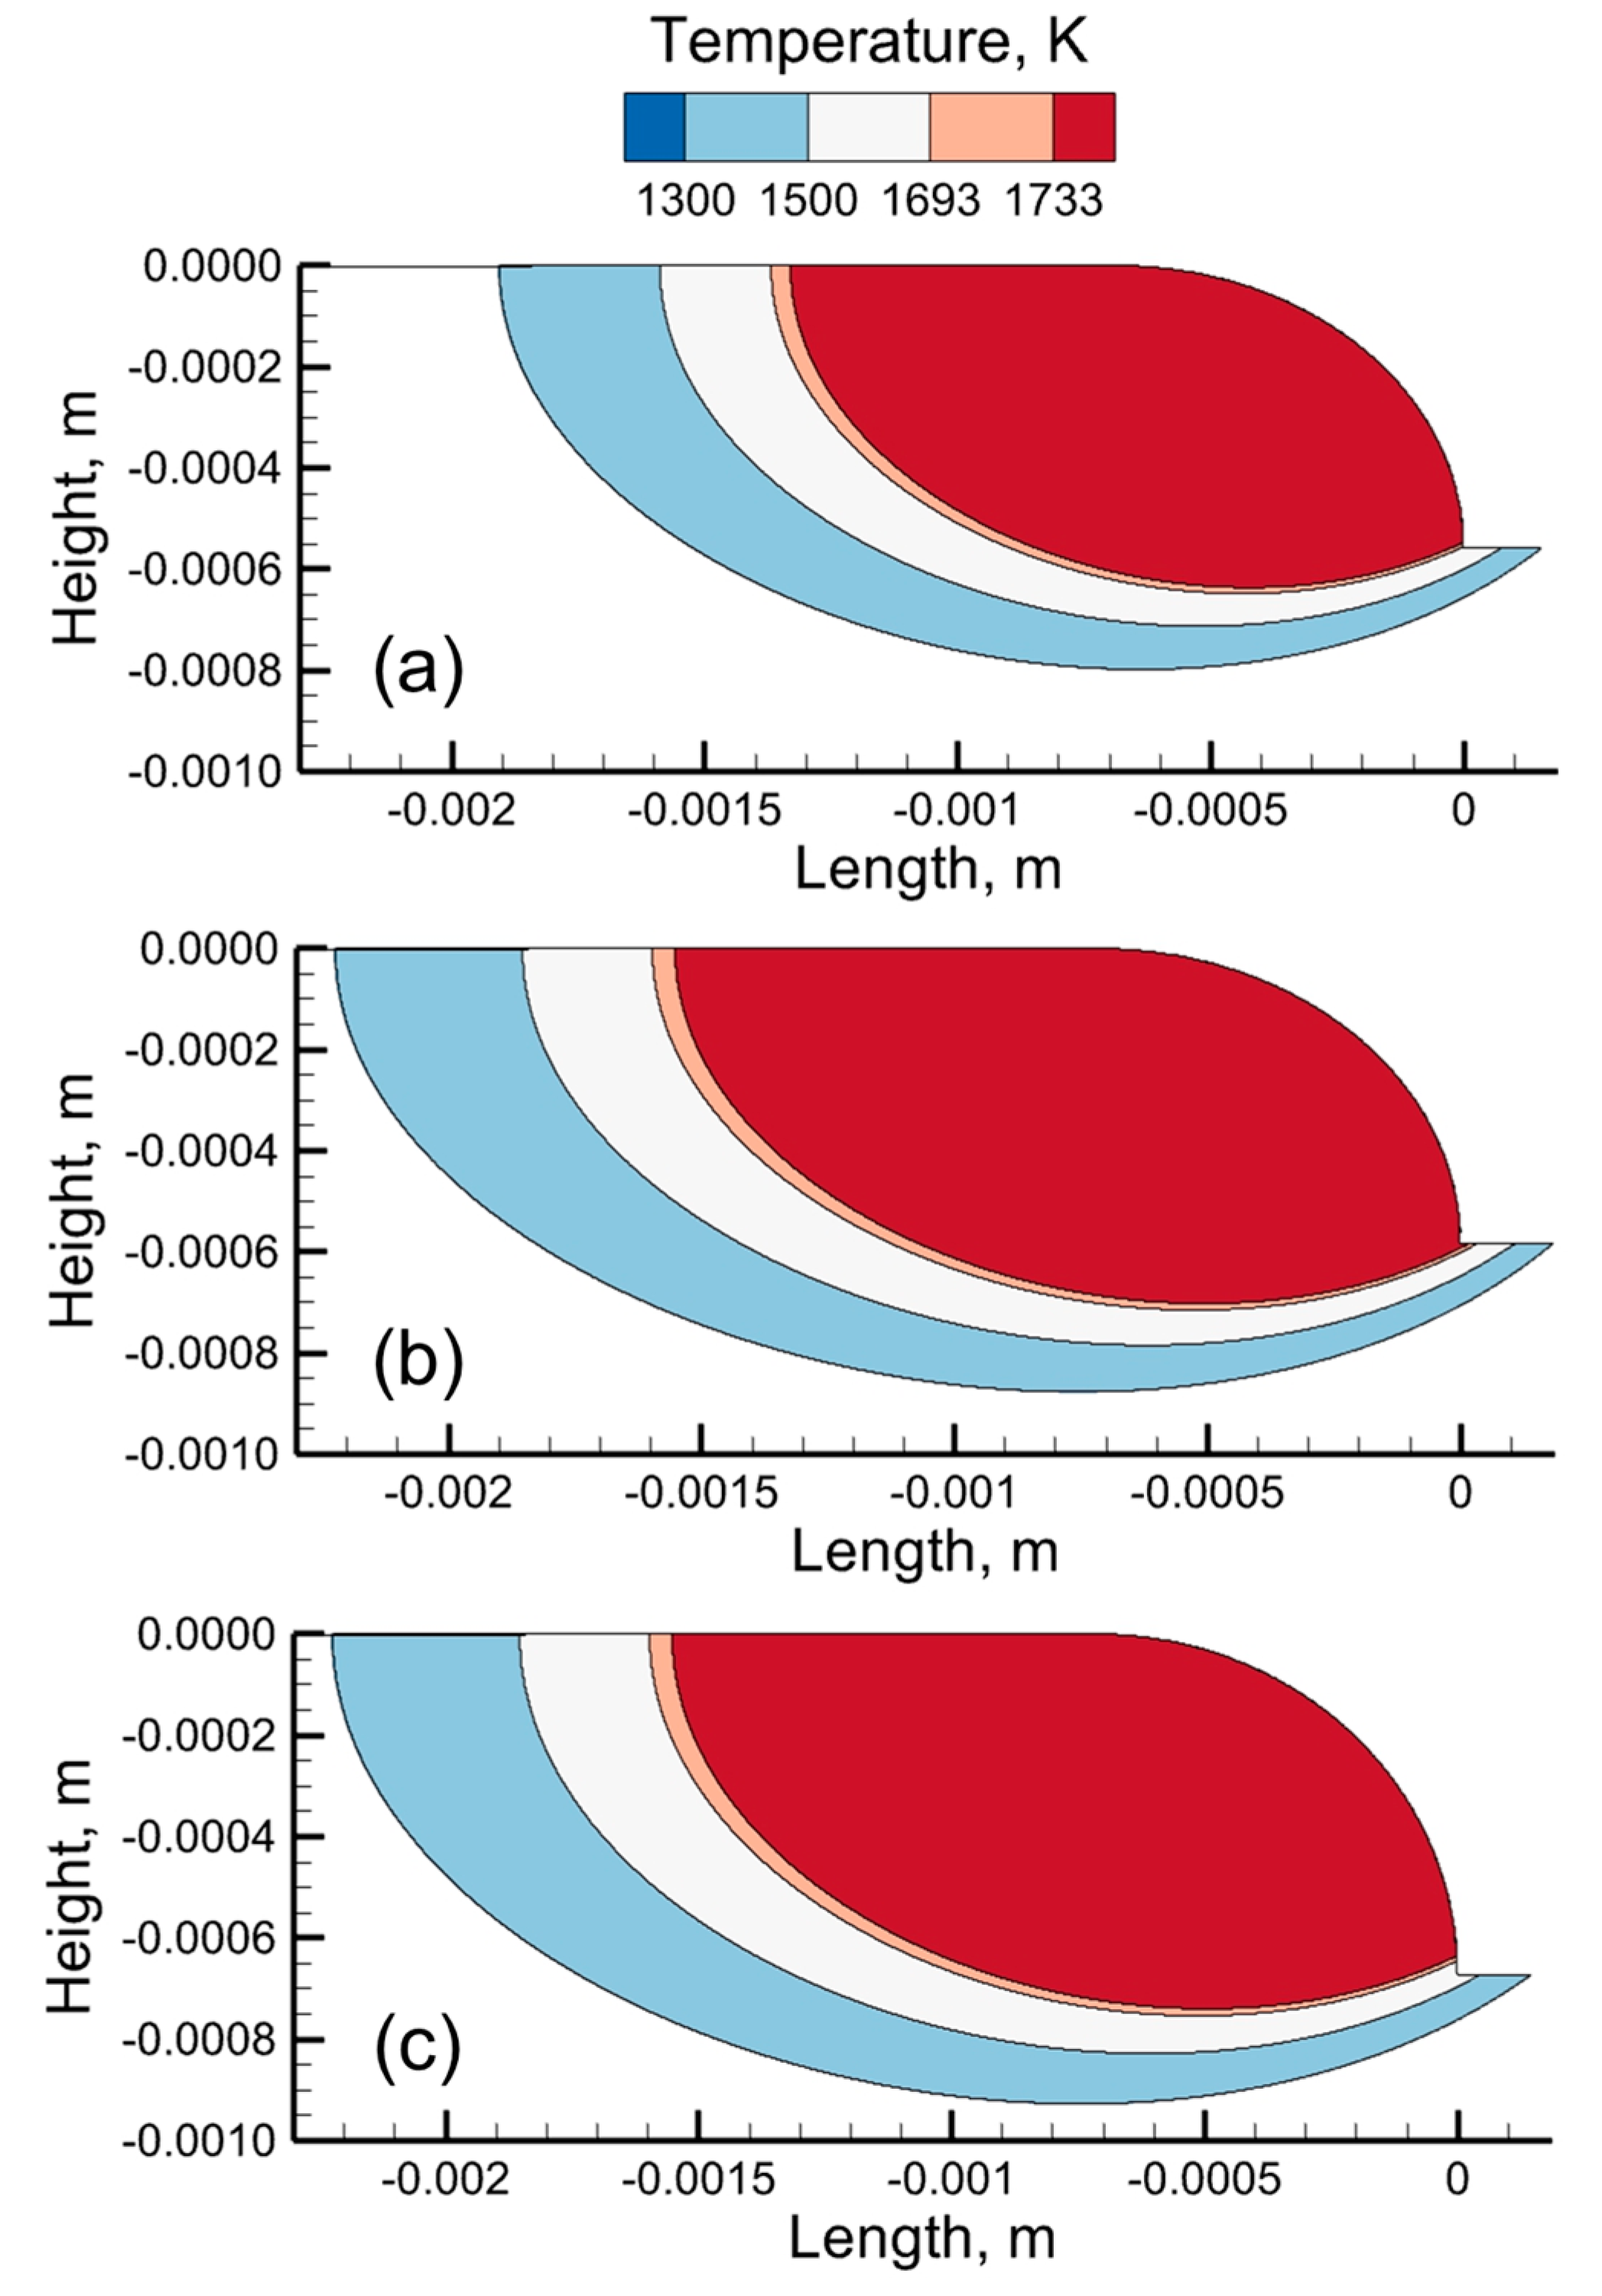
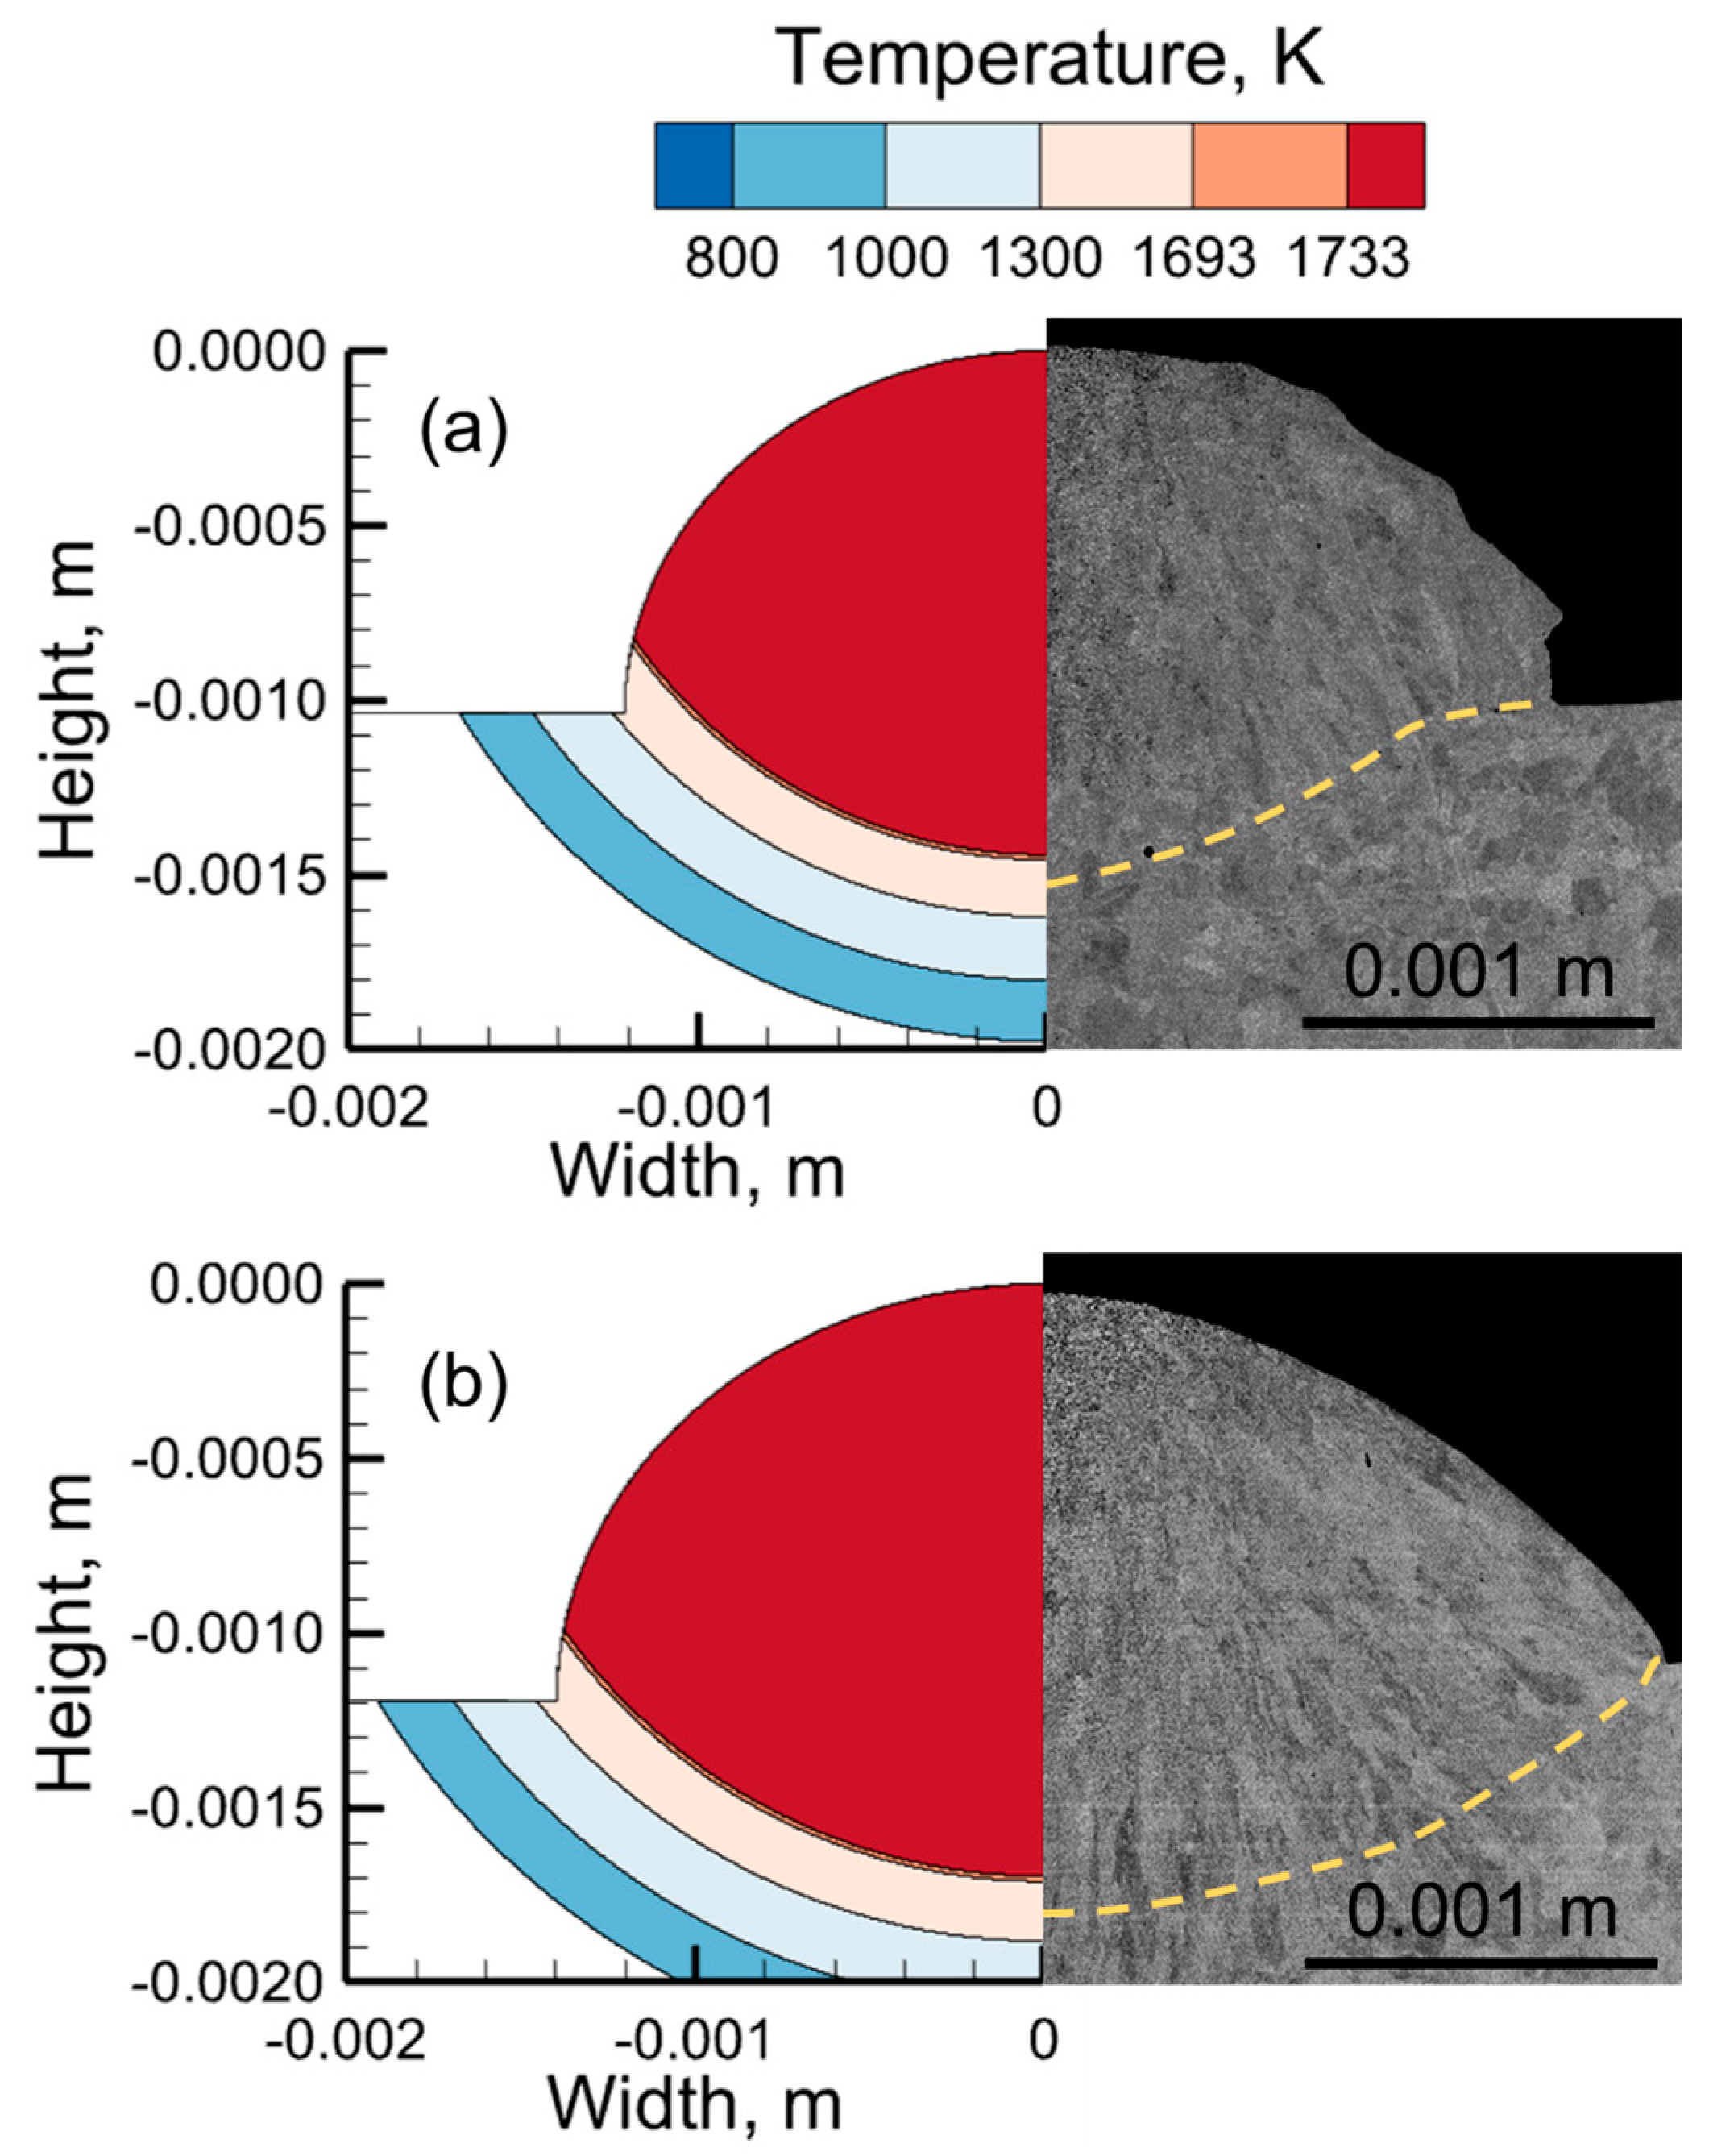
2.3. Calculations of Temperature Fields and Deposit Geometry

Deposit geometry, fusion zone shape and size, and temperature fields significantly affect the surface quality. A mathematical model is developed to calculate these parameters from the process variables and thermophysical properties [38] of alloys (Table 2). The following assumptions are made to make calculations simplified and tractable:
  • The mechanistic model assumes a quasi-steady state of heat conduction [1]. In this method, the coordinates along the direction of the laser beam scanning are transformed to capture the scanning speed effect. The method also assumes that the substrate width is significantly larger than the width of the deposited track.
  • The energy from the laser beam is assumed to be concentrated at a point on the top surface of the building deposit [1]. The transverse section of the deposit is approximated as a half-ellipse [39], whose major and minor axes are the half-width and height of the deposit, respectively.
  • The LDED process is in conduction mode. The effects of the convective flow of liquid metal inside the molten pool [1], mainly driven by buoyancy and the spatial gradient of surface tension on temperature fields, are neglected. However, the model is calibrated against a 3D, transient numerical heat transfer and fluid flow model [39].
  • Thermophysical properties of alloys are assumed to be independent of temperature. The laser absorptivity is assumed to be a constant.
During the LDED process, a 3D-curved deposit geometry is formed because of the melting and accumulation of powders. The transverse section of the deposit (perpendicular to the scanning direction) is approximated as a half-ellipse, and its dimensions are calculated using the method described in [39]. The major axis ( b ) and minor axis ( c ) of the ellipse are the half-width and height of the LDED deposit, respectively. They are calculated as [39]
b = f m   r b   η c
c = 2   m ˙   η c π   f m   r b   V   ρ
where f m denotes a fraction of the radius (   r b ) of the laser beam, and its value [39] is generally between 0.75 and 1.0. V is the scanning speed, m ˙ is the mass flow rate of the powder feedstock, and ρ is the alloy density. η c is catchment efficiency defined by the fraction of the powder mass captured into the pool. Huang et al. [40] showed that the catchment efficiency is affected by the molten pool top surface area. Since the molten pool size increases directly with the energy input, catchment efficiency can be represented using the following parameter [39]:
Q = P V C p Δ T + L
where P is the laser power, V is the scanning speed, C p is the specific heat of the alloy, Δ T is the difference between the solidus temperature of the alloy and the ambient temperature, and L denotes the latent heat of fusion. The catchment efficiency is calculated from the parameter ( Q ) using a polynomial reported in [39].
The length of the curved front edge of the molten pool is equal to the half-width of the deposit ( b ) because the flow distribution of the powder stream shows a radial symmetry [39]. The temperature ( T ) at any location of the deposit is represented by [41]
T = T 0 + λ   P 2   π   k   x 2 + y 2   e x p   V   ( x + x 2 + y 2 )   2   α
where T 0 is the ambient temperature and λ is the absorptivity. k and α are the thermal conductivity and diffusivity of the alloy, respectively. x and y are the distances from the laser beam axis along the length and width directions, respectively. The boundary of the molten pool is tracked from the temperature field based on the solidus temperature of the alloy. The values of molten pool dimensions are used to compute the three physical factors for surface quality, as discussed below.

2.4. Three Physical Factors and Their Calculations

The physical significance of the three physical factors (Figure 1), their effects on surface quality, and their calculations are explained below:
Geometric factor: Surface quality is significantly affected by the deposit geometry [24,25]. Higher hatch spacing and thicker deposits can increase the peak-to-valley distance (Figure 1) and result in rough surfaces. In contrast, wider deposits result in flatter and smoother surfaces. Therefore, surface roughness is directly proportional to the deposit height ( c ) and hatch spacing ( h ) and inversely proportional to the deposit width ( 2 b ). The geometric factor is defined by
G * = c   h ( 2 b ) 2
The geometric factor ( G * ) is dimensionless. The deposit width ( 2 b ) and height ( c ) are computed using Equations (5) and (6), respectively. Therefore, the geometric factor includes the effects of layer height, hatch spacing, and deposit dimensions that depend on the laser parameters.
Instability factor: Hydrodynamic instability [26,27] of the molten pool can form a wavy deposit surface. Hydrodynamic instability is caused because of the differences in the velocity of the liquid metal on the molten pool top surface and the shielding gas velocity. A dimensionless Richardson number ( R i ) can be used to quantify the hydrodynamic instability and is expressed as [26,27]
R i = g   c ( U g   U m a x ) 2
where g is the acceleration due to gravity and U g is the velocity of the shielding gas.   U m a x is the maximum velocity of the molten metal and is approximated as [42]
U m a x = d γ d T   d T d y   2 b 0.664   ρ   μ 2 / 3
where d γ d T is the surface tension gradient with temperature and μ is the viscosity of liquid metal. d T d y is the average temperature gradient on the molten pool top surface and is calculated as
d T d y = T m a x   T s π / 4   ( b + c )
where T m a x is the maximum temperature inside the molten pool and   T s is the solidus temperature of the alloy. The dimension d y is the half-width of the deposit along the curved top surface and is calculated by assuming the transverse section of the deposit is an ellipse.
Disintegration factor: It is well-known [29,30] that the molten pool during additive manufacturing can disintegrate into small islands, which, upon solidification, can form balls on the deposit surface and degrade surface quality. The solidification time indicates the time during which the molten pool remains liquid. Therefore, a high solidification time increases the chance of the molten pool disintegrating and degrading the surface quality. In contrast, a high surface tension force prevents the molten pool from disintegrating. Therefore, the disintegration factor ( D * ) is represented by the ratio of solidification time ( t s o l ) to the surface tension force ( S T ) as
D * = t s o l S T
The disintegration factor is normalized by dividing the values by their maximum. Solidification time is calculated as the pool length divided by the scanning speed. The surface tension force ( S T ) is calculated as [26]
S T = γ   π   ( b + l / 2 )
where γ is the surface tension of molten metal and l is the pool length.

3. Results and Discussions

3.1. Temperature Fields and Deposit Geometry

Since the temperature fields and deposit geometry significantly affect the surface quality, they are calculated using the mathematical model described in Section 2.3. Figure 4a shows the temperature profile on the longitudinal section (the plane along the scanning direction) of the deposit. The curved shape of the LDED deposit near the front end of the liquid pool is formed by the accumulation of powders. The isotherms are extended in a direction opposite to the scanning, capturing the effects of rapid scanning. The sky-blue region bounded by the liquidus (1733 K) and solidus (1693 K) isotherms is the solid–liquid two-phase mushy zone. The molten pool is defined by the region surrounded by the solidus isotherm.
To prove that the assumptions made in the model (Section 2.3) are correct and the model is well-calibrated, the results were compared with a multiphysics heat and fluid flow model [39]. Figure 4b shows the temperature profile on the longitudinal section under the same processing conditions as Figure 4a but is calculated using a well-tested, 3D, transient numerical model of heat transfer and fluid flow. The result is adapted from [39]. The temperature field results are quite different from those of the two models. The heat transfer and fluid flow model considers the convective flow of molten metal, and the computed velocity vectors are shown by black arrows (Figure 4b). The convective flow mixes cold and hot liquid metal and significantly alters the temperature distribution inside the molten pool. However, it can be seen that the deposit geometry and molten pool dimensions computed using the mathematical model used in this work (Figure 4a) match reasonably well with those calculated using the complex numerical model (Figure 4b). It provides the confidence to use the simplified mathematical model to calculate the deposit geometry and molten pool dimensions for estimating the surface quality. In addition, the mathematical model used in this work is much more computationally efficient than the numerical model.
Figure 5 explains the variations in deposit geometry and molten pool dimensions with laser power and scanning speed. The orange region bounded by the liquidus (1733 K) and solidus (1693 K) isotherms is the solid–liquid two-phase mushy zone. The molten pool is defined by the region surrounded by the solidus isotherm. A higher laser power results in a bigger molten pool and deposit (Figure 5b) than those in Figure 5a. A slower scanning speed indicates a higher heat input per unit length of the deposit and thus results in a bigger molten pool and deposit (Figure 5c) than those in Figure 5a. In addition, a slower scanning speed allows more powders to deposit per unit length of the deposit, resulting in a slightly thicker deposit (Figure 5c) than that in Figure 5a. Transverse sections (the plane perpendicular to the scanning direction) of deposits computed using the mathematical model match well with the corresponding experimental results [39] at different laser powers (Figure 6). The slight mismatch between the computed and experimental cross-sections is due to the simplifying assumptions made in the calculations as well as measurement errors. Therefore, the well-tested mathematical model is used to compute the three physical factors affecting the surface quality, as discussed below.

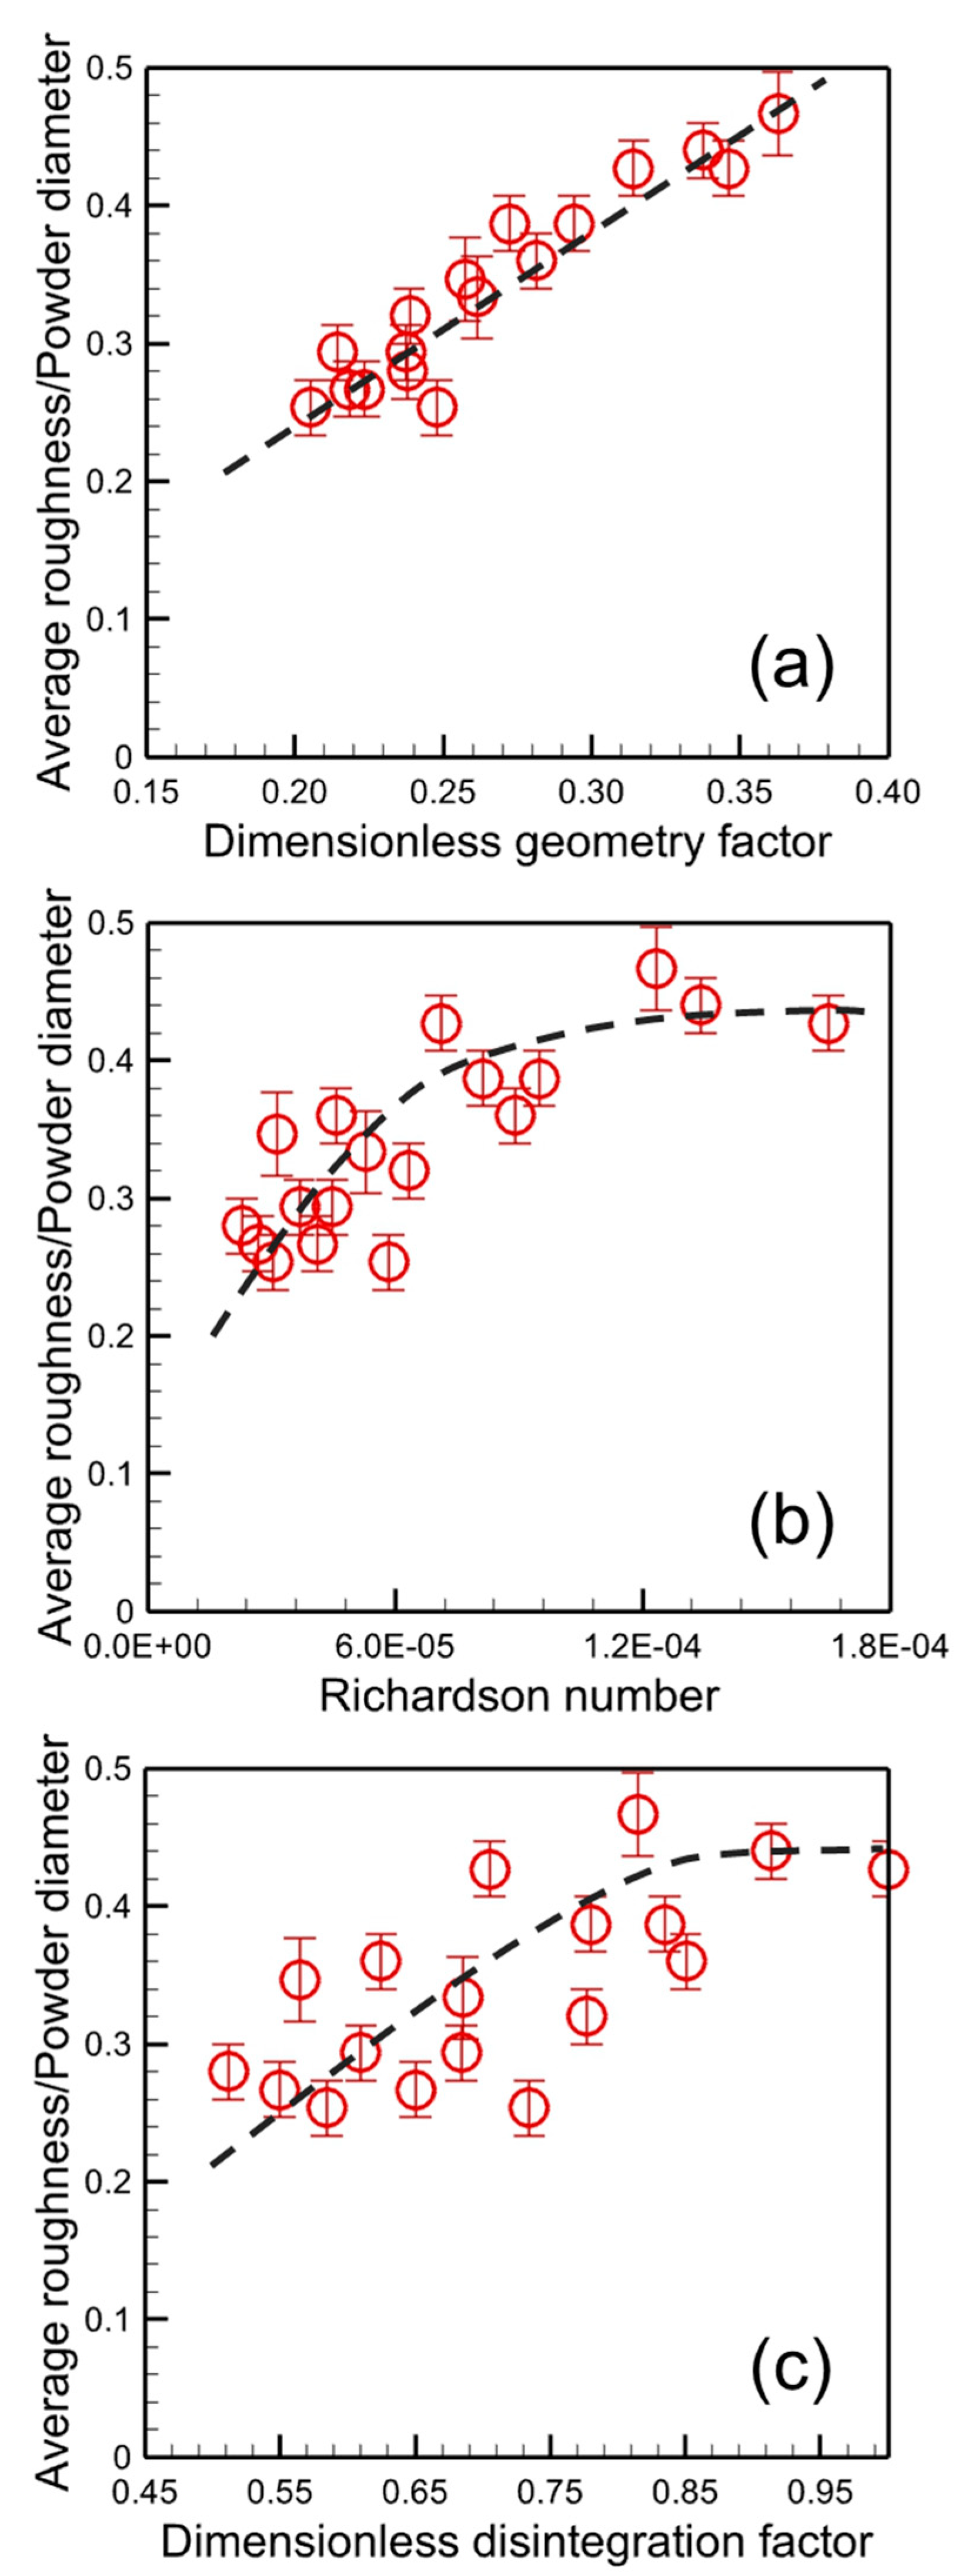
3.2. Effects of Three Physical Factors on Surface Quality

Figure 7 explains the effects of the three physical factors (Section 2.4) on the average surface roughness. The average surface roughness values are measured using structured light scanning (Section 2.2). Here, the surface roughness is normalized by dividing it by the average powder diameter. Larger powders are often difficult to melt, and partially melted powders can attach to the deposit surfaces and increase surface roughness [43]. Therefore, the average powder diameter has a direct relation with the surface roughness and is an appropriate variable to normalize it [43]. Figure 7a shows that the surface roughness increases with the geometric factor. Fabricating thinner and wider deposits can reduce the geometric factor (Equation (9)) and thus the surface roughness. The geometric factor and surface roughness can also be minimized by lowering the hatch spacing (Equation (9)) but it may reduce productivity.
The instability factor is represented by the Richardson number. The Richardson number indicates the hydrodynamic instability of the molten pool, which is well-known in both fusion welding and additive manufacturing literature. Figure 7b shows that the surface roughness increases with the Richardson number. However, the increase in the average surface roughness becomes less significant at higher values of the Richardson number. A similar trend is observed in the average surface roughness with respect to the disintegration factor (Figure 7c). For the processing conditions resulting in high values of the disintegration factors, the molten pool can disintegrate into small balls and degrade surface quality. To capture the combined effects of the three dimensionless physical factors, a dimensionless surface quality number is defined as the product of the three factors, assuming that the three factors have equal influence on the surface quality. As expected, the average surface roughness increases with the dimensionless surface quality number (Figure 8a).
Although the average surface roughness is the most widely used parameter representing surface quality, it only describes the statistical values such as the heights and depths of peaks and valleys. Under certain circumstances, the use of the average surface roughness is limited. For example, the surface of an as-printed LDED part and a post-machined part surface can have the same average surface roughness. Therefore, other parameters, such as skewness and kurtosis of the part’s surface, are often used to represent the surface quality, as discussed below.

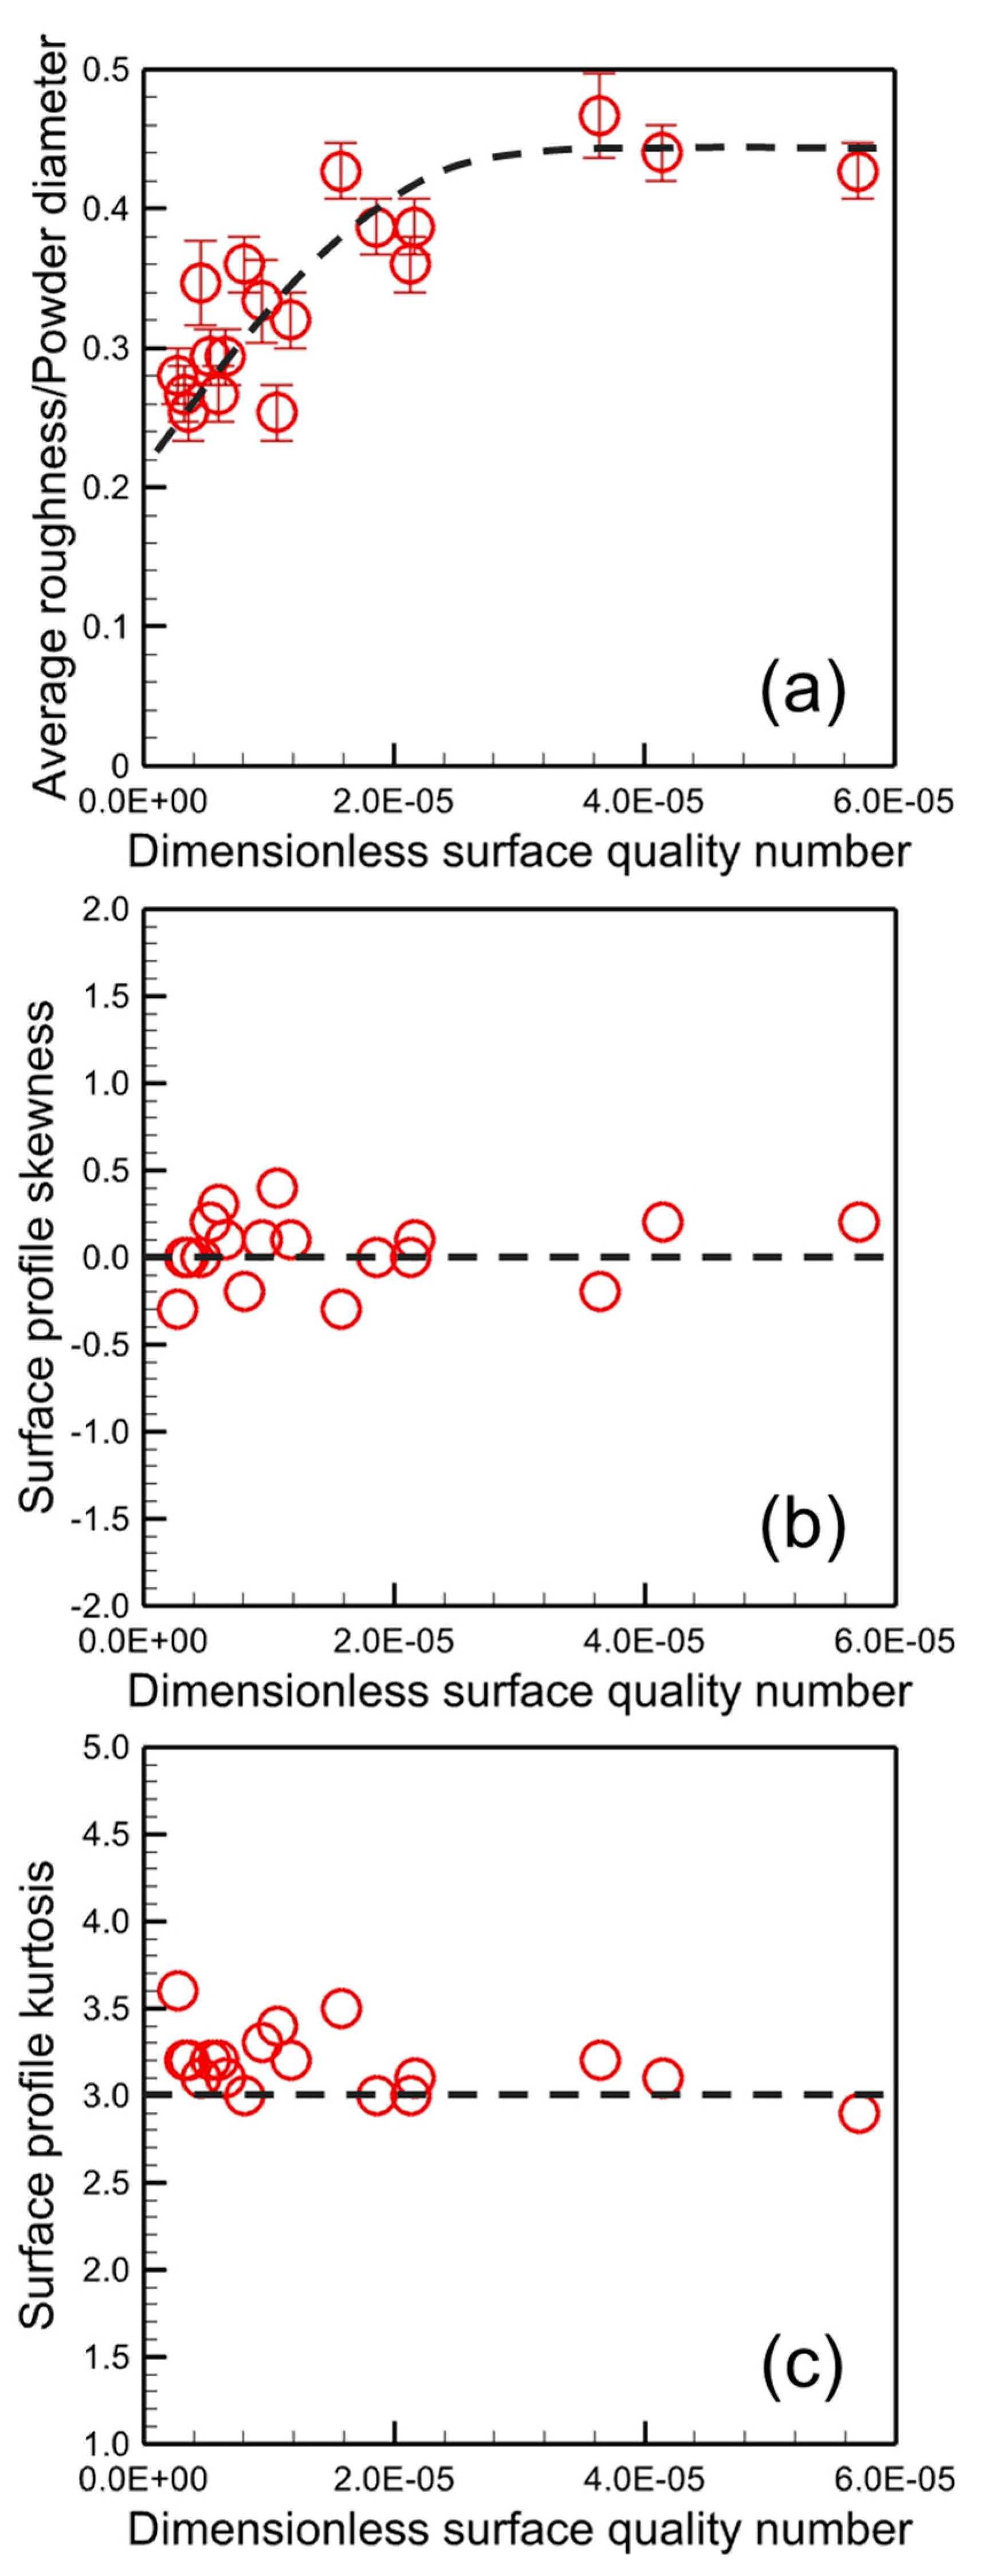
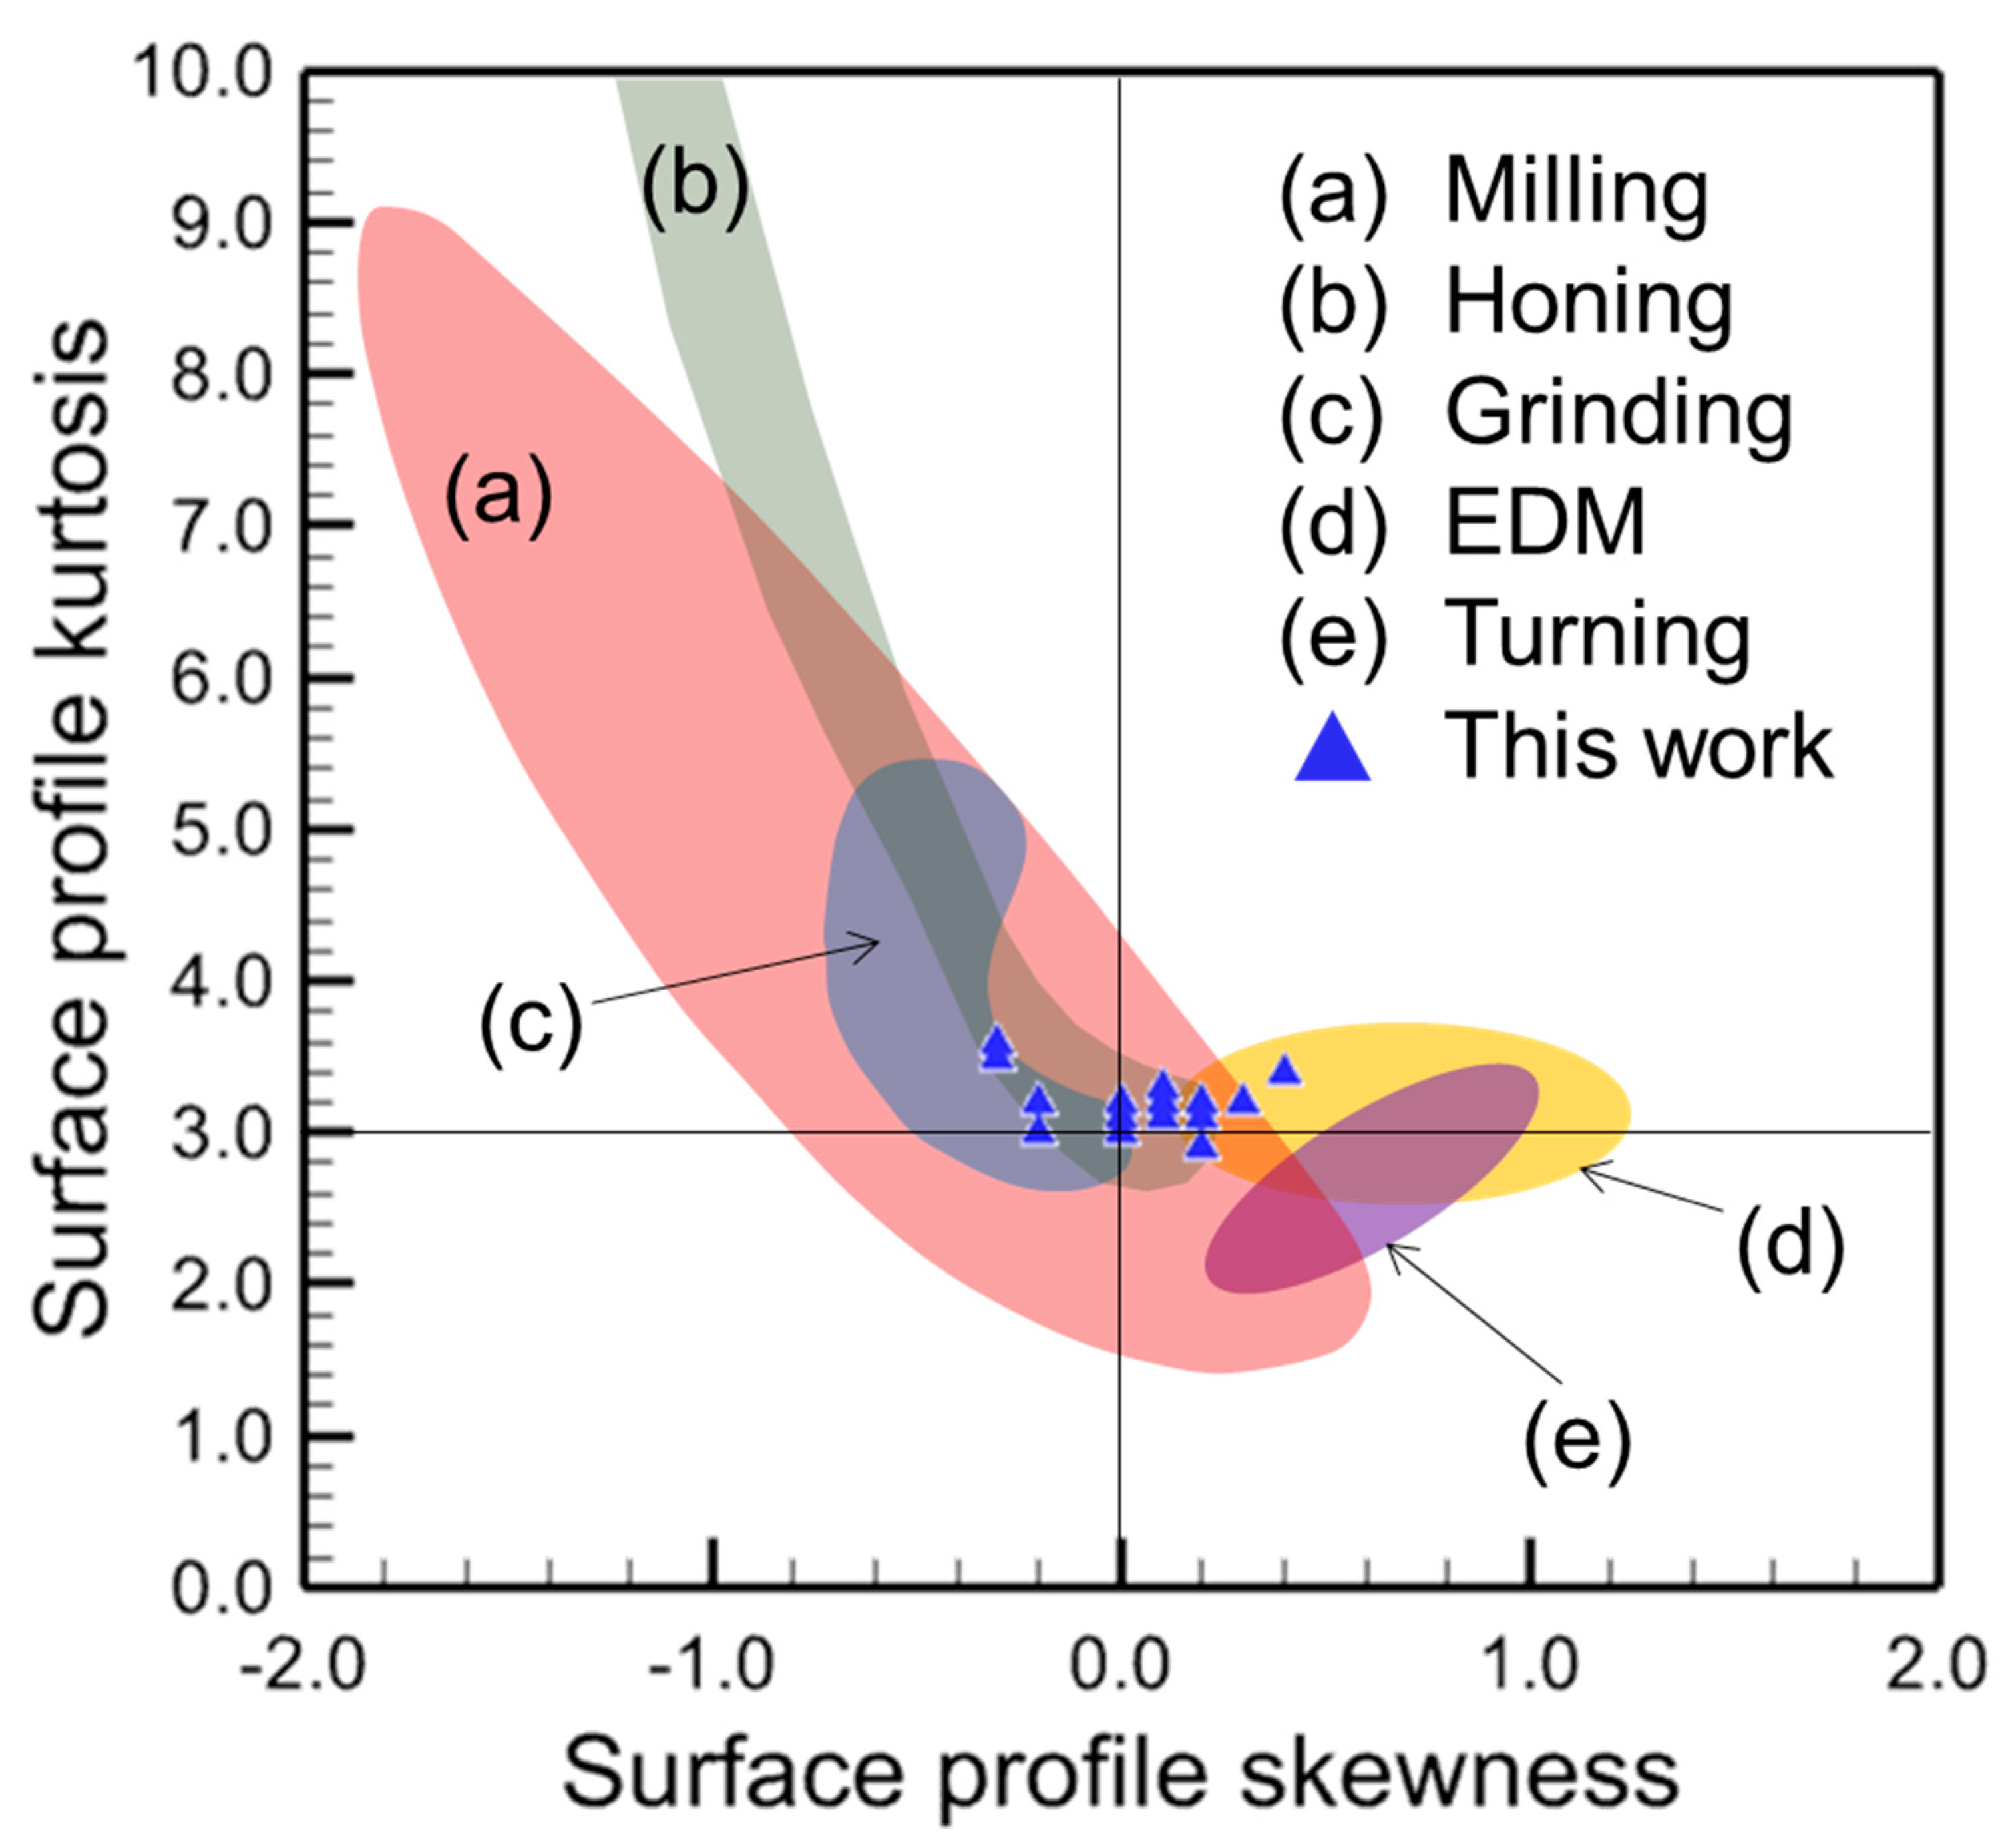
3.3. Skewness and Kurtosis of the Deposited Surfaces

Skewness is a representation of the surface profile of the mean line. A positive skewness indicates that the surface primarily has peaks. In contrast, part surfaces with negative skewness are generally composed of valleys. The sharpness of the peaks is represented by kurtosis. Apart from representing the part surface quality, skewness and kurtosis are found to be correlated with the fatigue life and tribological properties of parts [44]. For example, a part with a high surface skewness contains many peaks and valleys that are potential stress concentration sites leading to fatigue failure. Mathematically, skewness and kurtosis are the third and fourth-order moments of the probability distribution of the surface heights, respectively. The third and fourth standardized moments of a normal random variable are 0 and 3, respectively. Therefore, the desired values of skewness and kurtosis of a part surface are 0 and 3, respectively (Figure 8b,c).
It can be found that the skewness and kurtosis (Figure 8b,c) of the printed surfaces are close to 0 and 3, respectively, indicating a normal distribution of the surface profile. This is an inherent characteristic of the LDED samples made in this work and does not significantly change with the dimensionless surface quality number for different processing conditions. According to industry standards, the desired values of skewness and kurtosis of manufactured surfaces should be close to 0 and 3, respectively. Therefore, it is important to compare these values for printed surfaces with those for traditionally manufactured parts. Figure 9 shows a comparison of the surface profile skewness and kurtosis of parts made by laser DED in this work with those fabricated using traditional manufacturing processes [45], such as milling, honing, grinding, electro-discharge machining, and turning. It can be seen that LDED can often produce better surface quality than traditional manufacturing processes. In addition, the data reported in the independent peer-reviewed literature indicates that the values of skewness and kurtosis vary significantly for the traditionally manufactured parts. In contrast, such variations are remarkably less in additively manufactured parts.

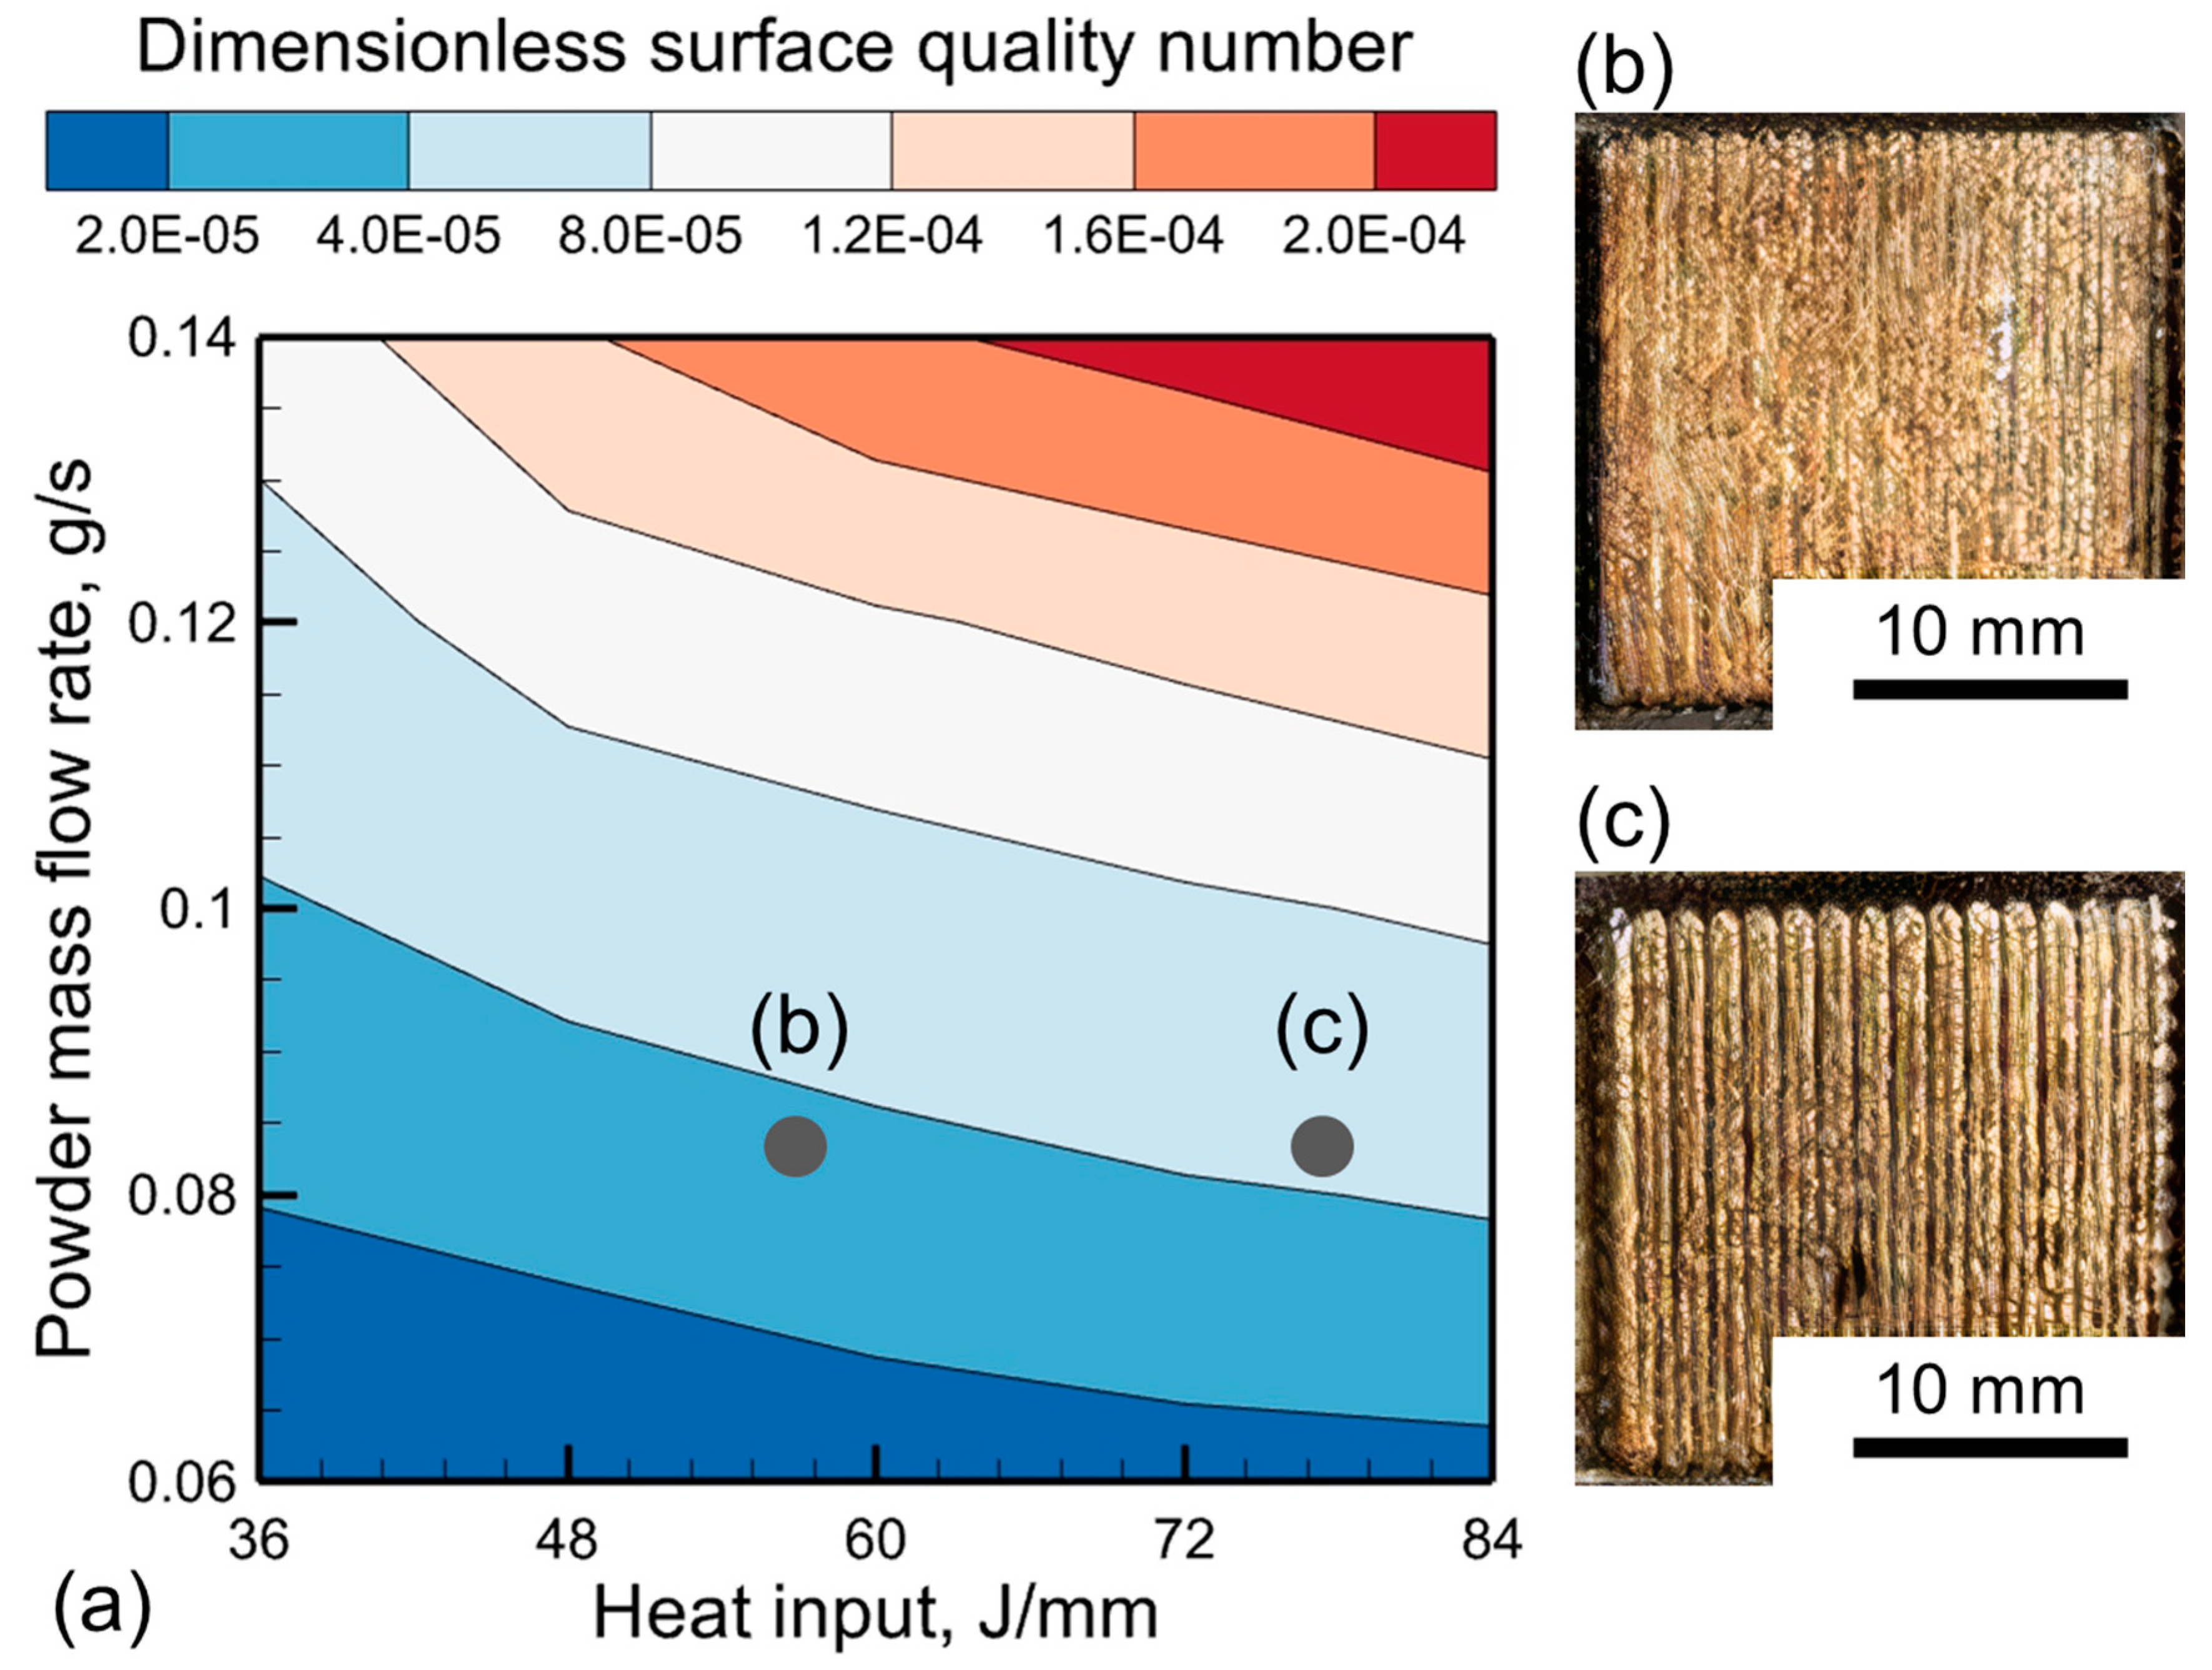
3.4. Surface Quality Map

From Figure 7 and Figure 8, it is evident that the surface characteristics are significantly affected by the LDED process and processing conditions. The effects of processing conditions and alloy properties are captured through the dimensionless surface quality number. Figure 10a shows a surface quality map indicating the variations in dimensionless surface quality number with heat input (laser power/scanning speed) and powder mass flow rate. From the map, it is evident that a high heat input and powder mass flow rate can degrade the surface quality. A high heat input results in a larger pool that can disintegrate into small balls and increase surface roughness. A large mass accumulation per unit length of the track at a high mass flow rate can increase the peak-to-valley distance and result in a rough surface. This map indicates the relative susceptibilities to surface roughness at different LDED processing conditions. A high value of surface quality number indicates poor surface quality. For example, the part shown in Figure 10c corresponds to a higher value of the surface quality number than the part in Figure 10b and thus exhibits rougher surfaces. Once these types of process maps are available on the shop floor [46], engineers can predict and control the surface quality before performing any experiments. However, please note that the quality of the entire part depends on both external and internal qualities. For example, internal qualities such as microstructure and the presence of porosity, cracking, and lack of fusion voids can affect mechanical and corrosion properties. However, this work concerns only the external surface qualities, and the internal qualities are beyond the scope of this work.

4. Summary and Conclusions

In this work, a unique combination of structured light scanning characterization and mechanistic modeling was used to identify three key physical factors that affect the deposit surface quality in laser-directed energy deposition. Below are the main conclusions:
(1)
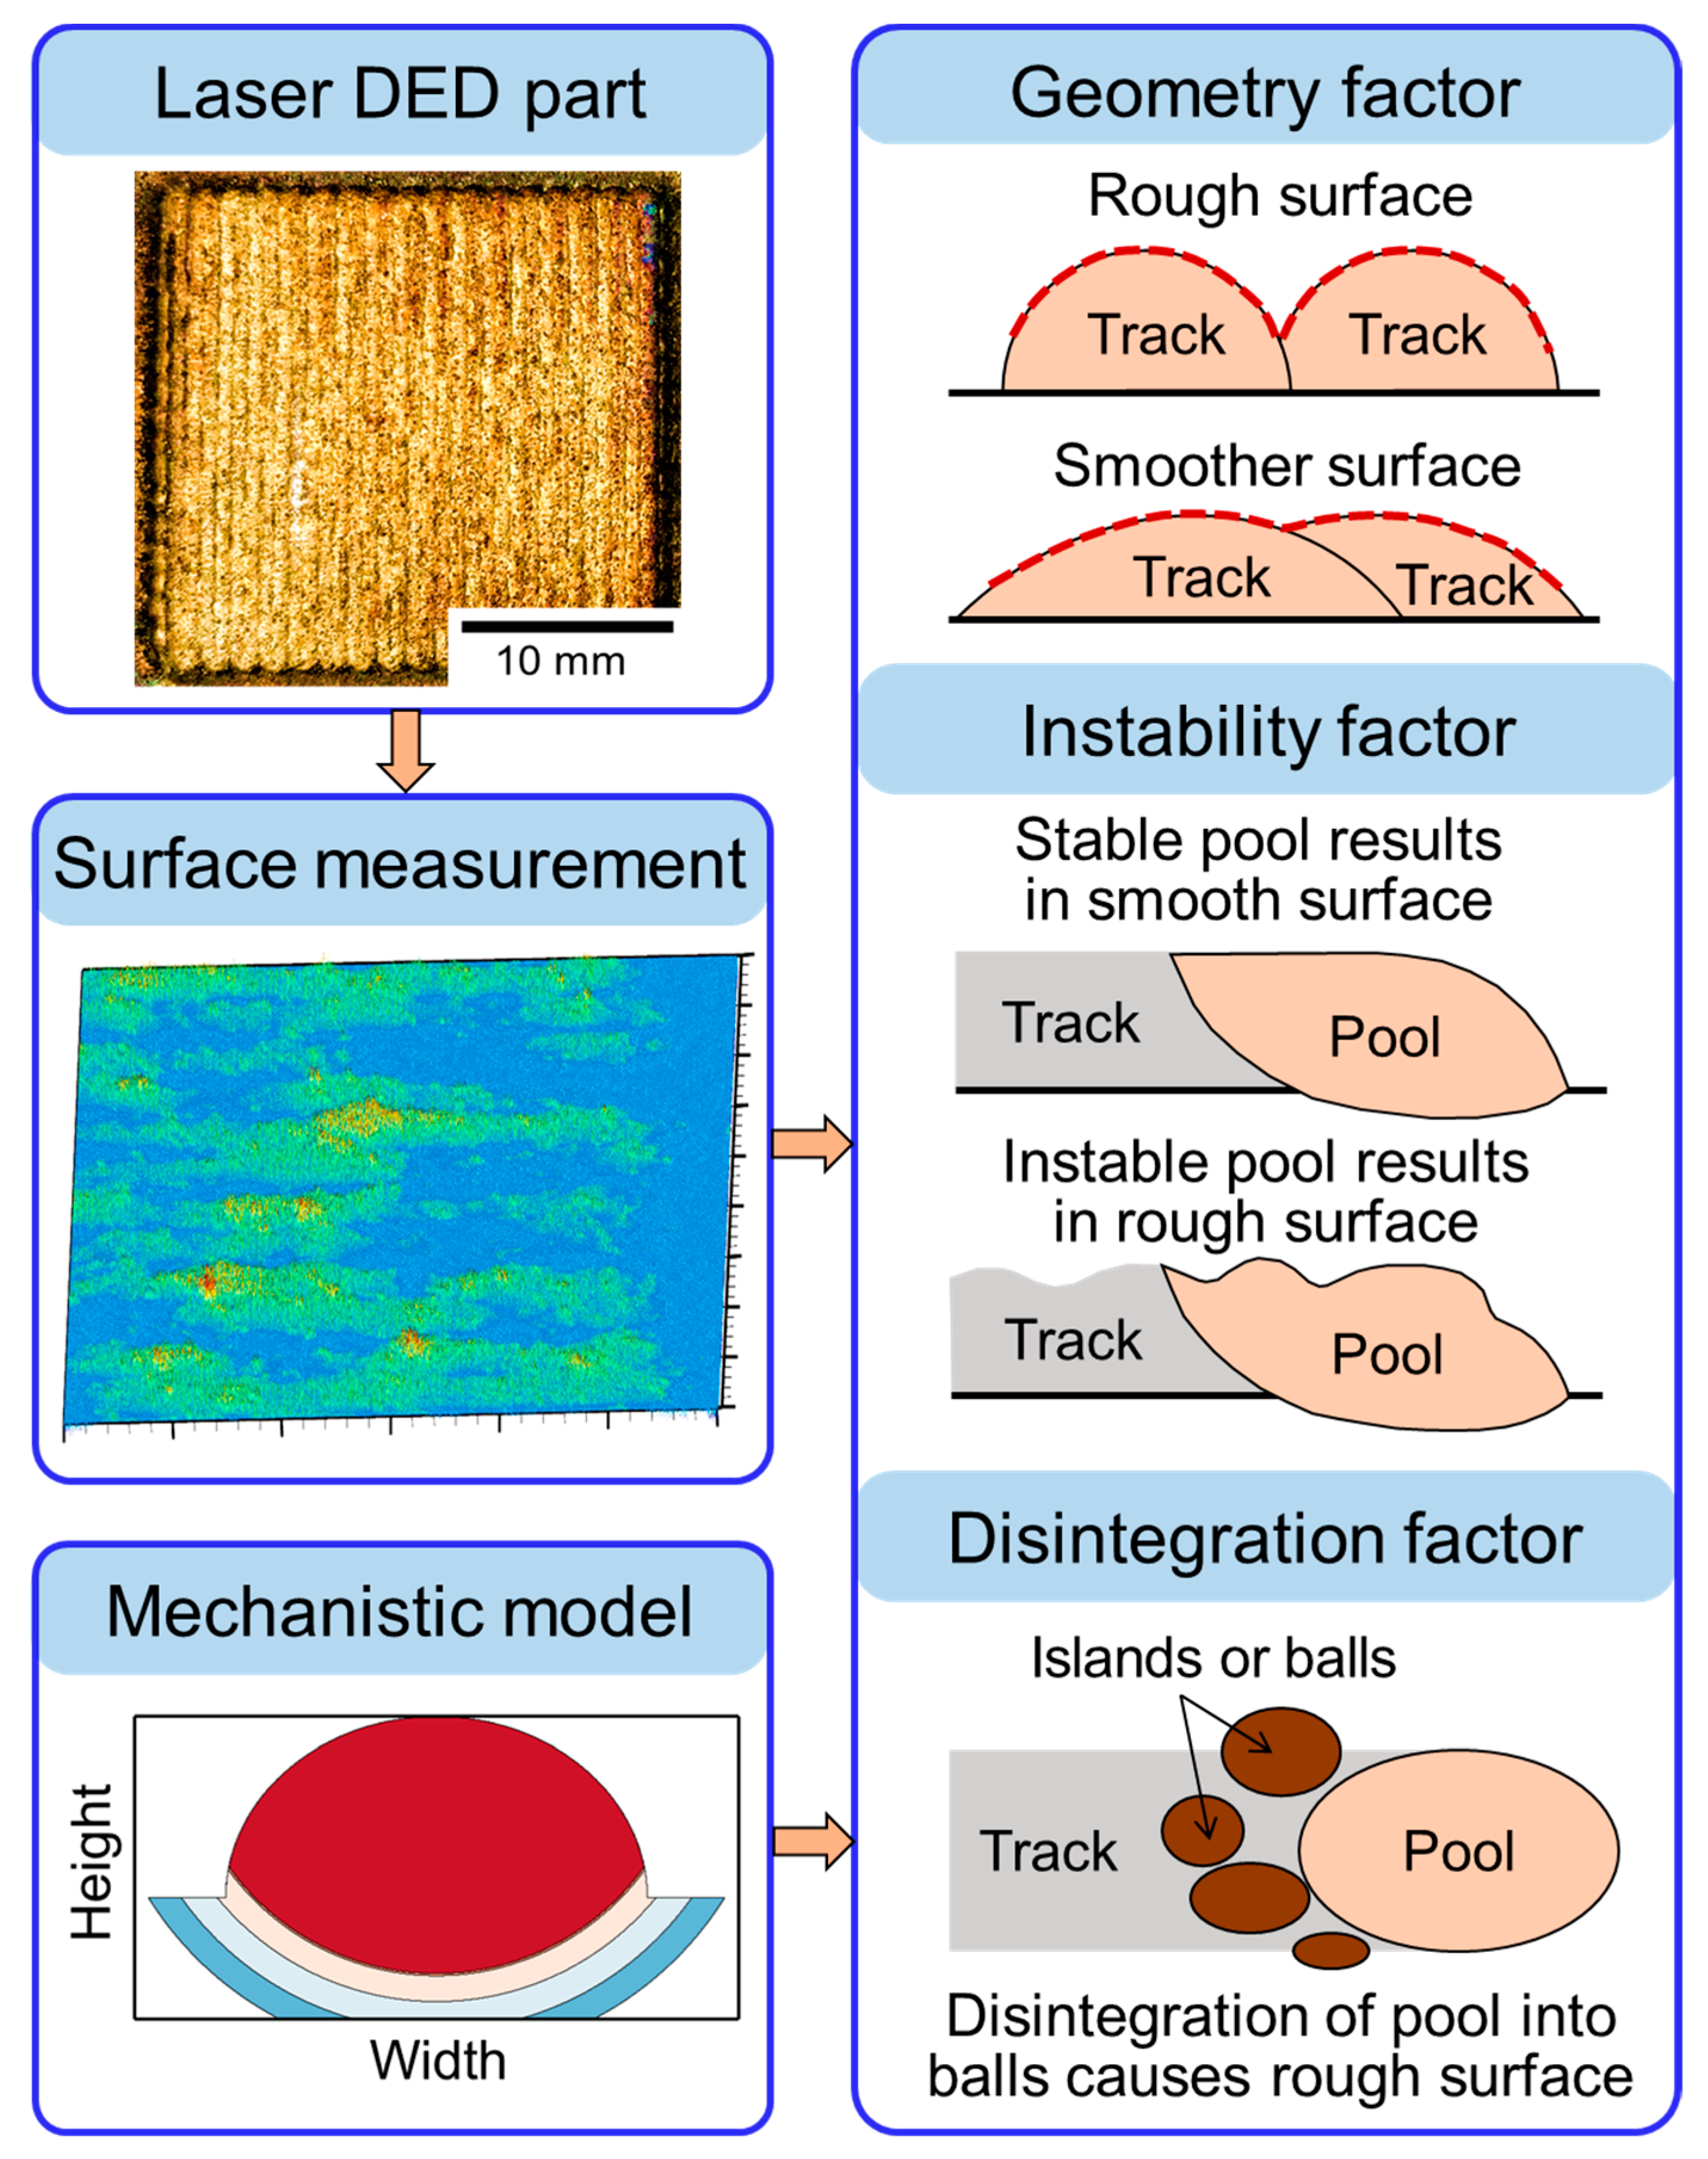
The average surface roughness of deposits fabricated by laser-directed energy deposition was found to increase at higher values of the geometric, instability, and disintegration factors. Based on the geometric factor, it was found that the surface roughness could be minimized by fabricating thinner and wider deposits and by lowering the hatch spacing. A pronounced hydrodynamic instability of the molten pool indicated by a high value of the Richardson number could result in rough surfaces. A long solidification time and low surface tension force on the molten pool surface could lead to the disintegration of the molten pool into small balls on the deposit surface and degrade the surface quality.
(2)
Surfaces with positive skewness values primarily had peaks. The sharpness of the peaks was represented by kurtosis. The skewness and kurtosis of the printed deposit surfaces were close to 0 and 3, respectively, indicating a normal distribution of the surface profile. In addition, the measured values of skewness and kurtosis show that the LDED deposit surface quality was significantly better than traditional manufacturing processes such as milling, honing, grinding, electro-discharge machining, and turning.
(3)
A surface quality map indicating the relative susceptibilities to surface roughness at different LDED processing conditions is presented. From the map, it was found that a high heat input and powder mass flow rate could degrade the surface quality. A high heat input results in a larger pool that can disintegrate into small balls and increase surface roughness. A large mass accumulation per unit length of the track at a high mass flow rate can increase the peak-to-valley distance and result in a rough surface. The surface quality map can be used to select appropriate sets of process parameters to improve deposit surface quality.

Author Contributions

Conceptualization, T.M.; methodology, T.M., Y.L. and B.L.; software, T.M.; validation T.M.; formal analysis, T.M.; investigation, T.M. and W.S.; resources, Y.L. and B.L.; data curation, T.M. and W.S.; writing—original draft preparation, T.M. and W.S.; writing—review and editing, T.M., Y.L. and B.L.; visualization, T.M. and W.S.; supervision, T.M., Y.L. and B.L.; project administration, T.M., Y.L. and B.L. All authors have read and agreed to the published version of the manuscript.

Funding

This research received no external funding.

Data Availability Statement

Data is unavailable due to privacy or ethical restrictions.

Acknowledgments

The authors would like to thank Xing Zhang for his assistance in surface topography data acquisition and analysis. The authors also acknowledge the kind support from Tarasankar DebRoy from Penn State University for the mechanistic modeling. The materials for LDED experiments were partially supported by Iowa Energy Center (IEC) Grant 21-IEC-010. The views expressed in this paper are those of the authors but are not necessarily those of the IEC.

Conflicts of Interest

The authors declare no conflict of interest.

References

  1. Mukherjee, T.; DebRoy, T. Theory and Practice of Additive Manufacturing; John Wiley & Sons: Hoboken, NJ, USA, 2023; ISBN 978-1-394-20227-0. [Google Scholar]
  2. Mukherjee, T. Recent progress in process, structure, properties, and performance in additive manufacturing. Sci. Technol. Weld. Join. 2023, 28, 941–945. [Google Scholar] [CrossRef]
  3. Mukherjee, T.; Elmer, J.; Wei, H.; Lienert, T.; Zhang, W.; Kou, S.; DebRoy, T. Control of grain structure, phases, and defects in additive manufacturing of high-performance metallic components. Prog. Mater. Sci. 2023, 138, 101153. [Google Scholar] [CrossRef]
  4. Svetlizky, D.; Das, M.; Zheng, B.; Vyatskikh, A.L.; Bose, S.; Bandyopadhyay, A.; Schoenung, J.M.; Lavernia, E.J.; Eliaz, N. Directed energy deposition (DED) additive manufacturing: Physical characteristics, defects, challenges and applications. Mater. Today 2021, 49, 271–295. [Google Scholar] [CrossRef]
  5. Gockel, J.; Sheridan, L.; Koerper, B.; Whip, B. The influence of additive manufacturing processing parameters on surface roughness and fatigue life. Int. J. Fatigue 2019, 124, 380–388. [Google Scholar] [CrossRef]
  6. Ma, H.; Wang, J.; Qin, P.; Liu, Y.; Chen, L.; Wang, L.; Zhang, L. Advances in additively manufactured titanium alloys by powder bed fusion and directed energy deposition: Microstructure, defects, and mechanical behavior. J. Mater. Sci. Technol. 2024, 183, 32–62. [Google Scholar] [CrossRef]
  7. Voisin, T.; Shi, R.; Zhu, Y.; Qi, Z.; Wu, M.; Sen-Britain, S.; Zhang, Y.; Qiu, S.R.; Wang, Y.M.; Thomas, S.; et al. Pitting Corrosion in 316L Stainless Steel Fabricated by Laser Powder Bed Fusion Additive Manufacturing: A Review and Perspective. JOM 2022, 74, 1668–1689. [Google Scholar] [CrossRef]
  8. Souza, A.M.; Ferreira, R.; Barragán, G.; Nuñez, J.G.; Mariani, F.E.; da Silva, E.J.; Coelho, R.T. Effects of Laser Polishing on Surface Characteristics and Wettability of Directed Energy-Deposited 316L Stainless Steel. J. Mater. Eng. Perform. 2021, 30, 6752–6765. [Google Scholar] [CrossRef]
  9. Jardon, Z.; Ertveldt, J.; Lecluyse, R.; Hinderdael, M.; Pyl, L. Directed Energy Deposition roughness mitigation through laser remelting. Procedia CIRP 2022, 111, 180–184. [Google Scholar] [CrossRef]
  10. Cho, S.Y.; Shin, G.Y.; Shim, D.S. Effect of laser remelting on the surface characteristics of 316L stainless steel fabricated via directed energy deposition. J. Mater. Res. Technol. 2021, 15, 5814–5832. [Google Scholar] [CrossRef]
  11. Kim, M.J.; Saldana, C. Post-processing of additively manufactured IN625 thin-walled structures using laser remelting in directed energy deposition. J. Manuf. Process. 2023, 88, 59–70. [Google Scholar] [CrossRef]
  12. Ribeiro, K.S.; Mariani, F.E.; Idogava, H.T.; da Silva, G.C.; Silveira, Z.C.; de Lima, M.S.; Coelho, R.T. Evaluation of laser polishing as post-processing of Inconel 625 produced by Directed Energy Deposition. Procedia Manuf. 2021, 53, 368–374. [Google Scholar] [CrossRef]
  13. Zhang, J.; Shi, S.; Fu, G.; Shi, J.; Zhu, G.; Cheng, D. Analysis on surface finish of thin-wall parts by laser metal deposition with annular beam. Opt. Laser Technol. 2019, 119, 105605. [Google Scholar] [CrossRef]
  14. Piscopo, G.; Salmi, A.; Atzeni, E.; Iuliano, L.; Busatto, M.; Tusacciu, S.; Lai, M.; Biamino, S.; Toushekhah, M.; Saboori, A.; et al. On the effect of deposition patterns on the residual stress, roughness and microstructure of AISI 316L samples produced by directed energy deposition. In Progress in Digital and Physical Manufacturing: Proceedings of ProDPM’19; Springer International Publishing: Berlin/Heidelberg, Germany, 2020; pp. 206–212. [Google Scholar] [CrossRef]
  15. Ribeiro, G.E.; Wong, V.; Sanitá, W.R.; Rodrigues, A.R.; Coelho, R.T. Effect of Laser Power and Powder Morphology on Surface Roughness of TI6Al4V Produced by Laser Powder-Directed Energy Deposition. In Brazilian Manufacturing Engineering Congress; Springer Nature: Cham, Switzerland, 2023; pp. 151–160. [Google Scholar] [CrossRef]
  16. Craig, O.; Bois-Brochu, A.; Plucknett, K. Geometry and surface characteristics of H13 hot-work tool steel manufactured using laser-directed energy deposition. Int. J. Adv. Manuf. Technol. 2021, 116, 699–718. [Google Scholar] [CrossRef]
  17. Haley, J.C.; Schoenung, J.M.; Lavernia, E.J. Modelling particle impact on the melt pool and wettability effects in laser directed energy deposition additive manufacturing. Mater. Sci. Eng. A 2019, 761, 138052. [Google Scholar] [CrossRef]
  18. Liao, S.; Webster, S.; Huang, D.; Council, R.; Ehmann, K.; Cao, J. Simulation-guided variable laser power design for melt pool depth control in directed energy deposition. Addit. Manuf. 2022, 56, 102912. [Google Scholar] [CrossRef]
  19. Chen, C.; Lian, G.; Jiang, J.; Wang, Q. Simplification and experimental investigation of geometrical surface smoothness model for multi-track laser cladding processes. J. Manuf. Process. 2018, 36, 621–628. [Google Scholar] [CrossRef]
  20. Yushu, D.; McMurtrey, M.D.; Jiang, W.; Kong, F. Directed energy deposition process modeling: A geometry-free thermo-mechanical model with adaptive subdomain construction. Int. J. Adv. Manuf. Technol. 2022, 122, 849–868. [Google Scholar] [CrossRef]
  21. Zhu, X.; Jiang, F.; Guo, C.; Xu, D.; Wang, Z.; Jiang, G. Surface morphology inspection for directed energy deposition using small dataset with transfer learning. J. Manuf. Process. 2023, 93, 101–115. [Google Scholar] [CrossRef]
  22. Guo, C.; He, S.; Yue, H.; Li, Q.; Hao, G. Prediction modelling and process optimization for forming multi-layer cladding structures with laser directed energy deposition. Opt. Laser Technol. 2020, 134, 106607. [Google Scholar] [CrossRef]
  23. Patil, D.B.; Nigam, A.; Mohapatra, S.; Nikam, S. A Deep Learning Approach to Classify and Detect Defects in the Components Manufactured by Laser Directed Energy Deposition Process. Machines 2023, 11, 854. [Google Scholar] [CrossRef]
  24. Gradl, P.; Cervone, A.; Colonna, P. Influence of build angles on thin-wall geometry and surface texture in laser powder directed energy deposition. Mater. Des. 2023, 234, 112352. [Google Scholar] [CrossRef]
  25. Ansari, M.; Martinez-Marchese, A.; Khamooshi, M.; Keshavarzkermani, A.; Esmaeilizadeh, R.; Toyserkani, E. Analytical modeling of multi-track powder-fed laser directed energy deposition: On the relationships among process, deposition dimensions, and solidification microstructure in additively manufactured near-β titanium alloy. J. Am. Acad. Dermatol. 2022, 306, 117643. [Google Scholar] [CrossRef]
  26. Du, Y.; Mukherjee, T.; DebRoy, T. Physics-informed machine learning and mechanistic modeling of additive manufacturing to reduce defects. Appl. Mater. Today 2021, 24, 101123. [Google Scholar] [CrossRef]
  27. Gusarov, A.; Kotoban, D.; Zhirnov, I. Optical diagnostics of selective laser melting and monitoring of single-track formation. MATEC Web Conf. 2017, 129, 01037. [Google Scholar] [CrossRef]
  28. Cai, Y.; Wang, Y.; Chen, H.; Xiong, J. Molten pool behaviors and forming characteristics in wire-laser directed energy deposition with beam oscillation. J. Am. Acad. Dermatol. 2024, 326, 118326. [Google Scholar] [CrossRef]
  29. Kiani, P.; Dupuy, A.D.; Ma, K.; Schoenung, J.M. Directed energy deposition of AlSi10Mg: Single track nonscalability and bulk properties. Mater. Des. 2020, 194, 108847. [Google Scholar] [CrossRef]
  30. Liu, S.; Guo, H. Balling Behavior of Selective Laser Melting (SLM) Magnesium Alloy. Materials 2020, 13, 3632. [Google Scholar] [CrossRef] [PubMed]
  31. Borovkov, H.; de la Yedra, A.G.; Zurutuza, X.; Angulo, X.; Alvarez, P.; Pereira, J.C.; Cortes, F. In-Line Height Measurement Technique for Directed Energy Deposition Processes. J. Manuf. Mater. Process. 2021, 5, 85. [Google Scholar] [CrossRef]
  32. Paes, L.E.d.S.; Pereira, M.; Xavier, F.A.; Weingaertner, W.L.; D’Oliveira, A.S.C.M.; Costa, E.C.; Vilarinho, L.O.; Scotti, A. Understanding the behavior of laser surface remelting after directed energy deposition additive manufacturing through comparing the use of iron and Inconel powders. J. Manuf. Process. 2021, 70, 494–507. [Google Scholar] [CrossRef]
  33. Shen, W.; Zhang, X.; Liao, Y.; Li, B. Real-Time Structured Light Scanning Characterization of Surface Topography of Direct Energy Deposited 316L Stainless Steel. In Proceedings of the ASME 2022 17th International Manufacturing Science and Engineering Conference, West Lafayette, IN, USA, 27 June–1 July 2022. [Google Scholar]
  34. Haque, M.M.; Yeh, L.-H.; Zhang, X.; Li, B.; Liao, Y. Surface Morphology of API 5L X65 Pipeline Steel Processed by Ultrasonic Impact Peening. In Proceedings of the ASME 2023 18th International Manufacturing Science and Engineering Conference, New Brunswick, NJ, USA, 12–16 June 2023. [Google Scholar]
  35. Fleming, T.G.; Rees, D.T.; Marussi, S.; Connolley, T.; Atwood, R.C.; Jones, M.A.; Fraser, J.M.; Leung, C.L.A.; Lee, P.D. In situ correlative observation of humping-induced cracking in directed energy deposition of nickel-based superalloys. Addit. Manuf. 2023, 71, 103579. [Google Scholar] [CrossRef]
  36. Jardon, Z.; Ertveldt, J.; Hinderdael, M.; Guillaume, P. Process parameter study for enhancement of directed energy deposition powder efficiency based on single-track geometry evaluation. J. Laser Appl. 2021, 33, 042023. [Google Scholar] [CrossRef]
  37. ISO 25178; Geometrical Product Specifications (GPS)—Surface Texture: Areal. International Organization for Standardization: Geneva, Switzerland, 2012.
  38. Mills, K.C. Recommended Values of Thermophysical Properties for Selected Commercial Alloys, 1st ed.; Antony Rowe Ltd.: Wiltshire, UK, 2002. [Google Scholar] [CrossRef]
  39. Knapp, G.L.; Mukherjee, T.; Zuback, J.S.; Wei, H.L.; Palmer, T.A.; De, A.; DebRoy, T. Building blocks for a digital twin of additive manufacturing. Acta Mater. 2017, 135, 390–399. [Google Scholar] [CrossRef]
  40. Huang, Y.; Khamesee, M.B.; Toyserkani, E. A comprehensive analytical model for laser powder-fed additive manufacturing. Addit. Manuf. 2016, 12, 90–99. [Google Scholar] [CrossRef]
  41. Messler, R.W., Jr. Principles of Welding: Processes, Physics, Chemistry, and Metallurgy; John Wiley & Sons: Hoboken, NJ, USA, 2008; ISBN 978-3-527-61749-4. [Google Scholar]
  42. DebRoy, T.; David, S.A. Physical processes in fusion welding. Rev. Mod. Phys. 1995, 67, 85–112. [Google Scholar] [CrossRef]
  43. Du, Y.; Mukherjee, T.; Finch, N.; De, A.; DebRoy, T. High-throughput screening of surface roughness during additive manufacturing. J. Manuf. Process. 2022, 81, 65–77. [Google Scholar] [CrossRef]
  44. Yan, X.-L.; Wang, X.-L.; Zhang, Y.-Y. Influence of Roughness Parameters Skewness and Kurtosis on Fatigue Life Under Mixed Elastohydrodynamic Lubrication Point Contacts. J. Tribol. 2014, 136, 031503. [Google Scholar] [CrossRef]
  45. Piscopo, G.; Salmi, A.; Atzeni, E. Influence of High-Productivity Process Parameters on the Surface Quality and Residual Stress State of AISI 316L Components Produced by Directed Energy Deposition. J. Mater. Eng. Perform. 2021, 30, 6691–6702. [Google Scholar] [CrossRef]
  46. Sinha, S.; Mukherjee, T. Mitigation of Gas Porosity in Additive Manufacturing Using Experimental Data Analysis and Mechanistic Modeling. Materials 2024, 17, 1569. [Google Scholar] [CrossRef] [PubMed]
Figure 1. Schematic representation of the methodology used in this work. Structured light scanning was used to measure the surface profile of the parts made by laser-directed energy deposition (LDED). A mechanistic model of LDED process was used to calculate the three physical factors responsible for determining the surface qualities of parts. The computed values of the physical factors were tested against the surface characteristics measured by the structure light scanning.
Jmmp 08 00124 g001
Figure 2. (a) Actual setup and (b) schematic representation of the structured light scanning method for measuring the surface characteristics.
Jmmp 08 00124 g002
Figure 3. Image of the (a) 3D isometric view and (b) top surface of a stainless steel 316 part fabricated by laser-directed energy deposition. The part is 22 mm long and 22 mm wide and is made using 500 W laser power, 9.17 mm/s scanning speed, and 0.083 g/s powder mass flow rate. (c) Surface profile of the part within the region shown by a black dashed box in figure (b). The color bar represents the surface height or depth in mm.
Jmmp 08 00124 g003
Figure 4. Temperature profile on the longitudinal section (the plane along the scanning direction) of the deposit computed using (a) a mechanistic model used in this work and (b) a heat transfer fluid flow model [39]. The result in Figure (b) was provided in [39]. Both the results are for stainless steel 316 deposit made by laser-directed energy deposition using 2500 W laser power, 10.6 mm/s scanning speed, and 0.25 g/s powder mass flow rate.
Jmmp 08 00124 g004
Figure 5. Temperature profiles on the longitudinal section (the plane along the scanning direction) of stainless steel 316 deposits computed using a mechanistic model used in this work. The results are for 0.083 g/s powder mass flow rate and (a) 600 W and 12.5 mm/s scanning speed, (b) 700 W and 12.5 mm/s scanning speed, and (c) 600 W and 10.83 mm/s scanning speed.
Jmmp 08 00124 g005
Figure 6. Comparison between the deposit cross-sections computed using the model used in this work and the experimentally measured cross-sections [39] of stainless steel 316 deposits made by laser-directed energy deposition using (a) 1500 W and (b) 2500 W laser power. For both cases, scanning speed and powder mass flow rate were 10.6 mm/s and 0.25 g/s, respectively. Yellow dashed lines indicate the fusion zone boundaries.
Jmmp 08 00124 g006
Figure 7. The ratio of the average surface roughness of the parts to powder diameter is represented as functions of (a) the dimensionless geometry factor, (b) Richardson number indicating the instability factor, and (c) the dimensionless disintegration factor. Here, the average surface roughness values are measured using the structured light scanning. Corresponding values of the three physical factors are calculated using the model used in this work. The error bars in the data points indicate the measurement error in the surface roughness values. Mean absolute errors (MAE) for (ac) are 0.015, 0.059, and 0.091, respectively. In addition, Root Mean Square Errors (RMSEs) for (ac) are 0.021, 0.079, and 0.114, respectively. The data are for parts made using 0.083 g/s powder mass flow rate. Laser power was varied between 400 and 700 W with a step of 100 W and the scanning speed was varied between 450 and 750 mm/min with a step of 50 mm/min.
Jmmp 08 00124 g007
Figure 8. The effects of the dimensionless surface quality number on (a) the ratio of the average surface roughness of the parts to powder diameter, (b) surface profile skewness, and (c) surface profile kurtosis. Here, the average surface roughness values, surface skewness, and kurtosis are measured using structured light scanning. Corresponding values of the dimensionless surface quality number are calculated using the model used in this work. The dimensionless surface quality number is represented by the product of the three dimensionless physical factors. The data are for parts made using 0.083 g/s powder mass flow rate. Laser power was varied between 400 and 700 W with a step of 100 W and the scanning speed was varied between 450 and 750 mm/min with a step of 50 mm/min.
Jmmp 08 00124 g008
Figure 9. Comparison of the surface profile skewness and kurtosis of parts made by laser-directed energy deposition in this work with those fabricated using traditional manufacturing processes such as milling, honing, grinding, electro-discharge machining (EDM), and turning. The data on the traditional manufacturing processes are taken from [45].
Jmmp 08 00124 g009
Figure 10. (a) A surface quality map indicating the variations in the computed dimensionless surface quality number with heat input (laser power/scanning speed) and powder mass flow rate. The dimensionless surface quality number is represented by the product of the three dimensionless physical factors. (b,c) Images of the top surface of two stainless steel 316 parts fabricated by laser-directed energy deposition using corresponding conditions shown in (a).
Jmmp 08 00124 g010
Table 1. Selected examples of using experimental [8,9,10,11,12,13,14,15,16] and computational [17,18,19,20,21,22,23] approaches to improve surface quality in laser-directed energy deposition.
ApproachLimitationsReference
ExperimentalPost-process laser polishing with optimized processing conditions was used.The process is expensive, difficult to apply for internal surfaces, and can promote other defects and undesirable microstructure.[8]
Post-process laser remelting removed the traces of the spatter and unmelted powder to improve the surface quality.The process is time-consuming, expensive, and applicable only to external surfaces. [9,10]
Post-process laser remelting reduced surface roughness and waviness.The process is tested only for thin wall structures. In addition, there is no guided approach to select the power of remelting laser.[11]
Post-process laser polishing was applied at different laser energy levels to improve surface finish.The process is time-consuming and applicable only to the external surfaces.[12]
An annular laser beam produced a higher temperature at the deposit edges than at the center and was beneficial to obtain smooth surfaces.Commercial LDED machines have limited flexibility in adjusting the laser beam profile.[13]
The scanning direction was changed between two consecutive layers to minimize the surface unevenness. Changing scanning direction between layers can result in other defects such as lack of fusion.[14]
Process parameters such as power of the laser beam and scanning speed were adjusted to improve surface quality.Trial-and-error adjustment of process variables is time-consuming and expensive.[15,16]
Computational and data sciencesA three-phase computational fluid dynamics model was used to observe the melting dynamics of individual powder particles to understand the evolution of surface features.Powder scale models simulating the dynamics of individual powder particles are computationally intensive and can not be used in real time.[17]
A thermal finite element simulation was used to adjust the laser power to control the melt pool dimensions and surface quality.A limited understanding of the relations between the temperature field and surface quality can make the part-scale thermal models inefficient.[18]
A simplified geometric model was used to obtain the track overlap to approaximately predict the surface smoothness.This model did not consider the effects of temperature fields and molten pool geometry on surface quality.[19]
Multiphysics Object-Oriented Simulation Environment based model was used to obtain the deposit surface features.This approach did not provide the local surface roughness, skewness, and kurtosis[20]
Statistical correlations and machine learning frameworks were established to reduce surface roughness by adjusting process variables.The use of statistical correlations and machine learning depends on the availability of high-quality data.[21,22,23]
Disclaimer/Publisher’s Note: The statements, opinions and data contained in all publications are solely those of the individual author(s) and contributor(s) and not of MDPI and/or the editor(s). MDPI and/or the editor(s) disclaim responsibility for any injury to people or property resulting from any ideas, methods, instructions or products referred to in the content.

