Abstract
Engineers continue to be concerned about electrical discharge-machined components’ high energy consumption, machining debris, and poor dimensional precision. The aim of this research is to propose a hybrid neuro-genetic approach to improve the machinability of the electrical discharge machining (EDM) of the Nimonic C263 superalloy. This approach focuses on reducing the energy consumption and negative environmental impacts. The material removal rate (MRR), electrode wear ratio (EWR), specific energy consumption (SEC), surface roughness (Ra), machining debris (db), and circularity (C) are examined as a function of machining parameters such as the voltage (V), pulse on time (Ton), current (I), duty factor (τ), and electrode type. By employing the VIKOR method, all the responses are transformed into a distinctive VIKOR index (VI). Neuro-genetic methods (a hybrid VIKOR-based ANN-GA) can further enhance the best possible result from the VIKOR index. During this step, the hybrid technique (VIKOR-based ANN-GA) is used to estimate an overall improvement of 9.87% in the response, and an experiment is conducted to confirm this condition of optimal machining. This work is competent enough to provide aeroengineers with an energy-efficient, satisfying workplace by lowering the machining costs and increasing productivity.
1. Introduction
Superalloys based on nickel are distinguished by their high yield strength, low thermal conductivity, and exceptional hardness. These materials require alternative methods of operation because they are challenging to machine. Nickel, cobalt, chromium, molybdenum, and titanium all make up Nimonic C263, making it a member of one of these groups of materials. The parts for gas turbines, airplanes, and other land-based automobiles rely heavily on superalloys because of their advantageous material qualities and their capacity to withstand higher temperatures. Recently, the manufacturing of various components using superalloys has resulted in their exposure to intense temperature and pressure in IC engines, heat exchangers, and other biomedical applications [1,2].
The production of built-up edges significantly degrades the condition and integrity of the machined surface, which in turn consumes a lot of energy and reduces the efficiency of the process. Nonconventional metal-cutting procedures, such as electrical discharge machining (EDM), allow for precision machining of the superalloy with minimal effort. To remove material from the work surface via a sequence of spark discharges that take place in between the electrodes, the EDM process primarily employs thermal energy. When a steady energy source is placed between the tool and the workpiece, it creates a conductive plasma channel as the positive ions and electrons interact, allowing the process to be completed inside an immersed dielectric medium. Continuous spark discharges cause material from the electrodes and the electrodes’ surrounding material to melt and vaporize [3,4]. The melted debris is then flushed off the work surface by the dielectric fluid’s flushing action. After dielectric cleaning, the machining zone typically reaches temperatures of between 8000 °C and 12,000 °C, leaving the electrode’s imprint on the work surface [4].
The procedure uses a lot of energy to melt and vaporize the electrodes because it is primarily used to fabricate hard, low-conductive materials. This in turn immediately affects the cost of production, raising the price per unit of the product. Along with requiring a lot of energy, the debris particle distribution is a significant factor in the process’ productivity decline since it can cause sparking and arcing, which could harm the electrode and the workpiece and impair the machining performance. Modern improvements in these methods have enabled the achievement of surface roughness values in the range of a few micrometers (μm), typically between 1 and 10 μm, or even down to nanometer (nm) levels, such as 10 to 100 nm, for insulating materials, including ceramics, composites, glass, etc. Tool- and die-making, the automobile industry, aerospace, mold-making, and other sectors have greatly benefited from advancements in non-traditional machining procedures over the past two decades. Specifically, EDM has found widespread application in the aerospace, biomedical, and tool-manufacturing industries [5]. This versatility makes EDM an essential process in modern manufacturing environments.
2. Literature Review
Researchers all over the world have been working hard to improve EDM’s effectiveness. Several relevant studies in this direction have been reported and are discussed below.
EDM is widely used in industries that require precise and intricate machining of various materials, including metals, alloys, ceramics, and composites. Understanding the machinability characteristics of different workpiece materials is essential for optimizing the EDM process and achieving the desired machining outcomes. Hascalik and Caydas [4] reported that the pulse duration and the current density were found to be the most important input attributes affecting the machining process by studying the machinability of a titanium alloy using three different electrodes: aluminum, copper, and graphite. Ahmed et al. [6] reported that graphite electrodes have better material evacuation ability, whereas aluminum electrodes yield components with a finer surface finish when machining a titanium alloy using graphite and aluminum electrodes in EDM. The EDM form tolerances of Inconel 718 and 625 were studied by Dhanabalan et al. [7]. The study reported the form (perpendicularity) tolerance index for Inconel 718 to be in the range of 50–55 (dimensionless, scaled by the machining time) and for Inconel 625, in the range of 15–20 (dimensionless, scaled by the machining time) for higher values of the peak current. Selvarajan et al. [8] explored the effect of EDM drilling process parameters like the current, pulse on-time, pulse off-time, dielectric pressure, and spark gaps on performance parameters such as the material removal rate, electrode wear rate, and average surface roughness, and on geometrical tolerances such as the cylindricity, circularity and perpendicularity of drilled holes in Si3N4-TiN composites. The experimental results indicate that utilizing a copper electrode for machining can yield a favorable surface finish, accompanied by enhanced machining accuracy, tighter geometrical tolerances, and reduced irregularities. Straka and Hašová [9] elaborate on the importance of the material removal rate (MRR) and tool wear rate (TWR) in die-sinking electrical discharge machining (EDM). A higher MRR facilitates quicker machining, leading to reduced production time and costs. However, it is crucial to note that excessive tool wear can have adverse effects on the machining accuracy, surface finish, and tool longevity. Rahul et al. [10] provided valuable insights into the analysis of the surface characteristics of Inconel 718 after EDM. The findings underscore the importance of process parameter optimization to achieve the desired surface quality and improve machining efficiency.
Sustainable machining not only minimizes the environmental impact but also improves energy efficiency, reduces waste generation, conserves resources and ensures a safer working environment. Zhang et al. [11] highlighted the importance of considering energy consumption and environmental sustainability in the EDM process and provided valuable insights into parameter optimization for minimizing these effects while machining a titanium alloy. Shastri and Mohanty [12] investigated and optimized the EDM process parameters to achieve sustainable machining of the Nimonic C263 alloy. Zhang et al. [13] conducted a study on the analysis and reduction of the process energy consumption and thermal deformation in micro-structure wire electrode EDM of thin-wall components. Murti et al. [14] analyzed the debris generated during ultrasonic-assisted EDM and investigated its characteristics and effects on the machining process. Nieslonyet al. [15] reported the impact of energy consumption on surface quality and highlighted the need to optimize the process parameters to achieve the desired surface integrity while considering energy efficiency in the EDM of hot-work die steel. Zhang et al. [16] conducted an experiment using different magnetic field strengths and machining parameters to evaluate the material removal rate, tool wear rate, and aerosol emissions during EDM.
Technological modifications in EDM are widely studied in the literature and have achieved higher productivity, superior machining results, and a more sustainable and cost-effective EDM process. Al-Amin et al. [17] studied the HA/CNT suspended-EDM process and its effects on the machining responses of 316 L steel. The suspension improved the material removal rate, reduced the surface roughness, and decreased the tool wear. Validation of the machined surface morphology and elemental migration has been successfully conducted through scanning electron microscopy (SEM) and energy dispersive X-ray spectroscopy (EDX) analyses. The study resulted in the lowest surface roughness of 1.85 µm. Kumaran et al. [18] reported ultrasonic-assisted EDM for deburring CFRP composites. The deburring performance was evaluated based on the material removal rate and surface roughness. Xu et al. [19] investigated recast layer removal in 304 stainless steel using a novel approach that combines micro-EDM with negative polarity micro-EDM and reported a surface quality enhancement and recast layer elimination in EDM. Laser scanning confocal microscopy results show the surface roughness of the components to be reduced by up to 0.57 µm. Jadam et al. [20] optimized the EDM parameters for Inconel 718 by adding MWCNTs to the dielectric. They used a Talysurf surface roughness tester and found that MWCNT-mixed EDM yielded better surface finishes compared to conventional methods, with the greatest improvement at Ip = 8 A (14.1% reduction in roughness). Le et al. [21] studied the role of electrical parameters and powder addition in influencing the surface properties of SKD61 steel in the EDM process. A surface roughness tester with a resolution of 0.001 μm was used to assess the surface roughness. The study reported the improved surface quality, reduced surface roughness (0.727 µm), and enhanced microhardness (726 HV) of the machined SKD61 steel. Kumar et al. [22] demonstrated that incorporating Al2O3 nanopowder into the dielectric medium enhances machining efficiency and reduces electrode wear in EDM. The study utilized atomic force microscopy (AFM) to evaluate the machined surface, revealing an improvement in the surface roughness from 2.245 to 1.487 μm. Peta et al. [23] proposed a novel method for assessing repeatability and reproducibility in topographic measurements using integrated modes on the Sensofar S neox instrument. The study used the coefficients of determination (R2) and linear regression slopes on the H-H plots to quantify the repeatability and reproducibility across large numbers of measurement locations.
Optimization techniques maximize the benefits of EDM and achieve optimal machining outcomes in terms of the efficiency, quality, and cost-effectiveness. Rangajanardha [24] focused on the development of a hybrid model that combined artificial neural networks (ANNs) and genetic algorithm (GA) to optimize the surface roughness in EDM. This research is significant in providing compelling evidence of the effectiveness of hybrid modeling approaches in attaining enhanced surface quality. Mandal and Mondal [25] focused on the multi-objective optimization of Cu-MWCNT (copper-multi-walled carbon nanotube) composite electrodes in electrical discharge machining (EDM) and used a hybrid algorithm known as MOPSO-TOPSIS. Dikshit et al.’s [26] combination of RCCD and NSGA II proved to be a valuable approach for achieving enhanced surface quality while considering multiple objectives in the EDM of the biocompatible Ti6Al4V alloy. Chekuri et al. [27] proposed a multi-objective optimization approach using the WOA-CS algorithm for experimental and thermal investigation of EDM. The experimental tests and optimization results demonstrated the effectiveness of the WOA-CS approach in achieving improved machining efficiency and surface quality. Srinivasan et al. [28] proposed the combined use of GRA and the TLBO algorithm for process optimization in the EDM of Si3N4–TiN.
This review has presented a comprehensive overview of research conducted between 2018 and 2023, focusing on the measurement of different performance metrics in electrical discharge machining (EDM). As per the reported works, no research work has recently been conducted on debris particle study. Very few research papers studied the circularity of the machined holes and the specific energy consumption (SEC) in EDM. Most of the effort was directed toward EDM applications for composite materials, nickel alloys, titanium alloys, etc. However, there is a dearth of information regarding EDM of the Nimonic C263 alloy [1,3,12,29]. Despite its importance in the aerospace and automotive industries, the Nimonic C263 alloy presents a machining problem when utilizing traditional methods due to its poor thermal conductivity value. The Nimonic C263’s machinability in EDM with a variety of electrodes is hence of paramount importance. Again, there is a lack of research on topics like the circularity of the machined component holes [30,31] and the microstructure of the debris [14,32]. The researchers were inspired to investigate the machinability of Nimonic C263 in EDM with a variety of electrode materials due to the lack of previous work in this area. The MCDM approach orders the various performance indicators from best to worst by computing the VI. A hybrid ANN-GA-based technique is used to further enhance the optimal results of the VIKOR method.
3. VIKOR Model
To obtain the best results from a battery of responses, employ the VIKOR technique [33]. It is recommended to analyze the utility and regret parameters after quantifying the positive-ideal and negative-ideal outcomes by factoring in the importance of each performance indicator and quality loss. The experiment’s utility weight and regret parameters are then used to compute the VIKOR index. The values of the VIKOR index are used to estimate the optimal level factors [34]. As illustrated by Equation (1), the machining problem can be written as a decision matrix.
In the equation, Ki is the ith selection, i = 1, 2... m; yj is the tth selection, t =1, 2, ....., n; and the individual measure of a selection is yij. The numerous elements of the VIKOR approach [34] are described in detail below.
Stage 1:
Here, ,
Equation (2) represents the calculation of the decision-making matrix. Here, R represents the normalized decision matrix, uij represents the normalized value of ith alternative to the jth criterion, m is the number of alternatives and n is the number of criteria.
Stage 2:
To find the positive and negative optimum solutions
The ideal K* that is a set of best values for each criterion and the negative ideal solution K− that is a set of worst values for each criterion are calculated by Equations (3) and (4), as mentioned below.
where ,
Here, K* is the ideal solution, which is a set of best values for each criterion, fij is the value of the ith criterion with respect to the jth criterion, represents the maximum value of fij for criteria in the set of J and represents the minimum value of fij for criteria in the set of .
Stage 3:
The utility outcome (Oi) and the loss outcome (Li) are calculated by the following Equations (5) and (6):
where Oi and Li represent the utility outcome and loss outcome for the ith alternative, fj* represents the best value for the jth criterion, fj− represents the worst value for the jth criterion and wj represents the weight of jth criterion.
Stage 4:
Calculation of the VIKOR index: the VIKOR index is calculated by following Equation (7):
Here, represents the VIKOR index, balances the weight between utility and loss measures, and Q* and O− represent the best and worst values of the utility measures. A low VIKOR score indicates a superior alternate solution.
4. Materials and Methods
4.1. Experimental Planning
The experimental setup for this study involves configuring the EDM machine to align with the workpiece and tool electrode specifications. The MRR, debris weight, SEC, SR, circularity, and EWR of the Nimonic C263 superalloy are all evaluated experimentally [6,11]. The plate of the Nimonic C263 superalloy utilized in the experiment has dimensions of (100 × 100 × 5) mm3. The low conductive workpiece has the following physical properties: density = 8360 kg/m3, specific heat = 461 J/kgK, Poisson’s ratio = 0.8, and conductivity = 11.2 W/mK. Tungsten, copper–tungsten, and copper are selected as electrode materials because of their many uses. The diameter of the electrodes is 10 mm, and their length is 150 mm. Table 1 lists the working ranges and maximum values for the parameters employed in this study. The electrode material is numbered 1 for tungsten, 2 for copper-tungsten, and 3 for copper. The die-sinking ZNC EDM setup (make: Electronica, Pvt., Ltd., Kolkata, India) is used to conduct the experiments. Hydrocarbon-based kerosene oil is used as the dielectric medium for experiments.

Table 1.
Machining parameters and range.
4.2. Methodology
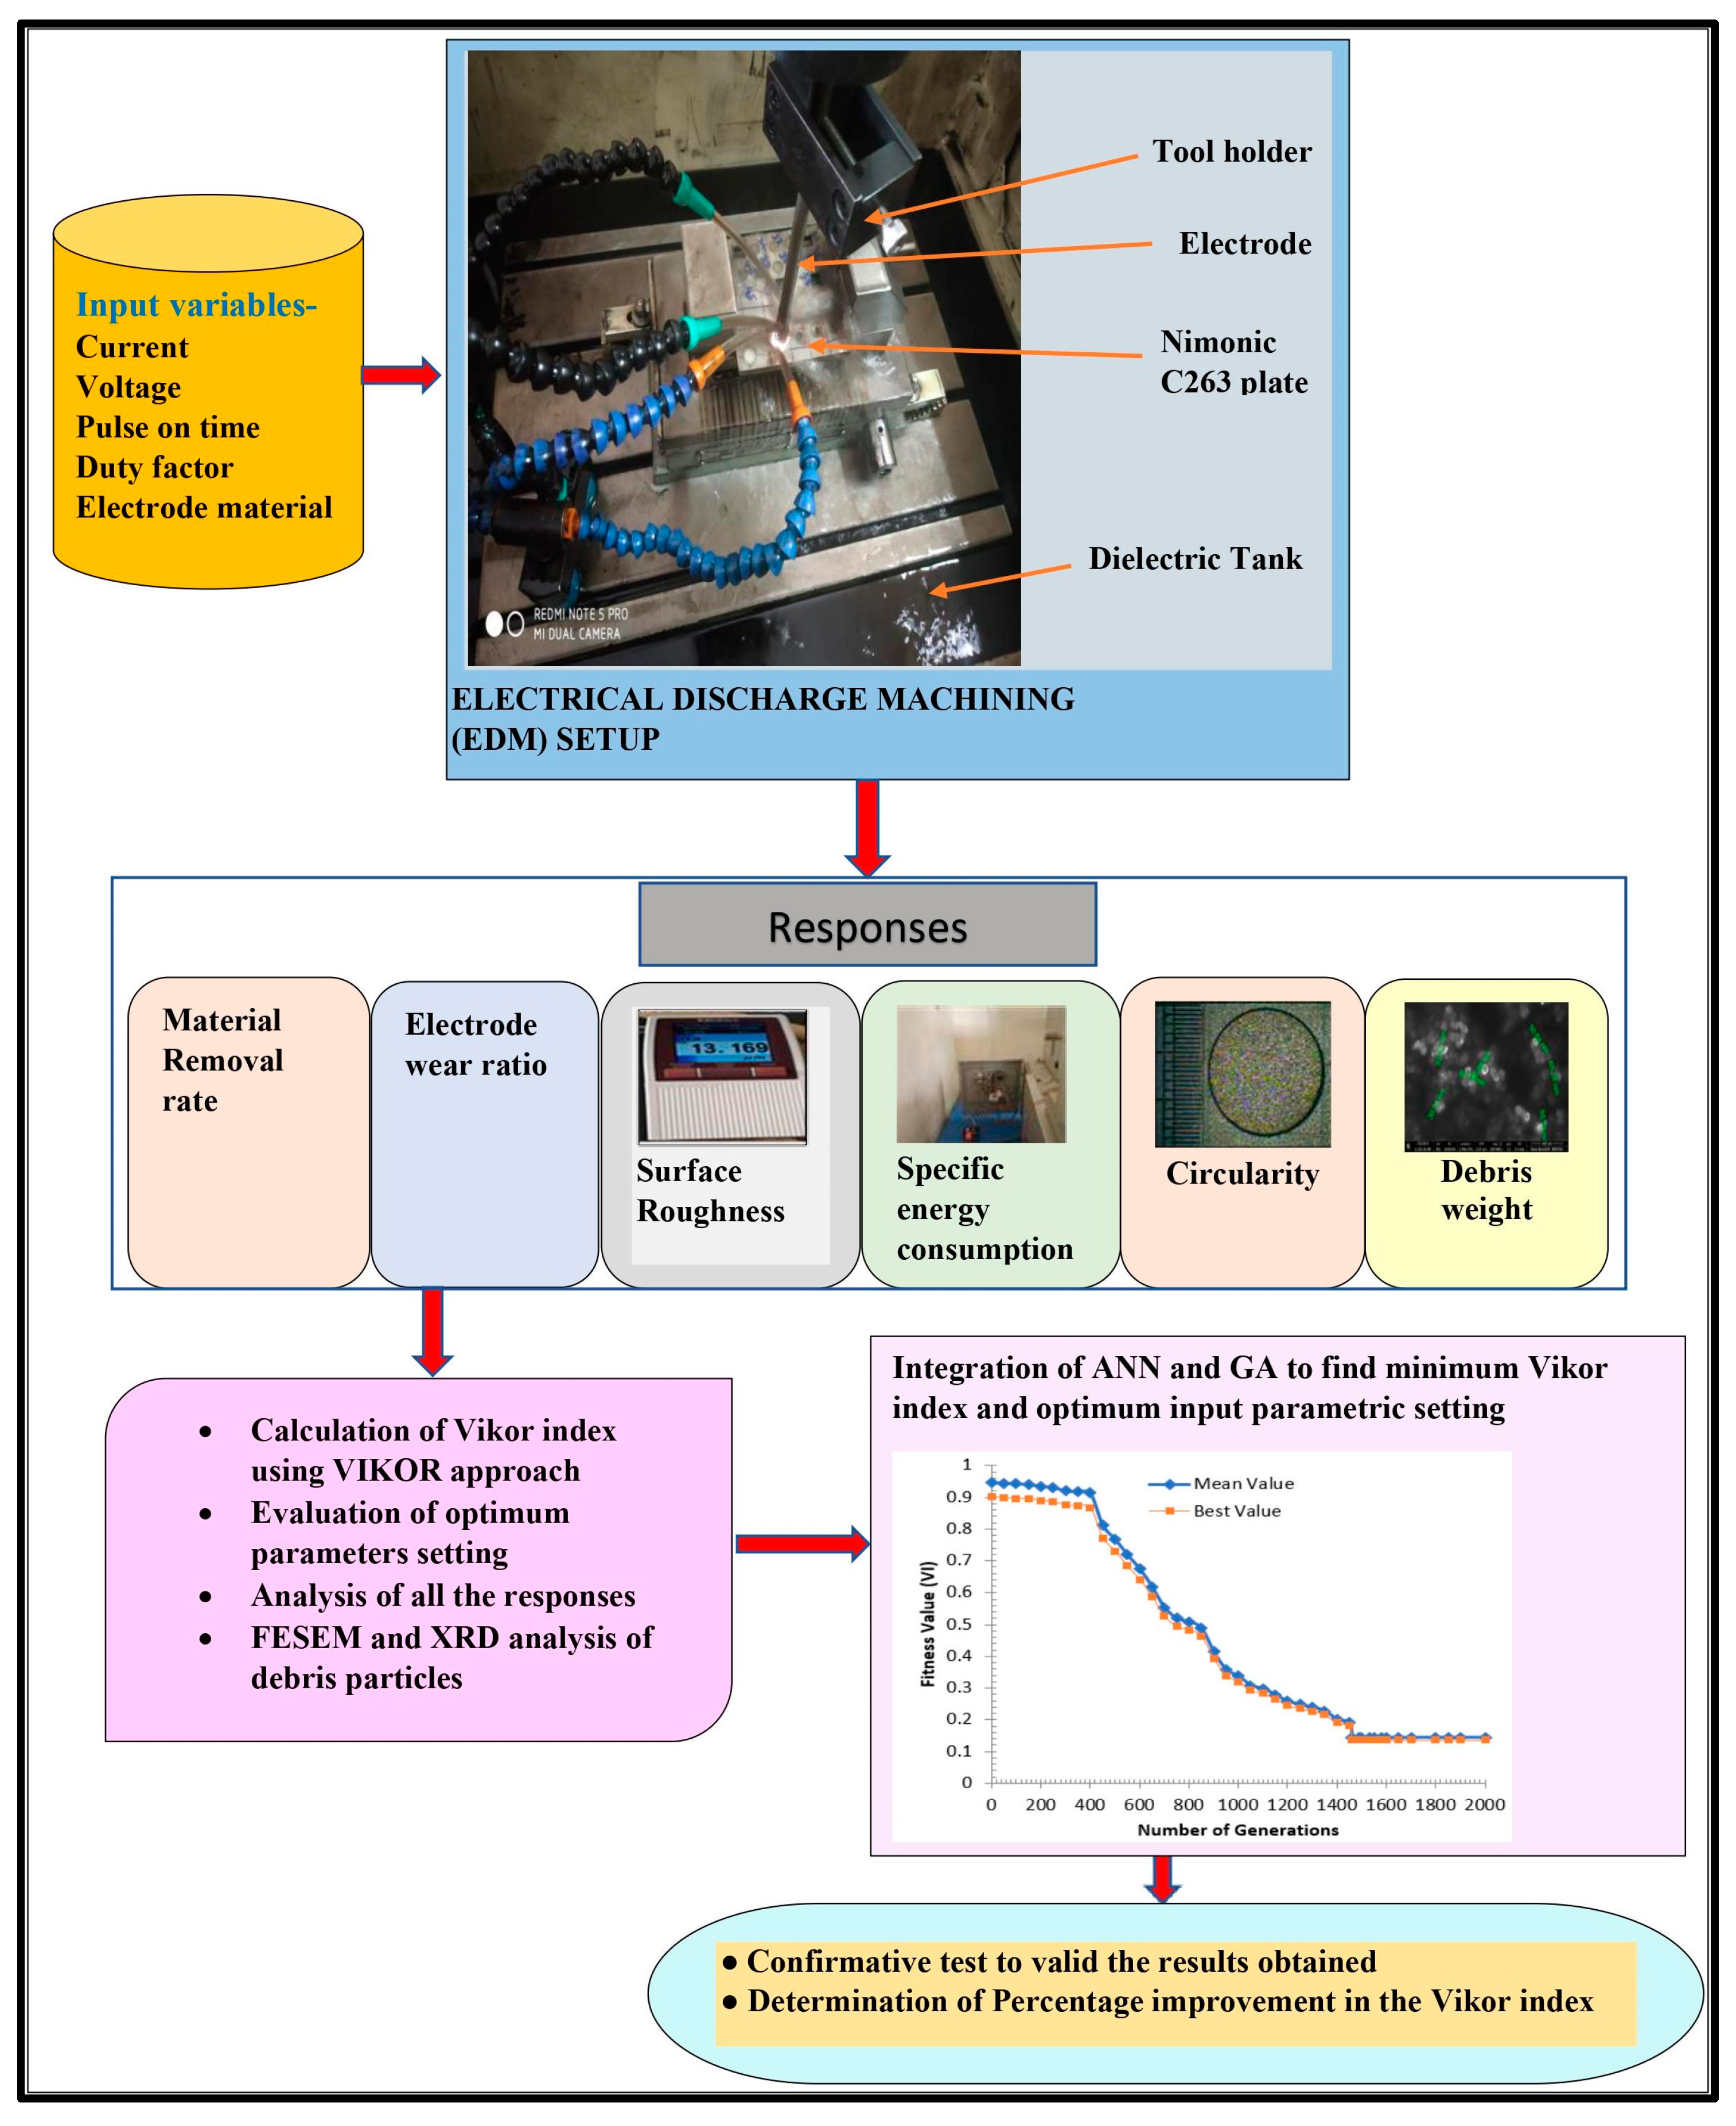
The detailed experimental methodology as well as the equipment proposed are schematically shown in Figure 1. The methodology employed in this research includes several key steps. First, the research objectives are clearly defined to be achieved through the EDM process. Based on a comprehensive literature review, key process parameters such as the current, voltage, pulse on time, duty factor, and electrode material are selected. Experimental data are then collected for various performance metrics, including the MRR, EWR, SR, SEC, circularity, and debris weight.
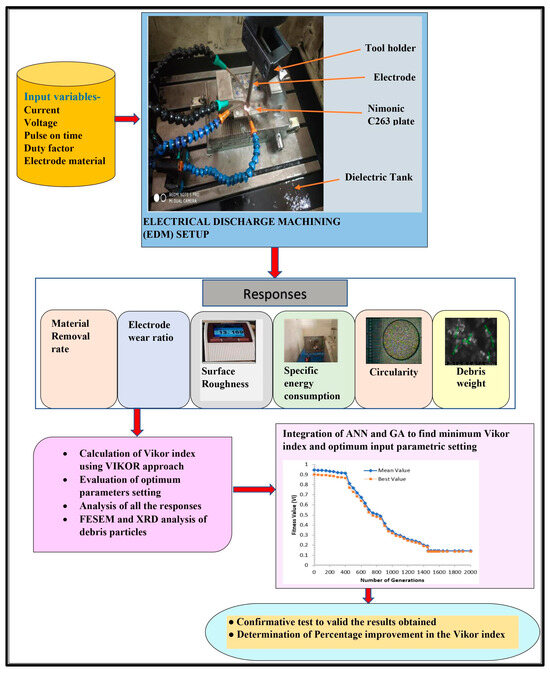
Figure 1.
The methodology employed in the current work.
Upon gathering experimental data, a multi-criteria decision-making approach, specifically the VIKOR method, is employed to determine the optimal parameter settings. This method provides a systematic way to weigh and rank the different performance measures and their corresponding parameter combinations. The acquired experimental data undergo rigorous analysis to comprehend the individual effects of each parameter on the machining performance and to discern any trends or interactions among the variables. To further optimize the parameters, an integrated approach utilizing artificial neural networks (ANNs) and genetic algorithms (GAs) is implemented to minimize the VIKOR index value and ascertain the optimum parameter levels. The experimental setup and procedures adhere to industry standards for EDM processes, ensuring the validity and reliability of the results. Finally, a confirmatory test is conducted using the identified optimum parameter settings to validate the research findings and ensure the robustness of the selected parameters for the EDM process.
4.3. Measurement of Output Responses
4.3.1. MRR and EWR
The workpiece and electrode weights are quantified using precision weighing equipment (precise to 0.01 g) before and after machining. The MRR and TWR values are calculated using Equations (8) and (9). Finally, Equation (10) is used to calculate an approximate EWR.
4.3.2. Surface Roughness (SR)
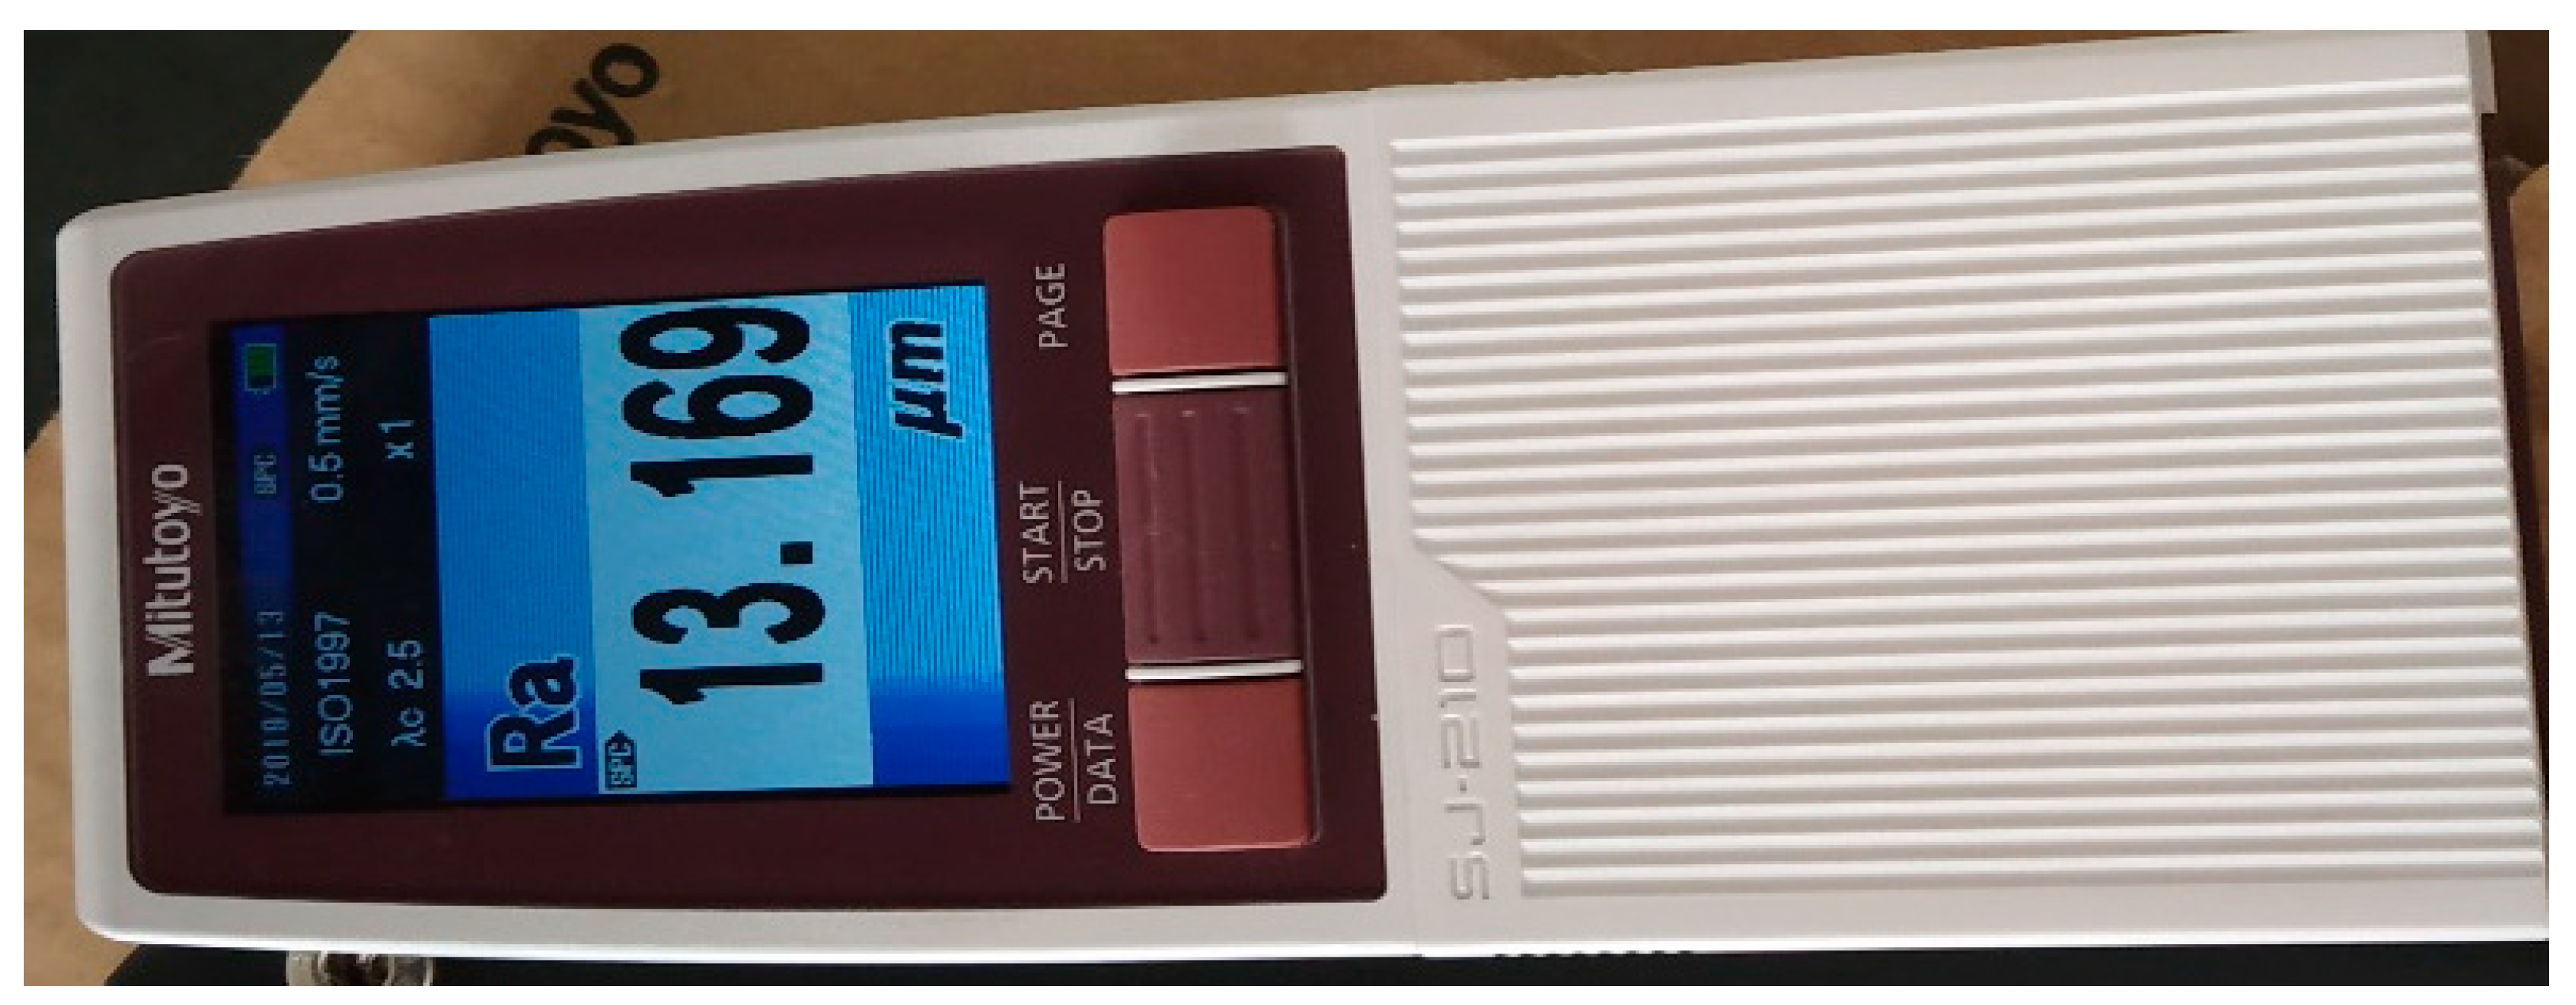
The roughness of the surface to be machined is measured using a Mitutoyo Surftest SJ-210, as shown in Figure 2. This is calculated by taking the mean values of five data measured at different spots on the machined surface for each parameter.

Figure 2.
Mitutoyo Surftest SJ-210.
4.3.3. Circularity (C)
The circularity is measured using a coordinate-measuring machine (CMM) equipped with CALYPSO 2016 measuring software. The CMM moves the probe to each of the eight locations around the hole, making contact with the surface and recording the position data. At each contact point, the software is used to measure the deviation of the actual hole diameter from the nominal diameter, capturing both the radial and the angular deviations. CALYPSO is used to analyze the collected data to determine the circularity of the hole. The circular deviation values obtained from the eight probe contact points are used to calculate the circularity value [30].
4.3.4. Debris Weight (db)
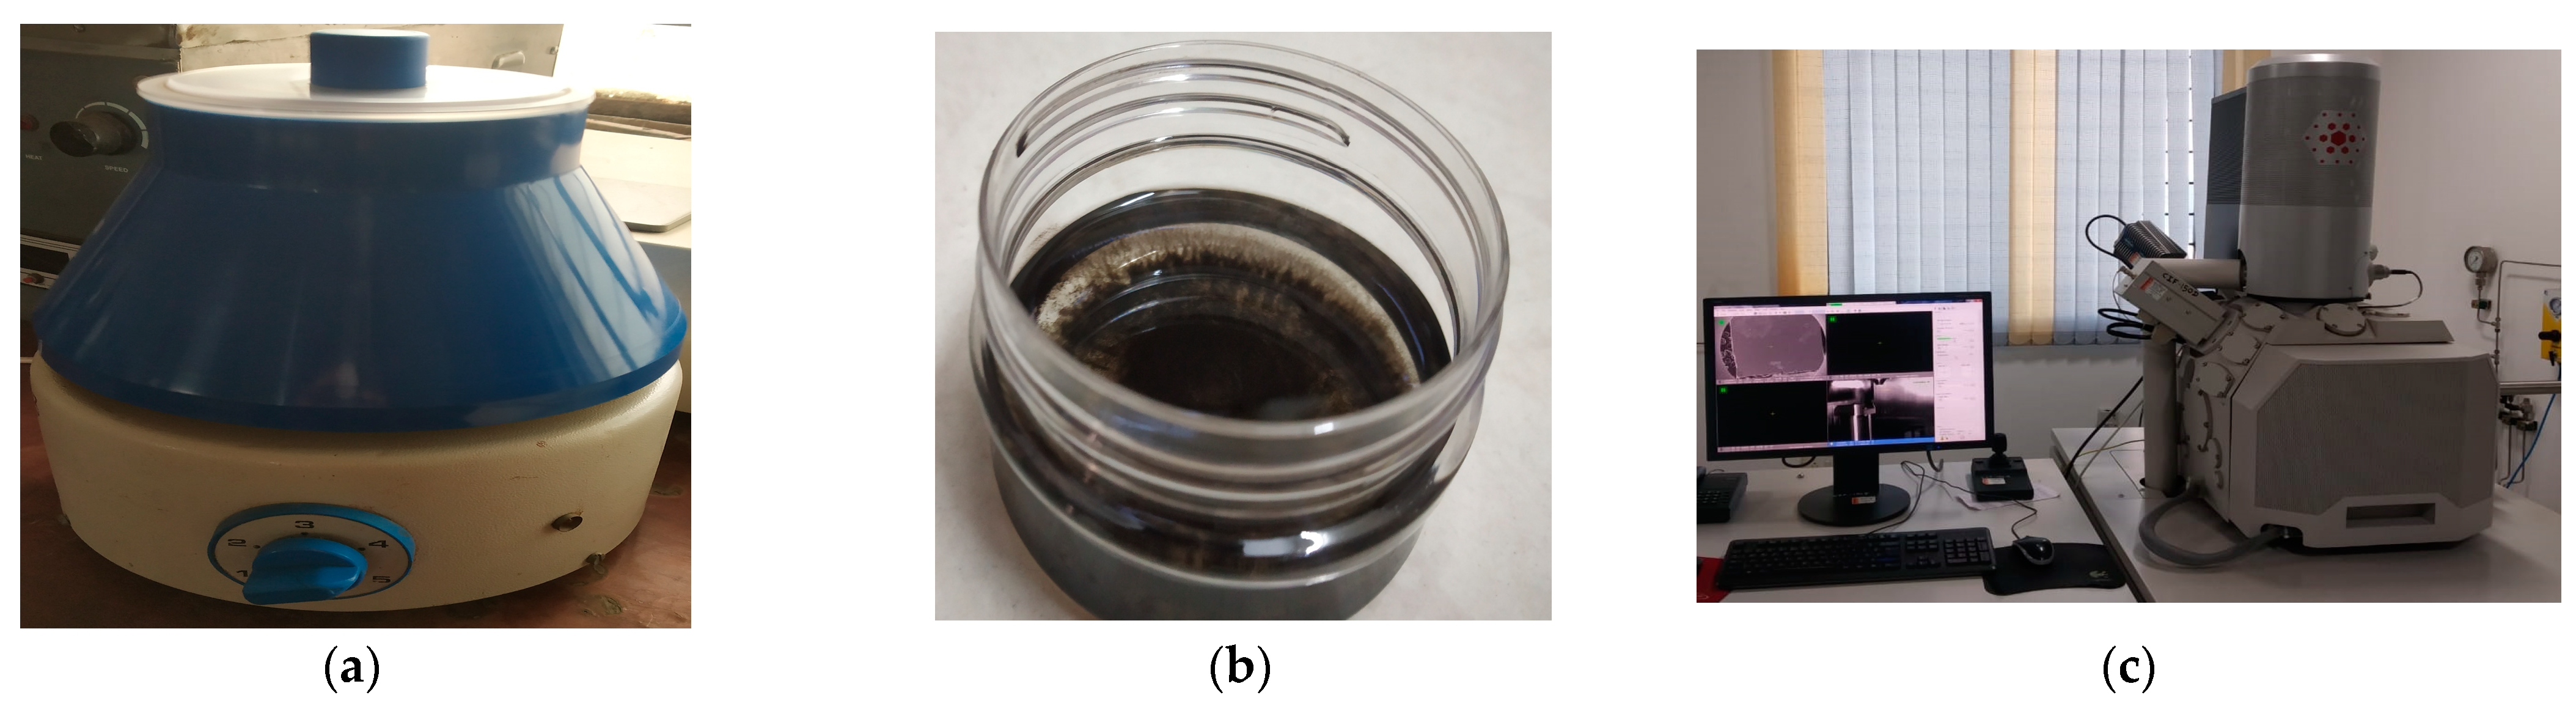
After each trial run, the debris is gathered for disposal. To emulsify and extract the oil, the debris is centrifuged twice, once without the acetone and once with it [14,32]. The time spent on the centrifugation process is 60 min. The debris is centrifuged and then dried, and its mass is measured using 0.1 mg accuracy weighing equipment before being imaged. The debris particles’ size and shape are defined via microscopic analysis. Figure 3a presents the centrifugal machining setup; Figure 3b shows the collected debris; and Figure 3c shows the FESEM machining setup used to analyze the debris collected.
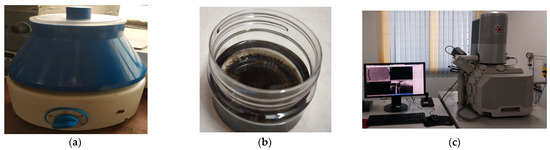
Figure 3.
(a) Centrifugal machining setup, (b) debris collected during machining, and (c) FESEM setup.
4.3.5. Specific Energy Consumption (SEC)
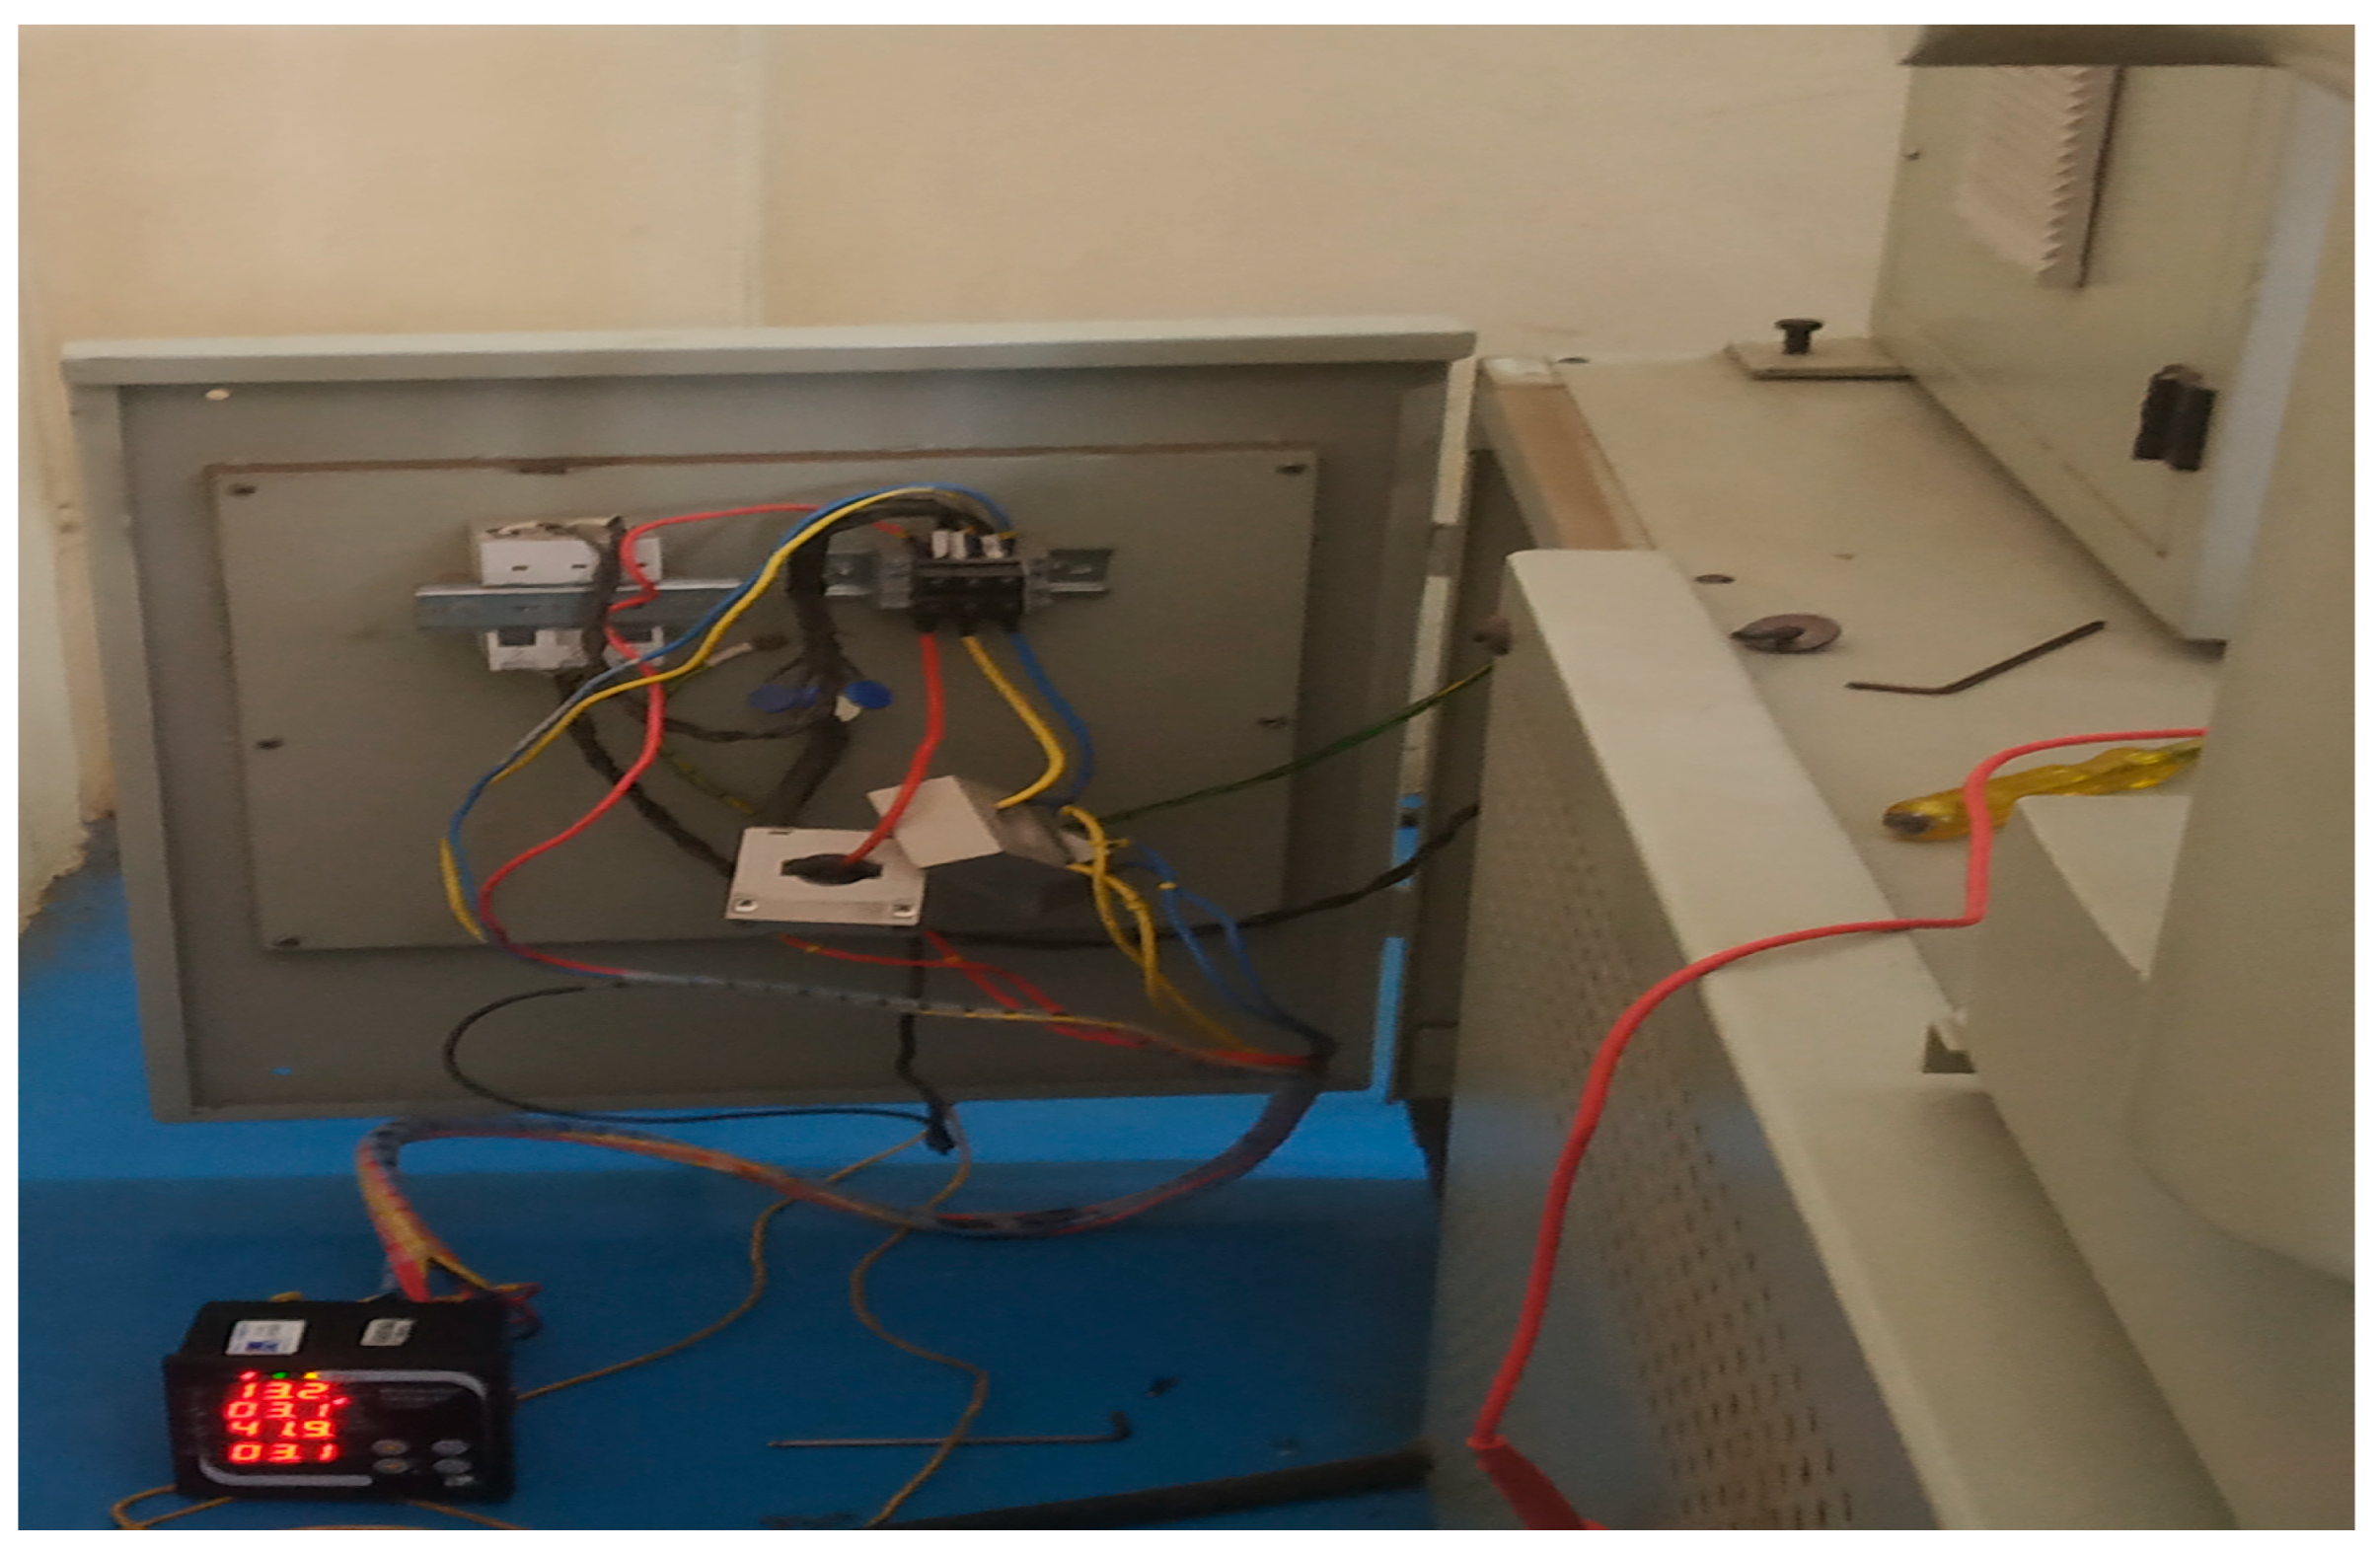
The EDM machine operates on a three-phase power supply setup to power its machining functions. To monitor the energy usage during machining, three voltage wires are linked to the input terminal of the three-phase arrangement. These wires are carefully connected with the appropriate orientation to the electric wires, depending on their designated wiring number, and secured with clamp sensors. The energy consumed during EDM operations is then measured using a Multimeter Model CPEM-07, as depicted in Figure 4. Once all the wires are precisely connected to the machine, the instrument is activated, and the function switch of the Multimeter CPEM-07 is set to indicate energy consumption in Watts (W). During each experiment, the energy consumption is monitored for a period of 5 min to assess the energy fluctuations within this timeframe. Subsequently, the average of all the recorded values is computed. Following established methodologies outlined in the previous literature [11,12,13,35], the specific energy consumption (SEC) is determined using Equation (11).
and
where E = power utilized (joules, J), I = current (amperes, A), U = voltage (volts, V), and Ton = pulse on-time (μs), and MRR, or material removal rate, is the volume of material removed in a given amount of time, and it was calculated in Section 4.3.1.

Figure 4.
Energy meter setup.
5. Results and Discussion
The Taguchi experimental model is used to conduct the experiments and find out the effects of the specified input factors on the output variables of interest (MRR, SR, EWR, C, db, and SEC) in the machining process. The analysis requires 27 separate experimental runs. Table 2 shows the results of the applied VIKOR approach, where experiment no. 10 obtains the lowest VIKOR index value, which is highlighted in the table.
Table 2.
Experimental table of results with the VI.
To assess how the crucial input variables influenced the overall response output, an ANOVA model is implemented. R2 and Adj-R2 values above 90% are considered adequate, indicating that the answers are reliable. Table 3 details the ANOVA model used to determine the MRR. With a contribution of 82.76%, the electrode material type is found to be the highly dominant parameter for the MRR, followed by the current (6.59%) and voltage (2.94%). Table 4 depicts the ANOVA for the EWR. It shows that the most influential factor for the EWR is the current and electrode material, having contributions of 51.49% and 29.85%. The ANOVA results for the SR are depicted in Table 5, where the current and electrode material contribute 55.81% and 29.68%, respectively, to the overall effect. Table 6 depicts the ANOVA for the circularity. It shows that the most influential factors for the circularity are the current and electrode material, having contributions of 53.01% and 31.92%. The weight of the debris is significantly affected by the current and electrode material, which account for 56.42% and 29.72%, respectively, as depicted in Table 7. For the SEC, as shown in Table 8, the two most important factors are the pulse duration and the electrode material, each contributing 37.89% and 38.53%, respectively. Table 9 details the ANOVA model used to calculate the VIKOR index.
Table 3.
ANOVA for the MRR.
Table 4.
ANOVA for the EWR.
Table 5.
ANOVA for the SR.
Table 6.
ANOVA for the circularity.
Table 7.
ANOVA for the debris weight.
Table 8.
ANOVA for the SEC.
Table 9.
ANOVA for VIKOR index.
5.1. Analysis of MRR
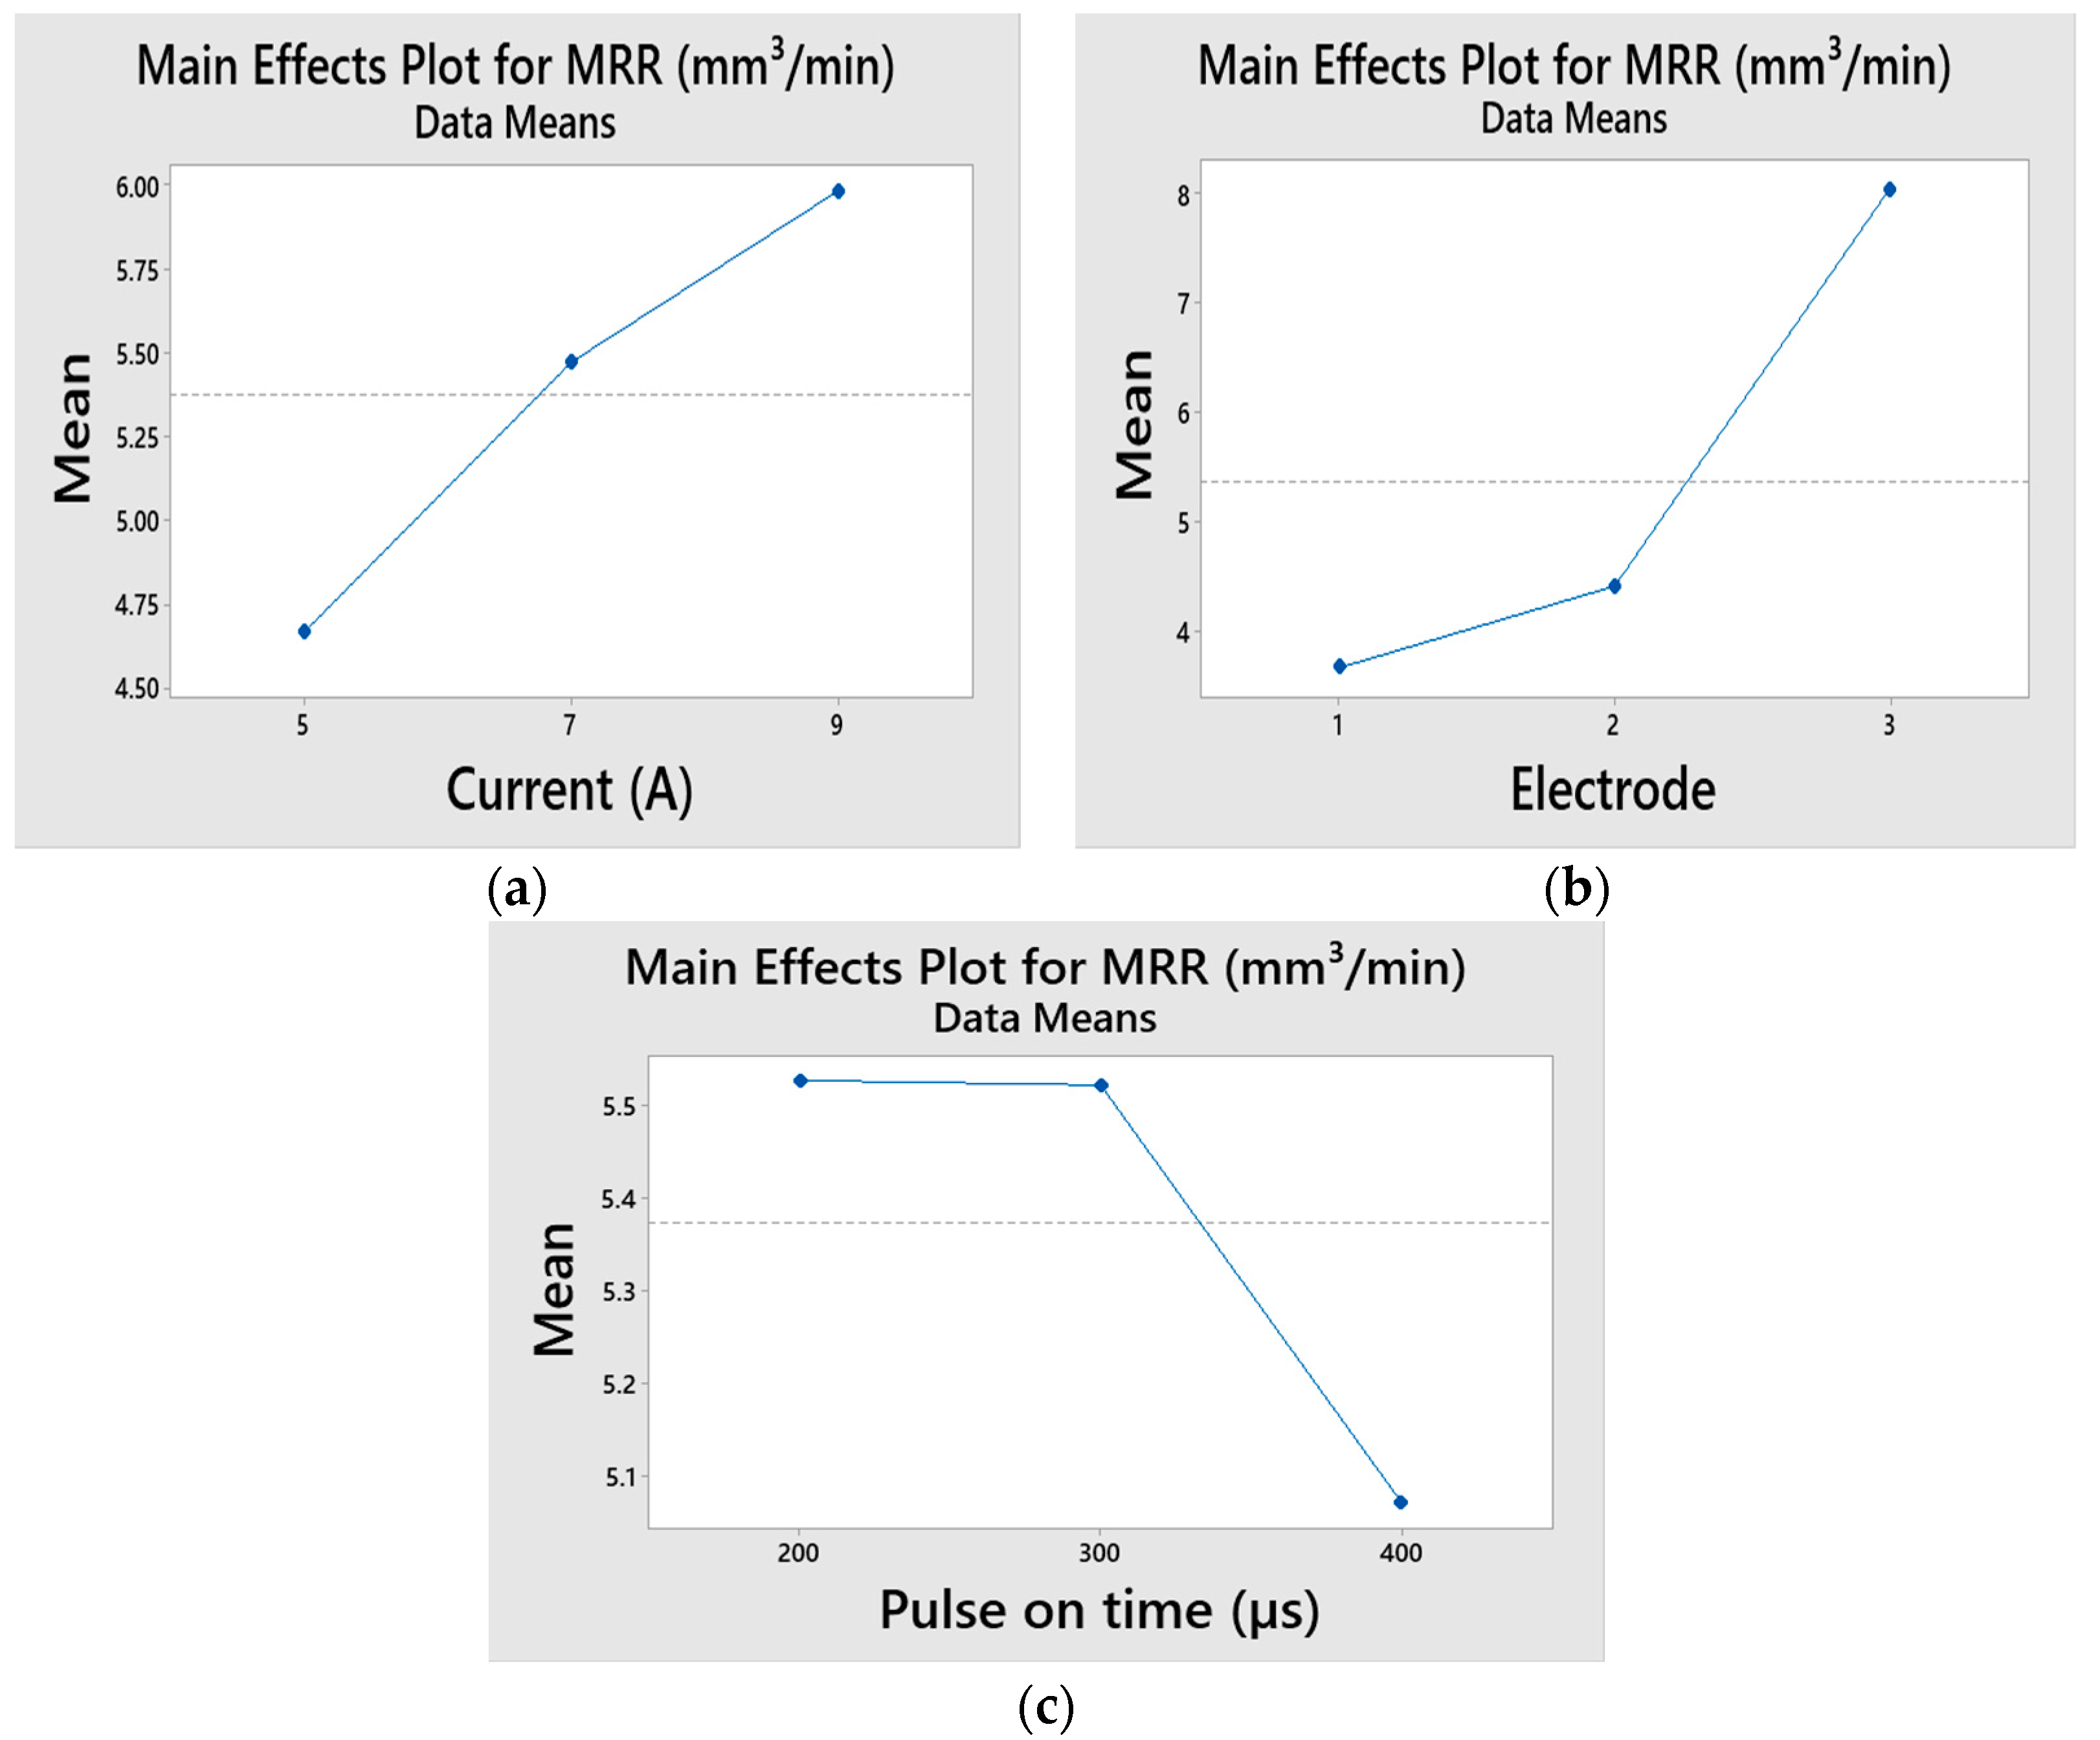
Figure 5a demonstrates how the current affects the MRR. It shows that when the current values rise, so does the MRR. When the current is raised, the spark energy is amplified, leading to the formation of craters with larger dimensions and a consequently higher MRR. As can be seen in Figure 5b, compared to the other two electrodes, the copper electrode’s MRR is higher. Copper has good thermal conductivity and heat dissipation properties. This helps in dissipating the heat generated during the EDM process more effectively, preventing excessive heat buildup at the electrode–workpiece interface. As a result, the thermal stresses and distortion in the workpiece are minimized, allowing for more stable machining conditions and a higher MRR. The tungsten electrode exhibits a lower material removal rate (MRR) compared to the copper and copper–tungsten electrodes due to its inferior electrical and thermal properties relative to the copper and copper–tungsten electrodes. The pulse duration graph in Figure 5c shows a similar trend, showing the electrodes, pulse duration increases, and MRR value drops. The amount of the molten alloy is unchanged and the MRR drops when the heat flux is applied for a prolonged period during the machining process [12]. As the pulse duration increases, the duration of heat application to the workpiece also increases. This prolonged exposure to heat leads to greater heat accumulation within the workpiece material. While the amount of molten alloy remains unchanged, the prolonged heat application can result in the material experiencing increased thermal stress. This can lead to phenomena such as thermal expansion, micro-crack formation, and material redistribution, which collectively hinder the efficient removal of material and contribute to the observed drop in MRR. Like this, the voltage main effect figure shows that the MRR declines as the voltage rises. This results in an unfavorable concentrated discharge and the lack of cooling of the work alloy [12,36]. Also, the MRR value has grown with the duty factor because of a higher spark energy, as shown by the figure for the MRR.
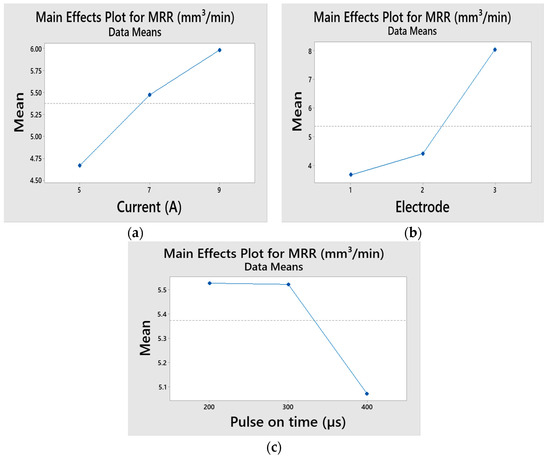
Figure 5.
Main effect graphs for the MRR (a) Effect of Current on MRR (b) Effect of Electrode on MRR (c) Effect of Pulse on time on MRR.
5.2. Analysis of EWR
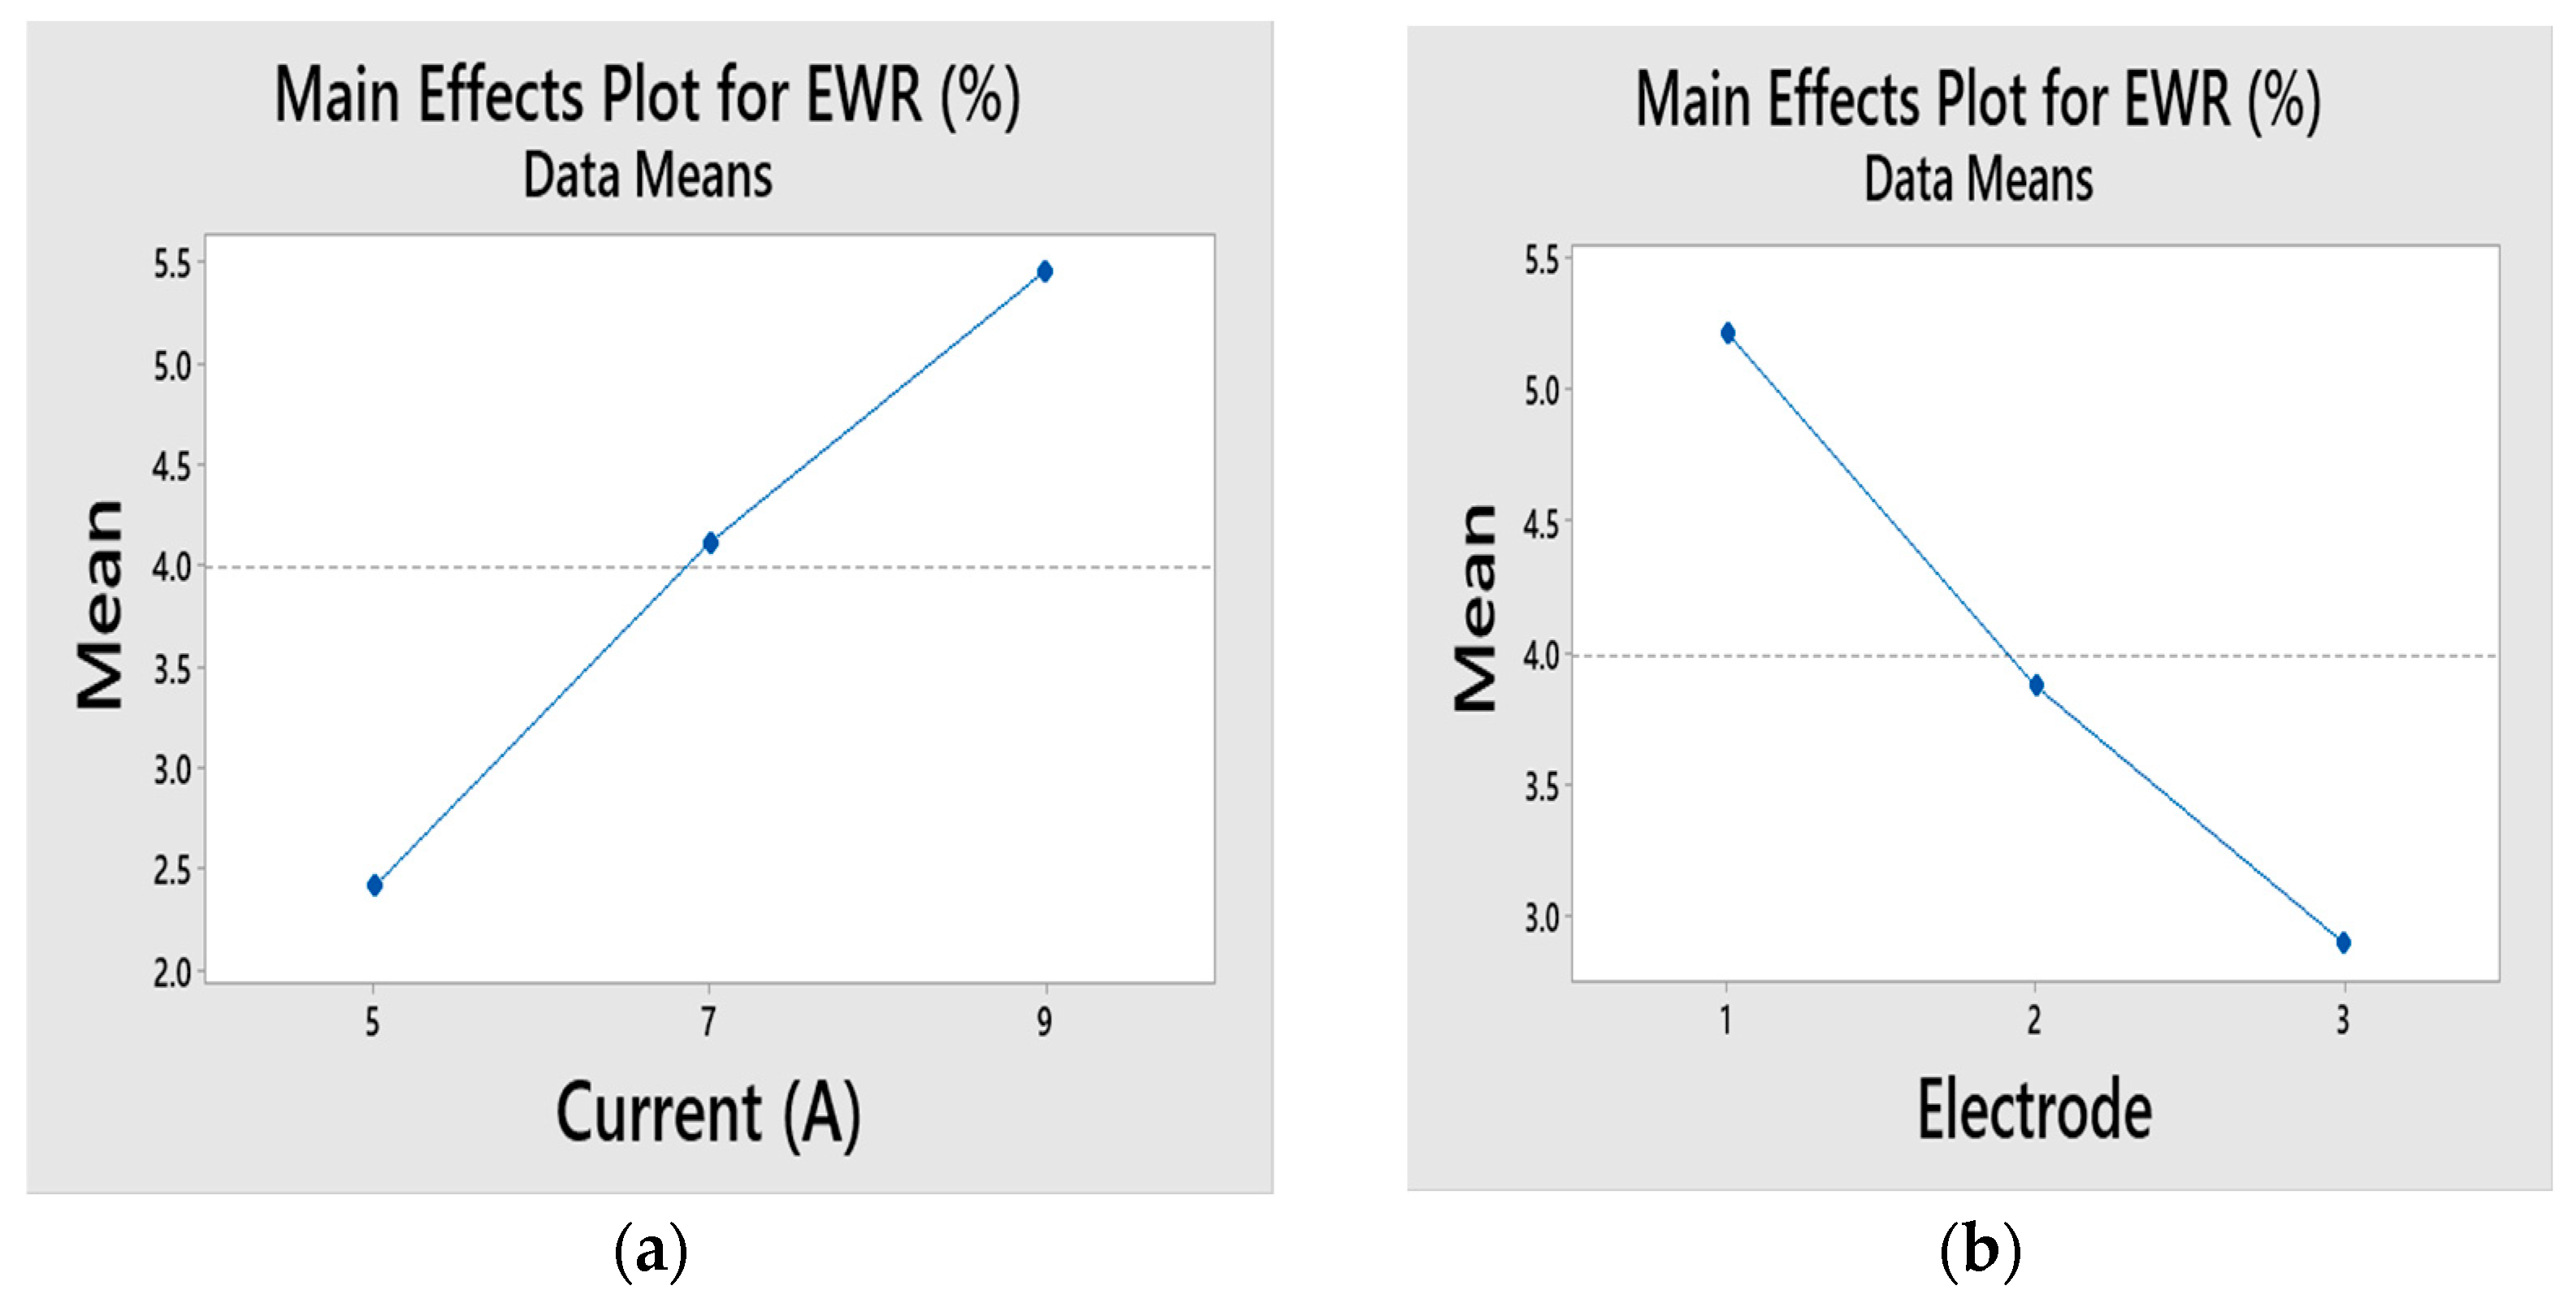
Figure 6a shows the effect plot for the EWR vs. current. The graph shows that when the current rises, the EWR increases. The current surge from the spark causes the electrodes to heat up, which in turn causes them to melt and evaporate. The impact of the electrode type on EWR is depicted in Figure 6b. The plot indicates that the electrode wear rate (EWR) is lower for the copper electrode and higher for the tungsten electrode during the machining of Nimonic C263. The EWR values for the copper–tungsten electrode fall between those of copper and tungsten. This disparity is attributed to the superior thermal conductivity of copper, which minimizes erosion. The rapid heat transfer within the copper electrode, facilitated by its high thermal conductivity, leads to a reduced EWR. Consequently, the erosion of the tungsten electrode outpaces that of the other electrodes due to its lower thermal conductivity compared to the copper and copper–tungsten electrodes.
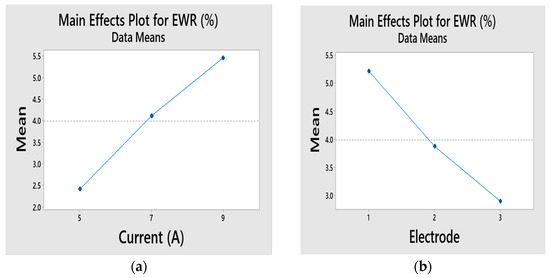
Figure 6.
Main effect graphs for the EWR (a) Effect of Current on EWR (b) Effect of Electrode on EWR.
The EWR plot for the pulse duration reveals a similar trend: an increase in the EWR is seen with longer pulses. The primary effect plot of the EWR vs. voltage similarly reveals that the EWR rises when the voltage is raised. Up to a certain voltage, the EWR decreases as a function of the duty factor.
5.3. Analysis of Surface Roughness (SR)
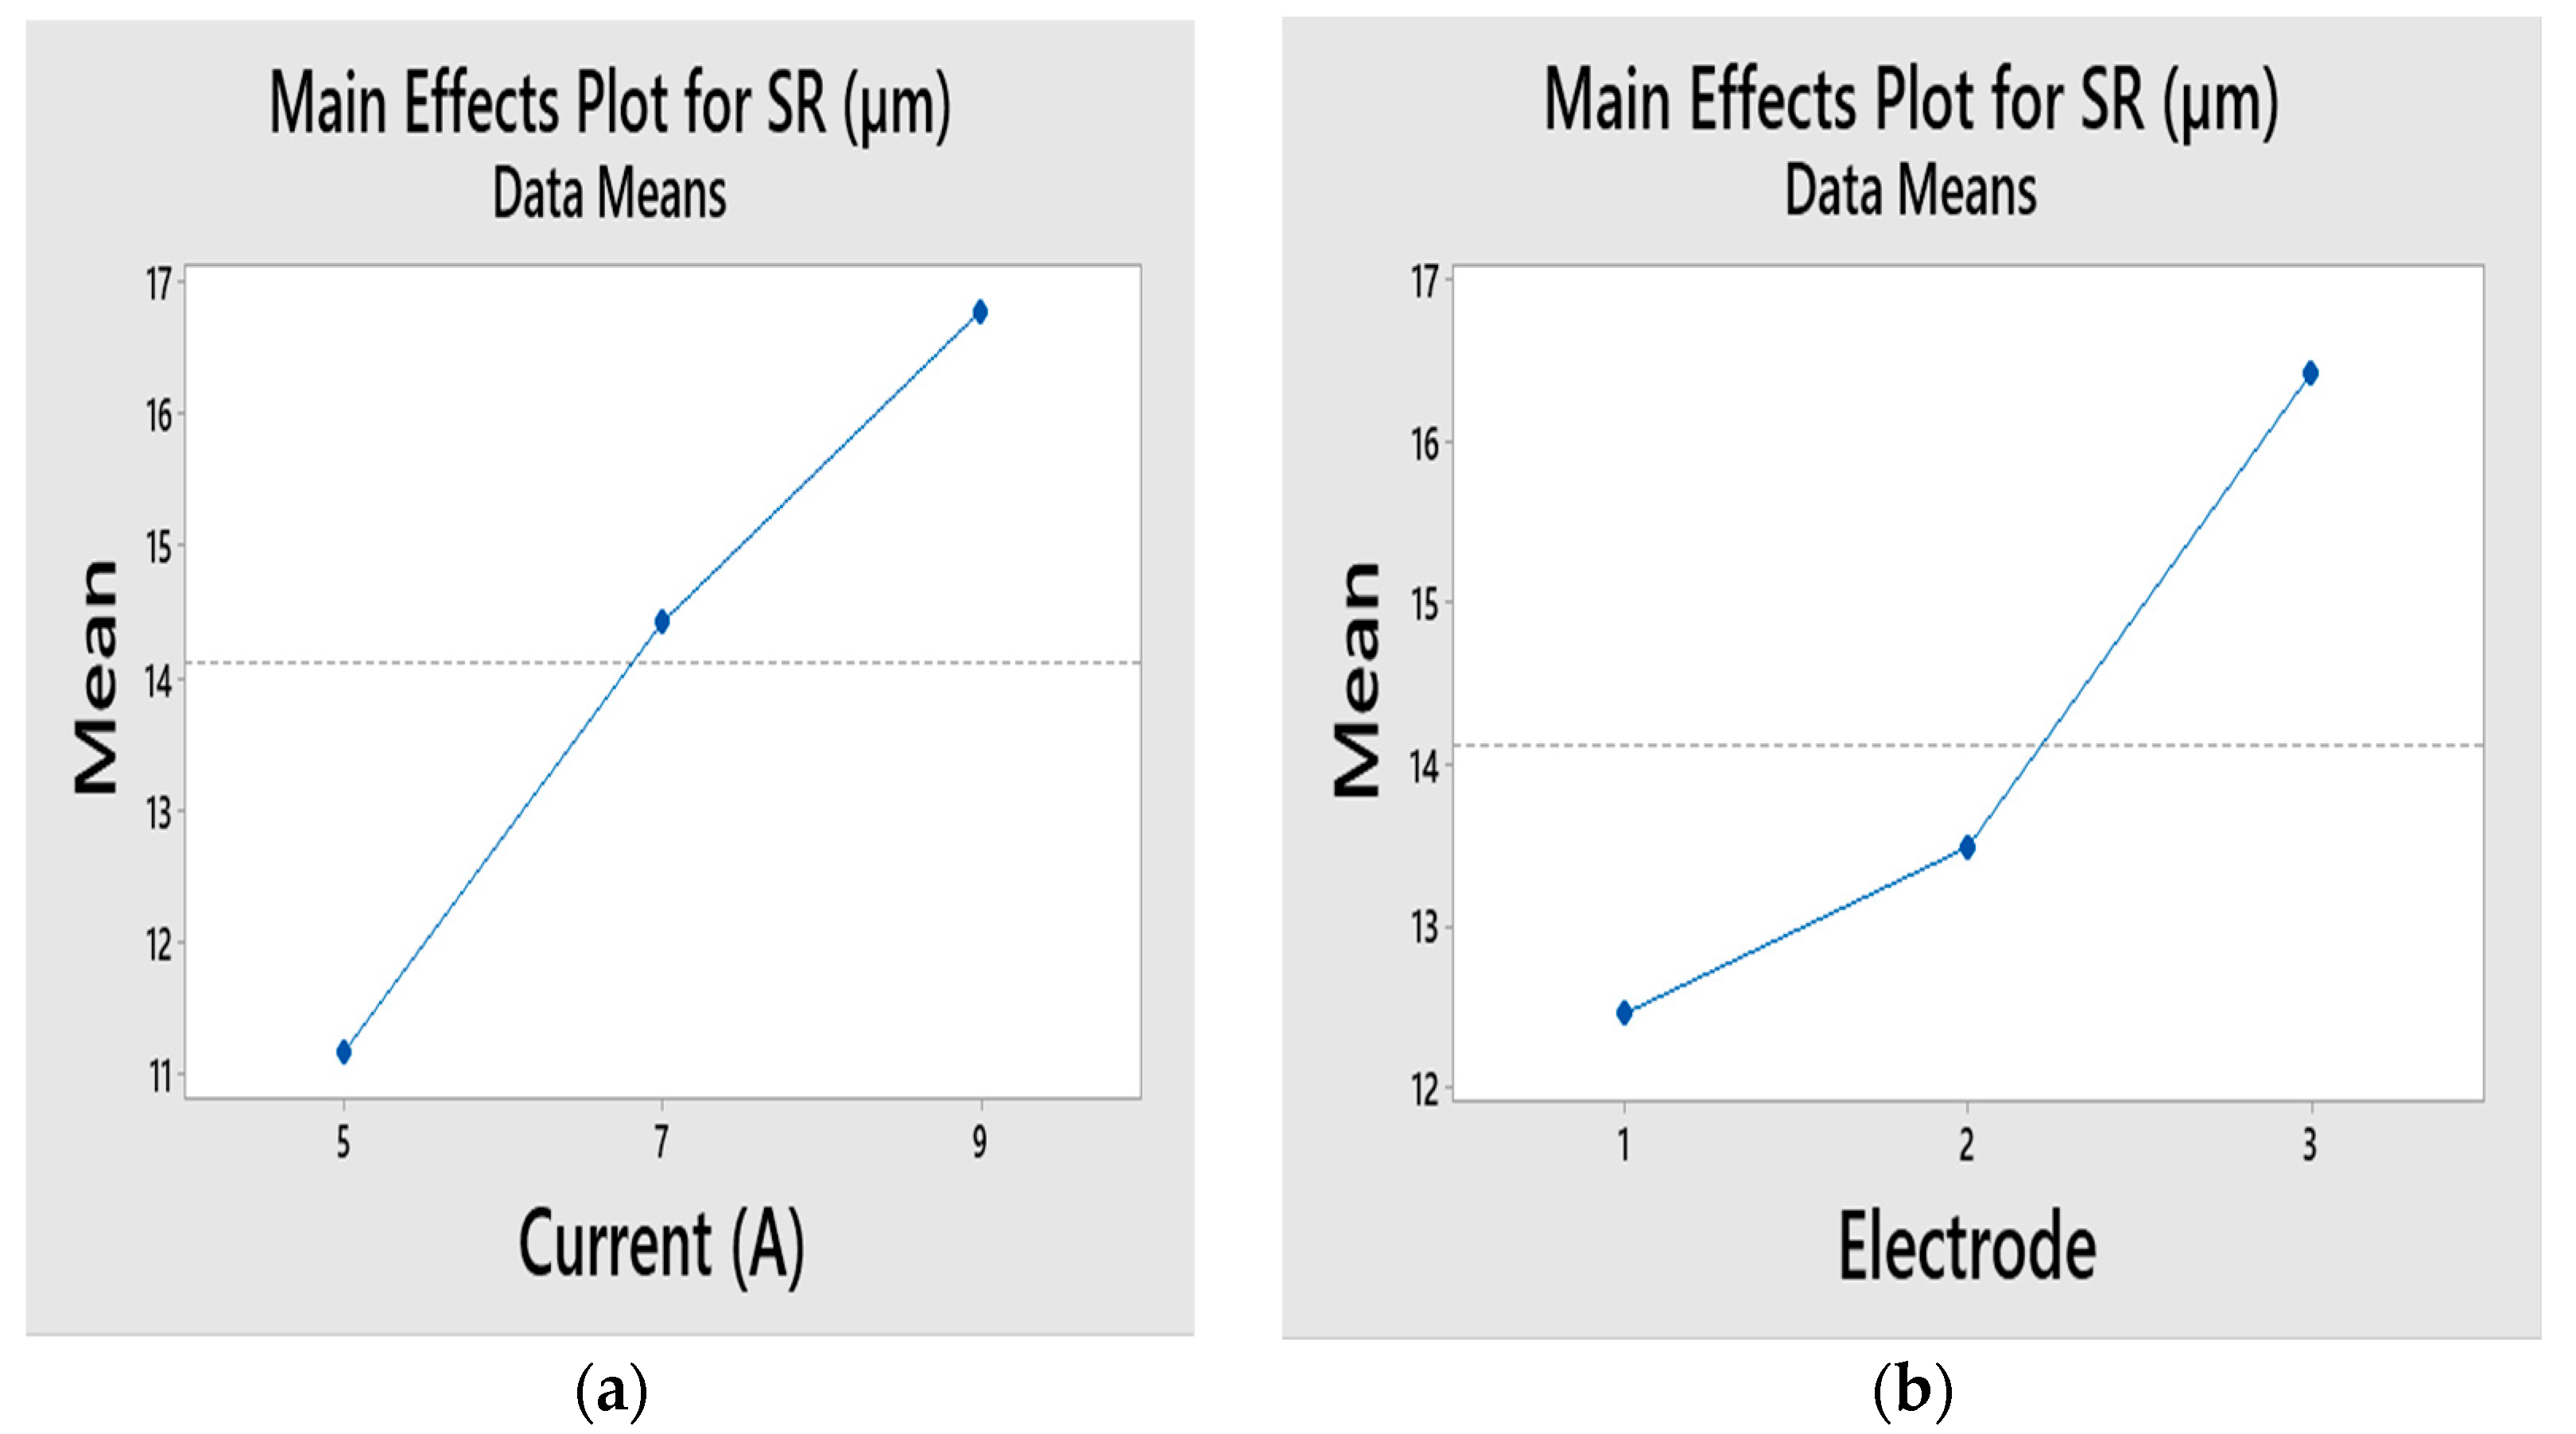
Figure 7a illustrates the effect of the current on the surface roughness. It shows that as the current increases, so does the roughness of the surface. Increasing the discharge energy in this way permits the removal of larger materials from the machined surface. The influence of the electrode type on the surface roughness is depicted in Figure 7b. As the electrical current rises, the spark gains strength, leading to more substantial material removal from the work surface, thereby diminishing the machining quality. As copper electrodes have superior thermal and electrical properties compared to tungsten and copper–tungsten electrodes, the copper electrode produces a higher material removal rate (MRR). Conversely, the tungsten electrodes exhibit a lower MRR than both the copper and copper–tungsten electrodes. With copper electrodes, the higher MRR leads to significant removal of material from the work surface, resulting in increased surface roughness. Tungsten electrodes, requiring lower thermal energy during sparking, facilitate the removal of smaller particles, thereby producing the best surface quality. Machining with copper–tungsten electrodes typically yields an intermediate level of surface quality. As the pulse lengthens, the spark energy grows, and with it, the surface roughness. The surface roughness is barely influenced by the voltage and duty parameters.
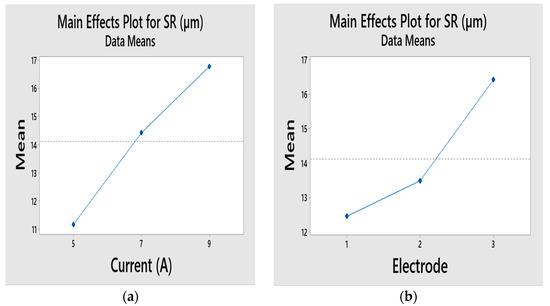
Figure 7.
Main effect graphs for the SR (a) Effect of Current on SR (b) Effect of Electrode on SR.
5.4. Analysis of Circularity (C)
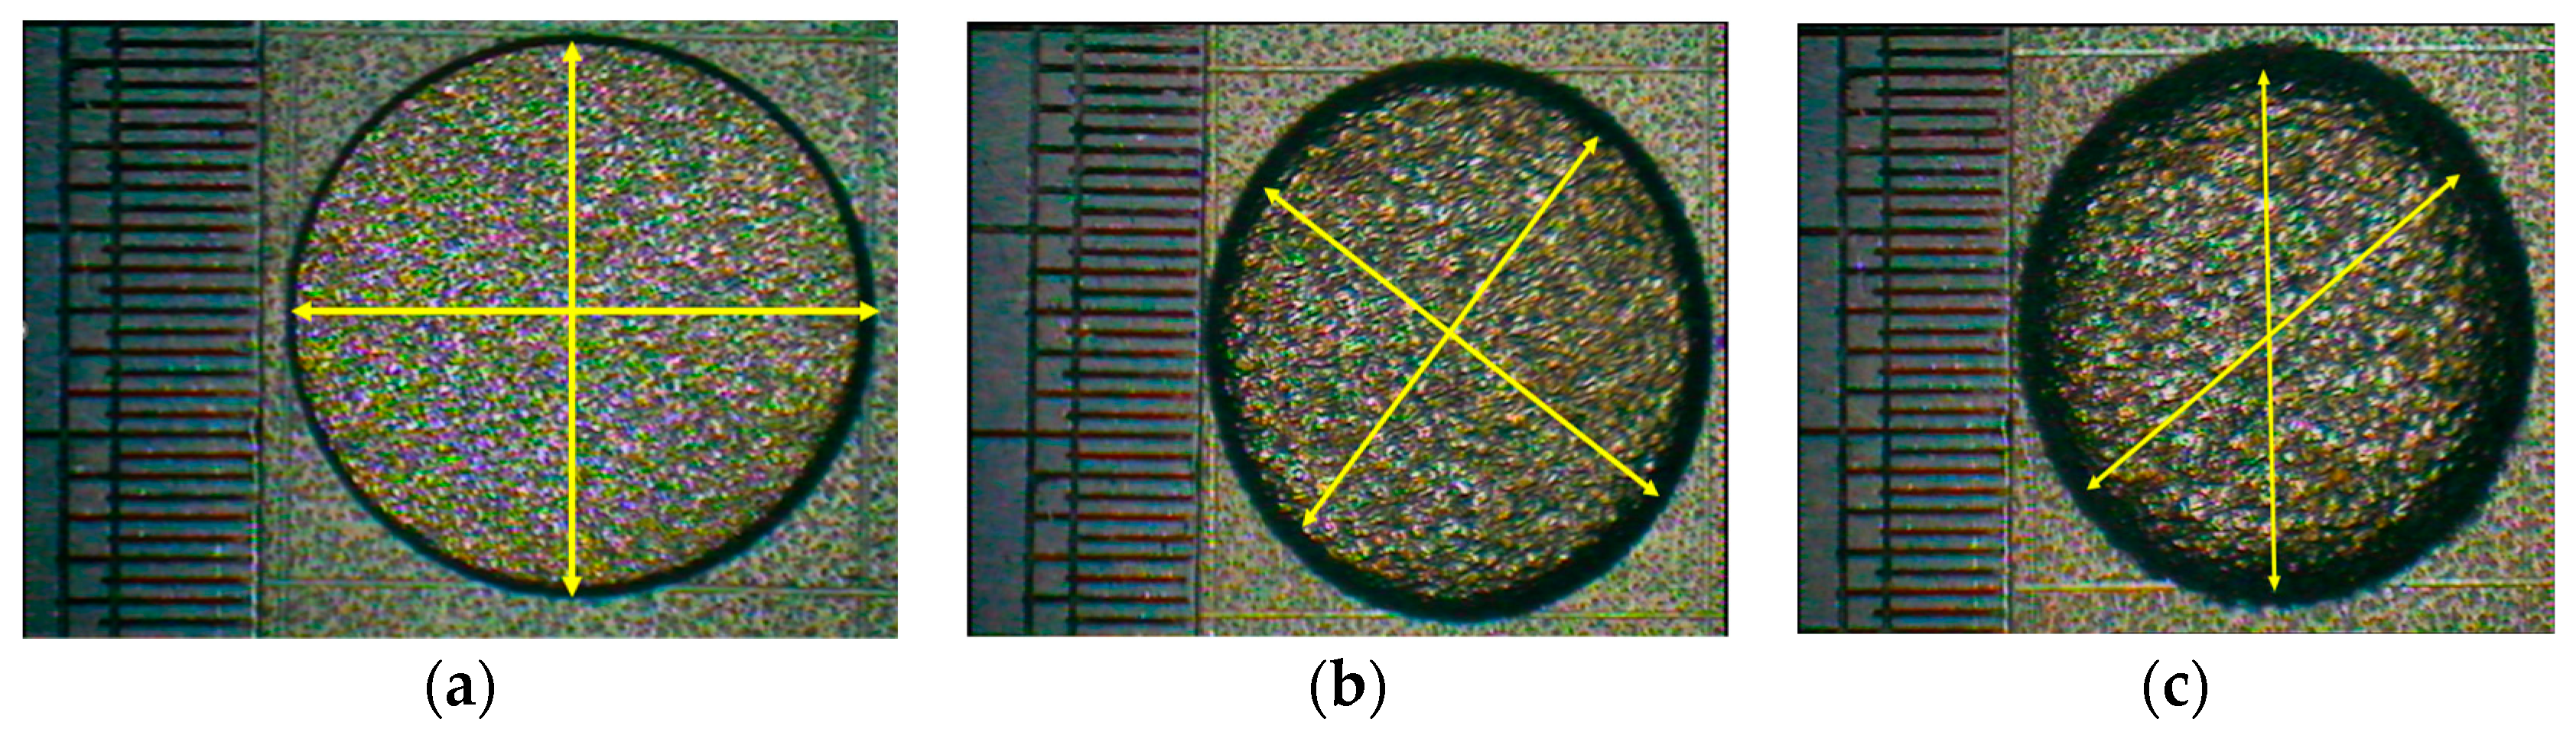
Industries can benefit from circularity because of its lower value. The optical microscope pictures in Figure 8a–c were analyzed to determine the degree of circularity achieved when machining Nimonic C263 using three electrodes. Tungsten electrodes, in contrast to the other two electrodes, can produce a hole that is both perfectly circular and precisely spherical (see Figure 8a). As seen in Figure 8b, there is some variation in the circularity and the damaged surfaces on the edges when the material is machined using a Cu-W electrode. The most noticeable changes in the round edges and larger dented surfaces were produced by the copper electrode (see Figure 8c).
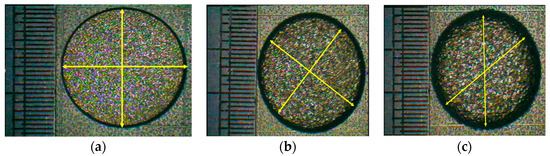
Figure 8.
The circularity of the machined holes produced by (a) tungsten, (b) copper–tungsten, and (c) copper.
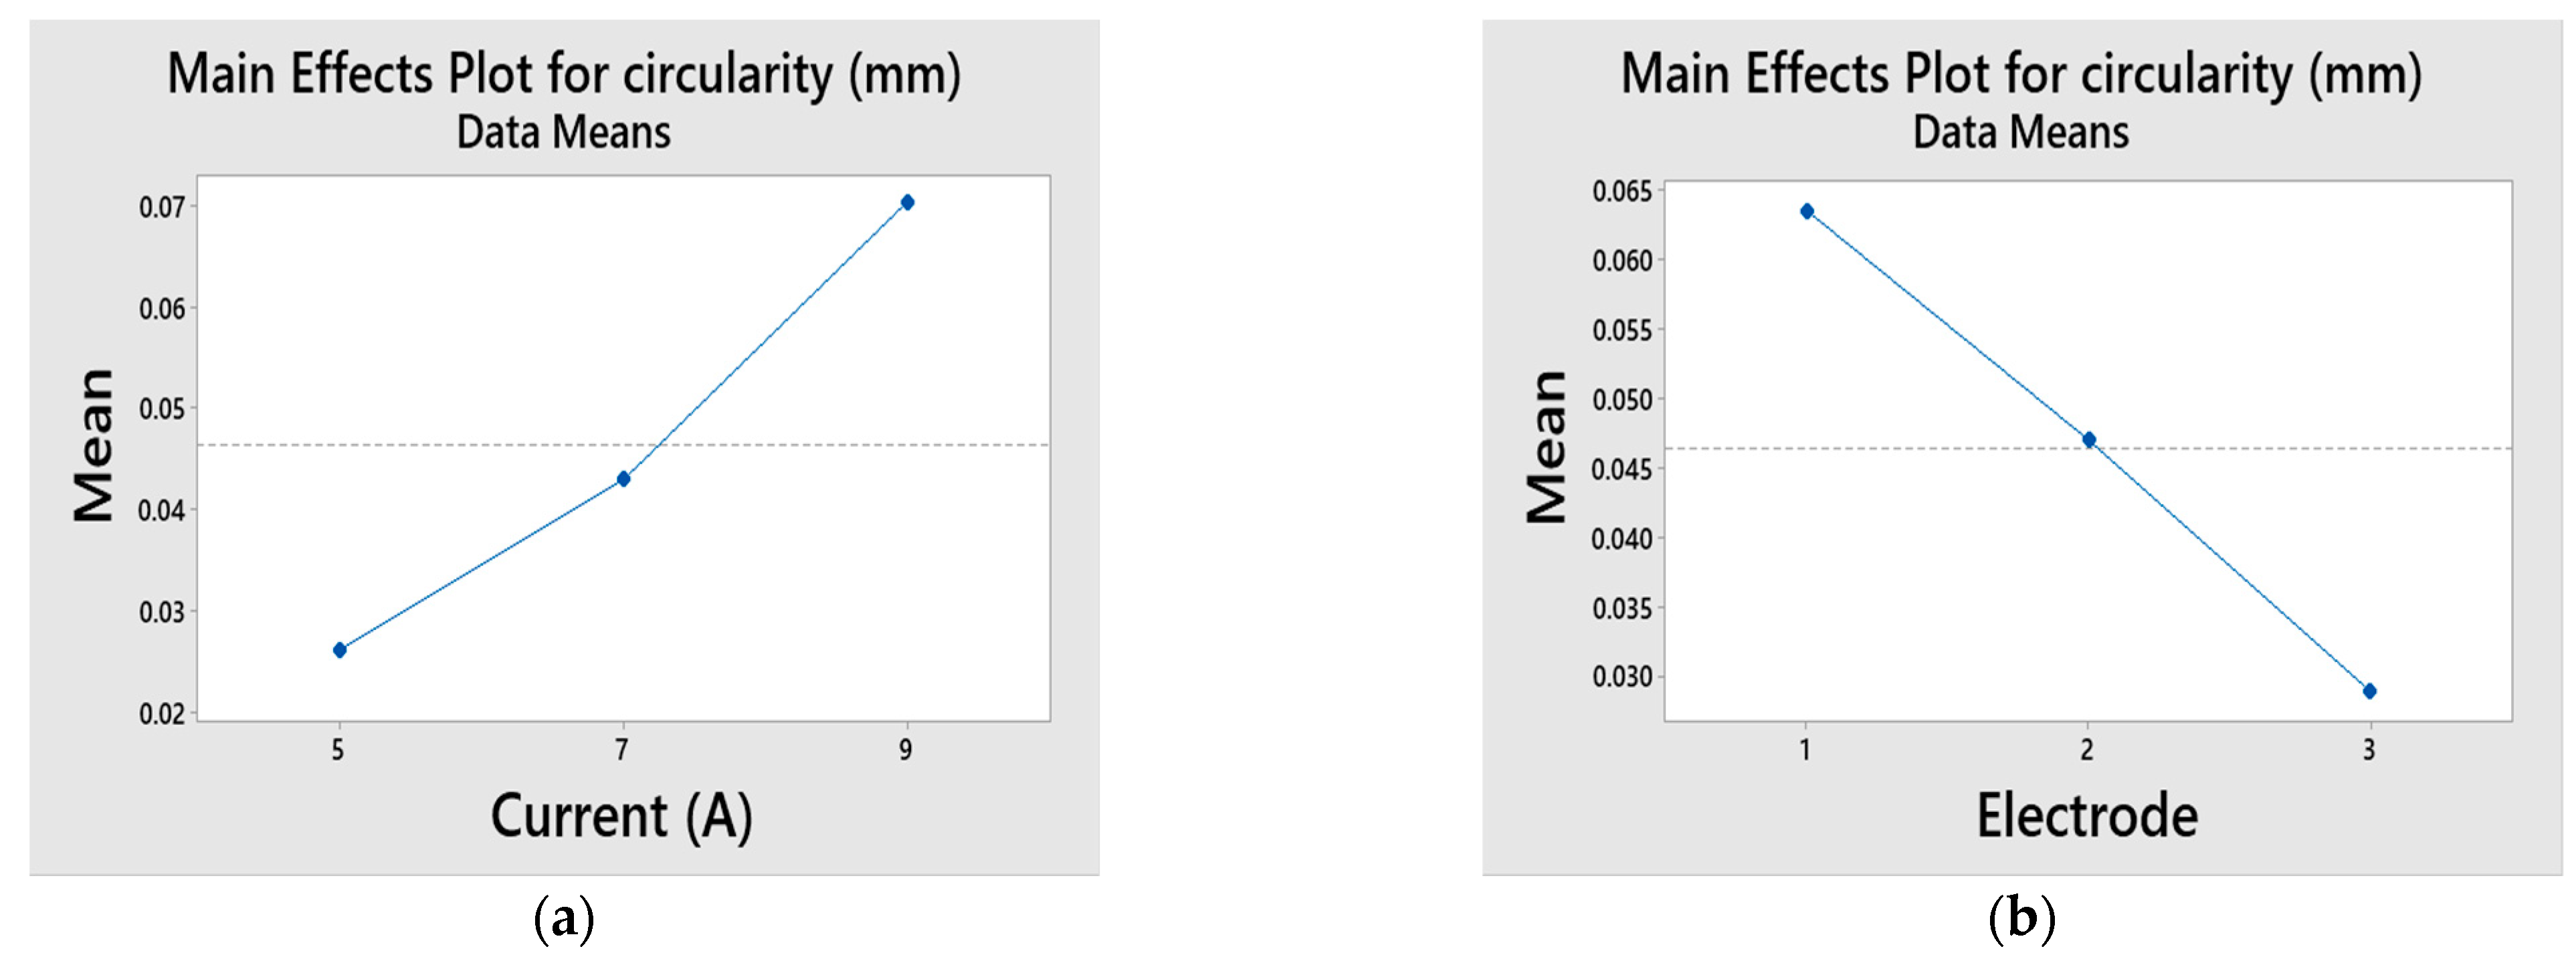
The main effect graphs of the circularity with the current are shown in Figure 9a. The graph becomes more circular as the current increases. Since the spark energy grows in tandem with the pulse duration and current, the circularity likewise grows. This irregular spark raises the MRR and affects the circularity. The rise in the pulse duration enhances the material’s non-uniform evaporation, which in turn raises the circularity variation [31]. The influence of the electrode type on circularity is shown in Figure 9b. When machining a Nimonic C 263 workpiece, the tungsten electrode is shown to be superior to the other two electrodes in terms of producing precisely sized holes on the machined surface. Increases in the current and pulse duration cause fewer erratic sparks from a tungsten electrode, resulting in a decreased metal removal rate (MRR) during the machining of the Nimonic C263 alloy. This effect does not result in the formation of huge craters on the machined face and prevents the machined hole from losing its intended size or shape. Also, the tungsten has a higher melting point compared to the copper and copper–tungsten electrodes. During EDM, the electrode material experiences extreme heat due to the electrical discharges. The higher melting point of tungsten means that it can withstand higher temperatures without deforming or melting, contributing to the better dimensional accuracy and circularity in the machined features. Due to the greater, more erratic spark discharges and higher MRR, copper electrode-made parts have badly damaged circular edges. The copper–tungsten electrode offers a balance between heat dissipation and dimensional stability and shows circularity between copper and tungsten electrodes.
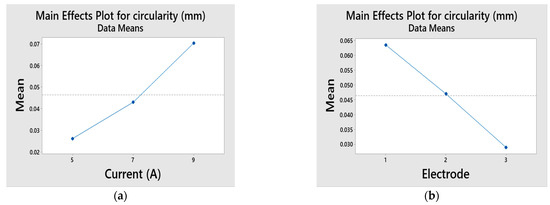
Figure 9.
Main effect graphs for the circularity (a) Effect of Current on circularity (b) Effect of Electrode on circularity.
5.5. Analysis of Machining Debris (db)
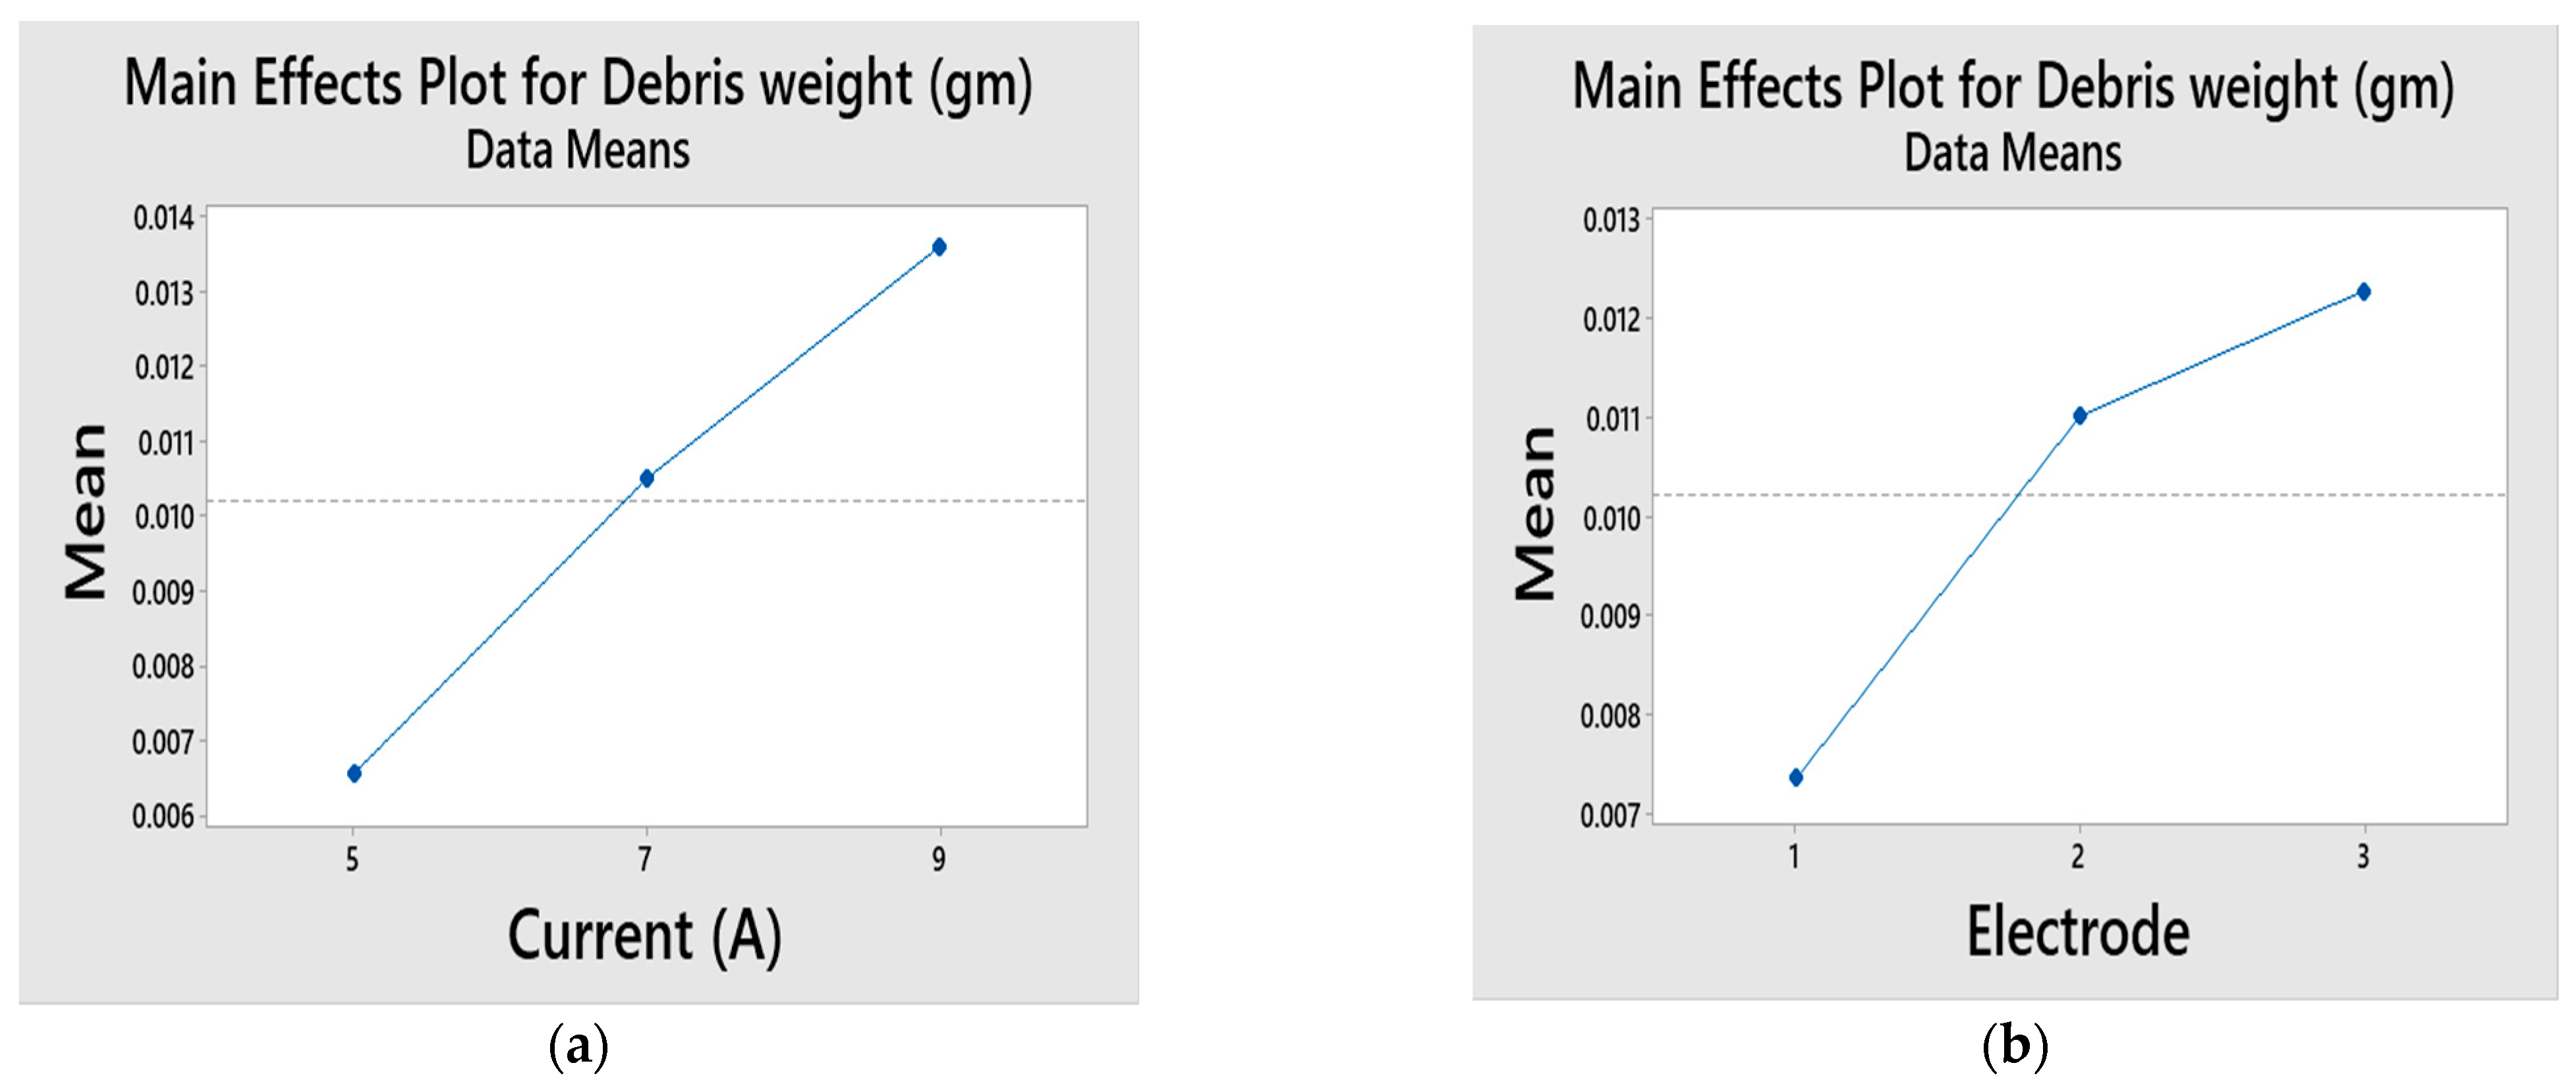
In EDM, the ignition delay time is reduced due to an increase in the absorption of debris in the dielectric and a drop in the intensity of the dielectric as the machining advances. As a result, dielectric filtration requires the removal of these waste particles. Debris will gather in the small machining gap if the dielectric’s flushing pressure is not high enough, leading to sparking and arcing and potentially damaging the electrode and the workpiece. The particle size of the machining debris must therefore be kept to a minimum. The primary effect plot for the debris weight against the current is shown in Figure 10a. The graph shows that the weight of the debris grows with an increasing current. The intense spark is the result of a high current. The greater spark energy causes more material to be eroded from both electrodes, producing more debris. The debris weight versus the electrode type primary effect plot is shown in Figure 10b. As can be observed in the image, the copper electrode produces debris that is bigger than that produced by the other two electrodes due to the higher MRR. Compared to the other two electrodes, the copper electrode’s higher material removal rate (MRR) is facilitated by its excellent thermal conductivity and heat dissipation properties. These properties enable efficient dissipation of the heat generated during the electrical discharge machining (EDM) process, thereby preventing excessive heat buildup at the electrode–workpiece interface. Consequently, the thermal stresses and distortion in the workpiece are minimized, creating more stable machining conditions and contributing to the higher MRR observed with copper electrodes. This leads to the generation of larger debris. The debris generated from tungsten electrodes tends to be lighter in weight during the machining of Nimonic C263 compared to other electrode options. Since tungsten has a higher melting point, it is less likely to melt and contribute to the formation of molten debris compared to copper and copper–tungsten with lower melting points. Similarly, the voltage curve demonstrates that the debris weight decreases as the voltage increases. The particle size drops alongside the MRR as the voltage increases.
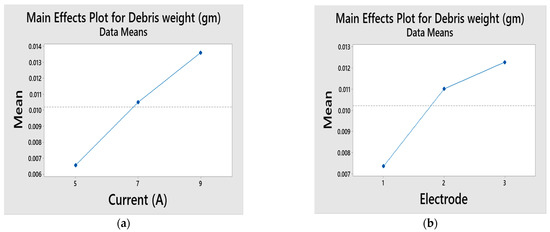
Figure 10.
Main effect graphs for the debris weight (a) Effect of Current on Debris weight (b) Effect of Electrode on debris weight.
5.5.1. Field Emission Scanning Electron Microscope (FESEM) Study
FESEM debris investigation is performed to investigate and characterize the Nimonic C263 particles generated during machining, including their size, weight, and distribution. It is a difficult chore to clean the machining tank of debris. After each trial run, the debris is gathered for disposal. Once the debris has been collected, it is centrifuged twice, once without acetone and once with [14,32], so that the oil can be emulsified and removed. To learn more about the physical properties of the debris (such as its shape and size), 27 FESEM micrographs were taken and analyzed. The particle size distribution is seen to be between 5 nm and 2 μm. The FESEM picture of the debris generated while machining with the tungsten electrode at 5 A, 7 A, and 9 A currents is shown in Figure 11a–c. Due to its lower MRR than the copper–tungsten and copper electrodes, the tungsten electrode exhibits a good surface finish. When using tungsten electrodes for cutting, the debris size is uniformly tiny and primarily spherical due to the smaller sparking. This results in a more manageable electric spark.
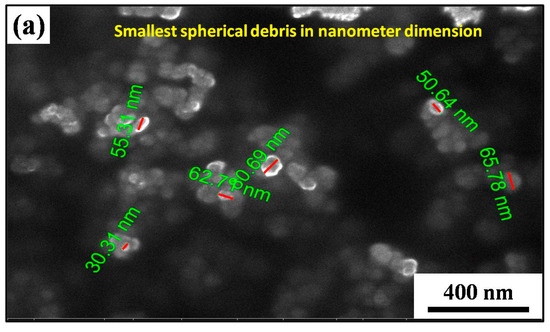

Figure 11.
FESEM of debris machined with W electrode at (a) 5 A, (b) 7 A, and (c) 9 A current.
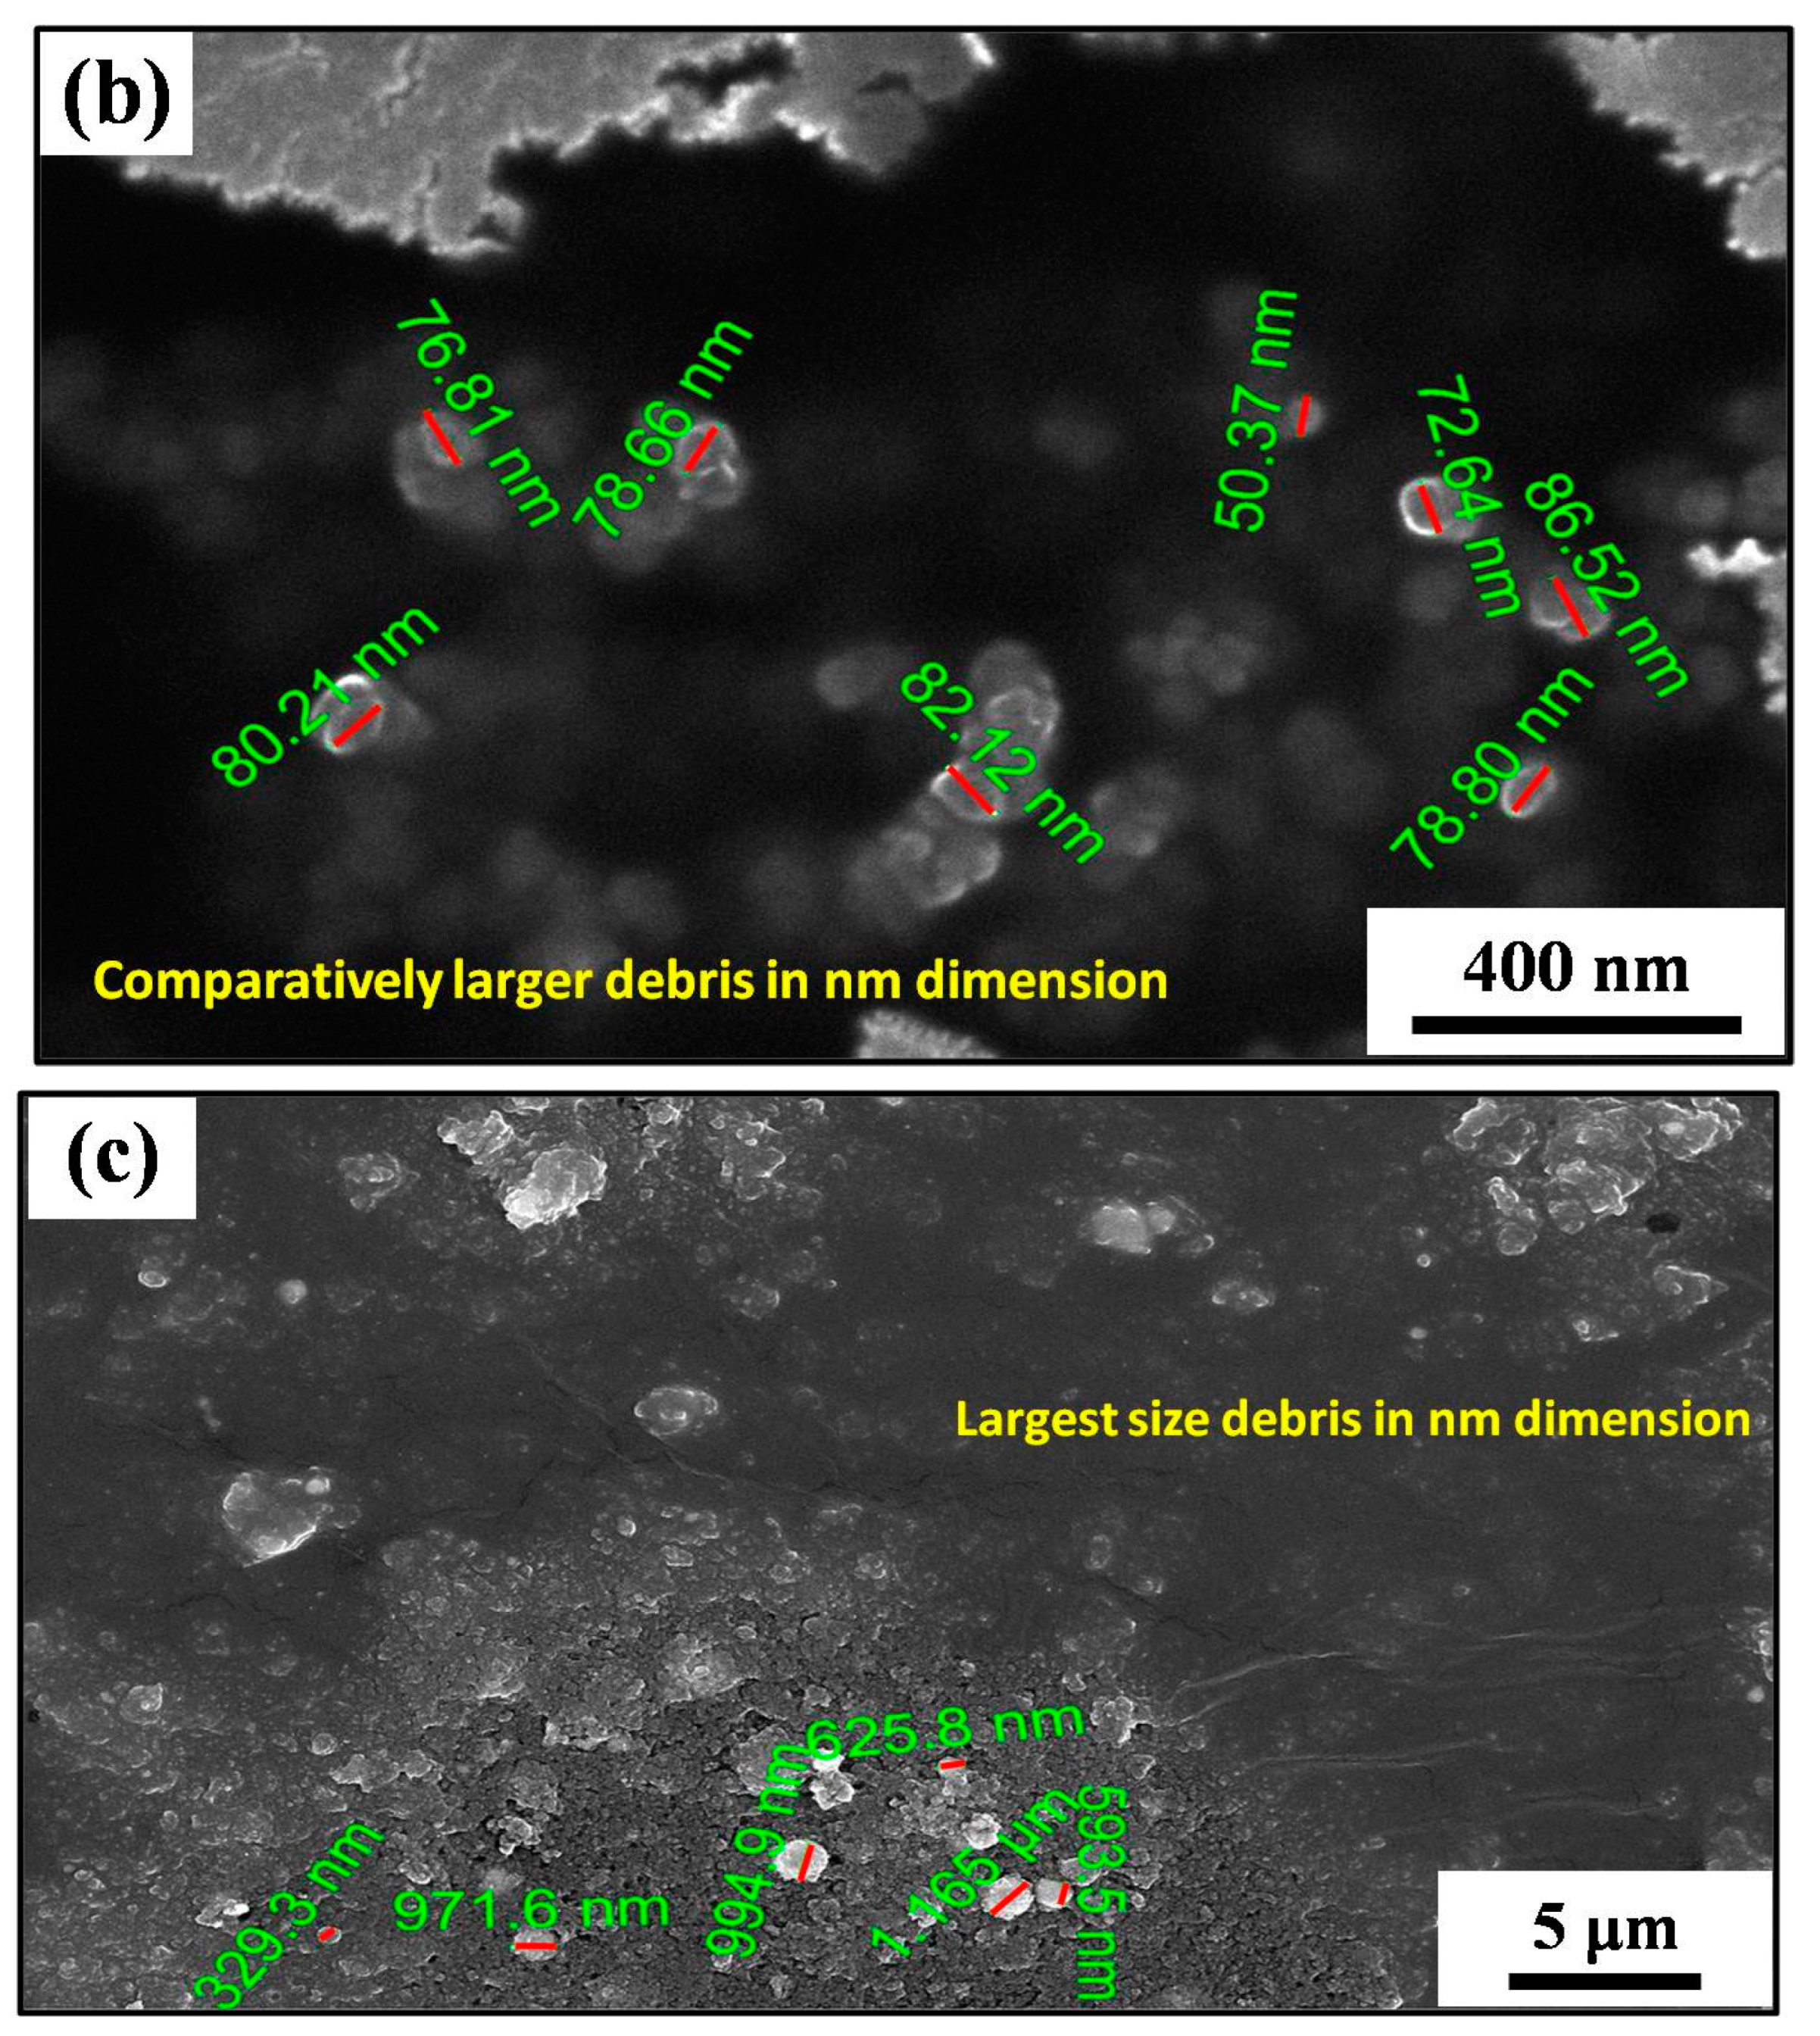
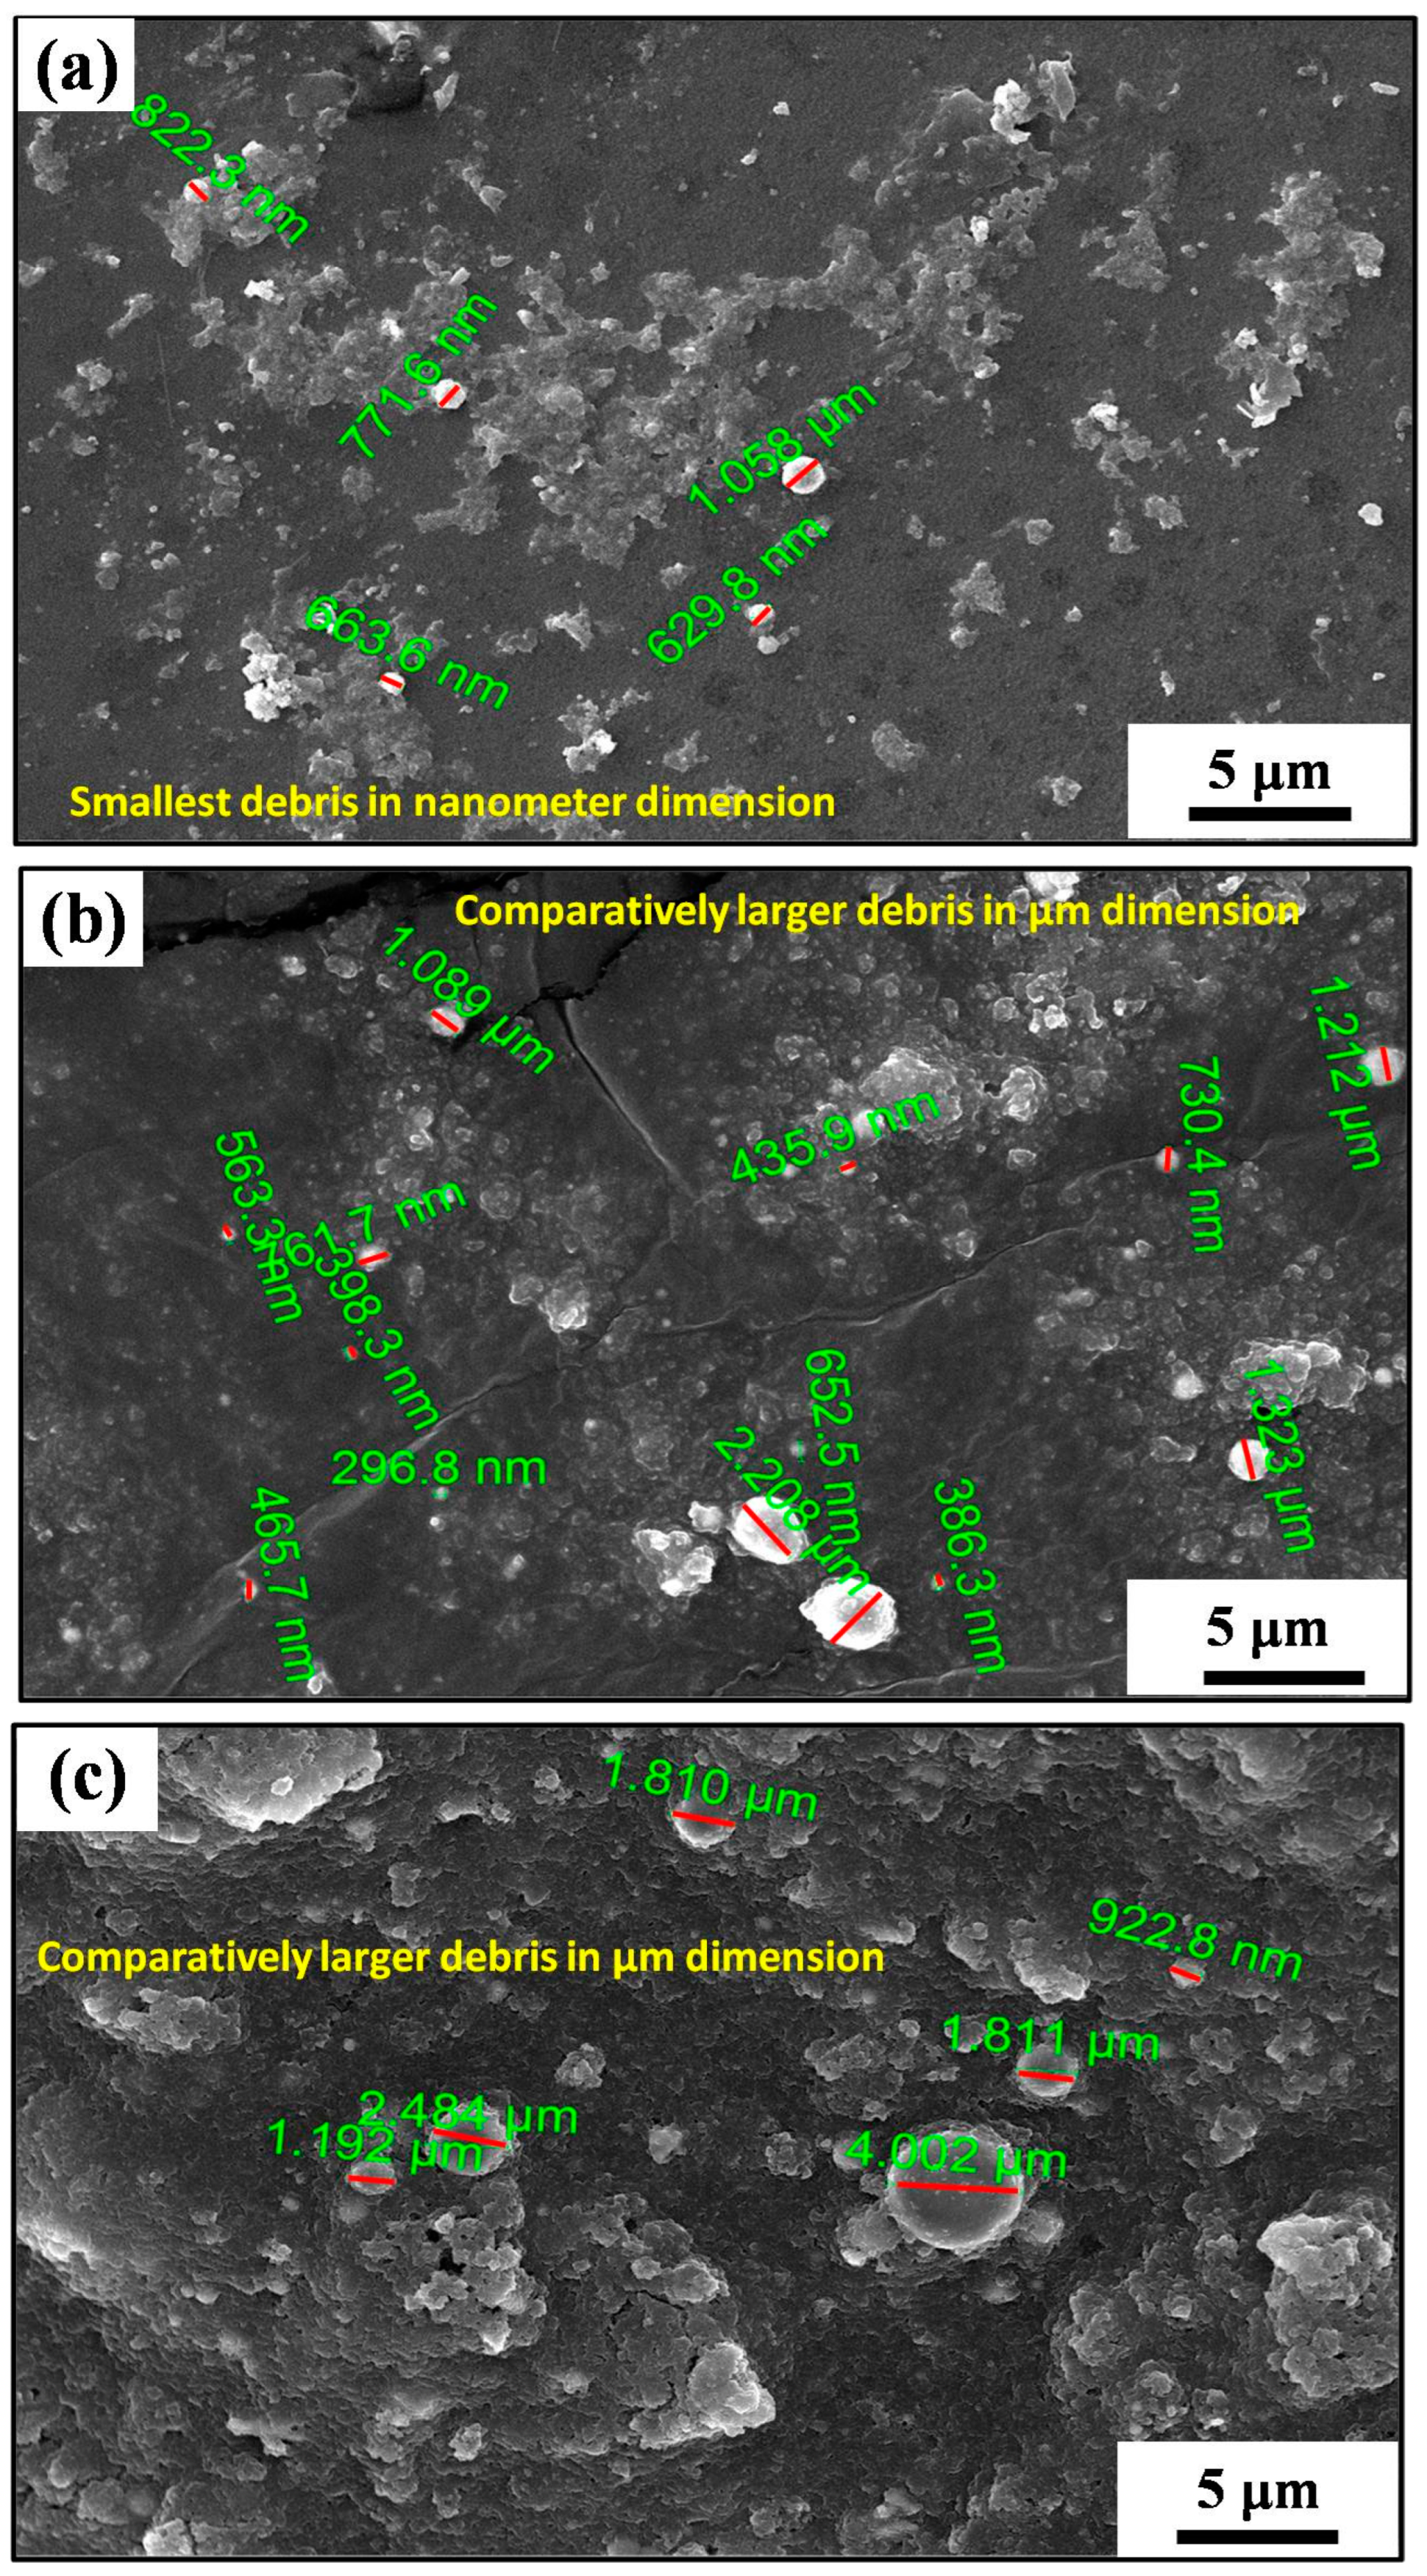
The FESEM picture of the debris generated while machining with the copper–tungsten electrode is displayed in Figure 12a–c. The debris size produced by the copper–tungsten tool is less than that of the copper electrode and larger than that of the tungsten electrodes. Copper–tungsten electrodes produce greater MRRs than tungsten electrodes do at similar current levels, leading to a greater build-up of debris in the machining gap at higher current values. The result is erratic sparking and fragments of varying sizes. The FESEM picture of debris generated while machining with the copper electrode is displayed in Figure 13a–c. The surface roughness, machining rate, and debris size all increase with an increased current, because more pulse energy causes larger craters [32].
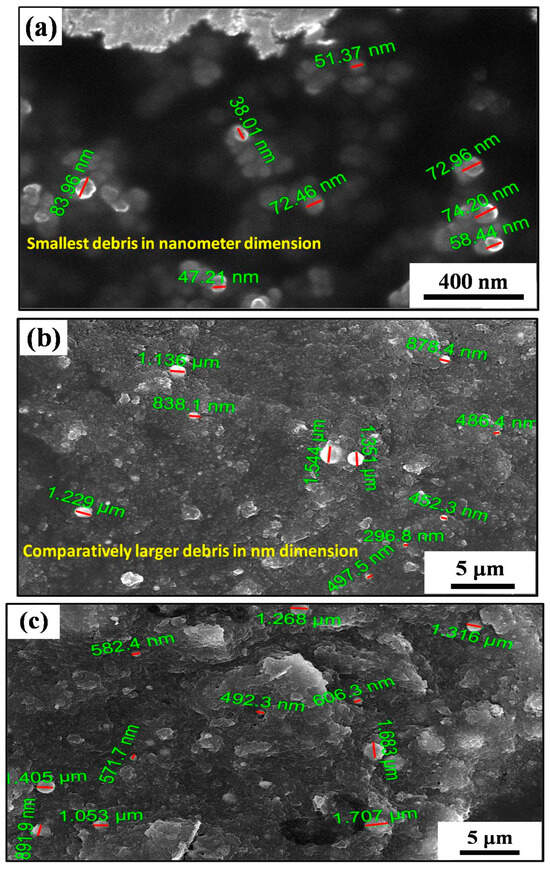
Figure 12.
FESEM of debris machined with Cu-W electrode at (a) 5 A, (b) 7 A, and (c) 9 A current.

Figure 13.
FESEM of debris machined with Cu electrode at (a) 5 A, (b) 7 A, and (c) 9 A current.
5.5.2. Field Emission Scanning Electron Microscope (FESEM) Study
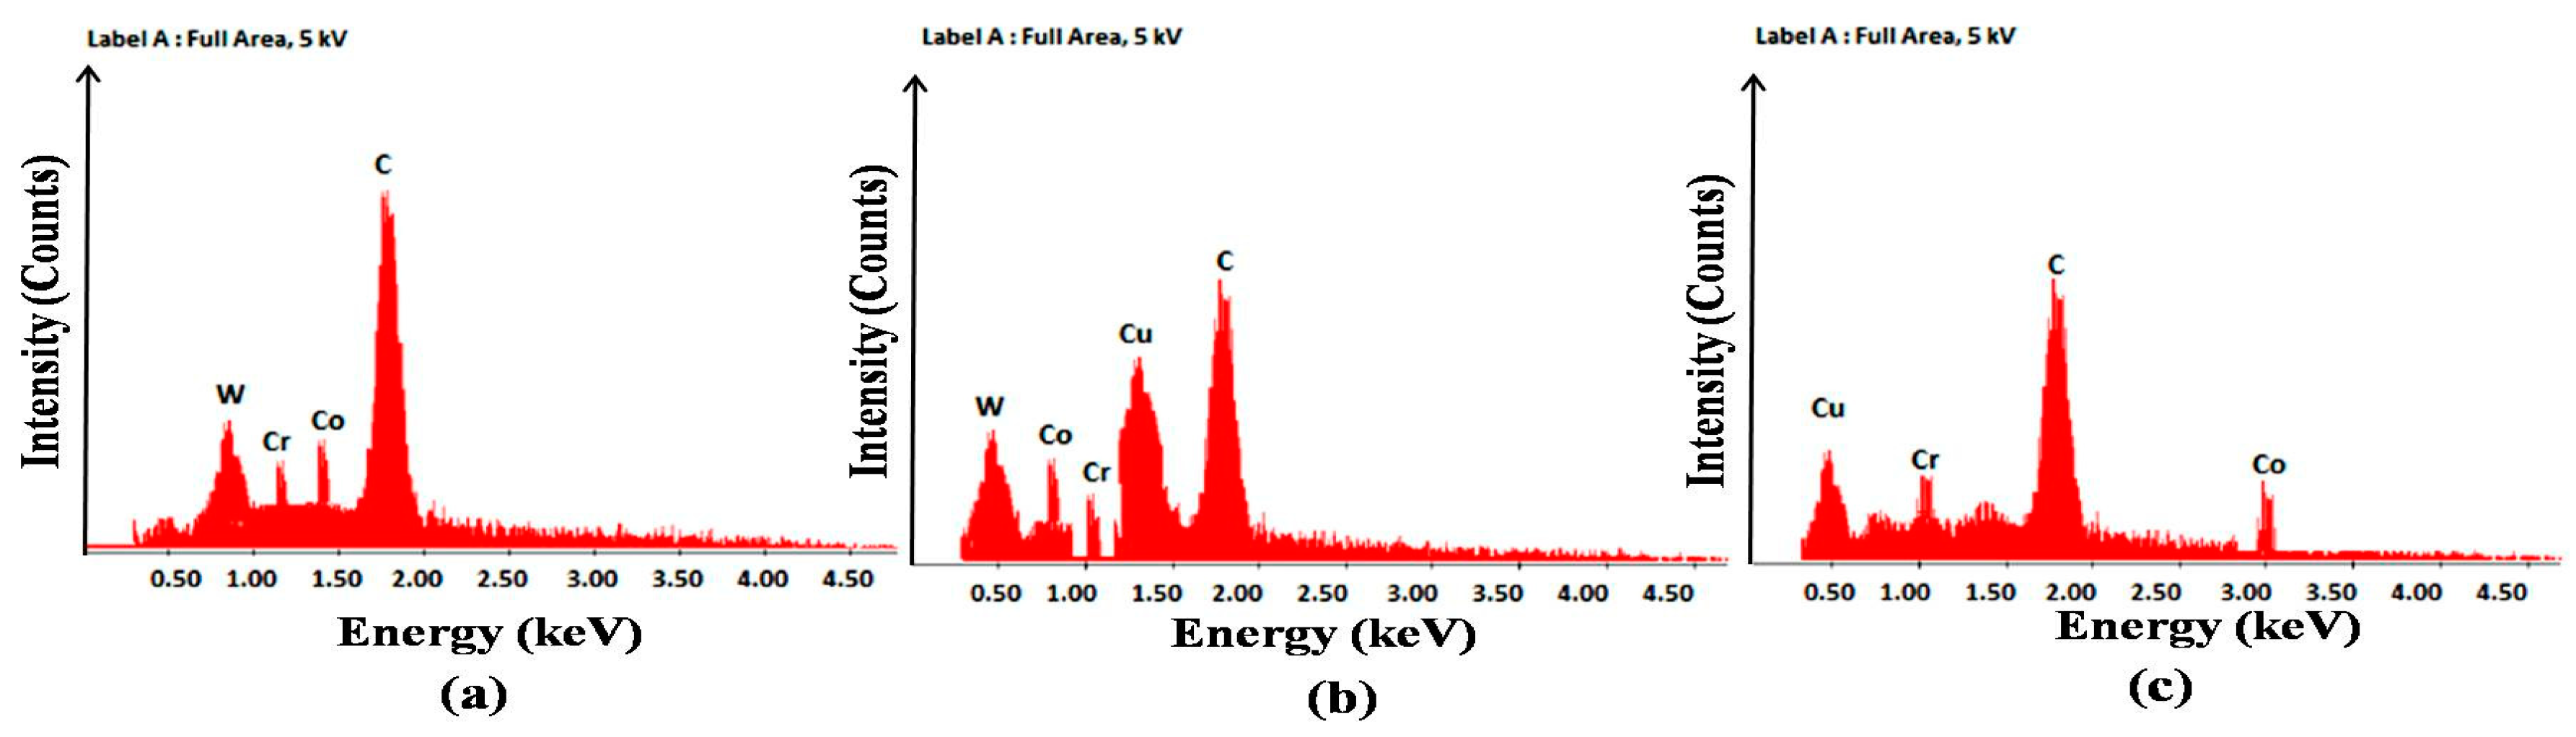
The size, shape, etc. of debris particles can be seen by SEM analysis. EDX can help figure out how the particles in the wreckage are dispersed. Figure 14a is an EDX image of debris machined with a tungsten electrode, confirming the presence of carbon and tungsten particles in high concentrations. The EDX image displays the evenly dispersed tungsten from the tungsten electrode. The machined waste particles contain cobalt and chromium from the Nimonic C263 workpiece. The EDX analysis of the copper–tungsten electrode fragments is shown in Figure 14b. The machined detritus is depicted with particles of carbon, copper, tungsten, cobalt, and chromium. Similarly, Figure 14c depicts the EDX image of the copper electrode’s debris. The debris particles are primarily composed of carbon and copper, with smaller amounts of cobalt and chromium.
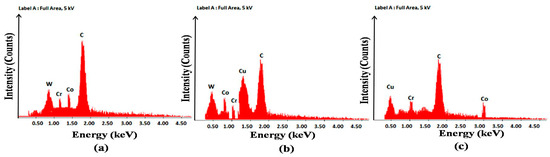
Figure 14.
EDAX analysis of debris produced by (a) W, (b) Cu-W, and (c) Cu electrode.
5.6. Analysis of Specific Energy Consumption (SEC)
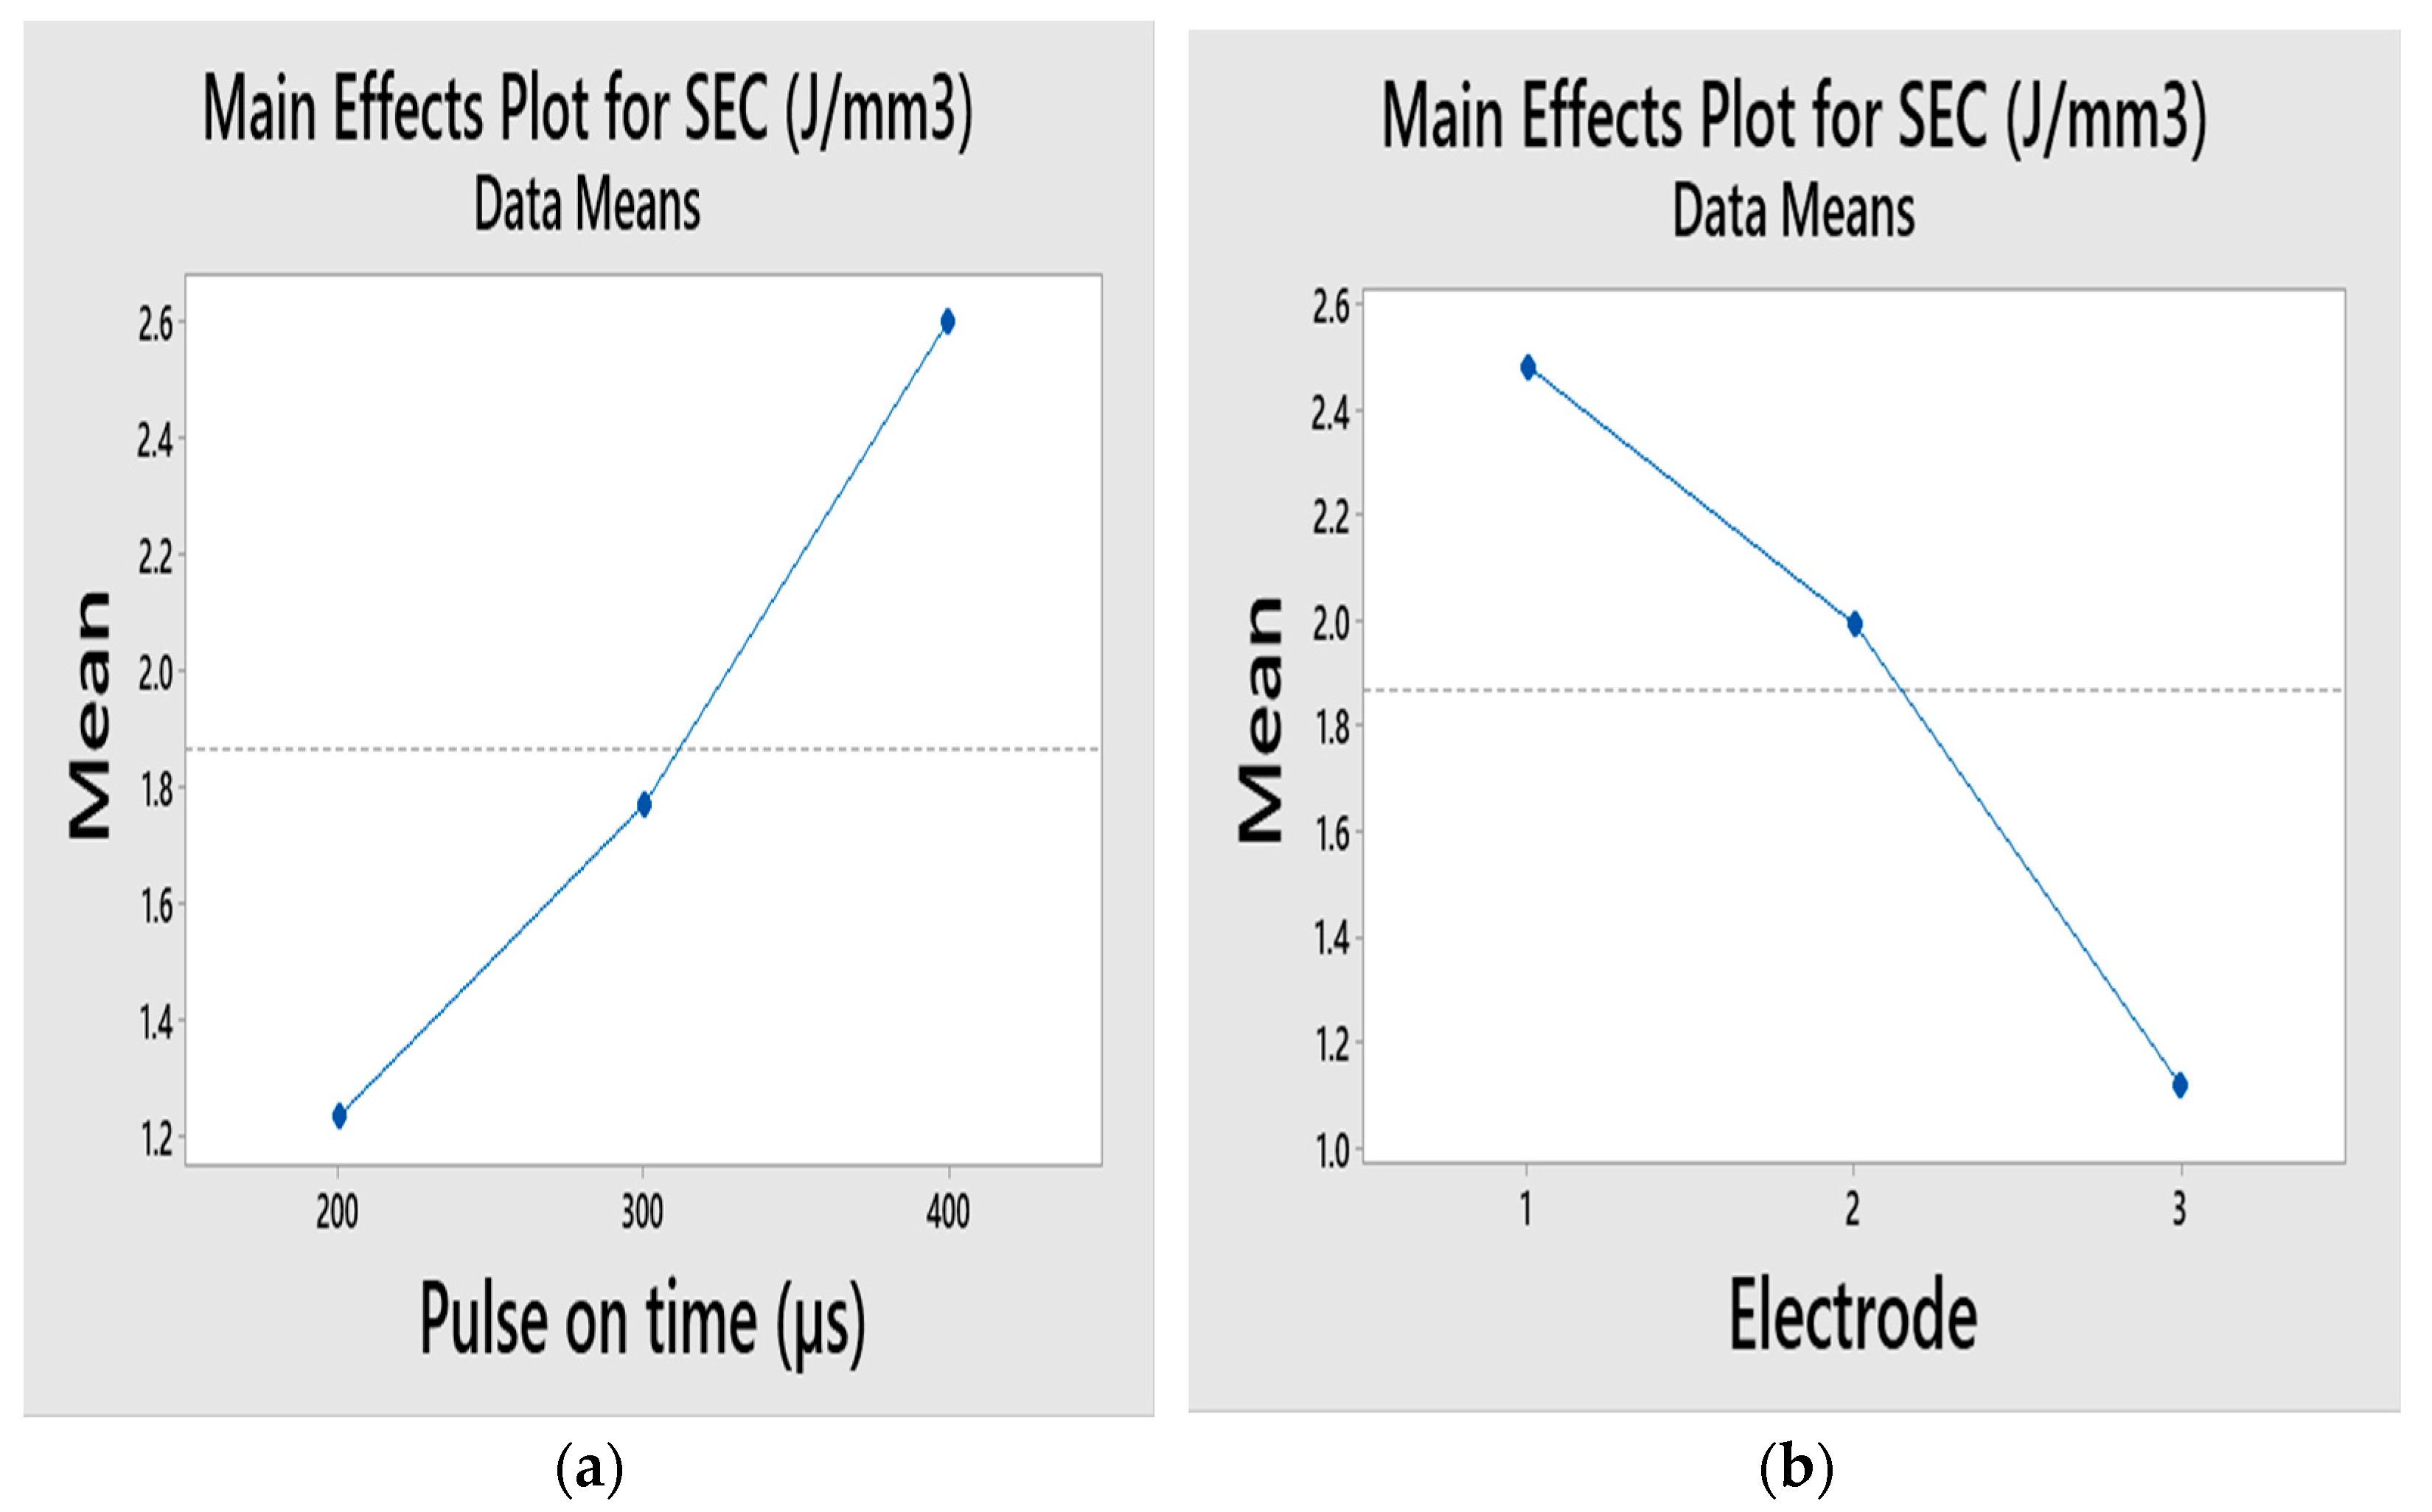
For an illustration of the principal effect of the pulse duration on the SEC, see Figure 15a. Due to the rise in the spark energy, the SEC grows as the pulse lengthens. The primary effect plot for the SEC using the electrode is shown in Figure 15b. The graph illustrates that the specific energy consumption (SEC) is at its peak when machining with a tungsten electrode and at its lowest with a copper electrode on a Nimonic C263 workpiece. The SEC for copper–tungsten electrodes falls between those of pure copper and tungsten electrodes. Notably, the copper electrode demonstrates the highest material removal rate (MRR) due to having superior electrical and thermal properties compared to the copper–tungsten and tungsten electrodes, resulting in lower energy consumption. This is because a greater amount of energy is required to remove material when the MRR is high, thereby indicating superior energy utilization efficiency in copper electrodes compared to tungsten and copper–tungsten electrodes. Conversely, the tungsten electrode yields a lower MRR due to its lower electrical conductivity compared to the copper and copper–tungsten electrodes, leading to higher energy consumption. In this case, less input energy is utilized by the workpiece, with more energy dissipating into the environment during machining. To a similar extent, Zhang et al. [13] draw the same conclusion. The current–SEC plot shows a similar trend; as the current rises, the spark energy rises, and the SEC rises with it. Similarly, the SEC has grown in relation to the voltage and shrunk in relation to the relatively unimportant duty factor.
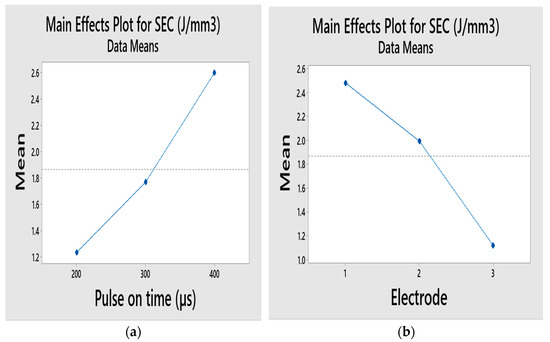
Figure 15.
Main effect graphs of the SEC (a) Effect of Pulse on time on SEC (b) Effect of Electrode on SEC.
In this study, the VIKOR method is employed to standardize the various machining metrics by computing the VIKOR index (VI). In addition, the VI values are compared with the VIKOR index values to determine which options are best and which are worst. Table 2 reveals that, of the 27 VI values, the one with the lowest VI value is experimental run 10, which is highlighted in bold. Using a hybrid optimization structure (neuro-genetic approach) improves on the already-superior outcome obtained using the VIKOR method. The model uses a non-linear regression analysis to show how the machining parameters change when the VIKOR index (VI) changes; the VI is the objective function in the neuro-genetic method. In Section 6, the specifics of the neuro-genetic method are explained, along with the hybrid optimization framework. The regression analysis mathematical model is presented in Equation (13).
6. Neuro-Genetic Optimization Technique
To find the best machining attributes for the milling process while keeping the VI value as low as possible, a neuro-genetic optimization approach is employed.
6.1. Artificial Neural Network (ANN)
The ANN is trained (in MATLAB 2019a) using 27 samples from the experimental data. In Section 4, the experimental design and the five input variables are described using five performance parameters. To rank the machining trials, the VIKOR approach is employed (discussed in Section 3) to combine the five performance characteristics. The ANN evolves based on the input and output variables. The analysis uses a single-hidden-layer feedforward backpropagation network. The weights and bias settings are revised using the Tan sigmoid transfer function and the Levenberg–Marquardt algorithm. A total of 70% of the data is used to teach the network, 15% to validate it, and 15% to put it through its paces during testing.
The number of hidden-layer neurons in the network is set using the neuron-independent analysis described in Table 10. The number of hidden-layer neurons varies during the investigation from 2 to 20. The mean relative error (MRE), mean squared error (MSE), and coefficient of determination (R2) are utilized to make predictions of the optimal network and calculated by following Equations (14)–(16).
where n represents the number of datapoints, VIANN represents the predicted value from the ANN for the ith data point and VIEXPT represents the experimental value for the ith data point.
Table 10.
Neuron-independent study.
Table 10 clearly shows that the network with 15 neurons has the lowest MRE and MSE values and the highest R2 value. This is the best possible network, as determined by the GA.
6.2. Genetic Algorithm (GA)
The best ANN network is used to create the GA goal function (Equation (17)). The probabilities of mutation and crossover are assumed to be 0.1 and 0.82, respectively, in a random selection with a population size of 50. A single answer, the VIKOR index (VI), is generated from the normalization of the input and performance parameters employing the VIKOR method, as detailed in Section 3. The aim is to ensure that the VI is as low as possible.
Minimize VI Subjected to 5 ≤ I ≤ 9; 60 ≤ U ≤ 80; 200 ≤ Ton ≤ 400; 70 ≤ τ ≤ 80; 1 ≤ electrode type ≤ 3
6.3. Hybrid ANN-GA Approach
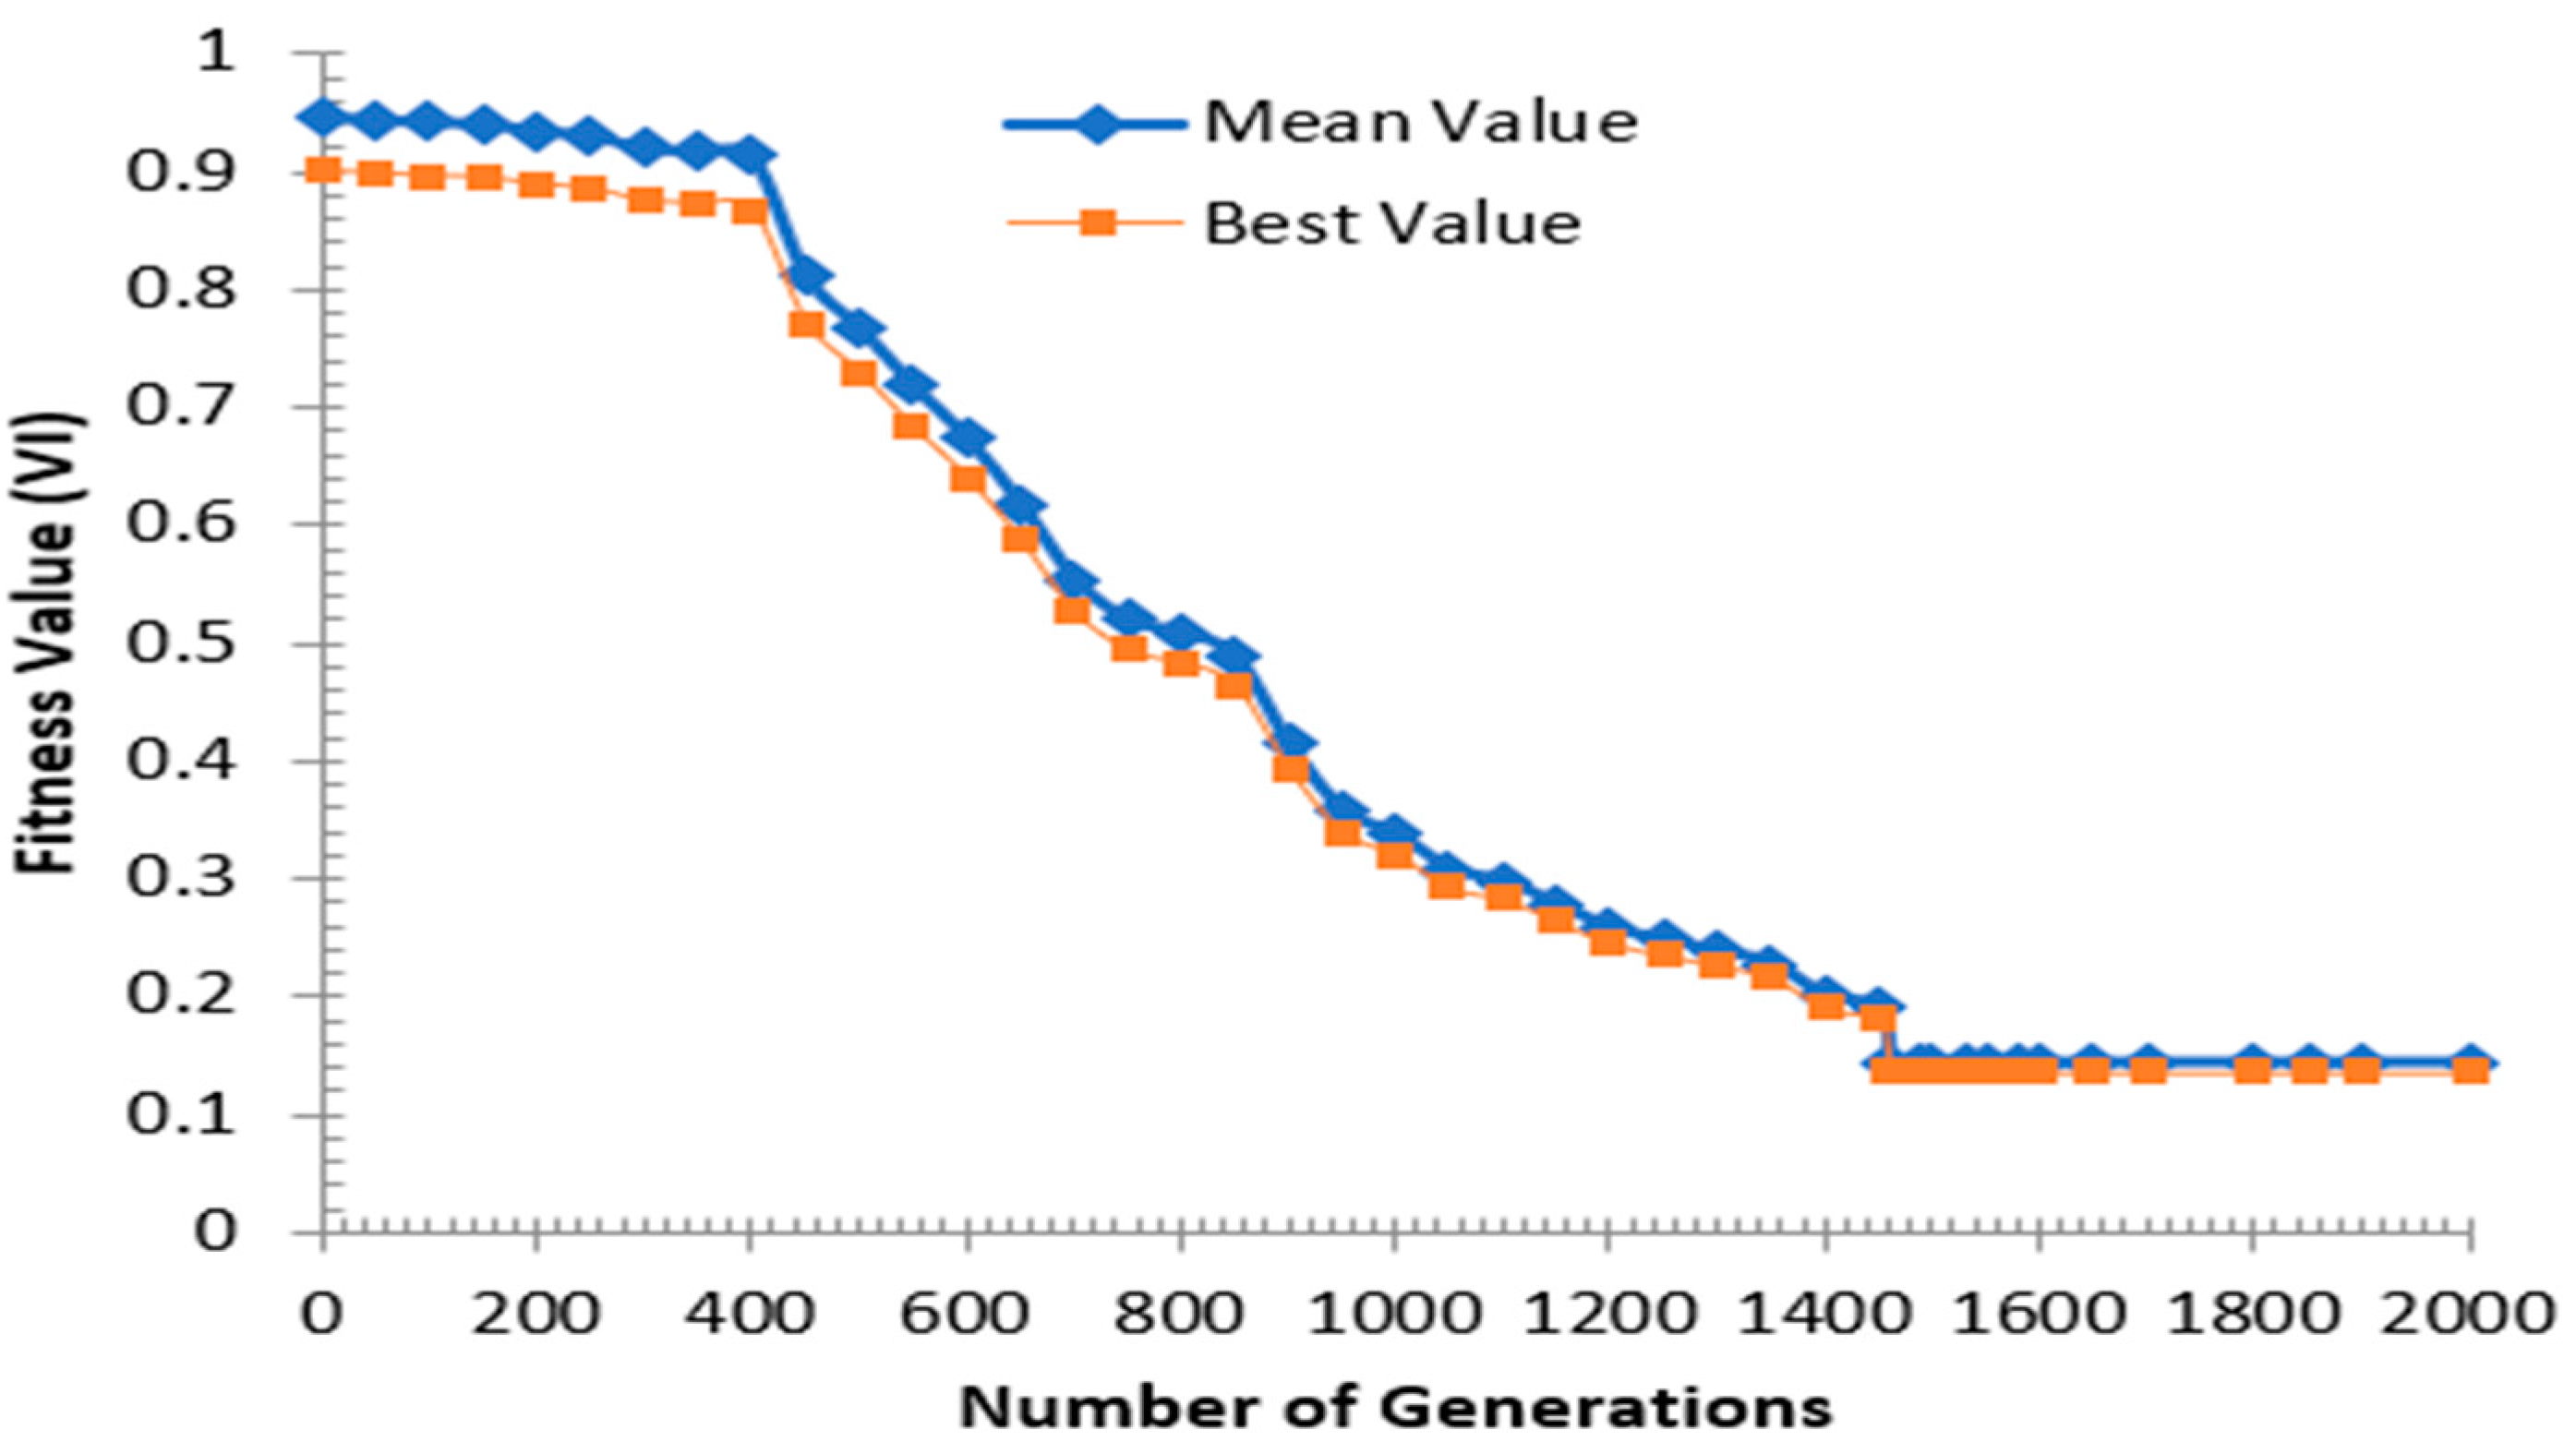
Combining the ANN and GA shortens the solution time and yields better results (lower VIKOR index values). The combined ANN and GA method has been used by several researchers [24,37,38,39] to address the problems of multi-objective optimization. After 1462 generations, the GA in this work produces the ideal outcomes (Figure 16). This is the lowest possible value for the VIKOR index. To obtain the lowest possible VIKOR index value, the following values of I = 7.5 A, U = 72.85 V, Ton = 384.87 µs, τ= 81%, and electrode type = 1.9 are found to be ideal. For machining purposes, the copper–tungsten electrode values are rounded up. The minimum VI value (obtained using GA) is 0.1386. The tests are then repeated with the optimized input variables, and the results are analyzed to verify the viability of the solution suggested by the neuro-genetic algorithm. Predicting the VIKOR index values for the answers indicates an improvement of 9.87% over the VIKOR method (Table 2). Table 11 summarizes these findings.

Figure 16.
VI fitness values for different generations.
Table 11.
Confirmative test with optimal machining settings.
7. Conclusions
This study presents a comprehensive investigation into the optimization of the machining settings for the electrical discharge machining (EDM) of the Nimonic C-263 alloy. This paper follows a structured approach, integrating experimentation with neuro-genetic optimization techniques to achieve energy-efficient, clean, and precise electrical discharge-machined components. This approach effectively combines artificial neural networks (ANNs) and genetic algorithms (GAs), providing a robust framework for optimizing the machining parameters tailored specifically for the Nimonic C-263 alloy. The important outcomes of the study are mentioned below:
- This study assesses a range of performance metrics, including the material removal rate (MRR), tool wear rate (TWR), surface roughness, debris weight, circularity, and specific energy consumption (SEC). It identifies key parameters that influence these metrics, shedding light on the effects of the electrode materials, discharge current, pulse duration, and other factors on machining performance.
- When machining a Nimonic C263 workpiece, employing a copper–tungsten electrode yields energy-efficient, clean, and precise electrical discharge-machined parts. Among the various parameters affecting the material removal rate (MRR), the study highlights the current and electrode materials as the most significant, with the copper electrode exhibiting the highest MRR among the available options.
- Due to its superior heat conductivity and low electrode wear ratio (EWR), the copper electrode emerges as the most efficient choice among the three electrode materials examined.
- The surface roughness and circularity in Nimonic C263 EDM are primarily influenced by the discharge current and electrode type, as evidenced by the study’s findings.
- Furthermore, the weight of the debris is heavily impacted by both the current and the specific electrode utilized.
- In machining the Nimonic C263 alloy, the specific energy consumption (SEC) is notably affected by pulse on-time and electrode type. Notably, the copper electrode demonstrates the lowest SEC compared to the alternative electrodes.
- Current (I) = 7.5 A, voltage (U) = 72.85 V, pulse duration (Ton) = 384.87 μs, duty factor (τ) = 81%, and electrode = Cu-W were determined to be the optimal machining conditions utilizing the VIKOR-based ANN-GA method.
8. Recommendations for Future Research
A technical gap was found in the survey’s benchmarking of the MRR, TWR, and other machining parameters for innovative electrode materials. Regarding the introduction of novel PMEDM-based, ultrasonic cavitation-aided, and cryogenic processes, there are still certain gaps. Concerning the MRR and TWR, the area’s standardization and optimization needs still need to be developed. In several of the sectors, there is still a dearth of scientific and technological knowledge. Here are some recommendations for further research. It is feasible to analyze the effects of process factors on the heat-affected zone of the machined surface. Mathematical techniques can be developed to examine how the process parameters affect the various performance metrics. Further improved and hybrid non-traditional optimization methodologies, such as ant colony optimization, artificial bee colonies, and firefly algorithms, can be used to determine the best parametric configuration to simultaneously optimize several important performance indicators. Finite element models are applicable for experimental study. For the processing of innovative ultra-hard materials, the thermal model of the heat transfer effectiveness and flushing properties must be taken into consideration. For surface-engineered tools, there is also a requirement for standardization and optimization.
Author Contributions
R.K.S.: Conceptualization, investigation, methodology, writing—original draft. C.P.M.: Methodology, resources, supervision. U.M.: Investigation, methodology. T.K.H.: Investigation, methodology. V.V.P.: Writing—final draft. K.G.P.: Resources, writing—review and editing, supervision. All authors have read and agreed to the published version of the manuscript.
Funding
This research received no external funding.
Data Availability Statement
Data supporting this study are included within the article.
Acknowledgments
The authors are thankful to the Vellore Institute of Technology, Vellore, India, for providing financial support to carry out this research work.
Conflicts of Interest
The authors declare no conflicts of interest.
References
- Mandal, A.; Dixit, A.R.; Chattopadhyaya, S.; Paramanik, A.; Hloch, S.; Królczyk, G. Improvement of surface integrity of Nimonic C 263 superalloy produced by WEDM through various post-processing techniques. Int. J. Adv. Manuf. Technol. 2017, 93, 433–443. [Google Scholar] [CrossRef]
- Shastri, R.K.; Mohanty, C.P.; Dash, S.; Gopal, K.M.P.; Annamalai, A.R.; Jen, C.P. Reviewing performance measures of the die-sinking electrical discharge machining process: Challenges and future scopes. Nanomaterials 2022, 12, 384. [Google Scholar] [CrossRef] [PubMed]
- Bisaria, H.; Shandilya, P. Experimental investigation on wire electric discharge machining (WEDM) of Nimonic C-263 superalloy. Mater. Manuf. Process. 2019, 34, 83–92. [Google Scholar] [CrossRef]
- Hasçalık, A.; Çaydaş, U. Electrical discharge machining of titanium alloy (Ti–6Al–4V). Appl. Surf. Sci. 2007, 253, 9007–9016. [Google Scholar] [CrossRef]
- Venugopal, P.; Saravanan, K.G.; Thanigaivelan, R. Performance analysis of edm on grey cast iron using rsm and topsis method. Appl. Eng. Lett. 2023, 8, 10–16. [Google Scholar] [CrossRef]
- Ahmed, N.; Ishfaq, K.; Moiduddin, K.; Ali, R.; Al-Shammary, N. Machinability of titanium alloy through electric discharge machining. Mater. Manuf. Process. 2019, 34, 93–102. [Google Scholar] [CrossRef]
- Dhanabalan, S.; Sivakumar, K.; Sathiya Narayanan, C. Analysis of form tolerances in electrical discharge machining process for Inconel 718 and 625. Mater. Manuf. Process. 2014, 29, 253–259. [Google Scholar] [CrossRef]
- Selvarajan, L.; Venkataramanan, K. Si3N4–TiN conductive ceramic composites: Topography on EDMed surfaces and precise drilled holes. Mater. Sci. Technol. 2023, 39, 2006–2017. [Google Scholar] [CrossRef]
- Straka, Ľ.; Hašová, S. Optimization of material removal rate and tool wear rate of Cu electrode in die-sinking EDM of tool steel. Int. J. Adv. Manuf. Technol. 2018, 97, 2647–2654. [Google Scholar] [CrossRef]
- Rahul; Datta, S.; Masanta, M.; Biswal, B.B.; Mahapatra, S.S. Analysis on surface characteristics of electro-discharge machined Inconel 718. Int. J. Mater. Prod. Technol. 2018, 56, 135–168. [Google Scholar] [CrossRef]
- Zhang, Z.; Yu, H.; Zhang, Y.; Yang, K.; Li, W.; Chen, Z.; Zhang, G. Analysis and optimization of process energy consumption and environmental impact in electrical discharge machining of titanium superalloys. J. Clean. Prod. 2018, 198, 833–846. [Google Scholar] [CrossRef]
- Shastri, R.K.; Mohanty, C.P. Sustainable electrical discharge machining of Nimonic C263 superalloy. Arab. J. Sci. Eng. 2021, 46, 7273–7293. [Google Scholar] [CrossRef]
- Zhang, G.; Li, W.; Zhang, Y.; Huang, Y.; Zhang, Z.; Chen, Z. Analysis and reduction of process energy consumption and thermal deformation in a micro-structure wire electrode electric discharge machining thin-wall component. J. Clean. Prod. 2020, 244, 118763. [Google Scholar] [CrossRef]
- Murti, V.S.R.; Philip, P.K. An analysis of the debris in ultrasonic-assisted electrical discharge machining. Wear 1987, 117, 241–250. [Google Scholar] [CrossRef]
- Nieslony, P.; Wojciechowski, S.; Gupta, M.K.; Chudy, R.; Krolczyk, J.B.; Maruda, R.; Krolczyk, G.M. Relationship between energy consumption and surface integrity aspects in electrical discharge machining of hot work die steel. Sustain. Mater. Technol. 2023, 36, e00623. [Google Scholar] [CrossRef]
- Zhang, Z.; Zhang, Y.; Lin, L.; Wu, J.; Yu, H.; Pan, X.; Li, G.; Wu, J.; Xue, T. Study on productivity and aerosol emissions of magnetic field-assisted EDM process of SiCp/Al composite with high volume fractions. J. Clean. Prod. 2021, 292, 126018. [Google Scholar] [CrossRef]
- Al-Amin, M.; Abdul-Rani, A.M.; Danish, M.; Zohura, F.T.; Rubaiee, S.; Ahmed, R.; Sarikaya, M. Analysis of hybrid HA/CNT suspended-EDM process and multiple-objectives optimization to improve machining responses of 316L steel. J. Mater. Res. Technol. 2021, 15, 2557–2574. [Google Scholar] [CrossRef]
- Kumaran, S.T.; Ko, T.J.; Kurniawan, R. Grey fuzzy optimization of ultrasonic-assisted EDM process parameters for deburring CFRP composites. Measurement 2018, 123, 203–212. [Google Scholar] [CrossRef]
- Xu, B.; Chen, S.G.; Liang, X.; Lei, J.G.; Shi, H.Y.; Fu, L.Y.; Yang, J.; Peng, T.J.; Zhao, H.; Zhu, L.K. Recast layer removal of 304 stainless steel by combining micro-EDM with negative polarity micro-EDM. Int. J. Adv. Manuf. Technol. 2020, 107, 4713–4723. [Google Scholar] [CrossRef]
- Jadam, T.; Sahu, S.K.; Datta, S.; Masanta, M. EDM performance of Inconel 718 superalloy: Application of multi-walled carbon nanotube (MWCNT) added dielectric media. J. Braz. Soc. Mech. Sci. Eng. 2019, 41, 305. [Google Scholar] [CrossRef]
- Le, V.T. The role of electrical parameters in adding powder influences the surface properties of SKD61 steel in the EDM process. J. Braz. Soc. Mech. Sci. Eng. 2021, 43, 120. [Google Scholar] [CrossRef]
- Kumar, A.; Mandal, A.; Dixit, A.R.; Das, A.K.; Kumar, S.; Ranjan, R. Comparison in the performance of EDM and NPMEDM using Al2O3 nanopowder as an impurity in DI water dielectric. Int. J. Adv. Manuf. Technol. 2019, 100, 1327–1339. [Google Scholar] [CrossRef]
- Peta, K.; Love, G.; Brown, C.A. Comparing repeatability and reproducibility of topographic measurement types directly using linear regression analyses of measured heights. Precis. Eng. 2024, 88, 192–203. [Google Scholar] [CrossRef]
- Rangajanardhaa, G. Development of hybrid model and optimization of surface roughness in electric discharge machining using artificial neural networks and genetic algorithm. J. Mater. Process. Technol. 2009, 209, 1512–1520. [Google Scholar]
- Mandal, P.; Mondal, S.C. Multi-objective optimization of Cu-MWCNT composite electrode in electro-discharge machining using MOPSO-TOPSIS. Measurement 2021, 169, 108347. [Google Scholar] [CrossRef]
- Dikshit, M.K.; Singh, S.; Pathak, V.K.; Saxena, K.K.; Agrawal, M.K.; Malik, V.; Khan, M.I. Surface characteristics optimization of biocompatible Ti6Al4V with RCCD and NSGA II using die-sinking EDM. J. Mater. Res. Technol. 2023, 24, 223–235. [Google Scholar] [CrossRef]
- Chekuri, R.B.R.; Eshwar, D.; Kotteda, T.K.; Varma, R.S. Experimental and thermal investigation on die-sinking EDM using FEM and multi-objective optimization using WOA-CS. Sustain. Energy Technol. Assess. 2022, 50, 101860. [Google Scholar] [CrossRef]
- Srinivasan, V.P.; Palani, P.K.; Balamurugan, S. Experimental investigation on EDM of Si3N4–TiN using grey relational analysis coupled with the teaching-learning-based optimization algorithm. Ceram. Int. 2021, 47, 19153–19168. [Google Scholar] [CrossRef]
- Mouralova, K.; Benes, L.; Bednar, J.; Zahradnicek, R.; Prokes, T.; Fiala, Z.; Fries, J. Precision machining of Nimonic C263 superalloy using WEDM. Coatings 2020, 10, 590. [Google Scholar] [CrossRef]
- Selvarajan, L.; Narayanan, C.S.; JeyaPaul, R. Optimization of EDM parameters on machining Si3N4–TiN composite for improving circularity, cylindricity, and perpendicularity. Mater. Manuf. Process. 2016, 31, 405–412. [Google Scholar] [CrossRef]
- Mukhopadhyay, P.; Biswas, D.; Sarkar, B.R.; Doloi, B.; Bhattacharyya, B. Influence of Al powder on circularity during micro-electro-discharge machining of Monel K-500. Int. J. Mater. Form. Mach. Process. 2019, 6, 15–30. [Google Scholar] [CrossRef]
- Murray, J.W.; Sun, J.; Patil, D.V.; Wood, T.A.; Clare, A.T. Physical and electrical characteristics of EDM debris. J. Mater. Process. Technol. 2016, 229, 54–60. [Google Scholar] [CrossRef]
- Chang, T.H. Fuzzy VIKOR method: A case study of the hospital service evaluation in Taiwan. Inf. Sci. 2014, 271, 196–212. [Google Scholar] [CrossRef]
- Tong, L.I.; Chen, C.C.; Wang, C.H. Optimization of multi-response processes using the VIKOR method. Int. J. Adv. Manuf. Technol. 2007, 31, 1049–1057. [Google Scholar] [CrossRef]
- Peta, K.; Bartkowiak, T.; Rybicki, M.; Galek, P.; Mendak, M.; Wieczorowski, M.; Brown, C.A. Scale-dependent wetting behavior of bioinspired lubricants on electrical discharge machined Ti6Al4V surfaces. Tribol. Int. 2024, 194, 109562. [Google Scholar] [CrossRef]
- Mohanty, C.P.; Satpathy, M.P.; Mahapatra, S.S.; Singh, M.R. Optimization of cryo-treated EDM variables using TOPSIS-based TLBO algorithm. Sādhanā 2018, 43, 51. [Google Scholar] [CrossRef]
- Deshwal, S.; Kumar, A.; Chhabra, D. Exercising hybrid statistical tools GA-RSM, GA-ANN, and GA-ANFIS to optimize FDM process parameters for tensile strength improvement. CIRP J. Manuf. Sci. Technol. 2020, 31, 189–199. [Google Scholar] [CrossRef]
- Hotta, T.K.; Venkateshan, S.P. Optimal distribution of discrete heat sources under natural convection using ann–ga-based technique. Heat Transf. Eng. 2015, 36, 200–211. [Google Scholar] [CrossRef]
- Jadhav, P.S.; Mohanty, C.P.; Hotta, T.K.; Gupta, M. An optimal approach for improving the machinability of Nimonic C-263 superalloy during cryogenic assisted turning. J. Manuf. Process. 2020, 58, 693–705. [Google Scholar] [CrossRef]


Disclaimer/Publisher’s Note: The statements, opinions and data contained in all publications are solely those of the individual author(s) and contributor(s) and not of MDPI and/or the editor(s). MDPI and/or the editor(s) disclaim responsibility for any injury to people or property resulting from any ideas, methods, instructions or products referred to in the content. |
© 2024 by the authors. Licensee MDPI, Basel, Switzerland. This article is an open access article distributed under the terms and conditions of the Creative Commons Attribution (CC BY) license (https://creativecommons.org/licenses/by/4.0/).