Article

Ensuring Melt Track Width Consistency and Crack-Free Conditions Using Interpass-Temperature-Dependent Process Parameters for Wire-Arc-Directed Energy-Deposited Inconel 718

1
Department of Mechanical Engineering and Materials Science, University of Pittsburgh, Pittsburgh, PA 15260, USA
2
Department of Materials Science and Engineering, Virginia Tech, Blacksburg, VA 24061, USA
3
Department of Aerospace and Ocean Engineering, Virginia Tech, Blacksburg, VA 24061, USA
*
Author to whom correspondence should be addressed.
J. Manuf. Mater. Process. 2024, 8(4), 140; https://doi.org/10.3390/jmmp8040140
Submission received: 22 May 2024 / Revised: 25 June 2024 / Accepted: 27 June 2024 / Published: 28 June 2024
(This article belongs to the Special Issue Advances in Directed Energy Deposition Additive Manufacturing)

Abstract

:
Melt track width can vary in a wire-arc-directed energy-deposited material (DED) using a constant set of process parameters, leading to a lower-quality build. In this work, a novel framework is proposed that uses the data from the process parameter development stage to create optimized process parameters for a target layer width at different interpass temperatures without hot cracking. Inconel 718 is used as the model material since it is known to suffer from hot cracking during DED processing. In the proposed framework, a process window containing a few sets of process parameters (torch travel speed and wire feed rate) is established for crack-free deposition of Inconel 718, and these parameters are used to create a small database. A linear regression model is then employed to generate interpass-temperature-specific optimized process parameters for a target melt track width. The results demonstrate that the proposed approach can reduce the melt track width variation in the deposited walls from 12% to 3% error on average under different printing conditions. It also demonstrates that interpass temperature (IPT) can be used as a controlled variable and the optimized process parameters as initial values when applying control techniques to the process.

1. Introduction

Wire arc additive manufacturing (WAAM) is a directed energy deposition (DED) technology that uses welding techniques to create objects in 3D. Wire-arc DED has many advantages such as low-cost wire feedstock and relatively high deposition rates [1,2]. Although many welding modes can be used for wire-arc DED, cold metal transfer (CMT) is a preferred method because it reduces heat input and improves arc stability by physically retracting the wire and creating droplet detachment [3]. In traditional metal inter-gas welding (MIG), this is achieved by increasing the current which increases the overall heat input to melt the wire. Even with CMT, wire-arc DED has several drawbacks such as heat accumulation, changing local thermal environment, high residual stress, and distortion [4,5].
This paper focuses on Inconel 718, a high-strength, corrosion-resistant nickel chromium material widely used in high-temperature applications [6]. It is well documented in the literature that this material experiences crack-like defects in welding, wire-arc DED, and laser powder bed fusion (LPBF) processes [6,7,8]. The two most common types of cracking in Inconel 718 are solidification cracking and liquation cracking [9]. Solidification cracking occurs in the fusion zone, the area that is fully melted while depositing a layer. Liquation cracking occurs in the heat-affected zone, the area that surrounds the fusion zone where the material has not melted but has experienced high temperatures [10].
While the two cracking mechanisms are distinct, they often occur together in wire-arc DED where the rapid heating and cooling cycles in the melt pool create conditions conducive to both types of cracks [8]. Therefore, methods to reduce both liquation and solidification cracking involve similar approaches, such as modifying wire composition to ensure consistent and stable deposition and/or optimizing processing conditions to alter microstructure and cooling rates [11,12].
Ye et al. found that reducing the heat input is a strategy that helps reduce or eliminate cracking in tungsten inert gas (TIG) welding of Inconel 718 [13]. In TIG welding, heat input can be reduced by adjusting the amperage (current) while maintaining other parameters constant. In CMT, the current, voltage, and wire feed speed are dependent on each other and cannot be controlled separately [14]. Reducing the heat input can be carried out by decreasing wire feed speed (this decreases current) or increasing torch speed. Decreasing the wire feed speed could lead to insufficient material feeding into the melt pool, causing an unstable arc and non-uniform deposition. Increasing the torch speed could lead to a more elongated melt pool, possibly resulting in higher cracking susceptibility [15]. Reduced heat input can also be achieved by varying multiple other parameters including shield gas composition, shield gas flow, and CMT welding parameters (characteristic curve, dynamic correction, arc length correction, etc.).
Optimizing cooling rates to minimize thermal gradients in the wire-arc DED process is another effective approach to prevent cracking. Radhakrishna and Rao found that faster cooling rates reduced the occurrence of crack-like defects [16]. In wire-arc DED, most practitioners optimize cooling rates with the use of dwell times between layers while monitoring the surface temperature of the part with sensors [17]. The temperature of the previous layer, just before depositing a new one, is referred to as interpass temperature (IPT). Setting a maximum limit for IPT promotes consistent cooling rates and helps prevent heat accumulation issues. Chen et al. found that excessive heat accumulation during AM increases the likelihood of cracking [7].
Several sensors are available for monitoring IPT, including pyrometers and infrared (IR) cameras. Pyrometers are easy to implement on a wire-arc DED machine, but they provide limited data for a specific spot size (~10 mm). Alternatively, IR cameras provide a comprehensive view of the entire layer at once, ensuring that the IPT remains within limits throughout. Although more challenging to implement, IR cameras offer broader coverage. Both pyrometers and IR cameras rely on emissivity calibrations, which could create errors and make the reading less reliable [18].
In addition to dwell times, some machines implement active cooling, which refers to the use of an auxiliary process to increase the cooling rate instead of relying solely on natural convection [19]. Different methods have been tested including using a water bath, cryogenic cooling, and a high flow of gas to cool the printed parts more efficiently [19,20,21]. However, in the case of large part fabrication under a high deposition rate, these active cooling methods during wire-arc DED processing can lead to varying thermal conditions [22]. These conditions are typified by varying thermal gradients not only along the build direction but also within individual layers. One of the resulting effects is melt track width variation and hence part dimensional inaccuracy, particularly in thin walls consisting of single weld beads. Dimensional inaccuracy can lead to stress concentration and unstable arc which can increase the risk of cracking. Additionally, it can result in more material needing to be deposited and machined, thus increasing the overall cost.
Different techniques have been used to overcome dimensional inaccuracy issues including closed-loop feedback control and layer-by-layer adaptive control [23,24,25,26]. Xia and Pan developed a vision-based closed-loop feedback control to maintain a consistent track width [23]. Wang et al. also proposed a vision-based control that is based on reinforcement deep learning instead of a traditional controller. Li et al. and Ščetinec et al. were able to apply closed-loop feedback control in the vertical direction (layer height) instead of the track width [25,26]. Mu et al. developed a model-based adaptive control system that adjusts process parameters in real-time, layer by layer, to account for variations and disturbances during the manufacturing process [27]. Implementing closed-loop or real-time control techniques can offer significant advantages such as improved geometrical accuracy and consistency. However, it also presents several challenges including increased system complexity and cost, time-consuming parameter tuning, and challenging material/system qualification process [28].
Developing process parameters is a necessary step before implementing advanced techniques like closed-loop control. This step not only generates a set of optimized or baseline process parameters but also produces valuable data, which is often not carried over to the control implementation stage. This paper introduces a novel framework that leverages data from the process parameter development stage to create a set of IPT-specific optimized process parameters targeting a specific melt track width. The approach involves conducting a small design of experiments and utilizing a regression model to correlate wire feed speed (WFS), travel speed (TS), IPT, and melt track width (MTW). Although many other parameters affect melt track width, the authors selected these four parameters and kept the rest constant to reduce the size of the DOE.
The advantages of this technique include no additional hardware needed, low cost, ease of implementation, and straightforward qualification. Furthermore, the IPT-specific optimized process parameters and the data gathered from the initial process parameter development stage can serve as a starting point for closed or open-loop control techniques.
This paper is organized as follows. Section 2 outlines the experimental methods used to print and post-process samples. Section 3 provides all the results for both process parameter development and the optimized parameter approach, and Section 4 and Section 5 provide discussion and conclusions, respectively.

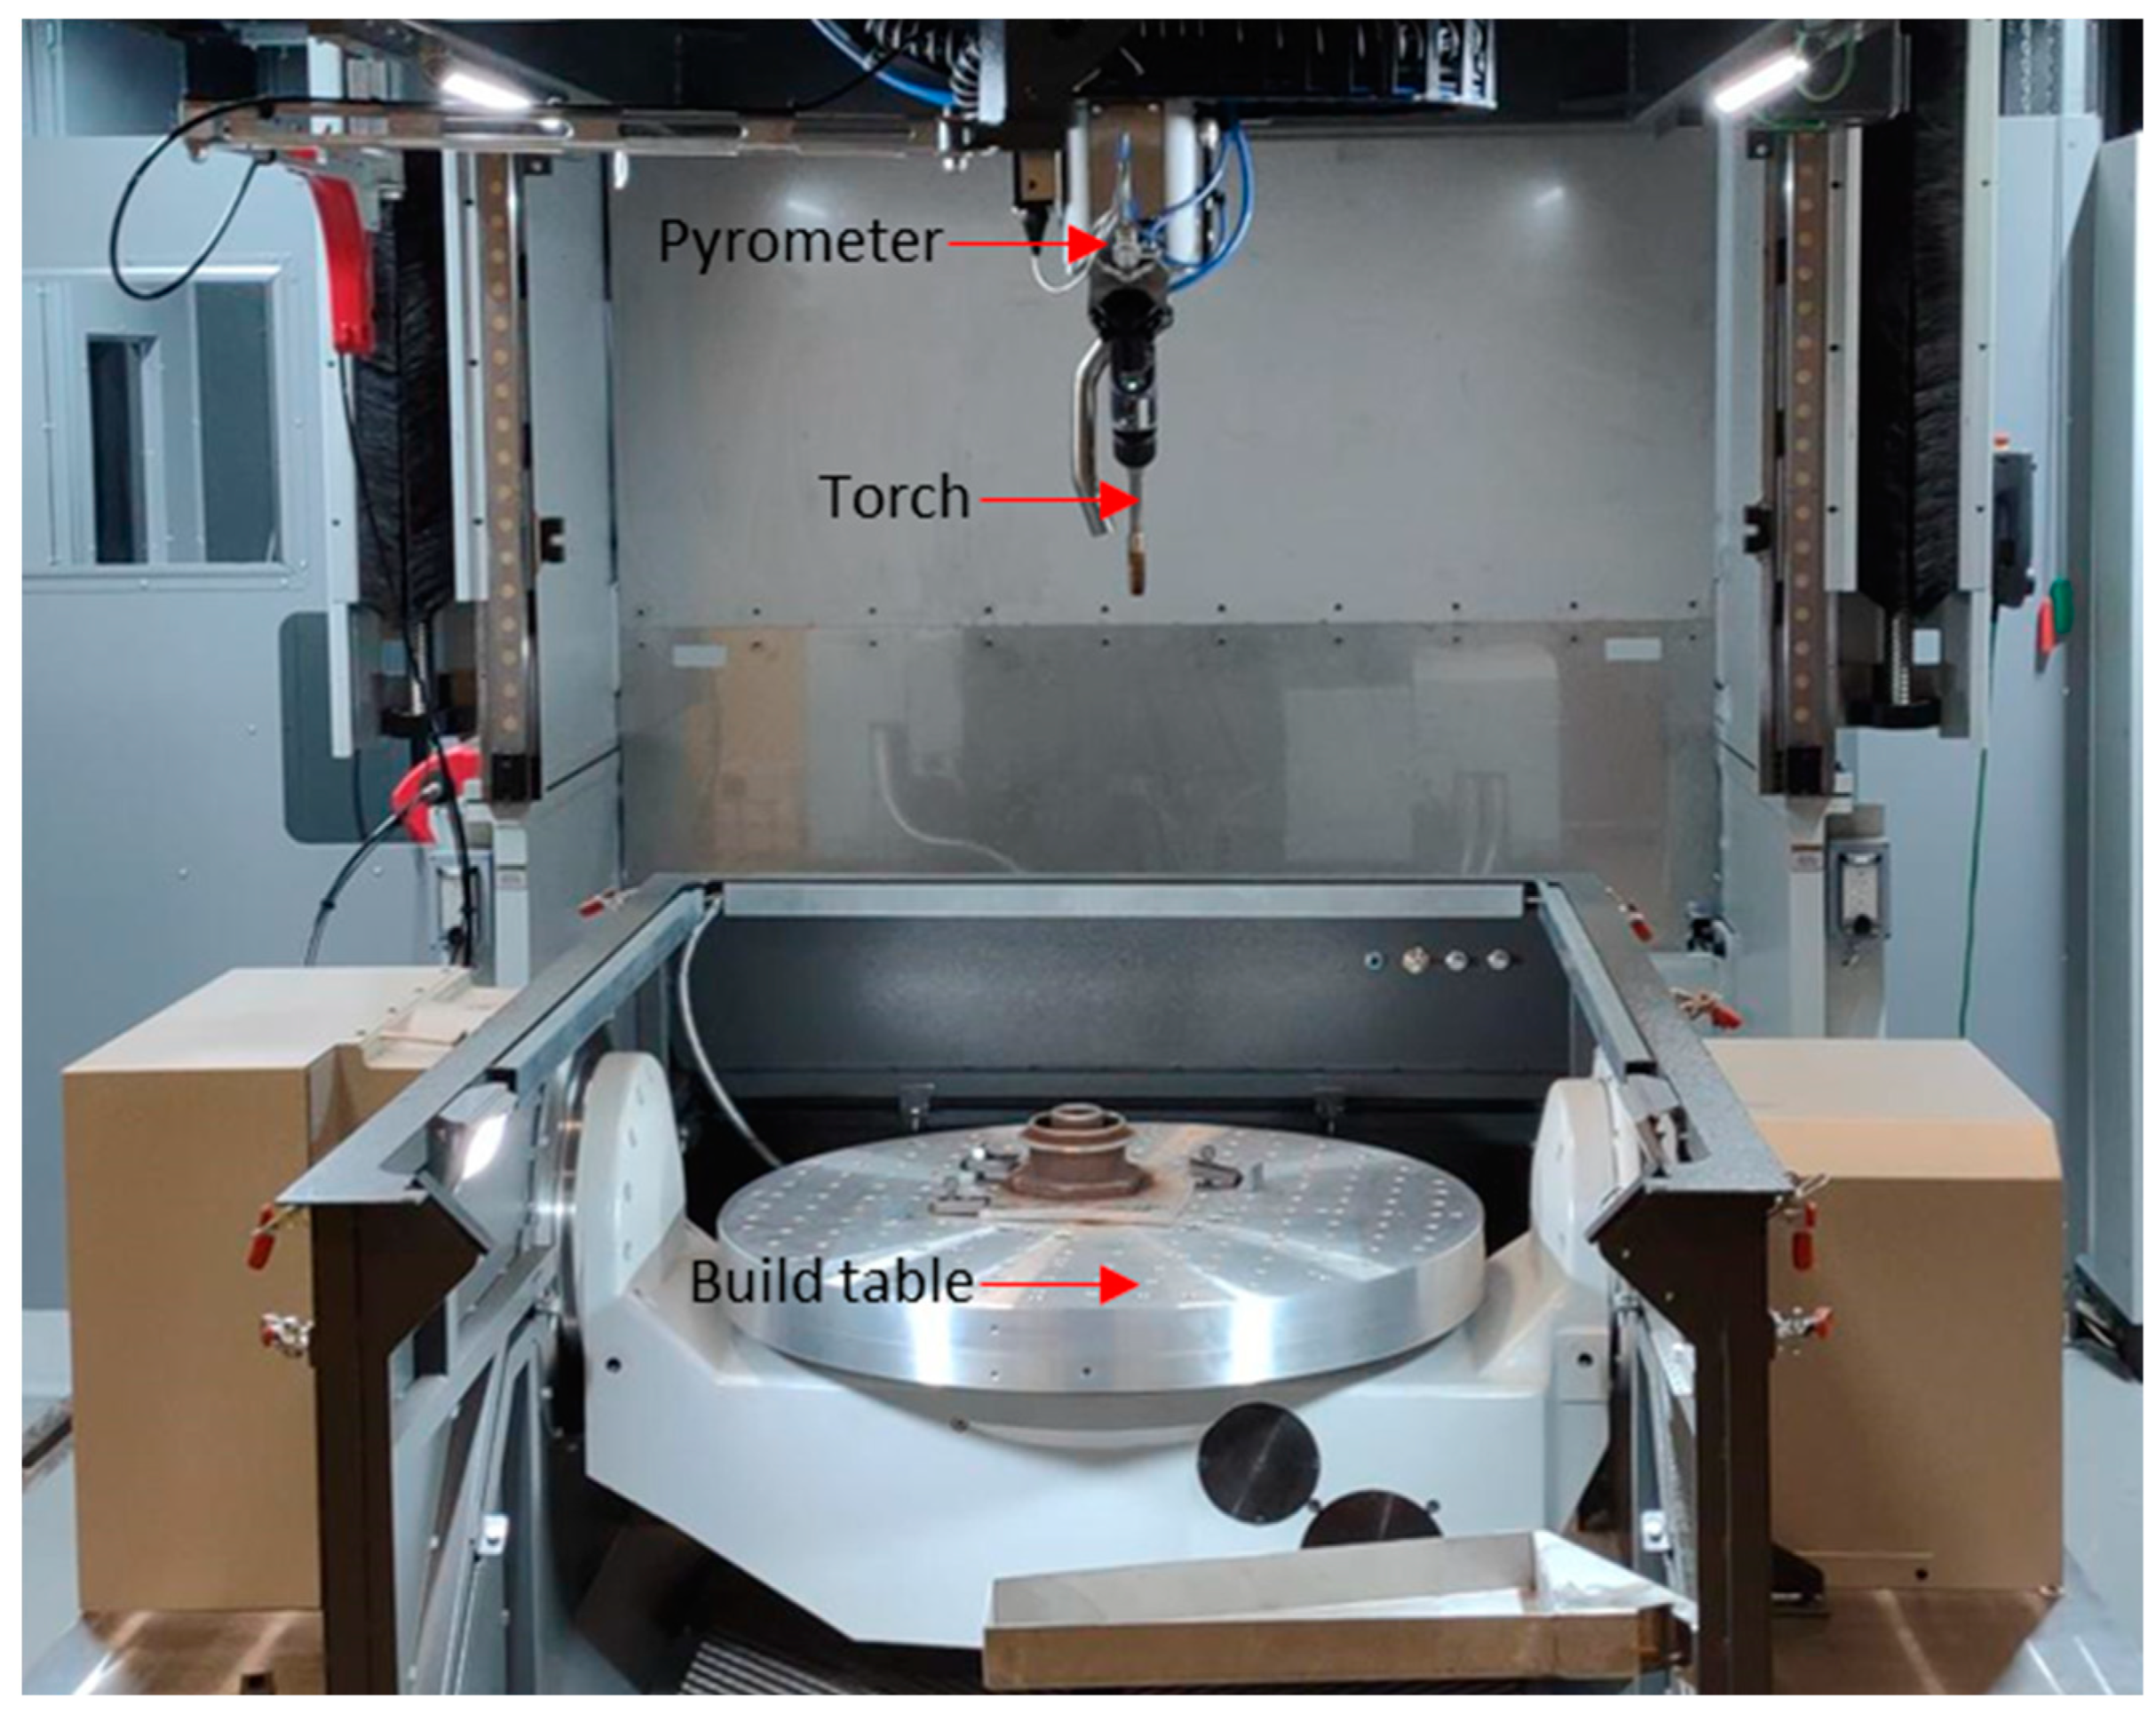
2. Materials and Methods

The machine used in this study was an Arc605 system manufactured by Gefertec (Berlin, Germany) as seen in Figure 1. This machine is a 5-axis CNC using a Fronius TPS 400i power source (Wels, Austria). Inside the welding power source, the user can manually input all values for each process parameter and save them under a specific job number (parameter number). Custom CAM software (Version 1.8.1.0) provided by Gefertec named CAM3DMP was used to slice all parts and create G-code files. Inside the software, all the parts can be imported and positioned and their respective job numbers can be assigned to each one of them. For this work, all deposited walls are printed using a bi-directional strategy (alternating start/stop locations). This strategy provides more uniform cooling rates and a consistent layer height near the start/ends of welds.
The Arc605 machine can perform active cooling, equipped with a Sensotherm Metis M318 single-wavelength pyrometer and a nozzle that blows compressed air. The active cooling is activated by a command in the Gcode file at the location where welding will take place next. Once the command is activated, the air nozzle turns on while the pyrometer monitors the IPT. Once the IPT reaches the set threshold, the air turns off and the welding process starts.
The emissivity of the pyrometer was calibrated by attaching a thermocouple to the surface of a printed wall and was determined to be 0.4. The wall was heated with a blowtorch to 300 °C, and the emissivity was adjusted to match that of the thermocouple and pyrometer. Initially, a heated plate was used instead of a blowtorch, but it failed to reach the desired temperature due to the thickness of the substrate plate and the size of the wall.
All the printing for this work was carried out on 10 mm thick Inconel 718 plates using 1.2 mm diameter Inconel 718 wires procured from Voestalpine Bohler (Düsseldorf, Germany). The shielding gas employed was CronigonNi10 (CO2 0.05%; H2 2%; He 30%; Ar 67.95%) from Linde at a flow rate of 15 L/min during processing. For this study, the only adjusted process parameters were the wire feed speed (WFS), torch speed (TS), and IPT.
The first design of experiments (DOE) was created to explore the entire process parameter space and understand the cracking behavior of Inconel 718 under different thermal conditions. Single-bead walls measuring 100 mm in length and 5 layers in height were printed using 20 different parameter combinations, as outlined in Table 1. The upper bound for wire feed speed (WFS) was set at 11 m/min, the maximum allowable value for the welder, while the lower bound (5 m/min) was chosen to maintain a melt track width close to 6 mm, a standard value used in parameter development. The TS was selected based on the operator’s previous experience with Inconel 718. The lower bound for IPT was established according to welding knowledge for nickel alloys to be 175 to 200 °C. The upper bound of 350 °C was chosen based on previous experience with nickel alloys showing diminished properties above that bound. Two specimens were printed at higher IPT to understand the effect of higher IPT on cracking behavior. To minimize the effect of printing on a substrate that is not temperature-controlled, a heating module was used to maintain the substrate plate temperature at the required IPT for each specimen. This technique is called preheat, and in this work, the preheat temperature and IPT values are the same. Adding preheat also ensures that each layer is printed at the required IPT as the deposition process might not reach a steady state behavior until around 10 layers.
The specimens were sectioned using electrical discharge machining (EDM). The cut samples underwent a series of preparation steps to achieve optimal surface quality. Initially, they were ground and polished using abrasive paper and subsequently refined through polishing with a 0.05 µm colloidal silica suspension. These prepared samples were then subjected to optical microscopic (OM) analysis at varying magnifications.
For scanning electron microscopy (SEM) analysis, the samples underwent additional processing. This included either vibration polishing or electropolishing. Electropolishing was carried out using a solution composed of 12.5 vol.% sulfuric acid and 87.5 vol.% methanol, applying a potential of 25 V at room temperature. Electrolytic etching was also performed in a 10 vol.% saturated oxalic acid solution at 12 V for a few seconds. The SEM was performed on a JEOL JSM-IT500HR (Peabody, MA, USA) at 30 kV accelerated voltage using a Schottky field emission (FEG) electron source.
The second DOE was created to be used as the database for regression modeling. The WFS and TS values for this DOE were selected in the “crack-free” area identified in the first DOE. As seen in Table 2, the WFS range used in this DOE has an upper bound of 8 m/min and a lower bound of 4 m/min. The TS has an upper bound of 960 mm/min and a lower bound of 480 mm/min. The IPT lower bound was chosen to be room temperature to ensure data were available at that temperature. The upper bound was selected to be 400 °C, the midpoint between a crack-free specimen (specimen 11) and a cracked specimen (specimen 19).
The geometry of the walls was also modified to 20 layers in height and 80 mm long. The height was designed to ensure the deposition process and the wall width has achieved a steady state. The shorter length was selected to reduce specimen size.
The ratio between TS and WFS is commonly used in welding and wire-arc DED to control bead geometry, deposition rate and overall quality of the bead. Ideally, all the specimens printed at a single IPT using a constant TS/WFS ratio (TS/WFS ratio = 120) should have consistent melt track widths. Due to the nature of the CMT process, the welding source internally runs a closed-loop feedback control to ensure a stable arc which creates differences in actual WFS, voltage and current used. As seen in Table 2, the melt track width varies in all cases using the same IPT, which demonstrates the need for a model to correlate the width with process parameters.
As seen in Figure 2, a cross-sectional cut in the middle of the walls was taken using EDM and the melt track width was measured using a Keyence VR-3200 optical profilometer (Osaka, Japan). The width was taken as the average of three measurements conducted along the height of the specimen.
The regression model was used to create a set of new IPT-specific process parameters targeting a wall width of 7 mm, as shown in Table 3. These new process parameters were manually entered into the power source. The pyrometer subroutine inside the machine was modified to not only check for IPT but also automatically change process parameters based on the desired IPT threshold. For example, if a layer has a prescribed maximum IPT threshold of 200 °C, the machine will activate the air nozzle and allow the part to cool down to the required temperature. Once the temperature is reached, it will automatically switch to the 200 °C IPT parameter from Table 3. If the IPT of the layer is already below the maximum IPT threshold of 200 °C, the pyrometer will measure the temperature and change the process parameters accordingly.
Five test cases were devised to ensure the process parameters could maintain the target wall width even with changing thermal conditions. Case 1 involves a wall with 10 layers and random maximum IPT thresholds for each layer. Case 2 features a wall with 20 layers and a constant maximum IPT threshold of 400 °C. Case 3 is another random IPT threshold test case but with 20 layers. Case 4 comprises a wall with 20 layers and a constant IPT threshold of 150 °C. Case 5 is similar to Case 4, except the IPT was measured at the ends of the wall instead of the center. Given the bi-directional printing strategy, the location for the IPT measurements alternates between both ends of the wall for Case 5.
Figure 3 shows the different IPT values, number of layers, and IPT measurement locations used for each case. The shorter 10-layer walls were designed to test the effect of adjusting process parameters while remaining close to the substrate. In some cases, the IPT for a specific layer might be below the threshold defined in Figure 3. For those cases, the IPT will be recorded to switch to the appropriate process parameter, and the printing process will continue without idle time.

3. Results

3.1. Process Parameter Development Results

The initial design of experiments (DOE) was developed to explore the entire process parameter space and understand the cracking behavior of Inconel 718 under various thermal conditions. The deposition for all the process parameters from Table 1 was stable and no errors were encountered during printing. Figure 4 shows the process map with respect to cracking at an IPT of 150 °C. The process parameter space can be divided into two zones, crack and crack-free. Increasing the wire feed speed (higher heat input) increases the occurrence of cracking, but cracking also shows up at higher TS.
Figure 5 shows the evolution of porosity and cracking with increasing WFS and TS while keeping a constant IPT of 150 °C. The crack observed in Figure 5F is representative of the cracks observed in the rest of the samples in the cracked zone.
At the higher IPT of 350 °C, the crack zone is larger, with instances of cracking occurring at lower WFS, as seen in Figure 6. Crack-free specimens are achieved at high deposition rates; however, these specimens also exhibit humping (Figure 7). Humping in welding refers to bead irregularities that appear as raised or hump-like formations along the weld bead. This defect typically occurs in high-speed welding processes and is characterized by periodic, excessive build-up of weld metal, leading to a non-uniform weld bead. The final two specimens from Table 1 are printed at 450 °C and 550 °C, with cracking found in both samples.
Using the results from the first DOE, a process window can be established for selecting process parameters which will result in crack-free specimens up to an IPT of 350 °C. Although the IPT for Inconel 718 is usually maintained at or under 150 °C, for the purpose of this work, the goal was to find the highest crack-free IPT possible [29]. The higher IPT makes it easier to study the effects of implementing the IPT-specific process parameters.

3.2. Linear Regression Model
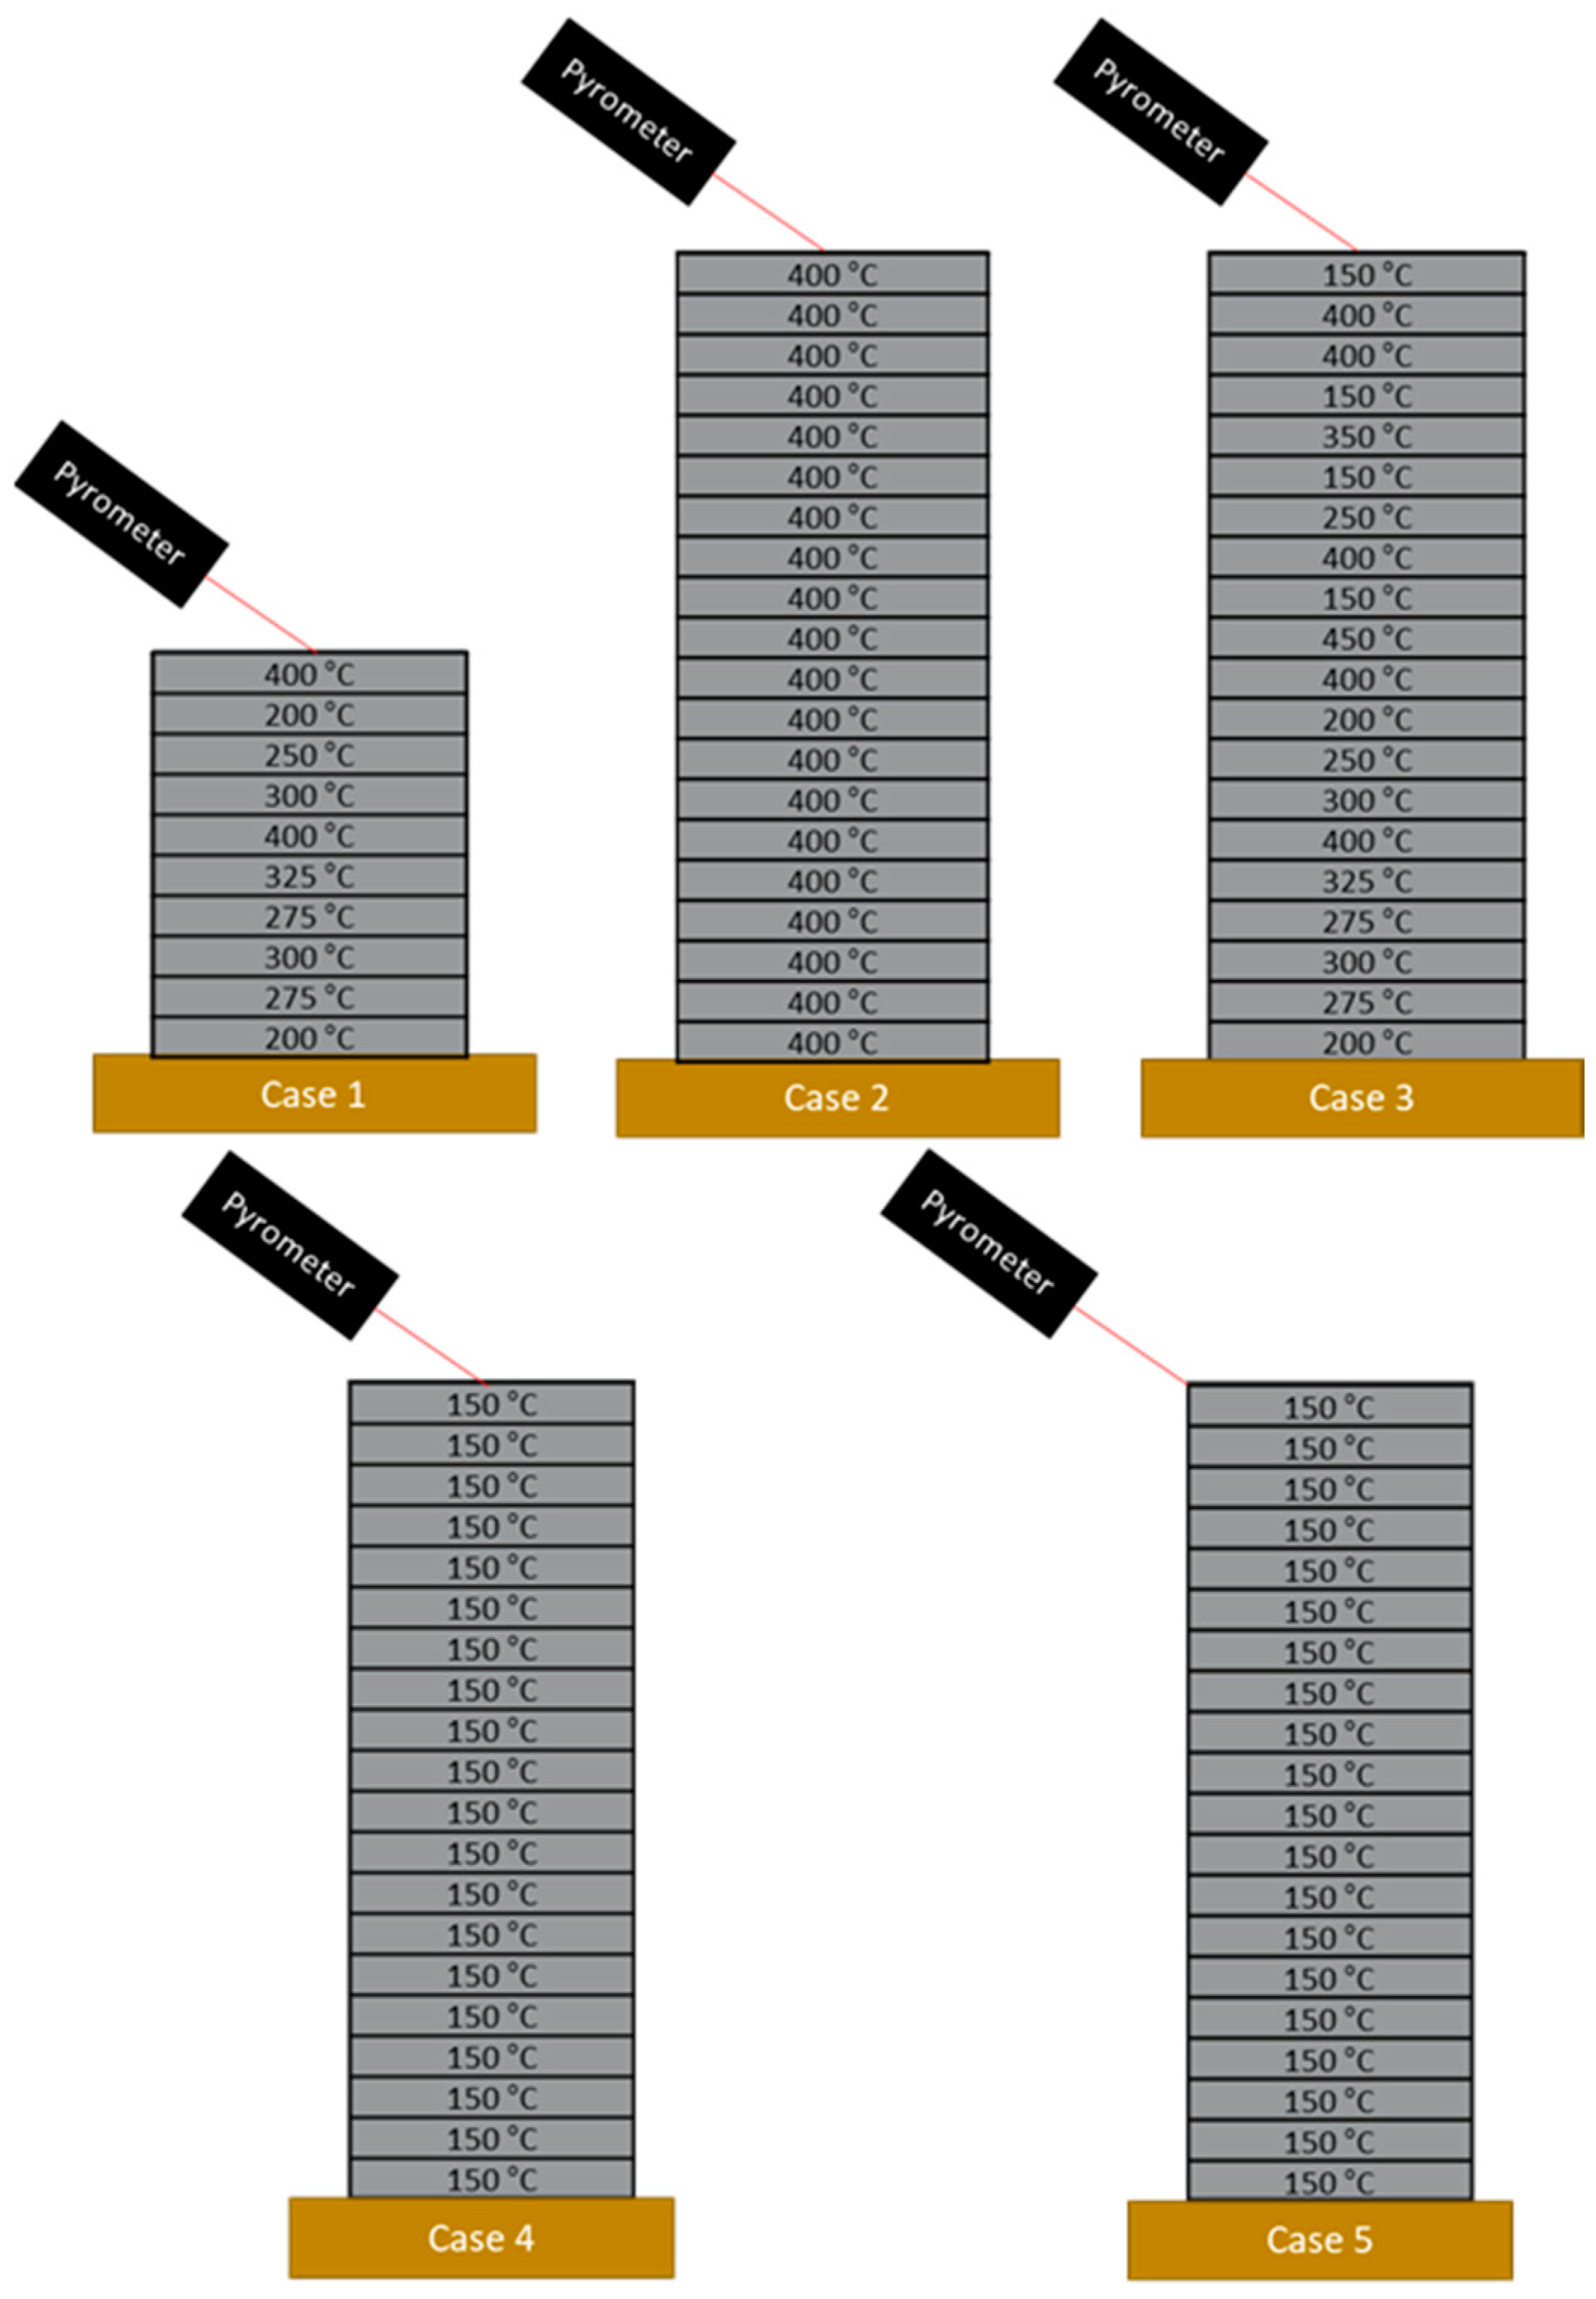
A model that correlates WFS, TS, IPT, and melt track width was created using the data from the second DOE (Table 2). A linear regression model with two inputs and two outputs was created in Python using the library SKLearn. The inputs to the model were melt track width and IPT, while the outputs were WFS and TS. Different types of regression models, including polynomial, logistic, lasso, and ridge, were tested but did not perform as well as the linear regression model. Due to the small sample size, it is possible that the more complex models were overfitting the data.
The data are preprocessed and then normalized. In total, 20% of the data is held out for the test set. A linear regression model is fitted to the rest of the data. The R2 score for the model is 0.9 and a plot of the fit is shown in Figure 8. Equations (1) and (2) show the coefficient for the regression model where MTW is the melt track width:
W F S = I P T   ×   9.49   ×   10 3 + M T W   ×   3.460 14.72
T S = I P T   ×   1.39 + M T W   ×   4.15   ×   10 2 1766.82
The model was utilized to generate 13 IPT-specific optimized process parameters aiming for a target melt track width of 7 mm. This target width was selected to keep the calculated process parameters within the established process window developed during the parameter development stage. Choosing a larger or smaller target width could result in some process parameters falling within the crack zone. Table 3 presents the final process parameters for the 7 mm target width. Both the WFS and TS are positioned within or very close to the crack-free zone outlined in previous sections to ensure the achievement of crack-free deposition.

3.3. Test Cases

For test cases 1, 2, and 3, two walls are printed: one utilizing a single parameter for the entire deposition process (fixed parameter), and the other automatically adjusting parameters from Table 3 based on IPT (IPT-specific optimized process parameters). Table 4 presents the results from these cases. With optimized parameters, the error between the target and actual width remains below 3.5%, while maintaining a low standard deviation of 0.05 mm across all cases. Conversely, utilizing fixed parameters leads to an error exceeding 12%, with the standard deviation rising to 0.40 mm among all cases. As expected, the printing time for optimized parameters is longer than for fixed parameters, as the optimized torch speed decreases with increasing interpass temperature. Figure 9 highlights the results from Case 3, revealing a noticeable difference: the wall built with fixed parameters displays varying width along its height and lacks straightness, while the wall constructed with optimized parameters appears much straighter in comparison. It is important to note that the difference in color does not convey any additional information and is solely related to the image capture settings.
In Cases 4 and 5, the same process parameters were used for both walls but the location for the pyrometer temperature reading was different. Table 5 shows the results where the melt track width and printing time had a difference of 0.26 mm and ~5 min, respectively.

4. Discussion

Inconel 718, a widely used nickel-chromium alloy, is highly susceptible to cracking [6,7,8]. The two main types of cracking in this material are liquation cracking and solidification cracking [10]. Although these are different phenomena, the methods to reduce both types of cracks are quite similar.
To understand the cracking behavior of this material, an initial design of experiments (DOE) was conducted to explore the process parameter space. At a lower IPT of 150 °C, the results show that cracking can be avoided by using a lower wire feed speed (WFS), regardless of the selected travel speed (TS). In CMT welding, WFS is the primary control method of heat input, as voltage and amperage are functions of WFS and cannot be adjusted independently. This finding aligns with the results by Ye et al. [13], who found that reducing heat input helps reduce or eliminate cracks. However, using a lower WFS leads to lower deposition rates and increases printing time. Ideally, the selected WFS should be as high as possible while staying in the crack-free zone.
Another method to reduce heat input, although less effective, is to increase the TS. However, our results show that increasing the TS generally makes the deposited material more susceptible to cracking. For instance, in specimen 4 (WFS: 8 m/min; TS: 500 mm/min), cracking is absent, while in specimen 6 (WFS: 8 m/min; TS: 1500 mm/min), cracking occurs despite using the same WFS. Cracking at high TS can occur due to several interrelated factors, including elongation of the melt pool, steep thermal gradients, and inadequate time for metallurgical reactions [30]. The effect of reducing heat input by increasing the TS is dominated by these detrimental effects accompanied.
At a higher IPT of 350 °C, the thermal gradients between the molten and solid material are lower, which should help prevent cracking. However, cracking occurs at a lower WFS compared to the lower IPT, as seen in specimen 8 (WFS: 8 m/min; TS: 500 mm/min). This is due to the increased heat input, which negates any benefit from having a lower thermal gradient. Specimen 18 (WFS: 11 m/min; TS: 1500 mm/min) stands out as it lacks cracking even at the highest WFS. Here, the heat input might be in equilibrium, with the high TS reducing it and the high WFS and IPT increasing it. Despite the crack-free results, the specimen shows signs of humping attributed to the high TS [31]. Humping can lead to increased solidification cracking vulnerability, especially when building larger parts with high residual stresses. The wavy deposition also leads to poor surface quality and inconsistent fusion between layers.
The final specimens 19 and 20 display cracking, suggesting a maximum IPT between 350 and 450 °C. Overall, the process window for Inconel 718 appears to be well defined, allowing for crack-free deposition even at higher IPTs. These results can inform parameter selection for achieving crack-free deposition across varying IPTs. It should be noted that in this work, higher IPTs were used to highlight the approach of automatically assigning IPT-specific optimized process parameters. Higher IPTs have detrimental effects on mechanical properties and microstructure, while lower IPTs enable improved properties but increase the dwell time between layers. Selecting a suitable IPT for the material involves considering multiple factors, including mechanical properties, microstructure, printing time, and heat treatment.
The linear regression model proved successful in correlating TS, WFS, IPT, and melt track width. If more parameters are considered, the authors believe more complex models will perform better but require larger datasets. The advantages of the linear model include the ease of interpretability of the results, which can provide insights into the physics of the process. The linear regression model was used to generate 13 process parameters that can be entered into the welding power source. If using a maximum IPT threshold of 175 °C, only 5 or 6 parameters would be required for printing. Qualifying a finite number of parameters is easier than qualifying a machine with closed-loop feedback control. In some cases, advanced control techniques are not even allowed due to stringent qualification standards for AM to date.
Test cases 1, 2, and 3 demonstrate the efficacy of achieving a target melt track width using parameters derived from the linear regression model. This success is notable given that many wire-arc machines struggle with real-time control due to limited control over power sources, as they often behave like “black boxes” where the user cannot access all the required data. Despite random IPTs, the melt track width had only a 3% error from the target of 7 mm, demonstrating the effectiveness of the proposed approach while showcasing the seamless implementation of process parameters without user intervention. This technique can be applied to customize wall width when printing single-bead walls without the need for additional experiments, requiring less waste material and reducing machining time and cost.
Cases 4 and 5 underscore the importance of selecting appropriate temperature check locations when using a pyrometer. Even in a small and simple geometry like a single-track wall, temperature distribution on the surface exhibits a gradient, with edges cooling faster than the center. This discrepancy is evident in the printing time, where the center location required almost 5 min longer to achieve the same IPT, highlighting the necessity of selecting temperature check locations to ensure no location on a layer exceeds the maximum IPT threshold. The printing strategy also affects the overall temperature distribution. The bi-directional strategy provides more uniform heating compared to a uni-directional strategy, which can cause a large temperature gradient across the layer.

5. Conclusions

In this work, we have presented a novel framework that allows for the creation of IPT-specific optimized process parameters from process parameter development data. A process window for printing crack-free Inconel 718 single-track walls was established, and these process parameters were used to generate a small database containing data on WFS, TS, IPT, and melt track width. A linear regression model was then employed to create IPT-specific optimized process parameters for a specific target melt track width. The following conclusions can be drawn:
(1)
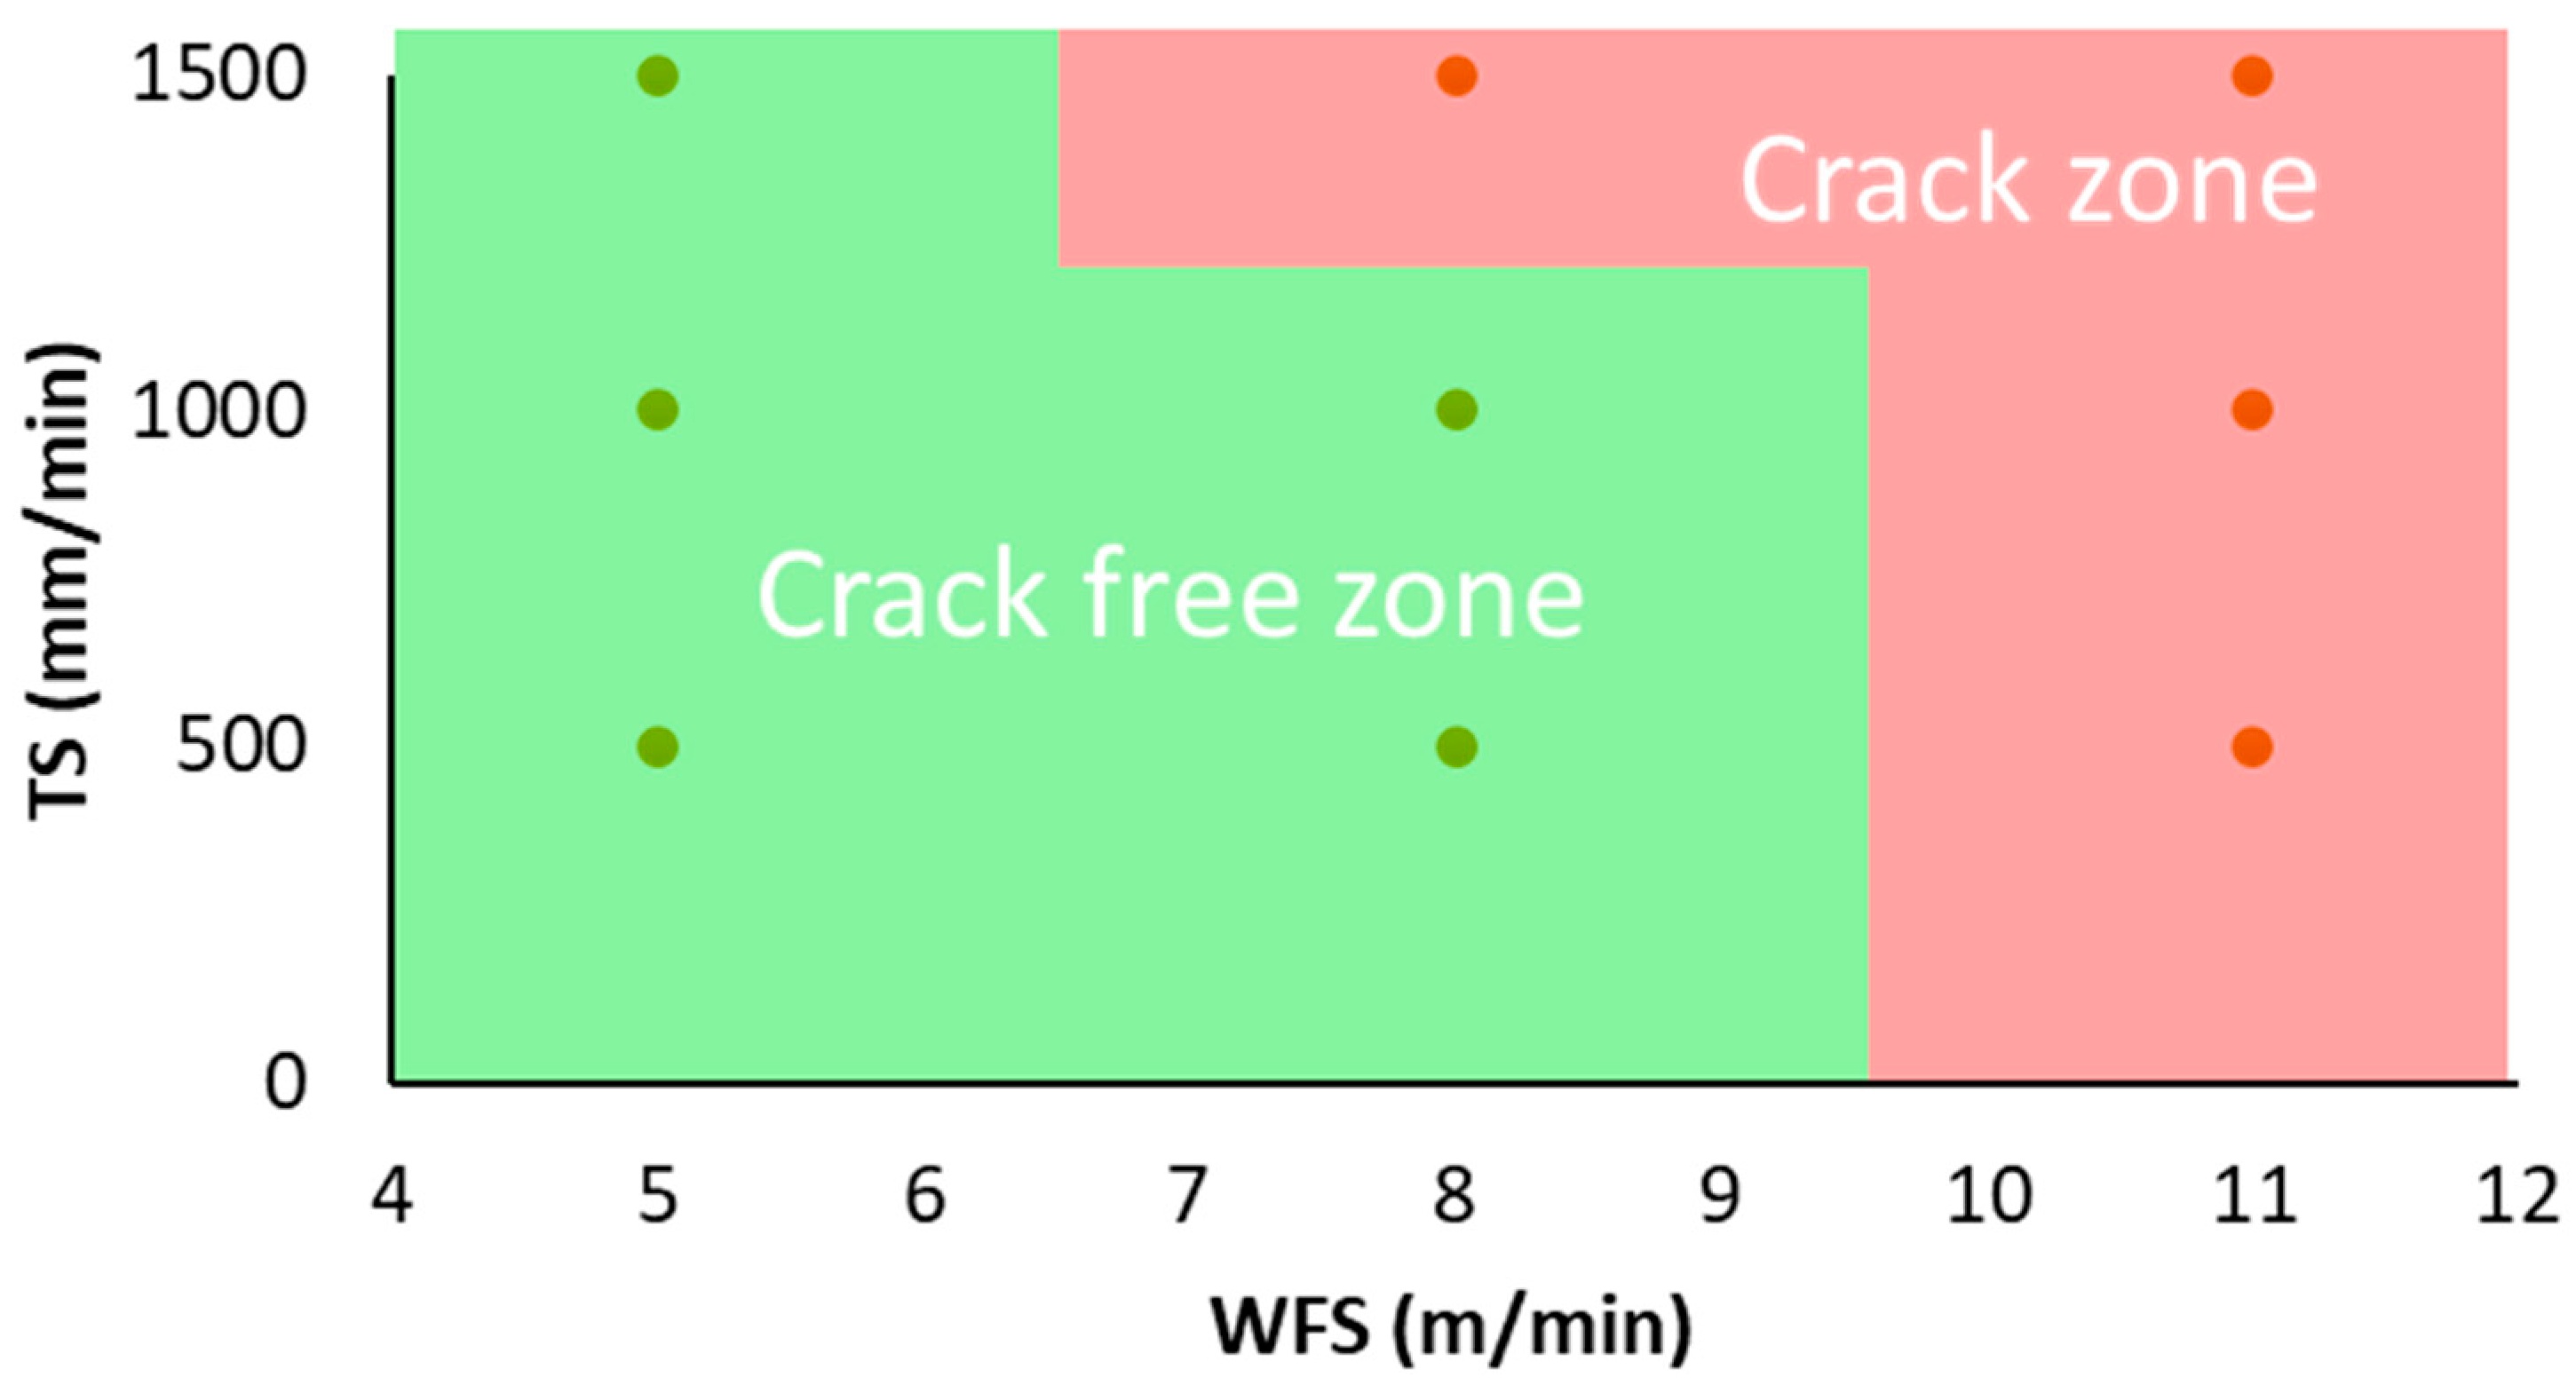
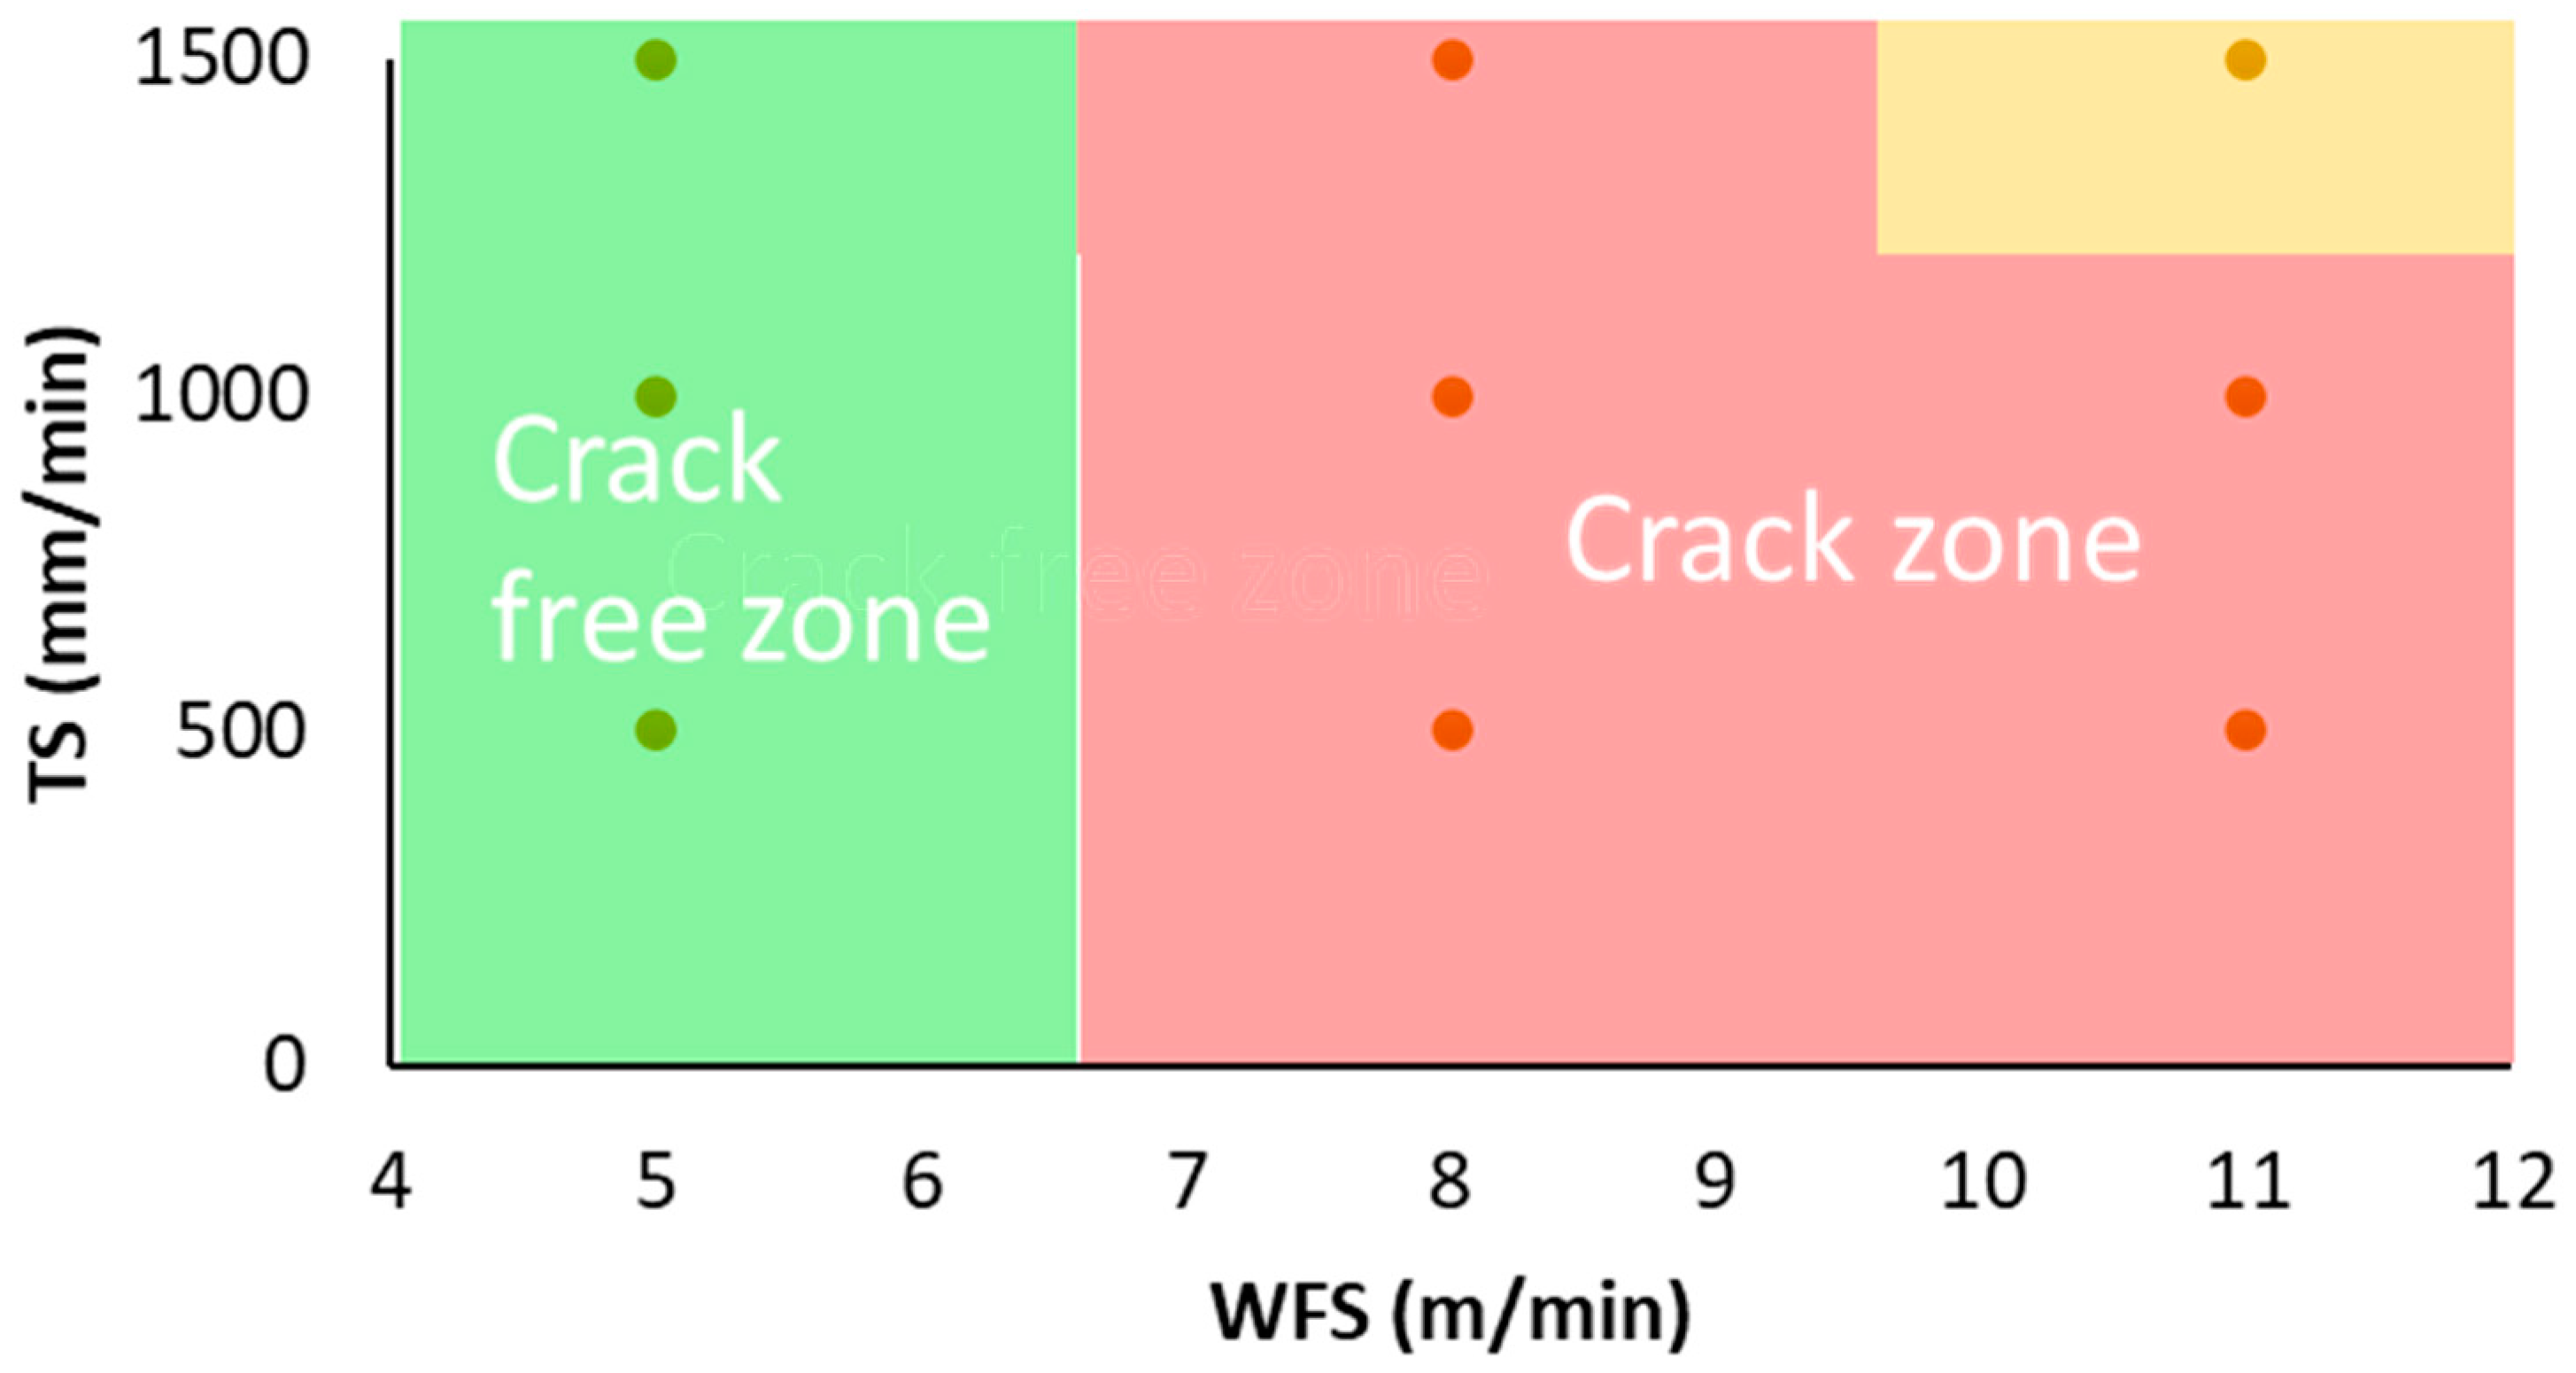
The process window for Inconel 718 is well-defined, allowing for crack-free deposition at varying IPTs (Up to 350 °C).
(2)
Cracking can be avoided by using a lower WFS (<8 m/min), irrespective of the TS.
(3)
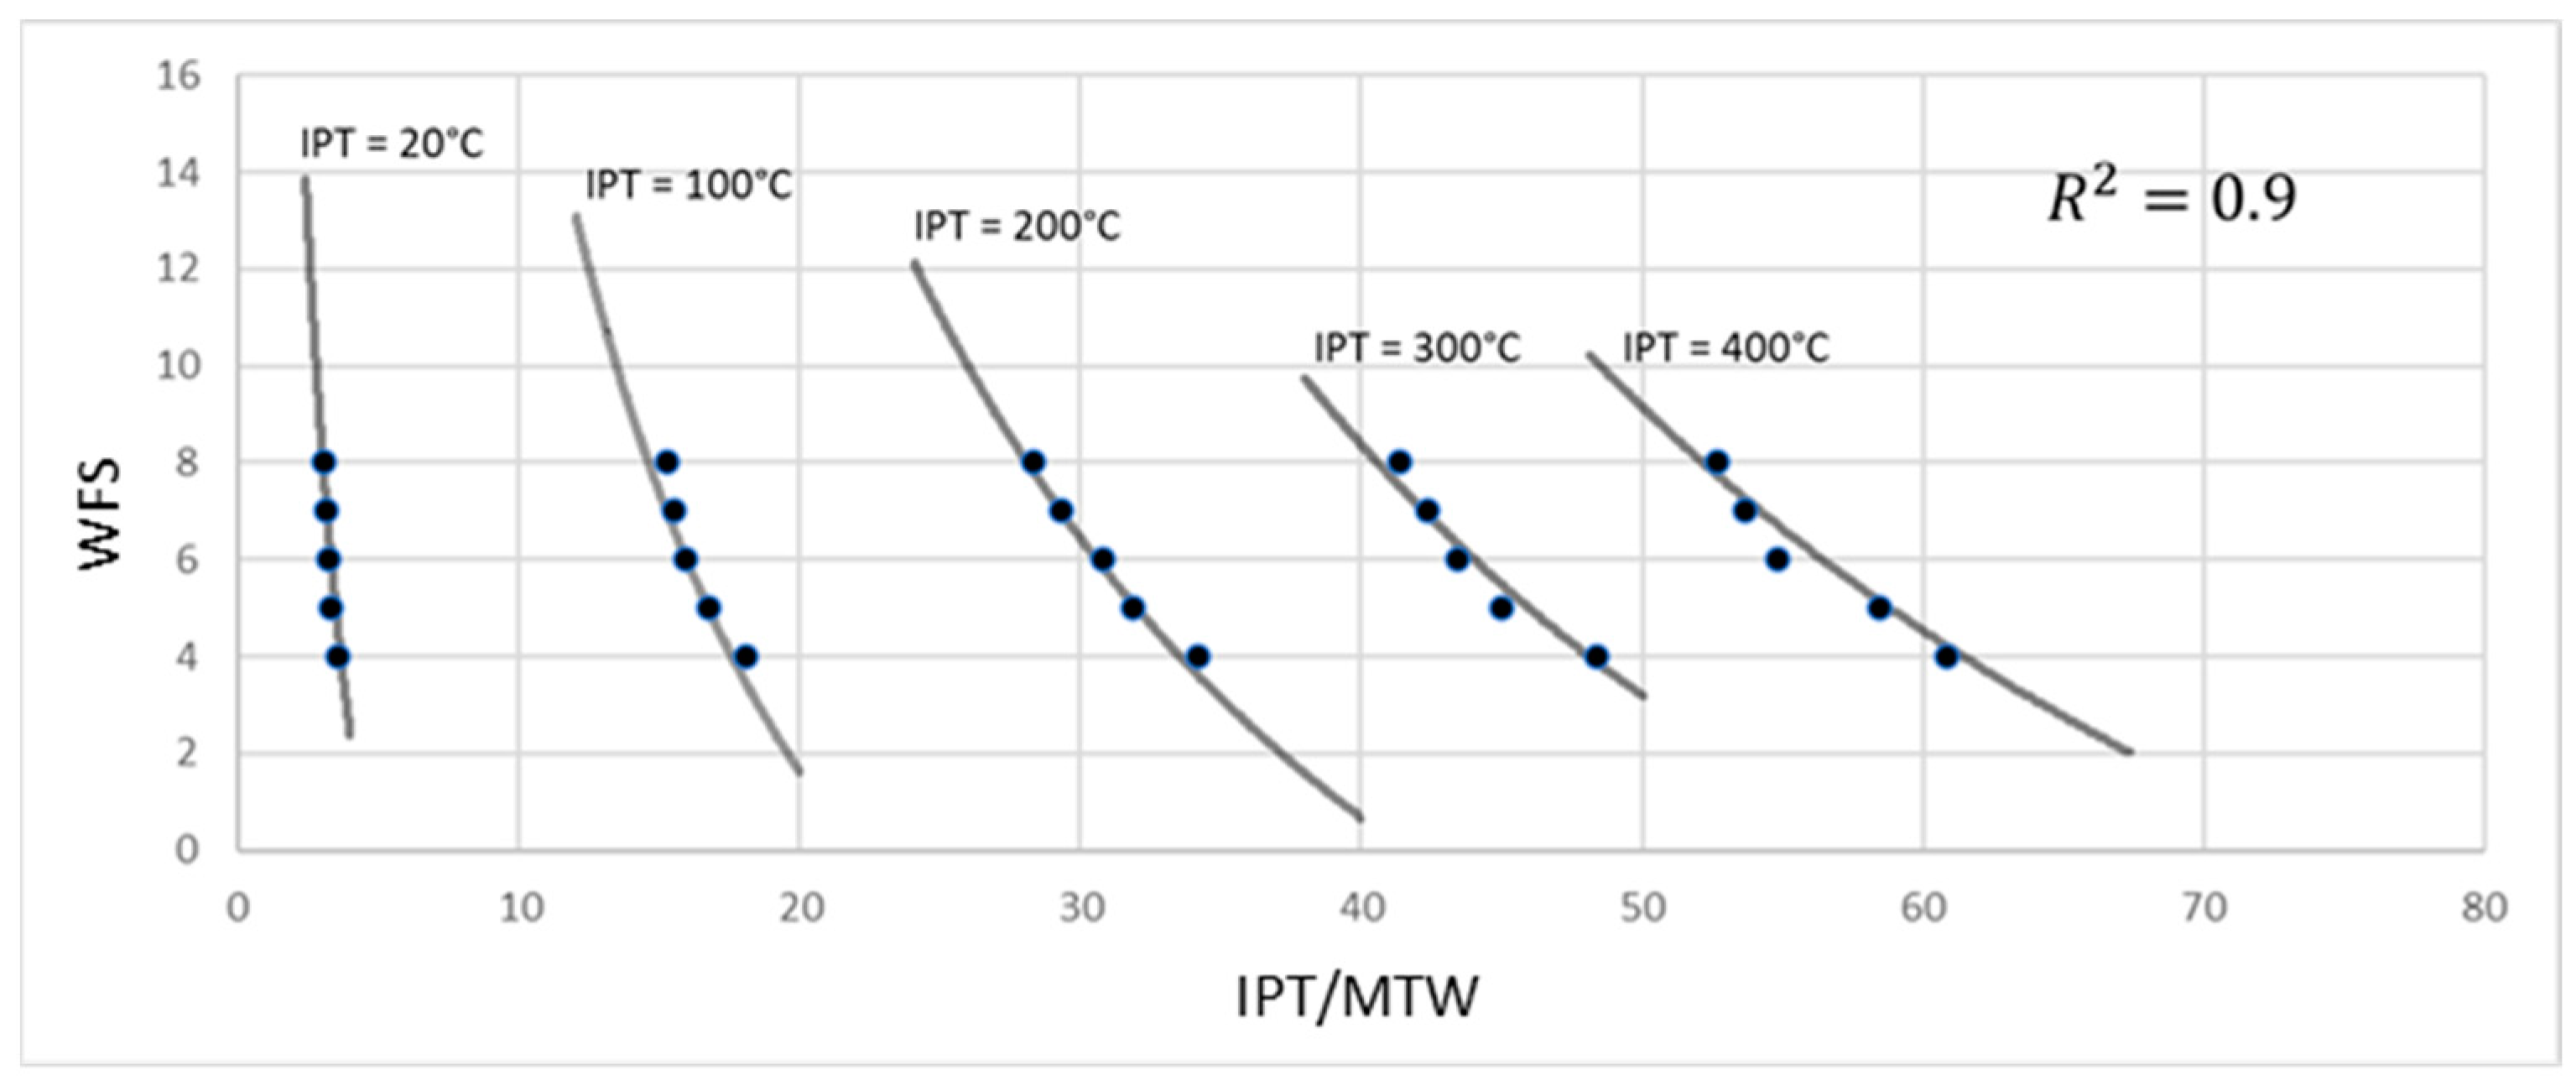
A linear regression model effectively correlates TS, WFS, IPT, and melt track width. Although more complex models could potentially offer better performance, the linear model provides easily interpretable results that offer insights into process physics (R2: 0.9).
(4)
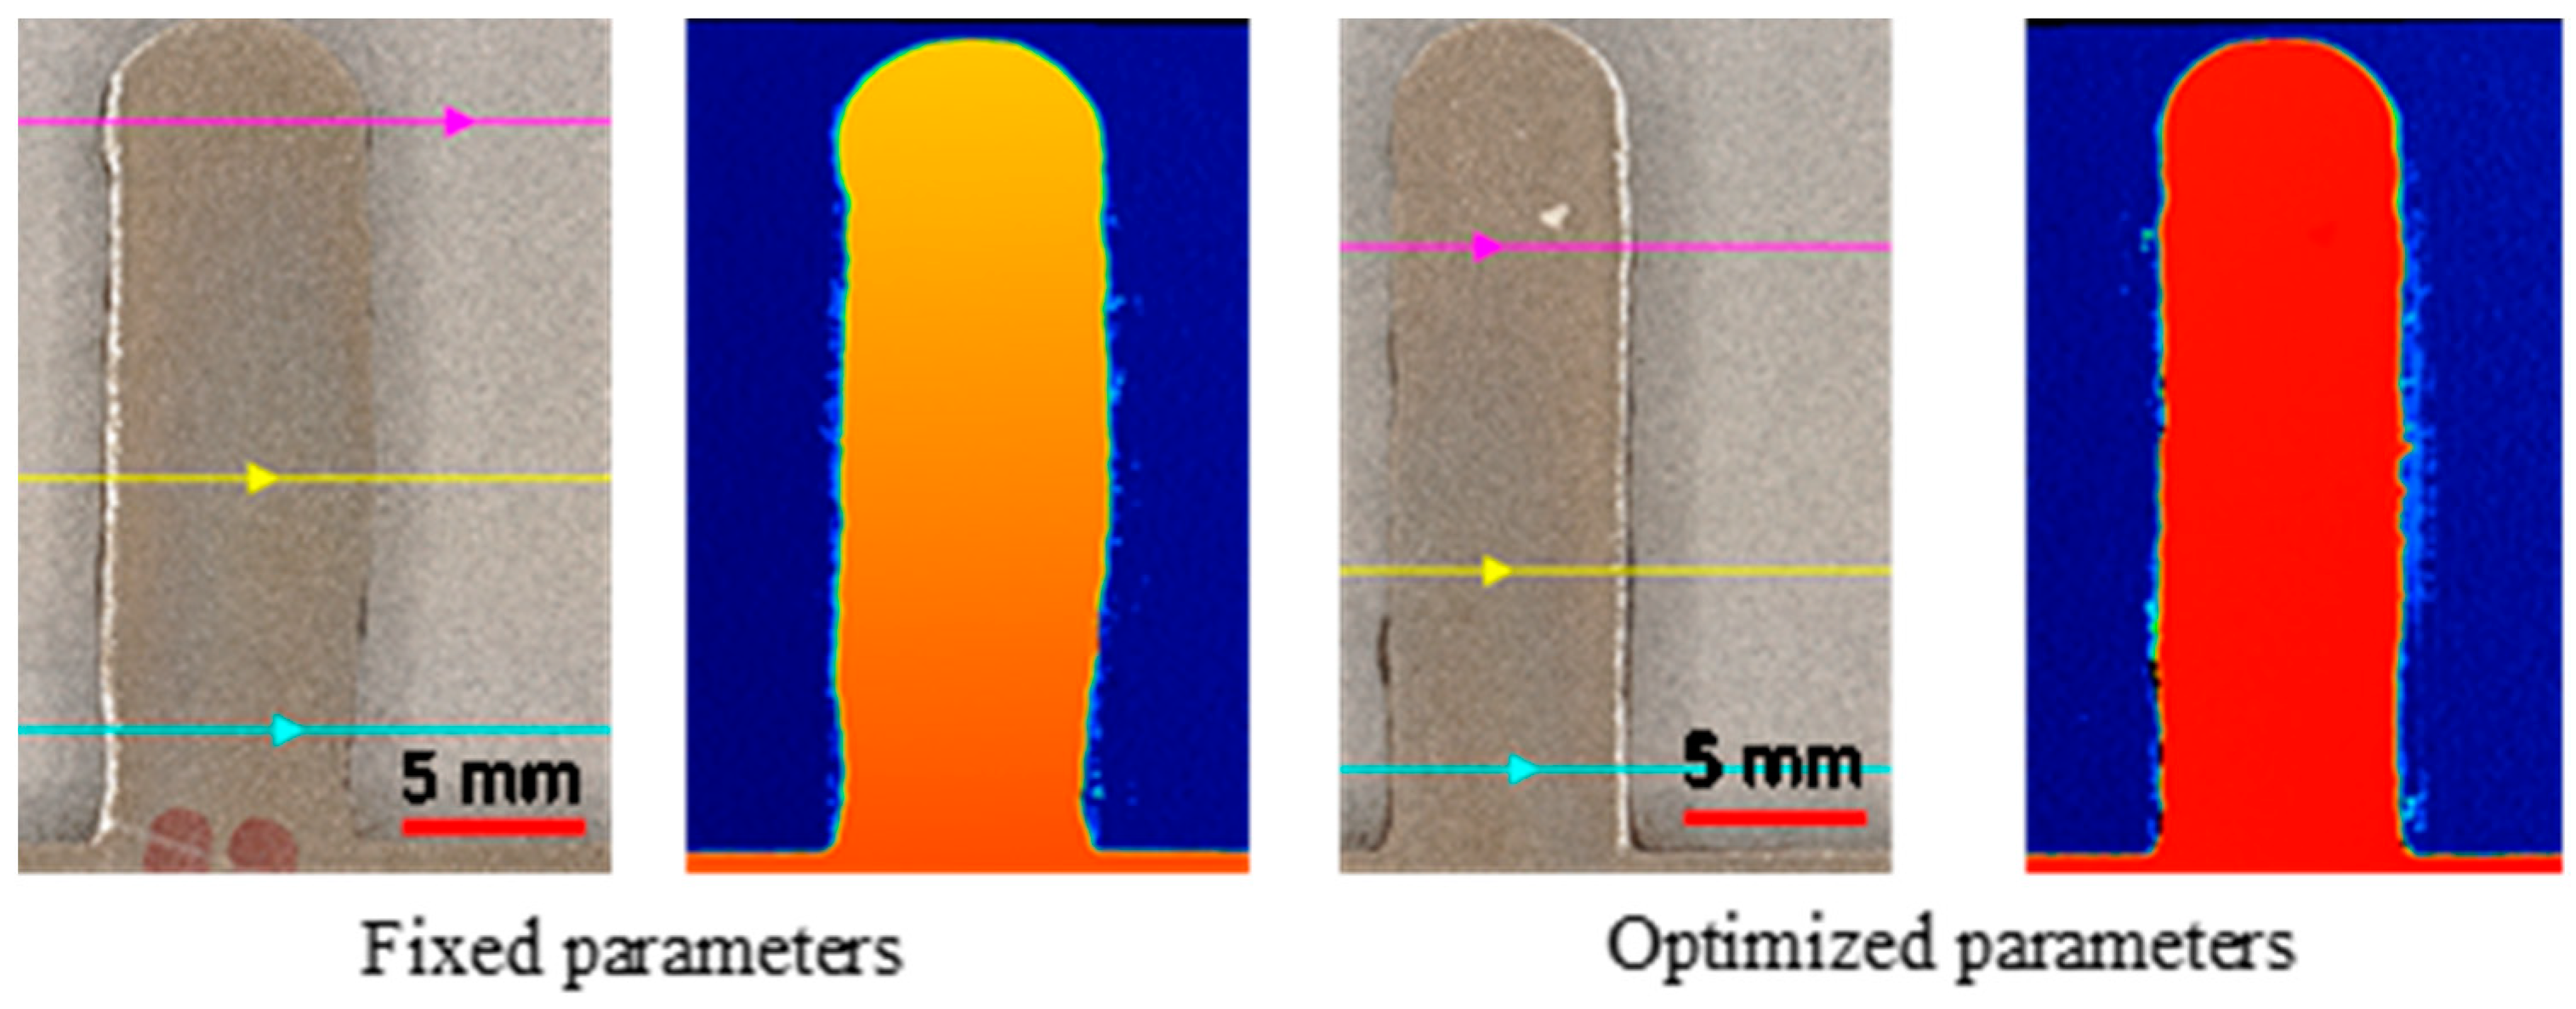
The study demonstrates that using parameters derived from the linear regression model can achieve the desired melt track widths efficiently (3% error), reducing the number of experiments, material consumption, machining time, and associated costs.
(5)
The location for temperature checks using a pyrometer must be selected with prior knowledge of the thermal conditions that the part will experience during printing. Failure to do this might result in sections of the part exceeding the maximum IPT threshold.
Although the technique applied in this paper was effective, it is limited to simple geometries with uniform cross-sections. Larger and more complex parts might result in very large temperature gradients for a single layer, and thus a single process parameter per layer might not be sufficient. This technique can be used in conjunction with control techniques to obtain real-time control of the melt track width. The paper demonstrates that IPT can act as a controlled variable when applying closed-loop feedback control. The optimized process parameters will serve as initial values for the control algorithm. Future research should explore how process parameters impact both the microstructure and mechanical properties of the material. This should involve comparing the effects of using fixed parameters versus IPT-specific ones on the material’s microstructure and mechanical properties.

Author Contributions

Conceptualization, X.A.J. and A.C.T.; methodology, X.A.J.; formal analysis, X.A.J., J.S. and Y.F.; investigation, X.A.J.; resources, X.A.J.; data curation, X.A.J.; writing—original draft preparation, X.A.J.; writing—review and editing, A.C.T.; supervision, A.C.T.; project administration, A.C.T.; funding acquisition, A.C.T. All authors have read and agreed to the published version of the manuscript.

Funding

This research was funded by U.S Army, grant number W31P4Q-20-C-0028.

Data Availability Statement

The original contributions presented in the study are included in the article, further inquiries can be directed to the corresponding author/s.

Conflicts of Interest

The authors declare no conflicts of interest.

References

  1. Wu, B.; Pan, Z.; Ding, D.; Cuiuri, D.; Li, H.; Xu, J.; Norrish, J. A review of the wire arc additive manufacturing of metals: Properties, defects and quality improvement. J. Manuf. Process. 2018, 35, 127–139. [Google Scholar] [CrossRef]
  2. Yi, H.; Yang, L.; Jia, L.; Huang, Y.; Cao, H. Porosity in wire-arc directed energy deposition of aluminum alloys: Formation mechanisms, influencing factors and inhibition strategies. Addit. Manuf. 2024, 84, 104108. [Google Scholar]
  3. Ryan, E.M.; Sabin, T.J.; Watts, J.F.; Whiting, M.J. The influence of build parameters and wire batch on porosity of wire and arc additive manufactured aluminium alloy 2319. J. Mater. Process. Technol. 2018, 262, 577–584. [Google Scholar] [CrossRef]
  4. Long, J.; Wang, M.; Zhao, W.; Zhang, X.; Wei, Y.; Ou, W. High-power wire arc additive manufacturing of stainless steel with active heat management. Sci. Technol. Weld. Join. 2022, 27, 256–264. [Google Scholar] [CrossRef]
  5. Gornyakov, V.; Ding, J.; Sun, Y.; Williams, S. Understanding and designing post-build rolling for mitigation of residual stress and distortion in wire arc additively manufactured components. Mater. Des. 2022, 213, 110335. [Google Scholar] [CrossRef]
  6. Zhang, L.N.; Ojo, O.A. Corrosion behavior of wire arc additive manufactured Inconel 718 superalloy. J. Alloys Compd. 2020, 829, 154455. [Google Scholar] [CrossRef]
  7. Chen, Y.; Zhang, K.; Huang, J.; Hosseini, S.R.E.; Li, Z. Characterization of heat affected zone liquation cracking in laser additive manufacturing of Inconel 718. Mater. Des. 2016, 90, 586–594. [Google Scholar] [CrossRef]
  8. Seow, C.E.; Zhang, J.; Coules, H.E.; Wu, G.; Jones, C.; Ding, J.; Williams, S. Effect of crack-like defects on the fracture behaviour of Wire + Arc Additively Manufactured nickel-base Alloy 718. Addit. Manuf. 2020, 36, 101578. [Google Scholar] [CrossRef]
  9. Srinivasan, G.; Bhaduri, A.K.; Shankar, V.; Raj, B. Evaluation of hot cracking susceptibility of some austenitic stainless steels and a nickel-base alloy. Weld. World 2008, 52, 4–17. [Google Scholar] [CrossRef]
  10. Gu, J.; Bai, J.; Ding, J.; Williams, S.; Wang, L.; Liu, K. Design and cracking susceptibility of additively manufactured Al-Cu-Mg alloys with tandem wires and pulsed arc. J. Mater. Process. Technol. 2018, 262, 210–220. [Google Scholar] [CrossRef]
  11. Artaza, T.; Bhujangrao, T.; Suárez, A.; Veiga, F.; Lamikiz, A. Influence of heat input on the formation of laves phases and hot cracking in plasma arc welding (PAW) additive manufacturing of inconel 718. Metals 2020, 10, 771. [Google Scholar] [CrossRef]
  12. Thavamani, R.; Balusamy, V.; Nampoothiri, J.; Subramanian, R.; Ravi, K.R. Mitigation of hot cracking in Inconel 718 superalloy by ultrasonic vibration during gas tungsten arc welding. J. Alloys Compd. 2018, 740, 870–878. [Google Scholar] [CrossRef]
  13. Ye, X.; Hua, X.; Wang, M.; Lou, S. Controlling hot cracking in Ni-based Inconel-718 superalloy cast sheets during tungsten inert gas welding. J. Mater. Process. Technol. 2015, 222, 381–390. [Google Scholar] [CrossRef]
  14. Selvi, S.; Vishvaksenan, A.; Rajasekar, E. Cold metal transfer (CMT) technology—An overview. Defence Technol. 2018, 14, 28–44. [Google Scholar] [CrossRef]
  15. Coniglio, N.; Cross, C.E. Effect of weld travel speed on solidification cracking behavior. Part 1: Weld metal characteristics. Int. J. Adv. Manuf. Technol. 2020, 107, 5011–5023. [Google Scholar] [CrossRef]
  16. Radhakrishna, C.; Rao, K.P. The formation and control of Laves phase in superalloy 718 welds. J. Mater. Sci. 1997, 32, 1977–1984. [Google Scholar] [CrossRef]
  17. Li, R.; Xiong, J. Influence of interlayer dwell time on stress field of thin-walled components in WAAM via numerical simulation and experimental tests. Rapid Prototyp. J. 2019, 25, 1433–1441. [Google Scholar] [CrossRef]
  18. Teng, S.; Dehgahi, S.; Henein, H.; Wolfe, T.; Qureshi, A. Effect of surface texture, viewing angle, and surface condition on the emissivity of wire arc directed energy deposition manufactured 7075 nano treated aluminum alloy. Int. J. Adv. Manuf. Technol. 2023, 126, 2175–2189. [Google Scholar] [CrossRef]
  19. da Silva, L.J.; Souza, D.M.; de Araújo, D.B.; Reis, R.P.; Scotti, A. Concept and validation of an active cooling technique to mitigate heat accumulation in WAAM. Int. J. Adv. Manuf. Technol. 2020, 107, 2513–2523. [Google Scholar] [CrossRef]
  20. Reisgen, U.; Sharma, R.; Mann, S.; Oster, L. Increasing the manufacturing efficiency of WAAM by advanced cooling strategies. Weld. World 2020, 64, 1409–1416. [Google Scholar] [CrossRef]
  21. Scotti, F.M.; Teixeira, F.R.; da Silva, L.J.; de Araújo, D.B.; Reis, R.P.; Scotti, A. Thermal management in WAAM through the CMT Advanced process and an active cooling technique. J. Manuf. Process. 2020, 57, 23–35. [Google Scholar] [CrossRef]
  22. Xian, G.; Cheepu, M.; Yu, J.; Cho, S.M.; Yeom, J.T.; Choi, Y.S.; Kang, N. Enhancing Tensile Properties of Wire-Arc Additively Manufactured Ti-6Al-4 V Deposits Via Cryogenic Vaporised Ar Shielding/Cooling. Met. Mater. Int. 2023, 29, 501–514. [Google Scholar] [CrossRef]
  23. Xia, C.; Pan, Z.; Zhang, S.; Polden, J.; Wang, L.; Li, H.; Xu, Y.; Chen, S. Model predictive control of layer width in wire arc additive manufacturing. J. Manuf. Process. 2020, 58, 179–186. [Google Scholar] [CrossRef]
  24. Wang, Y.; Xu, X.; Zhao, Z.; Deng, W.; Han, J.; Bai, L.; Liang, X.; Yao, J. Coordinated monitoring and control method of deposited layer width and reinforcement in WAAM process. J. Manuf. Process. 2021, 71, 306–316. [Google Scholar] [CrossRef]
  25. Li, Y.; Li, X.; Zhang, G.; Horváth, I.; Han, Q. Interlayer closed-loop control of forming geometries for wire and arc additive manufacturing based on fuzzy-logic inference. J. Manuf. Process. 2021, 63, 35–47. [Google Scholar] [CrossRef]
  26. Ščetinec, A.; Klobčar, D.; Bračun, D. In-process path replanning and online layer height control through deposition arc current for gas metal arc based additive manufacturing. J. Manuf. Process. 2021, 64, 1169–1179. [Google Scholar] [CrossRef]
  27. Manikandan, S.G.K.; Sivakumar, D.; Kamaraj, M. Welding the Inconel 718 Superalloy: Reduction of Micro-Segregation and Laves Phases; Elsevier: Amsterdam, The Netherlands, 2019. [Google Scholar] [CrossRef]
  28. Zhao, C.; Fezzaa, K.; Cunningham, R.W.; Wen, H.; De Carlo, F.; Chen, L.; Rollett, A.D.; Sun, T. Real-time monitoring of laser powder bed fusion process using high-speed X-ray imaging and diffraction. Sci. Rep. 2017, 7, 3602. [Google Scholar] [CrossRef] [PubMed]
  29. Zhang, C.; Qiu, Z.; Zhu, H.; Wang, Z.; Muránsky, O.; Ionescu, M.; Pan, Z.; Xi, J.; Li, H. On the effect of heat input and interpass temperature on the performance of inconel 625 alloy deposited using wire arc additive manufacturing–cold metal transfer process. Metals 2022, 12, 46. [Google Scholar] [CrossRef]
  30. Xu, C.; Guo, N.; Zhang, X.; Jiang, H.; Tan, Y.; Zhou, L. Influence of welding speed on weld pool dynamics and welding quality in underwater wet FCAW. J. Manuf. Process. 2020, 55, 381–388. [Google Scholar] [CrossRef]
  31. Koppu, A.K.; Lautre, N.K.; Motwani, A.; Hajare, D. CMT-WAAM deposition strategies for thin overhanging disc of SS308LSi and investigation of mechanical and microstructural characteristics. Proc. Inst. Mech. Eng. C J. Mech. Eng. Sci. 2024. [Google Scholar] [CrossRef]
Figure 1. Gefertec Arc605 wire-arc DED system with the torch, pyrometer and build table.
Jmmp 08 00140 g001
Figure 2. The 20-layer 80 mm single tracks deposited using Inconel 718 wire on a Gefertec Arc605.
Jmmp 08 00140 g002
Figure 3. Test cases used to assess the effect of the optimized process parameters on the melt track width.
Jmmp 08 00140 g003
Figure 4. Travel speed versus wire feed speed at an IPT of 150 °C showing two distinct sections; one free of cracking and one with cracking.
Jmmp 08 00140 g004
Figure 5. Porosity and crack behavior with increasing wire feed speed and travel speed. (A) WFS = 5 m/min, TS = 500 mm/min; (B) WFS = 5 m/min, TS = 1000 mm/min; (C) WFS = 5 m/min, TS = 1500 mm/min; (D) WFS = 8 m/min, TS = 500 mm/min; (E) WFS = 8 m/min, TS = 1000 mm/min; (F) WFS = 8 m/min, TS = 1500 mm/min. The scale bar is 100 microns long.
Jmmp 08 00140 g005
Figure 6. Travel speed versus wire feed speed at an IPT of 350 °C showing two distinct sections; one free of cracking and one with cracking. The yellow zone is crack-free, but deposition shows humping defects due to the high deposition rate.
Jmmp 08 00140 g006
Figure 7. Specimen 17 and 18 from Table 1 showing humping of the weld (red arrow).
Jmmp 08 00140 g007
Figure 8. Plot of IPT/MTW versus WFS showing the liner regression curves for every IPT selected.
Jmmp 08 00140 g008
Figure 9. Optical imaging of test Case 3 (random IPT—20 layers) showing the locations where melt track width measurements were taken. Each arrow indicates where a width measurements was performed.
Jmmp 08 00140 g009
Table 1. Process parameter used to print Inconel 718 single tracks.
SpecimenWFS (m/min)TS (mm/min)IPT (°C)
15500150
251000150
351500150
48500150
581000150
681500150
711500150
8111000150
9111500150
105500350
1151000350
1251500350
138500350
1481000350
1581500350
1611500350
17111000350
18111500350
1951000450
2051000550
Table 2. Process parameters used in the design of experiments to build a database.
SpecimenWFS (m/min)TS (mm/min)IPT (°C)Melt Track Width (mm)
14480205.62
25600206.05
36720206.25
47840206.40
58960206.48
644801005.54
756001005.97
867201006.28
978401006.46
1089601006.56
1144802005.86
1256002006.28
1367202006.50
1478402006.83
1589602007.07
1644803006.21
1756003006.67
1867203006.90
1978403007.09
2089603007.25
2144803006.58
2256004006.84
2367204007.30
2478404007.45
2589604007.59
Table 3. Optimized process parameters for different IPT using a target width of 7 mm.
Interpass (°C)Width (mm)WFS (m/min)TS (mm/min)
10078.541025.29
12578.31996.81
15078.07968.34
17577.83939.86
20077.59911.38
22577.36882.91
25077.12854.43
27576.88825.95
30076.65797.48
32576.41769.00
35076.17740.52
37575.93712.05
40075.70683.57
Table 4. Test case results showing melt track width and printing time.
Case 1Case 2Case 3Standard Deviation among All Cases
IPT-specific optimized parametersTrack width6.75 ± 0.001 mm6.80 ± 0.058 mm6.86 ± 0.018 mm0.05 mm
Printing time5 min 10 s8 min 26 s13 min 47 s
Fixed parametersTrack width6.96 ± 0.3075 mm7.31 ± 0.302 mm7.86 ± 0.538 mm0.40 mm
Printing time4 min 29 s9 min 35 s12 min 43 s
Table 5. Results for Cases 4 and 5 comparing two walls printed using standard process parameters but monitoring IPT at different locations.
Pyrometer reading at centerWidth6.81 ± 0.129 mm
Printing time20 min 25 s
Pyrometer reading at edgeWidth7.07 ± 0.456 mm
Printing time15 min 46 s
Disclaimer/Publisher’s Note: The statements, opinions and data contained in all publications are solely those of the individual author(s) and contributor(s) and not of MDPI and/or the editor(s). MDPI and/or the editor(s) disclaim responsibility for any injury to people or property resulting from any ideas, methods, instructions or products referred to in the content.

