Article

Investigation of Laser Powder Bed Fusion Parameters with Respect to Their Influence on the Thermal Conductivity of 316L Samples

1
Department of Mechanical Engineering and Mechatronics, FH Aachen-University of Applied Sciences, 52066 Aachen, Germany
2
Department of Manufacturing Engineering, Technical University of Cluj-Napoca, 400114 Cluj-Napoca, Romania
3
Fraunhofer Institute for Laser Technology ILT, 52074 Aachen, Germany
*
Authors to whom correspondence should be addressed.
J. Manuf. Mater. Process. 2024, 8(4), 166; https://doi.org/10.3390/jmmp8040166
Submission received: 10 June 2024 / Revised: 12 July 2024 / Accepted: 14 July 2024 / Published: 2 August 2024

Abstract

:
The thermal conductivity of components manufactured using Laser Powder Bed Fusion (LPBF), also called Selective Laser Melting (SLM), plays an important role in their processing. Not only does a reduced thermal conductivity cause residual stresses during the process, but it also makes subsequent processes such as the welding of LPBF components more difficult. This article uses 316L stainless steel samples to investigate whether and to what extent the thermal conductivity of specimens can be influenced by different LPBF parameters. To this end, samples are set up using different parameters, orientations, and powder conditions and measured by a heat flow meter using stationary analysis. The heat flow meter set-up used in this study achieves good reproducibility and high measurement accuracy, so that comparative measurements between the various LPBF influencing factors to be tested are possible. In summary, the series of measurements show that the residual porosity of the components has the greatest influence on conductivity. The degradation of the powder due to increased recycling also appears to be detectable. The build-up direction shows no detectable effect in the measurement series.

1. Introduction

The Laser Powder Bed Fusion process (LPBF or SLM) is a young and fast-growing manufacturing technology that is characterized in particular by its high geometrical freedom and high resolution. In this process, a starting material in the form of powder is applied to a building platform and selectively scanned by a laser, which melts it. By the following solidification of the material, a geometry is built up layer by layer. The LPBF process can be used to produce metallic components with a relative density of over 99%. The laser melts the starting material completely during the process, and a local (selective) melt pool is created [1,2,3].
Despite the high machine acquisition costs compared to other additive manufacturing (AM) processes, the LPBF process is very popular in the industry. This is mainly due to the wide range of possible applications and the high geometrical freedom of the process. In comparison to other metal AM processes, LPBF achieves high geometrical accuracy and good surface qualities. As a result, complex geometries can also be produced economically in small batches. This makes the process very attractive for a range of industries and applications [4].
The technology has been further developed and researched over the past 25 years. New materials are being developed and qualified, new machine systems are being developed, and the available build-up space is being increased.
The research and development of the process are constantly pushing the boundaries of the process in order to expand it. With regard to the resulting residual stresses, it is now known how they arise and which mechanisms they are based on. The high heat input that is introduced locally and specifically into the powder bed by the laser results in large temperature gradients, which lead to high cooling rates in the magnitude of 106 K/s in the process [5]. The spontaneous and rapid expansion (during liquification) and shrinkage (during solidification) of the locally dissolved melt front induce high stresses in the surrounding or underlying solid material [6,7]. If these stresses rise above the tensile strength of the material, plastic deformations occur, which not only impair geometric accuracy but could potentially also result in a process interruption [8]. It is known that this damaging mechanism is further favored by reduced thermal conductivity, as this increases the temperature gradients [7].
Another limitation of the LPBF process is the limited built-in chamber space. This is due to the fact that machine costs increase exponentially with increased build chamber space. The costs for shielding gas coverage, scan field calibration, exposure, coating, and calculation times increase, as do material costs and risk costs [9]. A solution to this limitation is already known. Subsequent welding of components or substructures produced by LPBF to each other or to other conventionally manufactured components can increase the volume of components to be manufactured [10]. However, because this subsequent process is sensitive to stress-related distortions, it is double-dependent on the thermal conductivity [11,12].
If manufactured LPBF components have a deteriorated thermal conductivity, this has a bad influence on their potential applications, especially with regard to their processability with subsequent processes such as welding. This is why heat flow measurements play an important role [13,14].
In general, a distinction is made between steady-state and transient thermal analysis methods for determining thermal conductivity. The transient methods measure the temperature change over time. The most common methods are, for example, laser flash analysis or the hot wire methods. The great advantage of these methods is their fast measurement times and large measuring range. However, sample preparation is relatively time-consuming, and it requires more complex mathematical analysis and data processing where user errors can occur [15]. The steady-state analysis methods measure the temperature difference directly in front of and behind the material when a tested material reaches complete thermal equilibrium. In thermal equilibrium, the problem is treated as a one-dimensional heat flow for the sake of simplicity. This results in significantly longer measurement times. However, the accuracy and reproducibility of the results are very high. The different measuring methods are listed and compared in a comprehensive manner in Table 1.
Unexpectedly, the state of the art in the field of thermal conductivity of LPBF components is not comprehensively documented. However, some publications demonstrate the possibility that LPBF process parameters could have an influence on thermal conductivity.
In the case of LPBF-manufactured aluminum alloys, the thermal conductivity does not initially correspond to the thermal conductivity of the base material. Only after subsequent heat treatment can the theoretical material properties be achieved again. These results show a deviation in thermal conductivity of up to 44% [17].
316L has a thermal conductivity of approx. 15 W/mK at room temperature. The low thermal conductivity of the material coupled with the high thermal expansion results in high internal stresses during and after LPBF. Reduced thermal conductivity due to the LPBF process leads to increased stress peaks, which could have a negative effect on the resulting residual stresses [18].
The density of a material has a direct influence on its thermal conductivity. This is partly due to surface contact and partly because air is an insulator. One reason why thermal insulation materials consist largely of air or another gas. In the LPBF process, the bulk density of the powder is decisive for its thermal conductivity [19]. However, the density also has a decisive influence on the thermal conductivity of the manufactured component.
Unmolten LPBF powder is recycled, sieved, and reused after a build process. This results in a coarsening of the powder as the proportion of smaller particles diminishes over time. In addition, only foreign particles and trace elements that are larger than the sieve are removed from the powder. This results in contamination of the powder [20]. Depending on the material, the use of recycled powder in the laser additive manufacturing process can influence component quality. Although AlSi10 Mg is quite resilient against reuse, the 316L material of this work is affected by many recycling cycles [21].
This raises the question of the extent to which powder coarsening and deteriorated powder quality have an effect on material properties such as thermal conductivity [20].
Another influencing factor on thermal conductivity could be epitaxial grain growth, which occurs during melting. The resulting crystallographic texture of LPBF parts can vary extensively in relation to LPBF parameters such as energy input, build-up orientation, and scan patterns [22,23]. This involves the formation of large, elongated grains in the microstructure along the build-up direction. This can be explained by the heat dissipation via the solid material. The result is a microstructure that has fewer grain boundaries in the build-up direction than in the opposite direction. This leads to the assumption that heat conduction is better in the build-up direction [24].
The aim of this paper is to investigate various influencing factors along the process chain of the LPBF process and their effects on the thermal conductivity of manufactured parts. The problem that is addressed here is that a deteriorated thermal conductivity will hinder downstream processes such as subsequent welding of LPBF parts made from 316L. The following research questions will be investigated:
  • Does powder degradation lead to increased oxidation and the inclusion of foreign particles, thus reducing thermal conductivity?
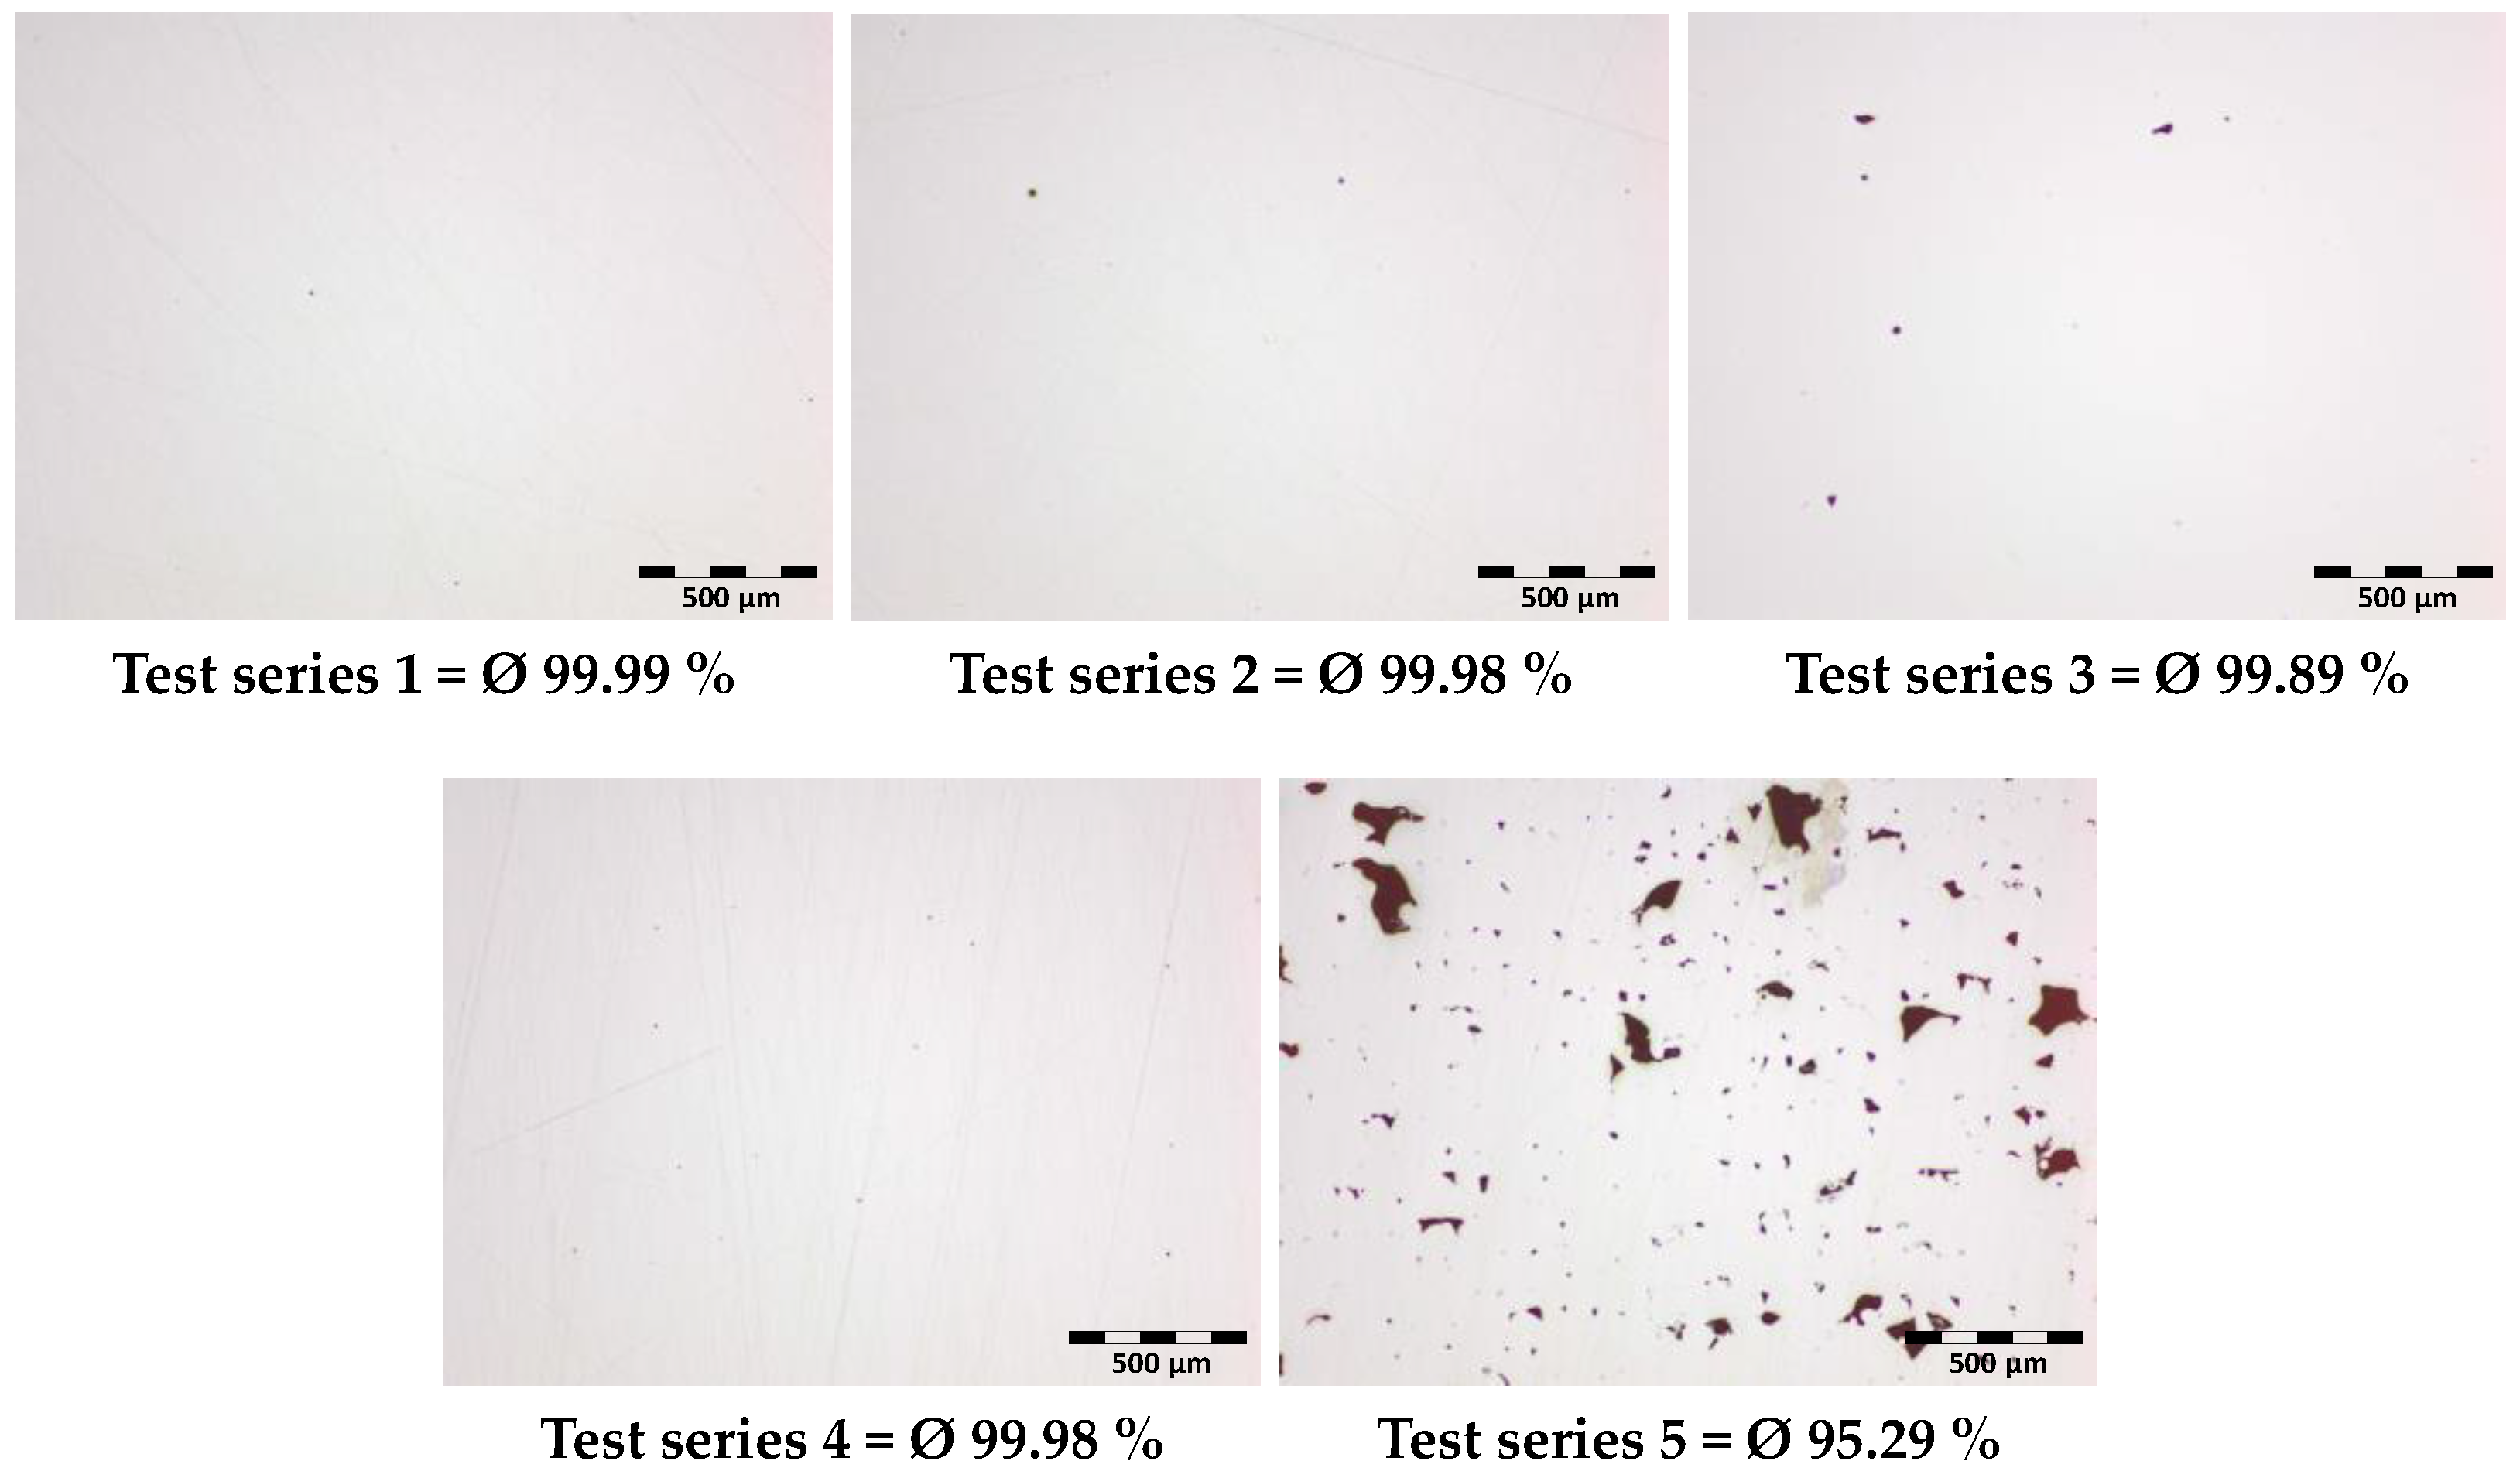
  • To what extent does increased porosity lead to deteriorated thermal conductivity?
  • Does the grain growth direction of the microstructure have a decisive effect on the thermal conductivity in the build-up direction?

2. Materials and Methods

To test the effects of various influencing factors on thermal conductivity, round rods of different thicknesses were produced under constant manufacturing conditions. For each test series, three specimens with a diameter of 42 mm were manufactured in heights of 5 mm, 10 mm, and 15 mm, as shown in Figure 1.
The samples were produced on a Conceptlaser M1 Cuising with a build space of 250 × 250 × 250 mm3. The laser has a power of 200 W and a spot size of 50 µm. Nitrogen was used as shielding gas, and the build plate was not preheated. There was also no post-heat treatment. The material used was 316L powder with a PSD of −45/+15 µm. A maximum of 5% of the particles are larger than 45 µm, and a maximum of 5% of the particles are smaller than 15 µm. In addition to the components, ghost parts have been added to the process, which were scanned by the laser without power in order to equalize the different cooling cycle times between the layers. The cooling speeds and cycle times have an important influence on the resulting part properties. These ghost parts are a common technique to synchronize the cooling cycle times of different build jobs or of parts of one job with different cross-sections over the complete building height. These (not actually printed) scan vectors delay the next recoating cycle by the exact time used to obtain the shortest but most homogenous cycle time over the complete building job.
Before measurements, the slightly oversized parts were finished by a turning machine to the final dimensions of 42 mm in diameter and 5 mm, 10 mm, and 15 mm in thickness in order to achieve good comparability. The surface roughness was controlled to Ra 1.6 µm.
The various samples were measured using the heat flow meter method in accordance with ISO 8301 in the steady state. The sample is therefore positioned between a hot and a cold plate with a set contact pressure. To be able to calculate power losses and contact resistances at the contact surfaces, the thermal impedance was first determined. The thermal impedance of the overall system was calculated in accordance with ASTM D5470, as is normally the case with thermal interface materials. The power loss of the overall system is determined with the aid of three measuring points and a compensation line. The equalization line is extended to the Y-intercept using linear regression. The intersection point gives an average value of the thermal power loss of the overall system (e.g., Figure 2). If this value is subtracted from the individual measured values, the thermal resistance caused by the material alone can be determined, and thus the thermal conductivity of the sample can be determined.
The combination of the two measurement principles is used to reduce measurement inaccuracies and normalize the results for better comparability. For this purpose, 3 samples of different thicknesses were each measured for a series of tests. With the results of the individual measurements, a more accurate power loss could be anticipated. This made it possible to determine an average thermal resistance and, thus, an average thermal conductivity. The results were then compared with each other and with a reference series to clarify the effects.
Density measurements were added to control the relative densities of the samples. Therefore, density cubes (20 mm × 20 mm × 20 mm) were built with the same parameters as the specimen, cut in half, and then grinded and polished with a 3 µm suspension. Grayscale images of the mirror-polished cross-sections are taken on an Olympus BX41M-LED microscope. Defect-free material appears bright on the grayscale images, while component defects such as pores, cracks, and bonding defects appear dark. This enables software-supported binarization—the classification of elements of the cross-sectional surface under consideration into the categories of defect-free material and component defects. The software used was ImageJ (version 1.53k). The 5 measurement sections were averaged, and the resulting relative density was noted to accompany the other examinations. The reason for this is that the effects of the influencing factors on the density and the effects of varying density on the thermal conductivity were to be tested.
In order to clarify the research questions posed, 5 test series were carried out. These test series are listed in Table 2.
All the variables shown here are the product of previous intensive research to avoid residual stresses for a downstream welding process. The variables are created and optimized for the M1 Cuising machine from Concpetlaser. They produce high densities and good surface quality in the standard version. Test series 1 serves as a reference series and was carried out with the parameters shown in Table 1. In test series 2, the build-up direction of the samples was rotated by 90° to investigate the effects of the grain growth direction on the thermal conductivity in the build-up direction, as shown in Figure 1. All other variables except orientation were kept constant with reference to test series 1.
Test series 3 and 4 investigate the effects of the powder quality on thermal conductivity. For this purpose, components with different powder qualities were manufactured, as shown in Figure 3. The test series 4 was performed with fresh powder. The series 5 was tested with oversized and often recycled powder, and in all other measurements, a combination of roughly 30% fresh powder and a portion of recycled powder was used as usual in the industry. Again, all process variables were kept constant except for the state of the powder in order to isolate this effect.
The different powder conditions also have a noticeable impact on the particle size distribution (PSD). There is a small increase in the size of the powder particles between fresh and recycled powder. The sphericity remains almost the same, and, as can be seen in Figure 3, only a few darker particles can be seen. When it comes to the oversized and degraded powder state (c) that can be seen in Figure 3, there is a negative impact on the sphericity of the powder in Table 3. The statistical particle size distribution is also significantly larger, both by number (Q0) and by area (Q3).
In test series 5, samples were specifically produced with a reduced density. For this purpose, the samples were produced with a VED of 37.5 J/mm3 instead of the VED of 62.5 J/mm3 in the reference series. The VED was reduced by increasing the scanning speed and was intended to illustrate the component quality of common support structures. Also here, the variables were varied according to the one-variable-at-a-time approach. The successful decrease of the density for test purposes can be seen in the Figure 8.
To ensure good comparability of the samples, all test series were measured at a test temperature of 50 °C. For the evaluation, the three samples of the respective test series were measured in a 6 h long-term measurement and in five 90 min short-term measurements. An average value was calculated from the five measuring points of the short-term measurement. In addition, the standard deviation of the short-term measurements was determined, and an average thermal conductivity over the entire test series was calculated.

3. Results and Discussion

In all diagrams, the reference measurement of cold-rolled conventionally manufactured 316L (e.g., test series 0) is presented for reference. In the present test set-up for those specimens, a thermal conductivity of 16 W/mK could be measured at a temperature of 50 °C.
For the thermal conductivity of test series 1 (LPBF normal in horizontal orientation), as shown in Figure 4, an average thermal conductivity of 15.34 W/mK at a temperature of 50 °C was measured. The maximum deviations in thermal conductivity in this test series were ±05 W/mK.
It can therefore be stated that, compared to conventionally manufactured 316L, the LPBF 316L has a 0.66 W/mK lower thermal conductivity in the normal unchanged status of parameter set 1. This finding alone proves that there is a difference between the thermal conductivities of conventionally manufactured 316L and LPBF products made from 316L feedstock material. In the opinion of the authors, more attention should be paid to this fact, as neither the material manufacturers nor publications in the present literature refer to it [25].
In test series 2, the effects of the build-up direction on the thermal conductivity were investigated. In test series 1, the cylindrical specimens were printed horizontally, whereas in test series 2, the specimens were set up vertically. In test series 2, as shown in Figure 5, an average thermal conductivity of 15.32 W/mK was determined. No significant differences in thermal conductivity were therefore found when comparing the two-test series. The density cubes of the two-test series achieved a relative density of 99.99% and 99.98%.
This shows that the slightly lower baseline of the LPBF specimens compared to conventionally manufactured 316L specimens is reached, but also that it stays unchanged in relation to the build-up direction. There were no tests in this study that indicated anisotropic behavior for thermal conductivity. Hypothesis 2 can therefore be regarded as disproven. This presents another important contribution to the state of the art, as microstructure and crystallographic texturing for the 316L material are often related to mechanical properties or corrosion performance but are rarely investigated with respect to thermal conductivity [22,23,25].
Test series 3 and 4 were set up to determine the effects of degraded and oversized powder on the resulting thermal conductivity. In test series 4, the test specimens were manufactured with new powder that had never been recycled, whereas in test series 3, old powder and oversized particles were used. During the production of test series 3, an increase in the development of smoke during the process was observed. The increased amount of smoke could also be observed on the finished components, which also had a significantly poorer surface quality. Test series 3 clearly shows a decrease in thermal conductivity compared to the previous series. Once again, the deviations from the measurements are in the range of ± 0.05 W/mK. A slight decrease in the relative density to 99.89% was observed for the oversized particles. However, as shown in Figure 6, a reduction in thermal conductivity to 14.62 W/mK was particularly noticeable. This suggests that the thermal conductivity is reduced by increased oxidized powder particles and powder coarsening.
When using fresh powder, a high relative density of 99.99% was again achieved. It is striking that a lower thermal conductivity, as shown in Figure 7, of 15.12 W/mK was determined than in the reference series. This is not the expected result. In general, however, it should be noted that the thermal conductivity is still within the expected range and is significantly higher than in the test series with oversize grain. A comparison of test series 1, 3, and 4 shows that oversized and old powder have a negative effect on thermal conductivity. The first research question, and thus the hypothesis that powder degradation and recycling with 316L feedstock powder decrease thermal conductivity, can therefore be regarded as proven.
These results regarding the first research question are in accordance with research on the excessive reuse of feedstock 316L powder. Previous studies do confirm that after many cycles of reuse, the concentration of condensate and oxides increases [25,26]. The presented results of this study complement these previous findings, as these effects do have a small but relevant impact on the thermal properties as well.
Test series 5 analyzes the effects of density on heat conduction. Specimens with a reduced density were specifically manufactured for this purpose. The evaluation of the density analysis resulted in a relative density of 95.29%. The difference is illustrated in Figure 8. The irregularly shaped pores are clearly recognizable, indicate insufficient laser power for this scan speed, and show areas of unmolten material.
The scanning speed was increased up to 1333 mm/s while keeping all other parameters constant so that the VED fell from 62.5 J/mm3 to 37.5 J/mm3. Among other things, this should be representative of the parameters of support structures. As expected, a significant reduction in heat conduction was observed during the test series. The average thermal conductivity, as shown in Figure 9, was 13.26 W/mK. A direct dependence of density on thermal conductivity can therefore be established.
Research question 2 and, thus, the hypothesis that density has a high influence on thermal conductivity can be confirmed.

4. Conclusions

The thermal properties of LPBF-manufactured parts made from 316L feedstock material are a topic that is not very present in the state of the art. Many publications deal with mechanical properties and productivity aspects. When trying to combine LPBF with downstream manufacturing processes such as welding, the residual stresses and the low thermal conductivity are a large hurdle. The authors therefore performed a thorough study on influencing parameters in the LPBF process and their impact on the resulting thermal conductivity. Interesting contributions to the state of the art could be made:
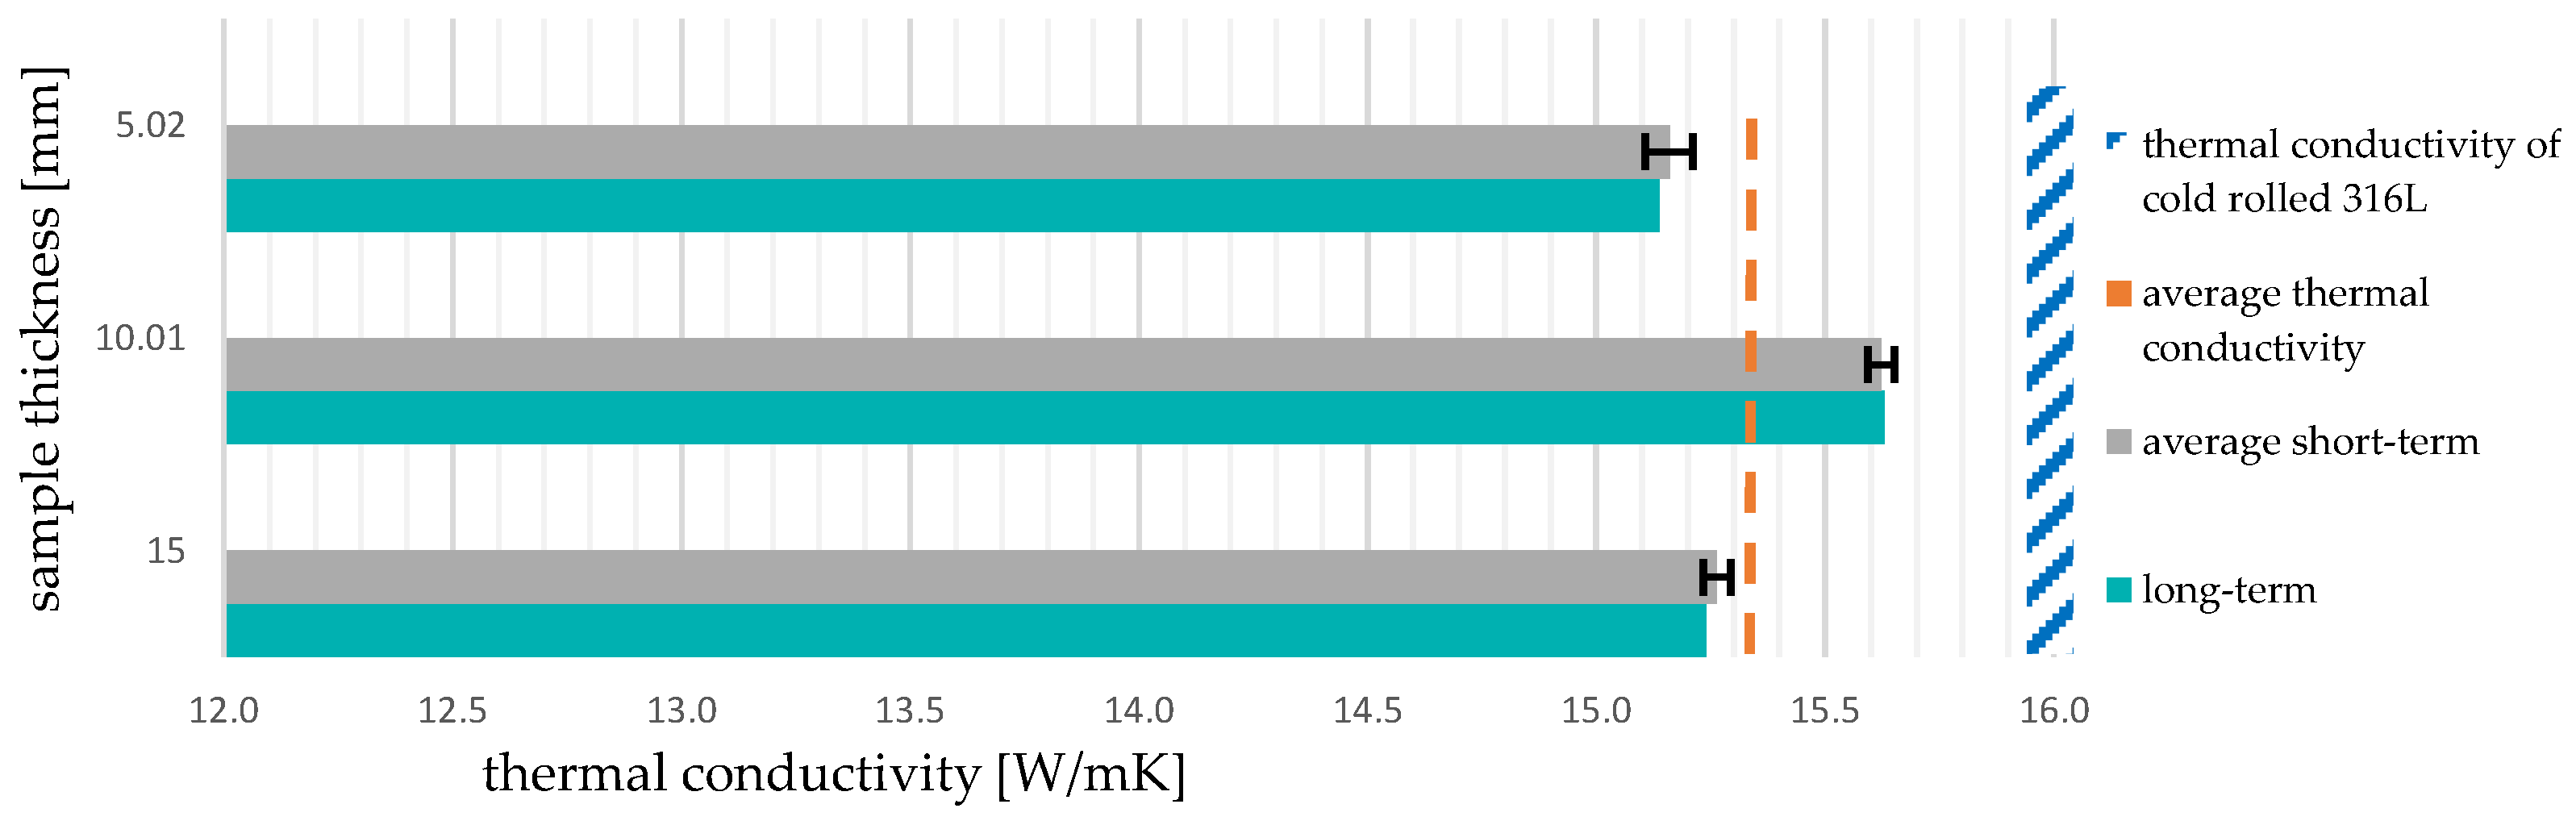
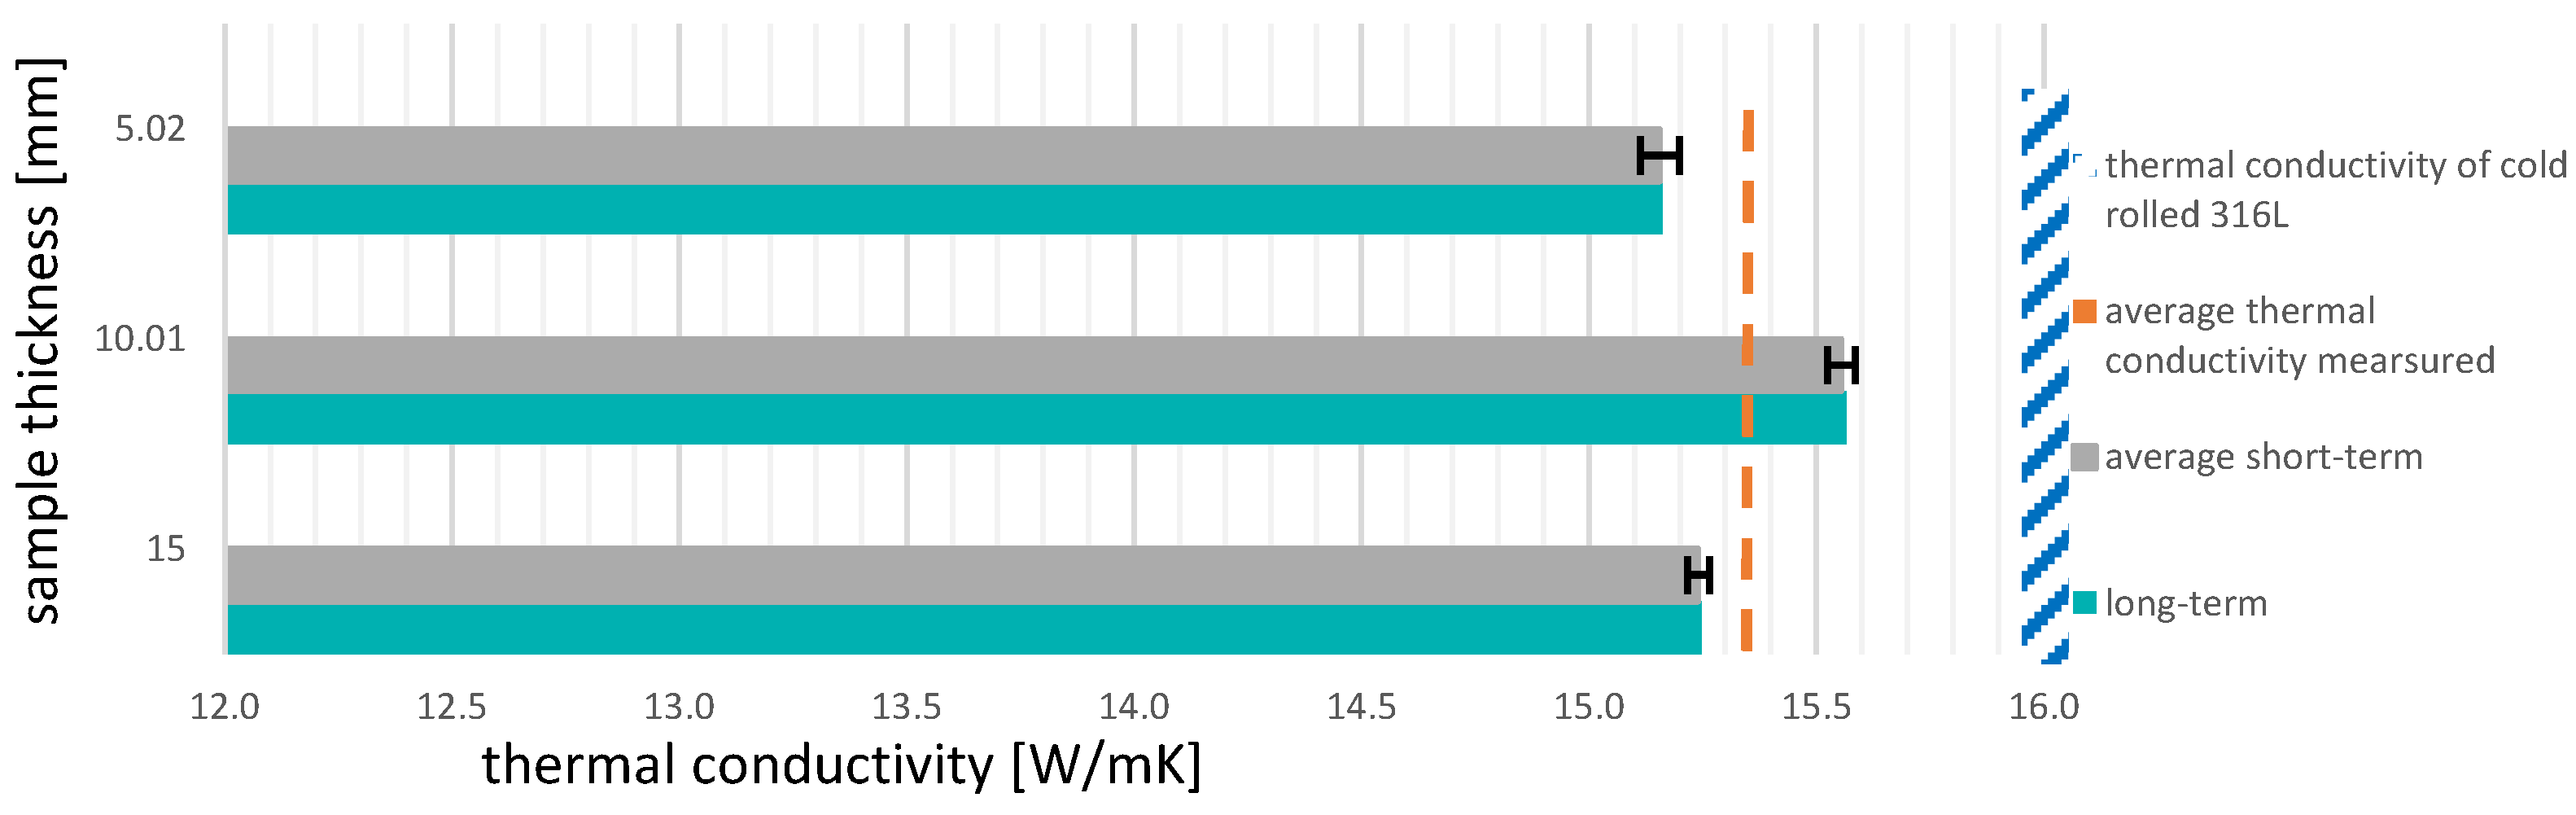
  • Samples were produced from 316L powder using LPBF. The parameters were within the normal process window for producing dense specimens without errors (62.5 J/mm3) and in accordance with the state of the art [27]. Nevertheless, the thermal conductivity was 0.66 W/mK lower than in the conventionally produced material.
  • Degradation in the powder feedstock can lead to an increase in oxides, more condensate, and fumes on the powder particles [26]. In this study, it could be proven that this leads to a small but relevant decrease in thermal conductivity. The conductivity decreased to 14.62 W/mK.
  • When producing LPBF parts from 316L buildup, orientation and process parameters can have an impact on microstructure and crystallographic texturing [22,23,25]. In common literature, this is often investigated with respect to mechanical properties. The results of this study show that the present anisotropy does not have a negative influence on thermal conductivity.
  • Reducing the part densities from 99.99% down to 95.29% leads to a decrease in thermal conductivity of 13.5%. It can be stated that part densities and micro-porosities have the most important influence on the thermal conductivity of LPBF-manufactured 316L specimens.
As metal PBF parts often undergo a subsequent heat treatment, it can be stated that, concerning the present results of this study, no major improvements will be expected. This is because, regarding the microstructure, grain size and orientation do not seem to have an influence on heat conduction in any case. Also related to the powder state, heat treatment will not add much improvement. The density, which, in contrast, can have a strong influence, is only slightly improved by the subsequent heat treatment. Consequently, this is the only influencing factor that could slightly improve the thermal conductivity during post-treatment.
Further research work should examine the effect of preheating the platform, as in the case of other materials, 316L seemed to have a positive impact on the thermal properties.
The obtained results represent a good foundation, particularly for attempts to link LPBF with subsequent manufacturing techniques such as welding.

Author Contributions

Conceptualization, F.E. and N.B.; methodology, F.E., N.B. and S.B.; software, P.N.; validation, F.E., N.B. and S.B.; investigation, F.E. and P.N.; resources, N.B. and S.B.; data curation, P.N.; writing—original draft preparation, F.E.; writing—review and editing, F.E., N.B. and S.B.; visualization, P.N.; supervision, N.B. and S.B. All authors have read and agreed to the published version of the manuscript.

Funding

This research received no external funding.

Data Availability Statement

The datasets presented in this study are available on request from the corresponding author; they are not publicly available as they form part of ongoing research.

Conflicts of Interest

The authors declare no conflicts of interest.

References

  1. Płatek, P.; Sienkiewicz, J.; Janiszewski, J.; Jiang, F. Investigations on Mechanical Properties of Lattice Structures with Different Values of Relative Density Made from 316L by Selective Laser Melting (SLM). Materials 2020, 13, 2204. [Google Scholar] [CrossRef]
  2. Di Wang Song, C.; Yang, Y.; Bai, Y. Investigation of crystal growth mechanism during selective laser melting and mechanical property characterization of 316L stainless steel parts. Mater. Des. 2016, 100, 291–299. [Google Scholar]
  3. Carpenter, K.; Tabei, A. On Residual Stress Development, Prevention, and Compensation in Metal Additive Manufacturing. Materials 2020, 13, 255. [Google Scholar] [CrossRef] [PubMed]
  4. Associates, W. Wohlers Report 2022: 3D Printing and Additive Manufacturing Global State of the Industry; Wohlers Associates: Fort Collins, CO, USA, 2022. [Google Scholar]
  5. Hooper, P.A. Melt pool temperature and cooling rates in laser powder bed fusion. Addit. Manuf. 2018, 22, 548–559. [Google Scholar] [CrossRef]
  6. Mercelis, P.; Kruth, J.-P. Residual stresses in selective laser sintering and selective laser melting. Rapid Prototyp. J. 2006, 12, 254–265. [Google Scholar] [CrossRef]
  7. Kruth, J.P.; Froyen, L.; Van Vaerenbergh, J.; Mercelis, P.; Rombouts, M.; Lauwers, B. Selective laser melting of iron-based powder. J. Mater. Process. Technol. 2004, 149, 616–622. [Google Scholar] [CrossRef]
  8. Schröder, J.; Evans, A.; Mishurova, T.; Ulbricht, A.; Sprengel, M.; Serrano-Munoz, I.; Fritsch, T.; Kromm, A.; Kannengießer, T.; Bruno, G. Diffraction-Based Residual Stress Characterization in Laser Additive Manufacturing of Metals. Metals 2021, 11, 1830. [Google Scholar] [CrossRef]
  9. Yang, Y.; Chen, Z.; Liu, Z.; Wang, H.; Zhang, Y.; Wang, D. Influence of shielding gas flow consistency on parts quality consistency during large-scale laser powder bed fusion. Opt. Laser Technol. 2023, 158, 108899. [Google Scholar] [CrossRef]
  10. Schwarz, A.; Schleser, M.; Gerhards, B.; Popoola, P.; Gebhardt, A. Welding of Additive Manufactured AlSi10Mg: Using Laser Welding in a Vacuum for High Quality Weld Seams—A New Approach to Welding LPBF Manufactured AlSi10Mg. S. Afr. J. Ind. Eng. 2021, 32, 99–112. [Google Scholar] [CrossRef]
  11. Gill, M.; Terry, E.; Abdi, Y.; Hawkes, S.; Rindler, J.; Schick, D.; Ramirez, A.; Herderick, E.D. Joining Technologies for Metal Additive Manufacturing in the Energy Industry. JOM 2020, 72, 4214–4220. [Google Scholar] [CrossRef]
  12. Foteinopoulos, P.; Papacharalampopoulos, A.; Angelopoulos, K.; Stavropoulos, P. Development of a simulation approach for laser powder bed fusion based on scanning strategy selection. Int. J. Adv. Manuf. Technol. 2020, 108, 3085–3100. [Google Scholar] [CrossRef]
  13. Sánchez-Calderón, I.; Merillas, B.; Bernardo, V.; Rodríguez-Pérez, M.Á. Methodology for measuring the thermal conductivity of insulating samples with small dimensions by heat flow meter technique. J. Therm. Anal. Calorim. 2022, 147, 12523–12533. [Google Scholar] [CrossRef]
  14. Kim, D.; Lee, S.; Yang, I. Verification of thermal conductivity measurements using guarded hot plate and heat flow meter methods. J. Korean Phys. Soc. 2021, 78, 1196–1202. [Google Scholar] [CrossRef]
  15. Cheng, B.; Lane, B.; Whiting, J.; Chou, K. A Combined Experimental-Numerical Method to Evaluate Powder Thermal Properties in Laser Powder Bed Fusion. J. Manuf. Sci. Eng.-Trans. ASME 2018, 140, 111008. [Google Scholar] [CrossRef] [PubMed]
  16. Zhao, D.; Qian, X.; Gu, X.; Jajja, S.A.; Yang, R. Measurement Techniques for Thermal Conductivity and Interfacial Thermal Conductance of Bulk and Thin Film Materials. J. Electron. Packag. 2016, 138, 040802. [Google Scholar] [CrossRef]
  17. Sélo, R.R.; Catchpole-Smith, S.; Maskery, I.; Ashcroft, I.; Tuck, C. On the thermal conductivity of AlSi10Mg and lattice structures made by laser powder bed fusion. Addit. Manuf. 2020, 34, 101214. [Google Scholar] [CrossRef]
  18. Waqar, S.; Guo, K.; Sun, J. FEM analysis of thermal and residual stress profile in selective laser melting of 316L stainless steel. J. Manuf. Process. 2021, 66, 81–100. [Google Scholar] [CrossRef]
  19. Stacy, S.C.; Zhang, X.; Pantoya, M.; Weeks, B. The effects of density on thermal conductivity and absorption coefficient for consolidated aluminum nanoparticles. Int. J. Heat Mass Transf. 2014, 73, 595–599. [Google Scholar] [CrossRef]
  20. Seyda, V. Werkstoff- und Prozessverhalten von Metallpulvern in der Laseradditiven Fertigung; Springer: Berlin/Heidelberg, Germany, 2018. [Google Scholar]
  21. Maamoun, A.H.; Elbestawi, M.; Dosbaeva, G.K.; Veldhuis, S.C. Thermal post-processing of AlSi10Mg parts produced by Selective Laser Melting using recycled powder. Addit. Manuf. 2018, 21, 234–247. [Google Scholar] [CrossRef]
  22. Pérez-Ruiz, J.; González-Barrio, H.; Sanz-Calle, M.; Gómez-Escudero, G.; Munoa, J.; de Lacalle, L. Machining stability improvement in LPBF printed components through stiffening by crystallographic texture control. CIRP Ann. 2023, 72, 141–144. [Google Scholar] [CrossRef]
  23. Pérez-Ruiz, J.D.; de Lacalle, L.N.L.; Urbikain, G.; Pereira, O.; Martínez, S.; Bris, J. On the relationship between cutting forces and anisotropy features in the milling of LPBF Inconel 718 for near net shape parts. Int. J. Mach. Tools Manuf. 2021, 170, 103801. [Google Scholar] [CrossRef]
  24. Zhang, R.; Buchanan, C.; Matilainen, V.-P.; Daskalaki-Mountanou, D.; Britton, T.B.; Piili, H.; Salminen, A.; Gardner, L. Mechanical properties and microstructure of additively manufactured stainless steel with laser welded joints. Mater. Des. 2021, 208, 109921. [Google Scholar] [CrossRef]
  25. Vukkum, V.B.; Gupta, R.K. Review on corrosion performance of laser powder-bed fusion printed 316L stainless steel: Effect of processing parameters, manufacturing defects, post-processing, feedstock, and microstructure. Mater. Des. 2022, 221, 110874. [Google Scholar] [CrossRef]
  26. Heiden, M.J.; Deibler, L.A.; Rodelas, J.M.; Koepke, J.R.; Tung, D.J.; Saiz, D.J.; Jared, B.H. Evolution of 316L stainless steel feedstock due to laser powder bed fusion process. Addit. Manuf. 2019, 25, 84–103. [Google Scholar] [CrossRef]
  27. Eliasu, A.; Czekanski, A.; Boakye-Yiadom, S. Effect of laser powder bed fusion parameters on the microstructural evolution and hardness of 316L stainless steel. Int. J. Adv. Manuf. Technol. 2021, 113, 2651–2669. [Google Scholar] [CrossRef]
Figure 1. The horizontal and vertical build-up direction of the additively manufactured 316L specimens (thicknesses of 5 mm, 10 mm, or 15 mm and a diameter of 42 mm).
Jmmp 08 00166 g001
Figure 2. Graphical representation of the determination of thermal impedance by linear regression.
Jmmp 08 00166 g002
Figure 3. Optical comparison of 316L powder in fresh (A), used and sieved (B), and oversized (C) states. Each powder is shown with 200× magnification (A1C1) and 1000× magnification (A2C2).
Jmmp 08 00166 g003
Figure 4. Determined thermal conductivity from test series 1, with an average thermal conductivity of 15.34 W/mK.
Jmmp 08 00166 g004
Figure 5. Determined thermal conductivity from test series 2, with an average thermal conductivity of 15.32 W/mK.
Jmmp 08 00166 g005
Figure 6. Determined thermal conductivity from test series 3, with an average thermal conductivity of 14.62 W/mK.
Jmmp 08 00166 g006
Figure 7. Determined thermal conductivity from test series 4, with an average thermal conductivity of 15.12 W/mK.
Jmmp 08 00166 g007
Figure 8. Micrographs for optical evaluation of the density of test series 1–5. The pictures represent one of the five measuring pictures that have been averaged for each series.
Jmmp 08 00166 g008
Figure 9. Determined thermal conductivity from test series 5, with an average thermal conductivity of 13.26 W/mK.
Jmmp 08 00166 g009
Table 1. Comparison of the most widely used methods for determining thermal conductivity [14,16].
MethodLaser–Flash AnalysisHot-Wire MethodHeat-Flow MeterGuarded Hot Plate
Temperature range−100 to 2800 °C−150 to 700 °C−20 to 100 °C−100 to 1000 °C
MaterialsSolids, powders, pastes, foils, and liquidsSolids, powders, pastes, foils, and liquidsSolids: predominantly glass, ceramics, metals, stone, and plastic Solids: predominantly insulating materials and elastomers
UncertainlyUp to 4%Up to 1%Up to 2%Up to 2%
Measuring rangeFrom 0.1 to 4000 W/mKFrom 0.005 to 1800 W/mKFrom 0.01 to 500 W/mKFrom 0.0001 to 2 W/mK
AdvantagesTemperature range, measurable materials, short measuring timeShort measuring time, measurable materials, and high accuracyHigh accuracy, reproducibility, and simple constructionHigh accuracy and reproducibility
DisadvantagesExpensive and complex sample preparation; susceptible to application errorsAnisotropy is not considered, in specimen preparation Long measuring time, time-consuming calibrations, and sample preparationLong measuring time, large specimen geometry, and is only for low conductivities
StandardASTM C714 and
DIN EN 821
ASTM C1113 and
ASTM D7896
ASTM C518 and
DIN EN 12664
ASTM C177 and
ISO 8302
Table 2. Overview of the 5 test series, including parameter variation schemes.
Test Series 0Test Series 1Test Series 2Test Series 3Test Series 4Test Series 5
conventionally manufactured 316Ladditively manufactured 316L in a horizontal directionadditively manufactured 316L in an upright directionadditively manufactured 316L with oversize/degraded powderadditively manufactured 316L with fresh powderadditively manufactured 316L with lower VED
VED = 62.5 J/mm3
PL = 180 W
vs = 800 mm/s
ds = 50 µm
Ds = 45 µm
Line Scanning
VED = 62.5 J/mm3
PL = 180 W
vs = 800 mm/s
ds = 50 µm
Ds = 45 µm
Line Scanning
VED = 62.5 J/mm3
PL = 180 W
vs = 800 mm/s
ds = 50 µm
Ds = 45 µm
Line Scanning
VED = 62.5 J/mm3
PL = 180 W
vs = 800 mm/s
ds = 50 µm
Ds = 45 µm
Line Scanning
VED = 37.5 J/mm3
PL = 180 W
vs = 1333 mm/s
ds = 50 µm
Ds = 45 µm
Line Scanning
Table 3. Particle size distribution (PSD) analysis of the three different powders.
Fresh PowderUsed and SievedOversized Grain
x [µm] at Q3 = 10.0%22.623.333
x [µm] at Q3 = 50.0%33.333.954.9
x [µm] at Q3 = 90.0%46.445.7139.6
x [µm] at Q0 = 10.0%14.314.918.1
x [µm] at Q0 = 50.0%24.825.733.1
x [µm] at Q0 = 90.0%37.338.250.9
Mean value SPHT30.8860.8920.831
Mean value SPHT00.9040.9070.887
Disclaimer/Publisher’s Note: The statements, opinions and data contained in all publications are solely those of the individual author(s) and contributor(s) and not of MDPI and/or the editor(s). MDPI and/or the editor(s) disclaim responsibility for any injury to people or property resulting from any ideas, methods, instructions or products referred to in the content.

