Abstract
The fabrication of welded joints in steel sheets has become a focal point, especially in meeting the demands for interconnections within battery packs for electric vehicles (EVs). This study delves into the impact arising from the initiation arc during the micro-tungsten inert gas (TIG) welding of nickel-plated steel sheets. The investigation involved the manipulation of various current modulations and arc lengths. Notably, optimal results were achieved with a 5 mm arc length paired with a 25 A current modulation. Microstructural analysis, conducted through scanning electron microscopy (SEM), unveiled a higher penetration depth, contributing to a more extensive and shallower fusion zone at the interface between the filler metal and the base material. Tensile testing revealed impressive mechanical properties, with the ultimate tensile strength peaking at 90 N/mm2, a yield strength of 85 N/mm2, and the highest elastic modulus. This underscores the weld’s robustness in withstanding applied loads and resisting fracture. Furthermore, the calculation of the lowest K factor at 1.0375 indicated a reduction in resistance across the specimen, resulting in enhanced conductivity. Micro-TIG welding emerges as an efficient method for nickel-plated steel in connecting individual battery cells to form a high-capacity battery pack. These interconnections ensure efficient current flow and maintain the overall integrity and performance of the battery pack. The reliability and quality of these interconnects directly affect the battery’s efficiency, safety, and lifespan in EVs application.
1. Introduction
The rising prevalence of internal combustion vehicles, reliant on non-renewable conventional fuels, has given rise to both energy and environmental concerns. Consequently, numerous nations have adopted new energy vehicles as substitutes for traditional vehicles, aiming to diminish the reliance on oil and mitigate air pollution [1]. Governments worldwide are implementing stringent policies to reduce CO2 emissions and combat climate change. For instance, the UK’s commitment to achieving net-zero greenhouse gas emissions by 2050, as outlined in the report “Absolute Zero: Delivering the UK’s Climate Change Commitment with Incremental Changes to Today’s Technologies,” highlights the urgency of transitioning to low-carbon technologies, including EVs. These policies drive the adoption of EVs, which are crucial in reducing transportation-related emissions, a significant contributor to overall CO2 emissions [2].
Electric vehicles have emerged as a prominent and environmentally friendly alternative to conventional internal combustion engine vehicles. They have become a cornerstone of modern transportation, driven by the urgent need to reduce greenhouse gas emissions and reliance on non-renewable energy sources. The transition from internal combustion engine vehicles to EVs promises significant environmental and economic benefits. However, the widespread adoption of EVs faces several challenges, including cost, range anxiety, and the need for advancements in battery technology. The categories of EVs encompass pure electric vehicles [3], hybrid electric vehicles [4], and fuel cell electric vehicles [5]. A pure electric vehicle, often referred to as a battery electric vehicle, operates solely on power derived from a traction battery [6].
Range anxiety, the fear that an EV will not have sufficient range to reach its destination or a charging station, remains a significant barrier to widespread EV adoption. Recent studies, such as “Cost, range anxiety and future electricity supply: A review of how today’s technology trends may influence the future uptake of BEVs”, have examined how improvements in battery technology, powertrain design, and lightweight body structures can alleviate these concerns. Innovations in fast-charging technologies and the expansion of charging networks are also critical to reducing range anxiety [7]. Battery technology is at the heart of EV performance, influencing factors such as range, charging time, and overall vehicle cost. Recent advancements in lithium-ion batteries, solid-state batteries, and battery management systems have significantly improved energy density, safety, and longevity. Studies like “Automotive Li-Ion Batteries: Current Status and Future Perspectives” provide insights into these advancements, highlighting how they contribute to extending the range and reducing the costs of EVs [8]. The cost of EVs is another critical factor affecting their adoption. While the initial purchase price of EVs has traditionally been higher than that of conventional vehicles, decreasing battery costs and EV-friendly government policies are narrowing this gap [7,9].
One critical component of EVs is the battery pack, which plays a vital role in determining the vehicle’s performance, range, and overall reliability [10]. As EV technology continues to evolve, there is a growing demand for efficient and reliable methods to join battery interconnects specifically for the lithium-ion cylindrical cell case, which are essential for connecting individual battery cells to form a high-capacity battery pack [11]. The battery interconnects in EVs are responsible for carrying high electrical currents between adjacent battery cells, facilitating uniform distribution of power, and ensuring the battery pack operates optimally [12]. Consequently, achieving robust and low-resistance interconnects is of paramount importance in enhancing the overall performance and safety of EVs battery packs.
Conventional welding methods, such as resistance spot welding [13] and laser welding [14], have been widely used for joining battery interconnects in EVs. However, these methods have limitations, especially when dealing with micro-scale components and thin materials commonly found in modern battery designs [15]. Issues such as excessive heat input [16], material deformation [17], and limited accessibility have led researchers to explore alternative welding techniques. Micro-TIG welding has recently emerged as a promising solution for overcoming challenges in connecting battery interconnects within EVs. This welding technique is a modified version of conventional tungsten inert gas (TIG) welding specifically tailored for micro-scale applications. Moreover, micro-TIG welding is distinguished by reduced costs, lower energy requirements, and a more evenly distributed energy profile. These features contribute to improving the quality of welded joints at the ends of wires [18].
Micro-TIG welding is widely recognized for its precision in managing the welding process, enabling the creation of intricate and high-quality welds in micro-scale components [19]. The initiation of the welding arc is a crucial aspect, as it plays a fundamental role in generating precise and localized heat. This allows for meticulous control over the welding procedure and helps minimize the risk of thermal damage to the surrounding materials. It is imperative to initiate the arc under low-current conditions to prevent the burning of micro-components [20]. Research conducted by Meister et al. highlights the effectiveness of inductance in maintaining arc stability. Their experiments demonstrated that a 1 A argon arc could burn steadily when a 5–10 mH inductor was connected in series in the welding circuit. In contrast, an inductor of 0.6 mH could only sustain the arc above 3.5 A [21]. Another study by S. Pang et al. confirmed that, compared to high-frequency arc ignition, high-voltage arc ignition utilizing a tungsten needle as a negative electrode can break down the gas gap, forming a larger diameter streamer with more charged particles. This ensures sufficient time for the primary source to build up to the required arc current in the argon gas gap, extending up to 24 mm [22]. In essence, the process of arc ignition plays a crucial role in showcasing the potential performance of a welded joint. It not only contributes to the precision of the welding process in micro-TIG welding but also influences the overall effectiveness and quality of the weld joint.
This research introduces the optimization of arc initiation parameters, delving into the impact of different current modulations and arc lengths on the welding process and joint performance. This aspect highlights the importance of precise arc control in micro-TIG welding, emphasizing the significance of initiating the arc under low-current conditions to prevent thermal damage to micro-components. The study also includes microstructural analysis conducted through SEM and mechanical testing (tensile testing) to evaluate the weld joint’s performance. These analyses provide insights into the penetration depth, fusion zone characteristics, and mechanical properties of the weld, which are crucial for assessing its reliability and suitability for EV battery interconnects. In addition to microstructural and mechanical assessments, the research evaluates the electrical resistance of the welded joint. This aspect is particularly significant for battery interconnects, as low-resistance joints are essential for efficient power distribution within the battery pack, contributing to the overall performance and safety of EVs.
Thus, this study aims to evaluate the implications of using the micro-TIG welding method on welding processes and joint performance, focusing on microstructure analysis, mechanical testing, and electrical resistance evaluation. By advancing EVs battery interconnect welding technology through precise joining of micro-scale components and thin materials, this optimizes arc initiation parameters to enhance precision and ensure consistent weld quality. The research provides valuable insights into welded joint performance, emphasizing penetration depth and electrical resistance, which are critical for efficient power distribution in battery packs. These contributions could transform EV battery pack assembly, leading to the development of safer, more efficient, and environmentally friendly electric vehicles, thereby supporting sustainable transportation solutions.
2. Methodology
Nickel-plated steel refers to a steel base that undergoes electroplating to receive a layer of nickel coating. The choice of nickel-plated steel for this study is based on its suitability as a material for the battery interconnects in the lithium-ion cylindrical cell case. This coating enhances the corrosion resistance of the steel, shielding it from deterioration when subjected to the demanding conditions within an electric vehicle battery pack. This becomes particularly crucial as battery interconnects need to endure the corrosive impact of the electrolyte and various environmental elements throughout the vehicle’s operational life. The nickel-plated steel strip utilized for the test sample has a total thickness of 0.3 mm.
In the conducted experiment, two identical nickel-plated steel strips, each measuring 100 mm by 30 mm, were prepared. These strips were then meticulously positioned within a fixture, where they were securely clamped together. This clamping process was instrumental in eliminating any potential part-to-part gaps between the metal strips, creating optimal conditions for the subsequent welding procedure. The arrangement of the strips in the fixture allowed for an overlapping configuration. Following the cutting of the nickel-plated steel specimen into the specified dimensions, a critical step ensued: marking the metal to identify the precise overlap region between the upper and lower strips. This careful marking process was essential for determining the exact spot for the planned welding procedure, ensuring accurate alignment during the experiment. Figure 1 visually depicts the two nickel-plated steel strips and the marked welding spot.
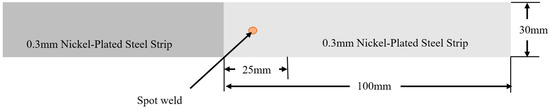
Figure 1.
Two nickel-plated steel strips and the marked welding spot.
Subsequently, the micro-TIG operation was executed using a Masterweld Digital Pulse TIG 200PAC/DC welding machine. The range of welding parameters was determined based on the specifications of the welding machine and the specific requirements of the welding process. The machine features an AC frequency ranging from 20 to 100 Hz, an input voltage of 230 V, a rated output current range of 5 to 200 A, and operates in Direct Current Electrode Negative (DCEN) mode. For this experiment, a Pure Class tungsten electrode with a diameter of 1.6 mm and a 20-degree tip angle was employed. Pure argon served as the shielding gas, administered at a flow rate of 5 L/min. The trigger time was consistently maintained at 3 s. Three different current modulations, specifically 15 A, 20 A, and 25 A, were implemented in conjunction with various arc lengths measured ranging from 2 mm to 5 mm. The gap between the welding electrode and the specimen was meticulously adjusted using a digital vernier caliper to ensure the desired arc length. Fine-tuning of the arc length was performed to position the tungsten electrode within the cup of the welding torch, achieved by rotating the back cup of the welding torch. The corresponding variable parameters were recorded and are documented in Table 1.

Table 1.
Variable parameters during micro-TIG welding operation.
Following preparation, the two nickel-plated steel sheets underwent thorough cleaning to eliminate all contaminants before the welding process. Once prepared, the specimen was securely positioned in the welding jig to prevent any movement during welding. The sheets were arranged in a lap joint configuration, ensuring proper alignment of the edges to be joined. To initiate the welding process, the trigger of the welding torch was carefully pressed for a duration of 3 s, with the tip accurately positioned on the specimen. This sequence was repeated three times for each parameter before adjusting the welding settings for the next parameter. The micro-TIG welding process took place on a securely held jig, effectively stabilizing both the welding torch and the specimen to minimize misalignment. This method significantly reduced the likelihood of variable factors and human errors, contributing to improved results. A total of 60 test samples were produced from the welding process to accommodate the three tests, each conducted with two repetitions. The values from these tests were then averaged to minimize the margin of error. Figure 2 shows the jig setup for the test samples during the experiment and one of the welded test samples.
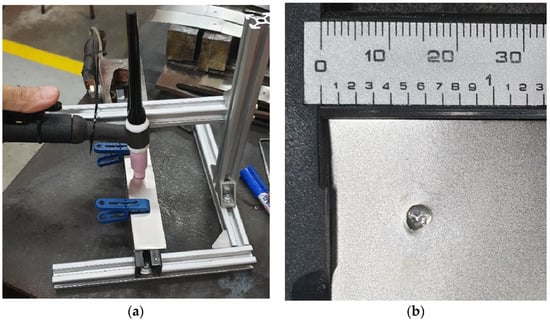
Figure 2.
(a) The jig utilized to ensure the test sample is constrained during the welding process and (b) the welded test sample.
Following completion of the welding process, the test samples underwent characterization through microstructure analysis, mechanical testing and electrical resistance evaluation. For microstructure analysis, the specimens were observed under a scanning electron microscope (SEM). At this stage, the test samples were cut into 10 mm strips, where the cut was made on the cross-section of the weld. The test sample was then molded with molding material using an automatic mounting press to ease handling. Then, the test sample was wet-sanded to remove any scratches made during the cutting process. Subsequently, an etching process was employed, involving the application of nitric acid to eliminate any remaining residues. Figure 3 shows the molded test sample with annotations indicating the extraction points. Figure 4 shows the SEM utilized to observe the test sample and the simulated position of the molded test sample under the SEM.
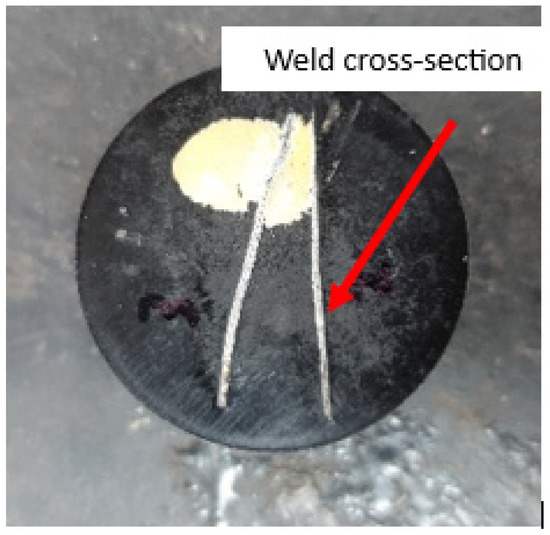
Figure 3.
The weld cross-section that is observed using SEM via the IMAPS program on a computer.
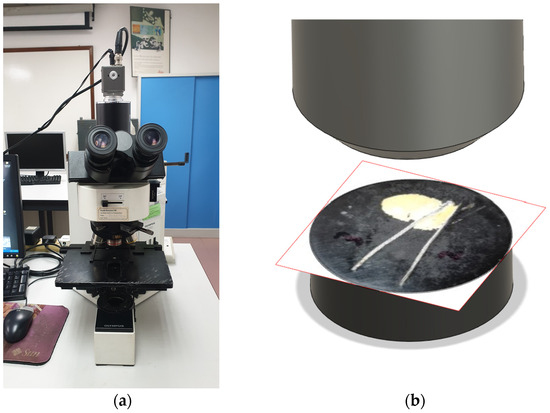
Figure 4.
(a) The SEM utilized to observe the molded test samples and (b) a simulated image to show the orientation of the molded test sample being put under the SEM.
In terms of mechanical testing, the tensile test was performed using a Shimadzu Servopulser universal tensile testing machine. Tensile testing involves converting the force applied to the material into stress to observe and understand the material’s behavior under load. The relationship between force and stress is fundamental in material science and engineering, and the relevant formulas are shown below. The stress ( is given by Equation (1):
where σ is stress (Pa), F is applied force (N), and A is the cross-sectional area of the material in unit m2. Meanwhile, strain () is shown in Equation (2) as follows:
where ϵ refers to strain, ∆L is the change in length, and L0 is the original length in unit meter (m). Then, Young’s modulus, E (Pa) is defined by Equation (3):
From the relevant formulas, stress can be obtained from the stress induced in the tensile testing. The force is applied to the test sample uniaxially and gradually increases until the material deforms or fractures. The force is recorded at each increment. Then, the cross-sectional area of the test sample is measured, which in this case is 30 mm in width and 0.3 mm in thickness, resulting in a value of 9 mm2 or 9 × 10⁻⁶ m2. This is under the assumption that the test sample has uniform cross-section and is an isotropic material. The stress can then be calculated by using the stress formula. The stress and corresponding strain are recorded continuously and simultaneously to generate a stress–strain curve. This allows for insight into the test samples’ mechanical properties such as the yield strength, ultimate tensile strength and elastic modulus. Simultaneously, resistance analysis of the sheet was conducted using a multimeter. The recorded values were then utilized to calculate joint resistance using the K factor, Equation (4):
where Rst1&st2 refers to the resistance of weld. Rst1 denotes the resistance value of the first nickel-plated steel sheet, while Rst2 is the resistance value of second nickel-plated steel sheet. Both values are added and divided by 2 to get the average resistance of the nickel-plated steel. A K factor of 1 implies no joint resistance, and it indicates that the overlap zone has the same resistance as the parent metal. The designated sites for measuring the resistance of the spot weld are depicted in Figure 5.
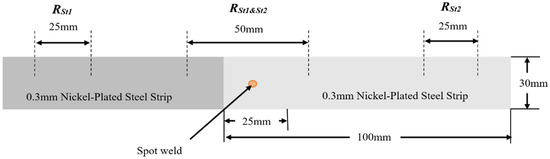
Figure 5.
The designated sites for measuring the resistance of the spot weld.
3. Results and Discussion
A comprehensive analysis has been conducted on various arc lengths of nickel-plated steel sheets, ranging from 2 mm to 5 mm. Through the implementation of three different current modulations of 15 A, 20 A, and 25 A, multiple aspects, including microstructure analysis, mechanical testing, and electrical resistance, have been scrutinized.
3.1. Microstructural Analysis
Microstructural analysis plays a crucial role in understanding the structural properties of lap joint-welded specimens and investigating the impact of the welding process. By employing a scanning electron microscope (SEM), the changes in microstructural features across different regions, including the weld zone and base metal, can be obtained. Figure 6 shows the cross-section of joint microstructures for the welded nickel-plated steel sheet. By examining the structure, two crucial parameters are identified which are penetration depth and interface width. The interface width signifies the cross-sectional length of the weld interface between the materials, while the penetration depth represents the depth of the weld pool from the interface into the lower material [23]. The observations indicate the attainment of a good weld, as the welded interface is positioned between two situations categorized as under-weld and over-weld. According to F. Usama et al., the term “under-weld” is applied when the penetration depth is less than 0.3 times the thickness of the thinnest material, while “over-weld” is defined as the penetration depth exceeding 0.8 times the thickness of the lower material or it achieves full penetration [24].
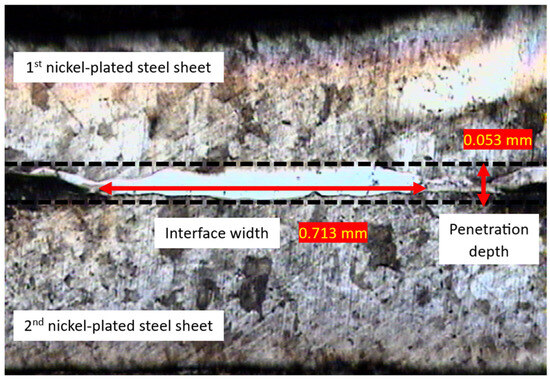
Figure 6.
Cross-section of joint microstructures for welded nickel-plated steel sheet.
The variations in current modulation resulted in changes to the penetration depth and the interface width values across different arc lengths of the nickel-plated steel sheet. Under a current modulation of 15 A, the penetration depth for a 2 mm arc length of the nickel-plated steel sheet was 0.063 mm, and this value decreased to 0.047 mm as the arc length extended to 5 mm. A similar trend was observed for a current modulation of 20 A, where the penetration depth started at 0.085 mm for a 2 mm arc length and reduced to 0.063 mm at a 5 mm arc length. In the case of a current modulation of 25 A, the penetration depth decreased from 0.120 mm at a 2 mm arc length to 0.079 mm at a 5 mm arc length. This trend indicated that as the arc length increased, so did the penetration depth. Q. Wang A et al. stated that longer arc length results in the concentration of heat over a larger area. While the overall heat input might decrease slightly due to the increased distance, the heat is spread out over a larger zone. This can lead to decreased penetration into the base material [25].
The results for interface width showed the converse pattern for different arc lengths of the nickel-plated steel sheet. Under a current modulation of 15 A, the interface width was 0.897 mm for a 2 mm arc length, and this value increased to 1.560 mm as the arc length increased. Similarly, with a current modulation of 20 A, the interface width started at 2.013 mm for a 2 mm arc length and increased to 2.862 mm at a 5 mm arc length. Under a current modulation of 25 A, the interface width increased from 2.152 mm at a 2 mm arc length to 2.206 mm at a 5 mm arc length. The pattern revealed that as the arc length increased, the interface width also increased. When the arc length is increased, the heat generated by the welding arc is spread over a larger area. While this can contribute to a decreased penetration depth, it may also lead to a broader and shallower fusion zone at the interface between the filler metal and the base material [26].
Considering the current modulation, a current modulation of 25 A showed the highest penetration depth (0.120 mm for 2 mm arc length) compared to 15 and 20 A modulation. A longer arc length and higher current modulation is observed aid the interface width of the joint while lowering the penetration depth. These results correspond with previous study by Ikpe A. et al. Their study reported that as the arc length increases, the welding arc column becomes more exposed to a cool boundary with heat losses, thus creating the need for high voltage. [27]. This high voltage increases the puddle heat, produces flatter welds, and increases the interface width of the weld. Other than that, the longer arc also produces an unstable welding arc, thus leading to reduced penetration depth. The method of measuring the interface width and penetration depth involves using the IMAPS program that is connected to the SEM. The IMAPS program allows the measurement of penetration depth, which starts at the uppermost section of the weld and ends at the bottommost section of the weld, while the interface width is measured from the rightmost section of the weld to the leftmost section of the weld. Figure 7 and Figure 8 show two of the test samples observed with measurements of the interface width and the penetration depth. The penetration depth and the interface width of nickel-plated steel sheets under varying arc lengths at different current modulations are shown in Figure 9 and Figure 10.
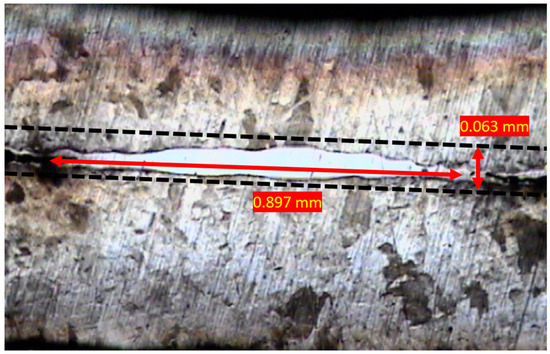
Figure 7.
Penetration depth and interface width for 15 A current modulation and 2 mm arc length.
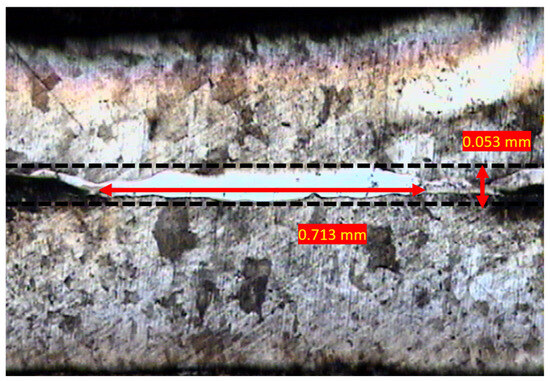
Figure 8.
Penetration depth and interface width for 15 A current modulation and 3 mm arc length.
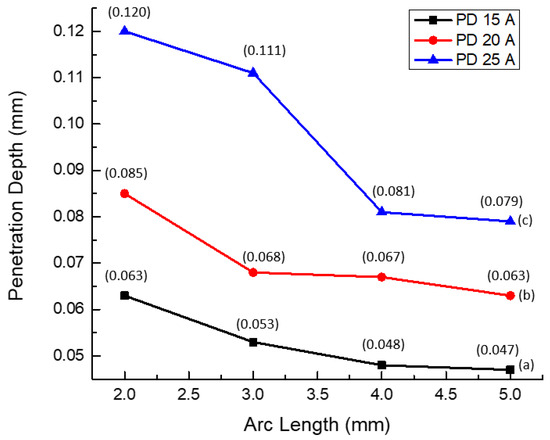
Figure 9.
The penetration depth of nickel-plated steel sheets under varying arc lengths at current modulations of (a) 15 A, (b) 20 A, and (c) 25 A.
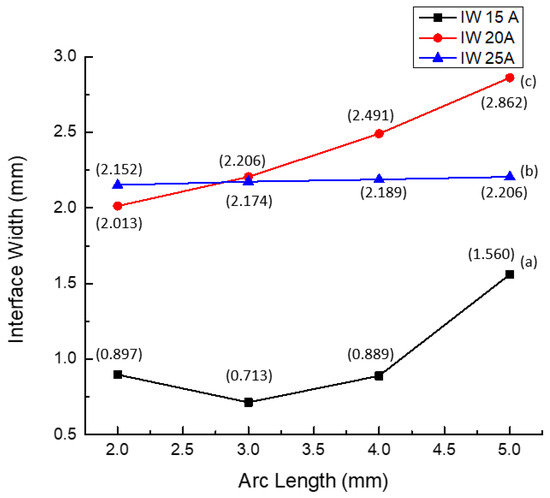
Figure 10.
The interface width of nickel-plated steel sheets under varying arc lengths at current modulations of (a) 15 A, (b) 20 A, and (c) 25 A.
3.2. Mechanical Testing
Using a tensile testing machine, a stress–strain curve graph was generated to extract valuable information about the lap joint-welded specimens. Key parameters such as ultimate tensile strength (UTS) and yield strength were derived from the analysis of the stress–strain curve. The UTS serves as an indicator of the maximum load that lap joint- welded specimens can endure before fracturing [28]. The yield strength represents the point at which plastic deformation begins in the material, signifying the threshold at which the lap joint-welded specimens exhibit permanent deformation under applied tensile forces [29]. These metrics offer critical insights into the strength and integrity of the welded joint. Additionally, other mechanical properties, such as elastic modulus and elongation, were calculated based on the recorded data. These results were obtained in accordance with relevant standards, specifically ASTM D1002. The failure mechanism of the test samples was observed. The failure induced on the test samples indicated a ductile fracture and the physical failure was observed to be similar throughout the test samples. The broken connections of some of the test samples are shown in Figure 11.
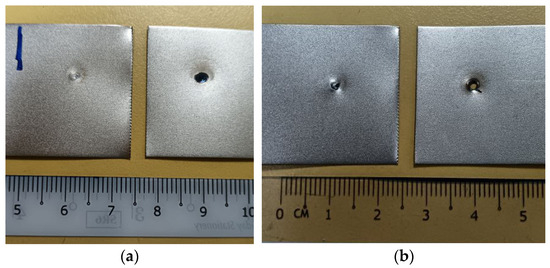
Figure 11.
The broken connections of the 5 mm arc length test sample for (a) 20 A and (b) 25 A current modulation.
The stress–strain curve patterns extracted from the graph display characteristic fluctuations, revealing typical UTS and yield strength behaviors. Specifically, for a current modulation of 15 A, the 5 mm arc length demonstrated the highest UTS value at 70 N/mm2, while the 2 mm arc length exhibited the lowest at 40 N/mm2. Similarly, under a 20 A current modulation, the 5 mm arc length registered the highest UTS value at 80 N/mm2, with the 2 mm arc length showing the lowest at 35 N/mm2. In the case of a 25 A current modulation, the 3 mm arc length yielded the highest UTS at 90 N/mm2, whereas the 2 mm arc length demonstrated the lowest UTS at 75 N/mm2. This trend suggests that an increase in arc length corresponds to an increase in UTS. Notably, among the different current modulations, 25 A displayed the highest UTS value, reaching up to 90 N/mm2. The findings align with the research of Y. Wang et al., supporting the notion that heightened heat from elevated welding currents enhances fusion and bonding between the filler metal and the base material. This refined metallurgical bond results in a more robust weld, augmenting its ability to withstand applied loads and resist fracture. Consequently, these outcomes contribute to a comprehensive evaluation of the structural reliability of the weld [30].
Another significant mechanical property derived from the tensile test is the yield strength. At 15 A current modulation, the 5 mm arc length demonstrated a yield strength of 65 N/mm2, while, at 20 A current modulation, the 5 mm arc length demonstrated a yield strength of 70 N/mm2 before entering plastic deformation. In the case of 25 A current modulation with a 3 mm arc length, the yield strength is observed to be the highest and able to sustain up to 85 N/mm2. These results showed indicators of the material’s ability to withstand mechanical stresses without undergoing significant plastic deformation or failure. The results corresponded with P. Haslberger et al., who showed that higher welding currents generally result in greater heat input, leading to increased penetration into the base material. Consequently, they contribute to a stronger weld joint with better fusion between the weld metal and the base material [31].
The elastic modulus, also known as Young’s modulus, reflects the stiffness of the material and its resistance to deformation when subjected to tensile forces. It describes the material’s ability to return to its original shape after the removal of the applied load [32]. Among the various current modulations, the highest Young’s modulus obtained in this study was for the 25 A current modulation, where all arc lengths achieved an identical slope in the stress–strain curve. Furthermore, the location and characteristics of the fracture within the lap joint-welded specimens offer valuable insights into the failure mode and the overall performance of the joint under tensile loading. The type of fracture observed for all specimens is seen to be ductile and this also correlates with the stress–strain curve [33]. The stress–strain curve at different arc lengths for 15 A, 20 A, and 25 A current modulation are shown in Figure 12, Figure 13, and Figure 14, respectively.
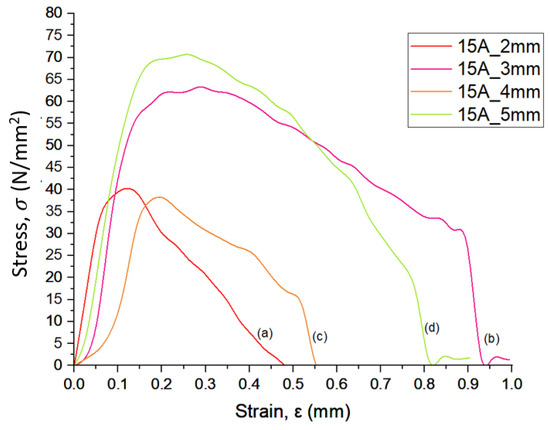
Figure 12.
The stress–strain curve at (a) 2 mm, (b) 3 mm, (c) 4 mm, and (d) 5 mm arc length for 15 A current modulation.
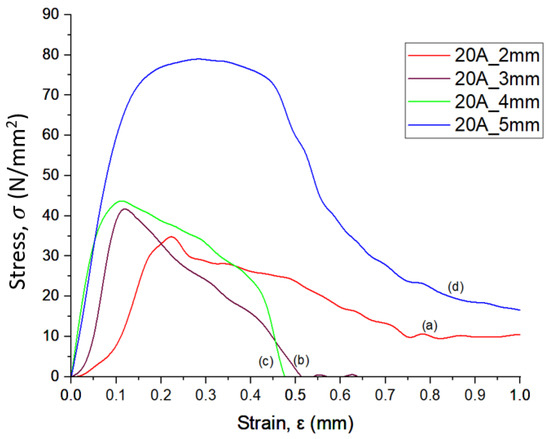
Figure 13.
The stress–strain curve at (a) 2 mm, (b) 3 mm, (c) 4 mm, and (d) 5 mm arc length for 20 A current modulation.
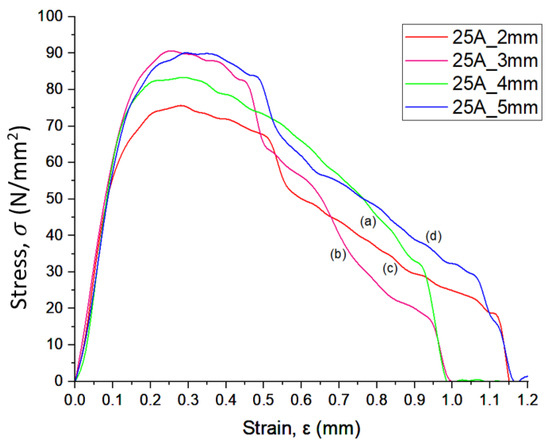
Figure 14.
The stress–strain curve at (a) 2 mm, (b) 3 mm, (c) 4 mm, and (d) 5 mm arc length for 25 A current modulation.
3.3. Electrical Resistance Analysis
Using a multimeter in ohmmeter mode, the lap joint of the welded specimen was subjected to specific currents and resistance values were recorded. The K factor was then calculated using Equation (1) for various current modulations and arc lengths. Notably, with 15 A current modulation, the K factor reached its peak at an arc length of 2 mm, registering 1.1250, while the lowest K factor of 1.0662 was observed at an arc length of 5 mm. Upon increasing the current to 20 A, a similar trend was noted, with a peak K factor of 1.0815 at an arc length of 2 mm and the lowest value of 1.0548 at an arc length of 5 mm. For a 25 A current modulation, the K factor was found to be 1.0616 at an arc length of 2 mm and 1.0375 at an arc length of 5 mm.
Analyzing the trends, it becomes apparent that the K factor consistently decreases with increasing arc length. Similarly, an increase in current modulation results in a decline in the K factor. The 25 A current modulation consistently exhibited the lowest K factor, specifically at 1.0375, compared to 15 A and 20 A. Among different arc lengths, 5 mm stood out with the lowest K factor. This aligns with a previous study by M. Alexy et al. asserting that a lower K factor indicates reduced resistance across the specimen, leading to higher conductivity [34]. Consequently, a low K factor is beneficial for battery joints, enhancing overall efficiency and performance of electrically conductive materials [35]. The K factor graph at different arc lengths and current modulations is depicted in Figure 15. However, using a multimeter to measure the resistance of the sample may yield discrepancies in the resistance value when compared to using a four-probe electrical resistance measuring method. This is one of the limitations in this experiment.
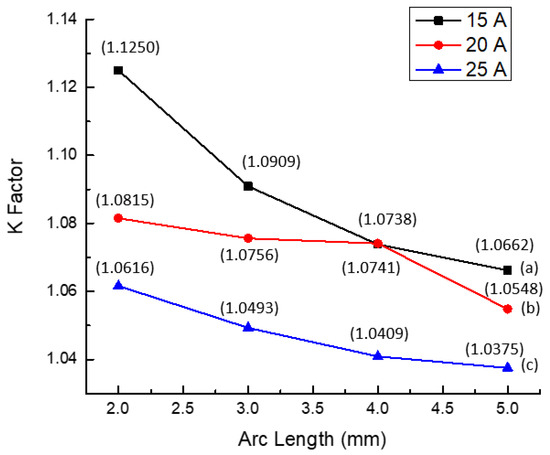
Figure 15.
The K factor graph at different arc lengths for (a) 15 A, (b) 20 A, and (c) 25 A current modulation.
4. Conclusions
In summary, the investigation into micro-TIG welding on nickel-plated steel sheets underscored significant material impacts. Through a comprehensive exploration of various arc lengths and current modulations, the optimal performance was consistently observed at a 5 mm arc length with a 25 A current modulation. Microstructural analysis further revealed a notable 0.079 mm penetration depth and the widest interface width, contributing to a more extensive and shallower fusion zone at the filler metal and the base material interface. Mechanical testing corroborated these findings, with the welded joint exhibiting a maximum UTS of 90 N/mm2, a yield strength of 85 N/mm2, and the highest elastic modulus. These characteristics collectively assessed the strength, deformation behavior, and the overall reliability of the welded joint. The refined metallurgical bond resulting from these conditions fortified the weld’s ability to withstand applied loads and resist fracture. Moreover, the calculation of the lowest K factor at 1.0375 indicated reduced resistance across the specimen, translating to higher conductivity. This attribute particularly facilitates efficient high-current flow and is advantageous for battery joints. The conclusion of these outcomes positions the combination of a 5 mm arc length and a 25 A current modulation as the potential parameters for achieving optimal welded joints in nickel-plated steel sheets. The implications of these findings extend the realm of welding research, holding promise for diverse industries. The identified parameters could pave the way for the optimization of micro-TIG welding processes, especially beneficial in real-world applications and, specifically, for electric vehicles, particularly in enhancing the performance of battery packs.
The research on micro-TIG welding of nickel-plated steel sheets has several limitations, including its focus on a specific material, which may not be directly applicable to other materials such as aluminum or copper, and its restriction to micro-scale applications, not addressing the effectiveness for larger components. The study does not account for environmental factors like temperature fluctuations, humidity, and exposure to corrosive elements, nor does it replicate real-world operational stresses such as vibrations, thermal cycling, and mechanical impacts. The investigation is limited to specific current modulations and arc lengths due to limited time and research budget, potentially overlooking optimal parameters for different applications. Additionally, the microstructural analysis conducted may not cover all potential changes, necessitating advanced techniques like transmission electron microscopy (TEM) or X-ray diffraction for comprehensive insights. The research also lacks long-term fatigue and durability testing, essential for ensuring the reliability of welded joints over the battery pack’s lifespan. Future work should explore the application of micro-TIG welding to a broader range of materials, investigate its effectiveness for larger components, conduct environmental testing, expand the range of welding parameters, and utilize advanced microstructural analysis techniques. Long-term fatigue and durability studies are needed, along with comparative studies of micro-TIG welding against other advanced welding techniques. Developing automated systems and advanced process control algorithms can enhance precision and efficiency, while comprehensive cost–benefit analyses and integration studies with existing EV manufacturing processes can evaluate the economic feasibility and impact on production efficiency. Addressing these limitations and pursuing the suggested future work can expand and refine the research, potentially leading to broader applications and more robust solutions for the challenges faced in the EV industry.
Author Contributions
Conceptualization, A.A. and E.E.M.N.; methodology, A.A.A.M. and N.M.A.; software, A.A.A.M.; validation, A.A., N.M.A. and E.E.M.N.; formal analysis, A.A.A.M.; investigation, A.A.A.M. and N.M.A.; resources, A.A. and E.E.M.N.; data curation, N.M.A.; writing—original draft preparation, A.A.A.M. and N.M.A.; writing—review and editing, N.M.A. and E.E.M.N.; visualization, A.A.A.M. and N.M.A.; supervision, A.A.; project administration, E.E.M.N.; funding acquisition, E.E.M.N. All authors have read and agreed to the published version of the manuscript.
Funding
The APC was funded by Multimedia University.
Data Availability Statement
The raw data supporting the conclusions of this article will be made available by the authors on request.
Acknowledgments
The author would like to acknowledge the Innovative Electromobility Research Lab, School of Mechanical Engineering, MARA University of Technology (UiTM), Shah Alam for technical support.
Conflicts of Interest
The authors declare no conflict of interest.
References
- Sun, X.; Li, Z.; Wang, X.; Li, C. Technology Development of Electric Vehicles: A Review. Energies 2013, 13, 90. [Google Scholar] [CrossRef]
- Ward, M.; Allwood, J.M.; Azevedo, J.; Cleaver, C.; Cullen, J.; Dunant, C.; Teppo, F.; William, H.; Ian, H.; Phillipa, H.; et al. Absolute Zero: Delivering the UK’s Climate Change Commitment with Incremental Changes to Today’s Technologies; University of Cambridge: Cambridge, UK, 2019; Volume 31, p. 30. [Google Scholar] [CrossRef]
- Karki, A.; Phuyal, S.; Tuladhar, D.; Basnet, S.; Shrestha, B.P. Status of pure electric vehicle power train technology and future prospects. Appl. Syst. Innov. 2020, 3, 35. [Google Scholar] [CrossRef]
- Hannan, M.A.; Azidin, F.A.; Mohamed, A. Hybrid electric vehicles and their challenges: A review. Renew. Sustain. Energy Rev. 2014, 29, 135–150. [Google Scholar] [CrossRef]
- Muthukumar, M.; Rengarajan, N.; Velliyangiri, B.; Omprakas, M.A.; Rohit, C.B.; Raja, U.K. The development of fuel cell electric vehicles—A review. Mater. Today Proc. 2021, 45, 1181–1187. [Google Scholar] [CrossRef]
- Sanguesa, J.A.; Torres-Sanz, V.; Garrido, P.; Martinez, F.J.; Marquez-Barja, J.M. A Review on Electric Vehicles: Technologies and Challenges. Smart Cities 2021, 4, 372–404. [Google Scholar] [CrossRef]
- Zhou, W.; Cleaver, C.J.; Dunant, C.F.; Allwood, J.M.; Lin, J. Cost, range anxiety and future electricity supply: A review of how today’s technology trends may influence the future uptake of BEVs. Renew. Sustain. Energy Rev. 2023, 173, 113074. [Google Scholar] [CrossRef]
- Ding, Y.; Cano, Z.P.; Yu, A.; Lu, J.; Chen, Z. Automotive Li-Ion Batteries: Current Status and Future Perspectives. Electrochem. Energy Rev. 2019, 2, 1–28. [Google Scholar] [CrossRef]
- Rapson, D.S.; Muehlegger, E. The Economics of Electric Vehicles. Natl. Bur. Econ. Res. 2023, 17, 274–294. [Google Scholar] [CrossRef]
- Daud, Z.H.C.; Asus, Z.; Bakar, S.A.A.; Husain, N.A.; Mazali, I.I.; Chrenko, D. Thermal characteristics of a lithium-ion battery used in a hybrid electric vehicle under various driving cycles. IET Electr. Syst. Transp. 2020, 10, 243–248. [Google Scholar] [CrossRef]
- Saw, L.H.; Ye, Y.; Tay, A.A.O. Integration issues of lithium-ion battery into electric vehicles battery pack. J. Clean. Prod. 2016, 113, 1032–1045. [Google Scholar] [CrossRef]
- Kerler, M.; Burda, P.; Baumann, M.; Lienkamp, M. A concept of a high-energy, low-voltage EV battery pack. In Proceedings of the 2014 IEEE International Electric Vehicle Conference (IEVC), Florence, Italy, 17–19 December 2014; pp. 1–8. [Google Scholar] [CrossRef]
- Soomro, I.A.; Pedapati, S.R.; Awang, M. A review of advances in resistance spot welding of automotive sheet steels: Emerging methods to improve joint mechanical performance. Int. J. Adv. Manuf. Technol. 2022, 118, 1335–1366. [Google Scholar] [CrossRef]
- Khan, M.S.; Soleimani, M.; Midawi, A.R.H.; Aderibigbe, I.; Zhou, Y.N.; Biro, E. A review on heat affected zone softening of dual-phase steels during laser welding. J. Manuf. Process. 2023, 102, 663–684. [Google Scholar] [CrossRef]
- Ervina, E.; Kovalan, K.V.; Suriati, G. A Review of Welding Parameter on Corrosion Behavior of Aluminum. Int. J. Eng. Appl. Sci. 2012, 1, 17–22. [Google Scholar]
- Arifin, N.M.; Mohamad, F.; Hussin, R.; Zafirah, A.; Ismail, M.; Arifin, N.M.; Mohamad, F.; Hussin, R.; Zafirah, A.; Ismail, M. Annealing Treatment on Homogenous n-TiO2/ZnO Bilayer Thin Film Deposition as Window Layer for p-Cu2O-Based Heterostructure Thin Film Film Deposition as Window Layer for p-Cu2O-Based. Coatings 2023, 13, 206. [Google Scholar] [CrossRef]
- Arifin, N.M.; Efzan, E.; Noor, M.; Mohamad, F.; Mohamad, N. The Impact of Spinning Speed on n-TiO2/ZnO Bilayer Thin Film Fabricated through Sol—Gel Spin-Coating Method. Coatings 2024, 14, 73. [Google Scholar] [CrossRef]
- Ferri, C.; Chinnathai, M.K.; Titmarsh, R.; Abdelaziz, H. Image segmentation of micro-TIG battery welds. In Proceedings of the 2022 27th International Conference on Automation and Computing (ICAC), Bristol, UK, 1–3 September 2022; pp. 1–6. [Google Scholar] [CrossRef]
- Muzni, N.H.M.; Noor, E.E.M.; Abdullah, M.M.A.B.; Aksoy, C. Effects of TiO2 and Al2O3 nanoparticles addition on the thermal properties and wettability of Sn-3.0Ag-0.5Cu-xTiO2-xAl2O3. J. Phys. Conf. Ser. 2022, 2169, 012003. [Google Scholar] [CrossRef]
- Pang, S.; Cao, B.; Wang, Y. Numerical analysis of low-current arc characteristics in micro-TIG welding. J. Manuf. Process. 2023, 105, 246–259. [Google Scholar] [CrossRef]
- Meister, R.A.; Meister, A.R. Special features of burning of a low-ampere arc in shielding gases. Weld. Int. 2006, 20, 993–995. [Google Scholar] [CrossRef]
- Pang, S.; Cao, B. Low current arc ignition stability in micro-TIG welding. J. Manuf. Process. 2021, 69, 12–20. [Google Scholar] [CrossRef]
- Singh, A.K.; Dey, V.; Rai, R.N. Techniques to improveweld penetration in TIG welding (A review). Mater. Today Proc. 2017, 4, 1252–1259. [Google Scholar] [CrossRef]
- Shaikh, U.F.; Das, A.; Barai, A.; Masters, I. Electro-Thermo-Mechanical Behaviours of Laser Joints for Electric Vehicle Battery Interconnects. In Proceedings of the 2019 Electric Vehicles International Conference (EV), Bucharest, Romania, 3–4 October 2019; pp. 1–6. [Google Scholar] [CrossRef]
- Wang, Q.; Qi, B.; Cong, B.; Yang, M. Output characteristic and arc length control of pulsed gas metal arc welding process. J. Manuf. Process. 2017, 29, 427–437. [Google Scholar] [CrossRef]
- Zhu, C.; Tang, X.; He, Y.; Lu, F.; Cui, H. Study on arc characteristics and their influences on weld bead geometry in narrow gap GMAW of 5083 Al-alloy. Int. J. Adv. Manuf. Technol. 2017, 90, 2513–2525. [Google Scholar] [CrossRef]
- Ikpe, A.E.; Ikechukwu, O.; Ikpe, E. Effects of Arc Voltage and Welding Current on the Arc Length of Tungsten Inert Gas Welding (TIG). Int. J. Eng. Technol. 2017, 3, 213–221. [Google Scholar]
- Tavio; Anggraini, R.; Raka, I.G.P. Agustiar Tensile strength/yield strength (TS/YS) ratios of high-strength steel (HSS) reinforcing bars. AIP Conf. Proc. 2018, 1964, 020036. [Google Scholar] [CrossRef]
- Yang, G.; Kim, J.K. An overview of high yield strength twinning-induced plasticity steels. Metals 2021, 11, 124. [Google Scholar] [CrossRef]
- Wang, Y.; Sun, J.; Jiang, T.; Sun, Y.; Guo, S.; Liu, Y. A low-alloy high-carbon martensite steel with 2.6 GPa tensile strength and good ductility. Acta Mater. 2018, 158, 247–256. [Google Scholar] [CrossRef]
- Haslberger, P.; Holly, S.; Ernst, W.; Schnitzer, R. Microstructure and mechanical properties of high-strength steel welding consumables with a minimum yield strength of 1100 MPa. J. Mater. Sci. 2018, 53, 6968–6979. [Google Scholar] [CrossRef]
- Hoc, N.Q.; Trong, D.N.; Cuong, N.C.; Tinh, B.D.; Hien, N.D.; Long, V.C.; Saraç, U.; Ţălu, Ş. Determination of Young Modulus and Stress-Strain Curve for Metal Fe and Interstitial Alloy FeC. J. Compos. Sci. 2022, 6, 250. [Google Scholar] [CrossRef]
- Springer, H.; Baron, C.; Szczepaniak, A.; Uhlenwinkel, V.; Raabe, D. Stiff, light, strong and ductile: Nano-structured High Modulus Steel. Sci. Rep. 2017, 7, 17–22. [Google Scholar] [CrossRef]
- Alexy, M.; van de Wall, D.; Shannon, G.; Boyle, M.L. Batteries need strong connections—Are resistance, laser and micro TIG welding the best suited joining technologies? Biul. Inst. Spaw. 2019, 2019, 53–63. [Google Scholar] [CrossRef]
- Heilmann, S.; Zwahr, C.; Knape, A.; Zschetzsche, J.; Lasagni, A.F.; Füssel, U. Improvement of the Electrical Conductivity between Electrode and Sheet in Spot Welding Process by Direct Laser Interference Patterning. Adv. Eng. Mater. 2018, 20, 1700755. [Google Scholar] [CrossRef]
Disclaimer/Publisher’s Note: The statements, opinions and data contained in all publications are solely those of the individual author(s) and contributor(s) and not of MDPI and/or the editor(s). MDPI and/or the editor(s) disclaim responsibility for any injury to people or property resulting from any ideas, methods, instructions or products referred to in the content. |
© 2024 by the authors. Licensee MDPI, Basel, Switzerland. This article is an open access article distributed under the terms and conditions of the Creative Commons Attribution (CC BY) license (https://creativecommons.org/licenses/by/4.0/).