Article

The Numerical Simulation of the Injection Filling of the Fluidity Probe Die with Pattern Waxes

by
Viacheslav E. Bazhenov
1,*,
Arseniy S. Ovsyannikov
1,
Elena P. Kovyshkina
1,
Andrey A. Stepashkin
2,
Anna A. Nikitina
1,
Andrey V. Koltygin
1,
Vladimir D. Belov
1 and
Dmitry N. Dmitriev
3
1
Casting Department, National University of Science and Technology “MISiS”, Leninskiy Pr. 4, 119049 Moscow, Russia
2
Center of Composite Materials, National University of Science and Technology “MISiS”, Leninskiy Pr. 4, 119049 Moscow, Russia
3
Public Joint Stock Company UEC “Kuznetsov”, Zavodskoe Shosse 29, 443009 Samara, Russia
*
Author to whom correspondence should be addressed.
J. Manuf. Mater. Process. 2024, 8(5), 213; https://doi.org/10.3390/jmmp8050213
Submission received: 27 August 2024 / Revised: 20 September 2024 / Accepted: 25 September 2024 / Published: 27 September 2024

Abstract

:
Investment casting is a widely utilized casting technique that offers superior dimensional accuracy and surface quality. In this method, the wax patterns are employed in the layer-by-layer formation of a shell mold. As is customary, the patterns were created through the injection of molten or semi-solid wax into the die. The quality of the final casting is affected by the quality of the wax pattern. Furthermore, the filling of the die with wax can be associated with die-filling challenges, such as the formation of weld lines and misruns. In this study, the injection filling of the fluidity probe die with RG20, S1235, and S1135 pattern waxes was simulated using ProCast software. The thermal properties of the waxes, including thermal conductivity, heat capacity, and density across a wide temperature range, were determined with the assistance of a laser flash analyzer, a differential scanning calorimeter, and a dynamic mechanical analyzer. A favorable comparison of the acquired properties with those reported in the literature was observed. The Carreau model, which corresponds to non-Newtonian flow, was employed, and the parameters in the Carreau viscosity equation were determined as functions of temperature. Utilizing the thermal data associated with the wax patterns and the simulation outcomes, the interfacial heat transfer coefficients between the wax and the die were ascertained, yielding a value of 275–475 W/m2K. A strong correlation was observed between the experimental and simulated filling percentages of the fluidity probe across a wide range of injection temperatures and pressures. The analysis of the simulated temperature, fraction solid, viscosity, and shear rate in the wax pattern revealed that viscosity is a crucial factor influencing the wax fluidity. It was demonstrated that waxes with an initial high viscosity exhibit a low shear rate, which subsequently increases the viscosity, thereby hindering the wax flow.

1. Introduction

Investment casting presents several distinct benefits over other casting methods, including superior dimensional accuracy and a high standard of surface quality for the resulting castings [1,2,3,4,5]. The investment casting process begins with the creation of patterns by injecting molten or semi-solid wax into a mold. These patterns are used to form ceramic shell molds layer by layer. Subsequently, the wax was removed from the mold through a process known as dewaxing.
In the process of pattern production, the wax should fill the thinnest sections of the die. However, the fluidity properties of the pattern waxes differ due to the diverse composition of waxes, which are mixtures of a variety of components, including natural or synthetic wax and resin, organic solid fillers, water, and other constituents. The injection parameters also exert a significant influence on the die filling by wax. As is customary, wax injection is conducted in two states of the wax: a paste semi-solid state or a liquid state. Paste injection occurs at low wax temperatures and enables the production of patterns with lower shrinkage and higher strength. However, it necessitates considerably higher pressures and specialized equipment. The liquid injection of pattern wax into the dies is also employed, for instance, for large patterns [4,6,7]. Unfortunately, the high initial temperature of the wax required for wax injection in a liquid state resulted in higher linear shrinkage of the pattern, higher temperature gradients within the pattern, and an increase in the volumetric shrinkage of the wax [8].
Bemblage et al. [9] employed a wax-filling simulation utilizing a transparent die for the visual verification of the wax flow. Pradyumna et al. [1] employed Moldex3D software to predict potential issues that may arise during the injection of pattern wax into a die, such as short shots, the formation of weld lines, and so forth. Consequently, the existing literature on the injection simulation of pattern wax into the die was limited, and the issue of die filling was largely overlooked. In general, the adjustment of injection parameters is achieved through a trial-and-error methodology [10]. The investment casting method is capable of accurately reproducing the intricate details of the wax pattern, thereby ensuring that any imperfections, such as misruns and welding lines, present in the original wax pattern are faithfully replicated in the final casting. Die-filling simulation, however, can prevent the formation of misruns and welding lines in the thin sections of wax patterns [9,11]. Furthermore, the injection parameters exert an influence on the degree of linear shrinkage and the quality of the surface finish of the wax pattern [6,7].
The primary challenge in simulating wax filling lies in the intricate rheological properties of waxes, which vary significantly between their liquid, paste, and solid states [12]. In the case of paste and solid conditions, waxes display the characteristics of an elastic–viscoplastic material [13]. In the liquid state, which is well above the melting point, waxes behave as relatively low-viscosity Newtonian fluids [9]. Thus, the rheological behavior of wax in the liquid state differs from that of metallic melts due to the non-Newtonian nature of waxes [14,15].
Previously, a novel probe for fluidity testing was developed, which allows the wax to flow steadily through the die channels due to the barrier effect of the pins, which impede the velocity of the wax [16]. If one of the dies were made from transparent material, it would be beneficial for wax flow observations.
The aims of this study were as follows: (i) determine the waxes’ thermal and rheological properties, (ii) obtain the interfacial heat transfer coefficient (IHTC) between the wax and the die, (iii) simulate the effect of injection temperature and pressure on die filling, and (iv) compare the fluidity probe filling simulation results and the experimental probe filling results.

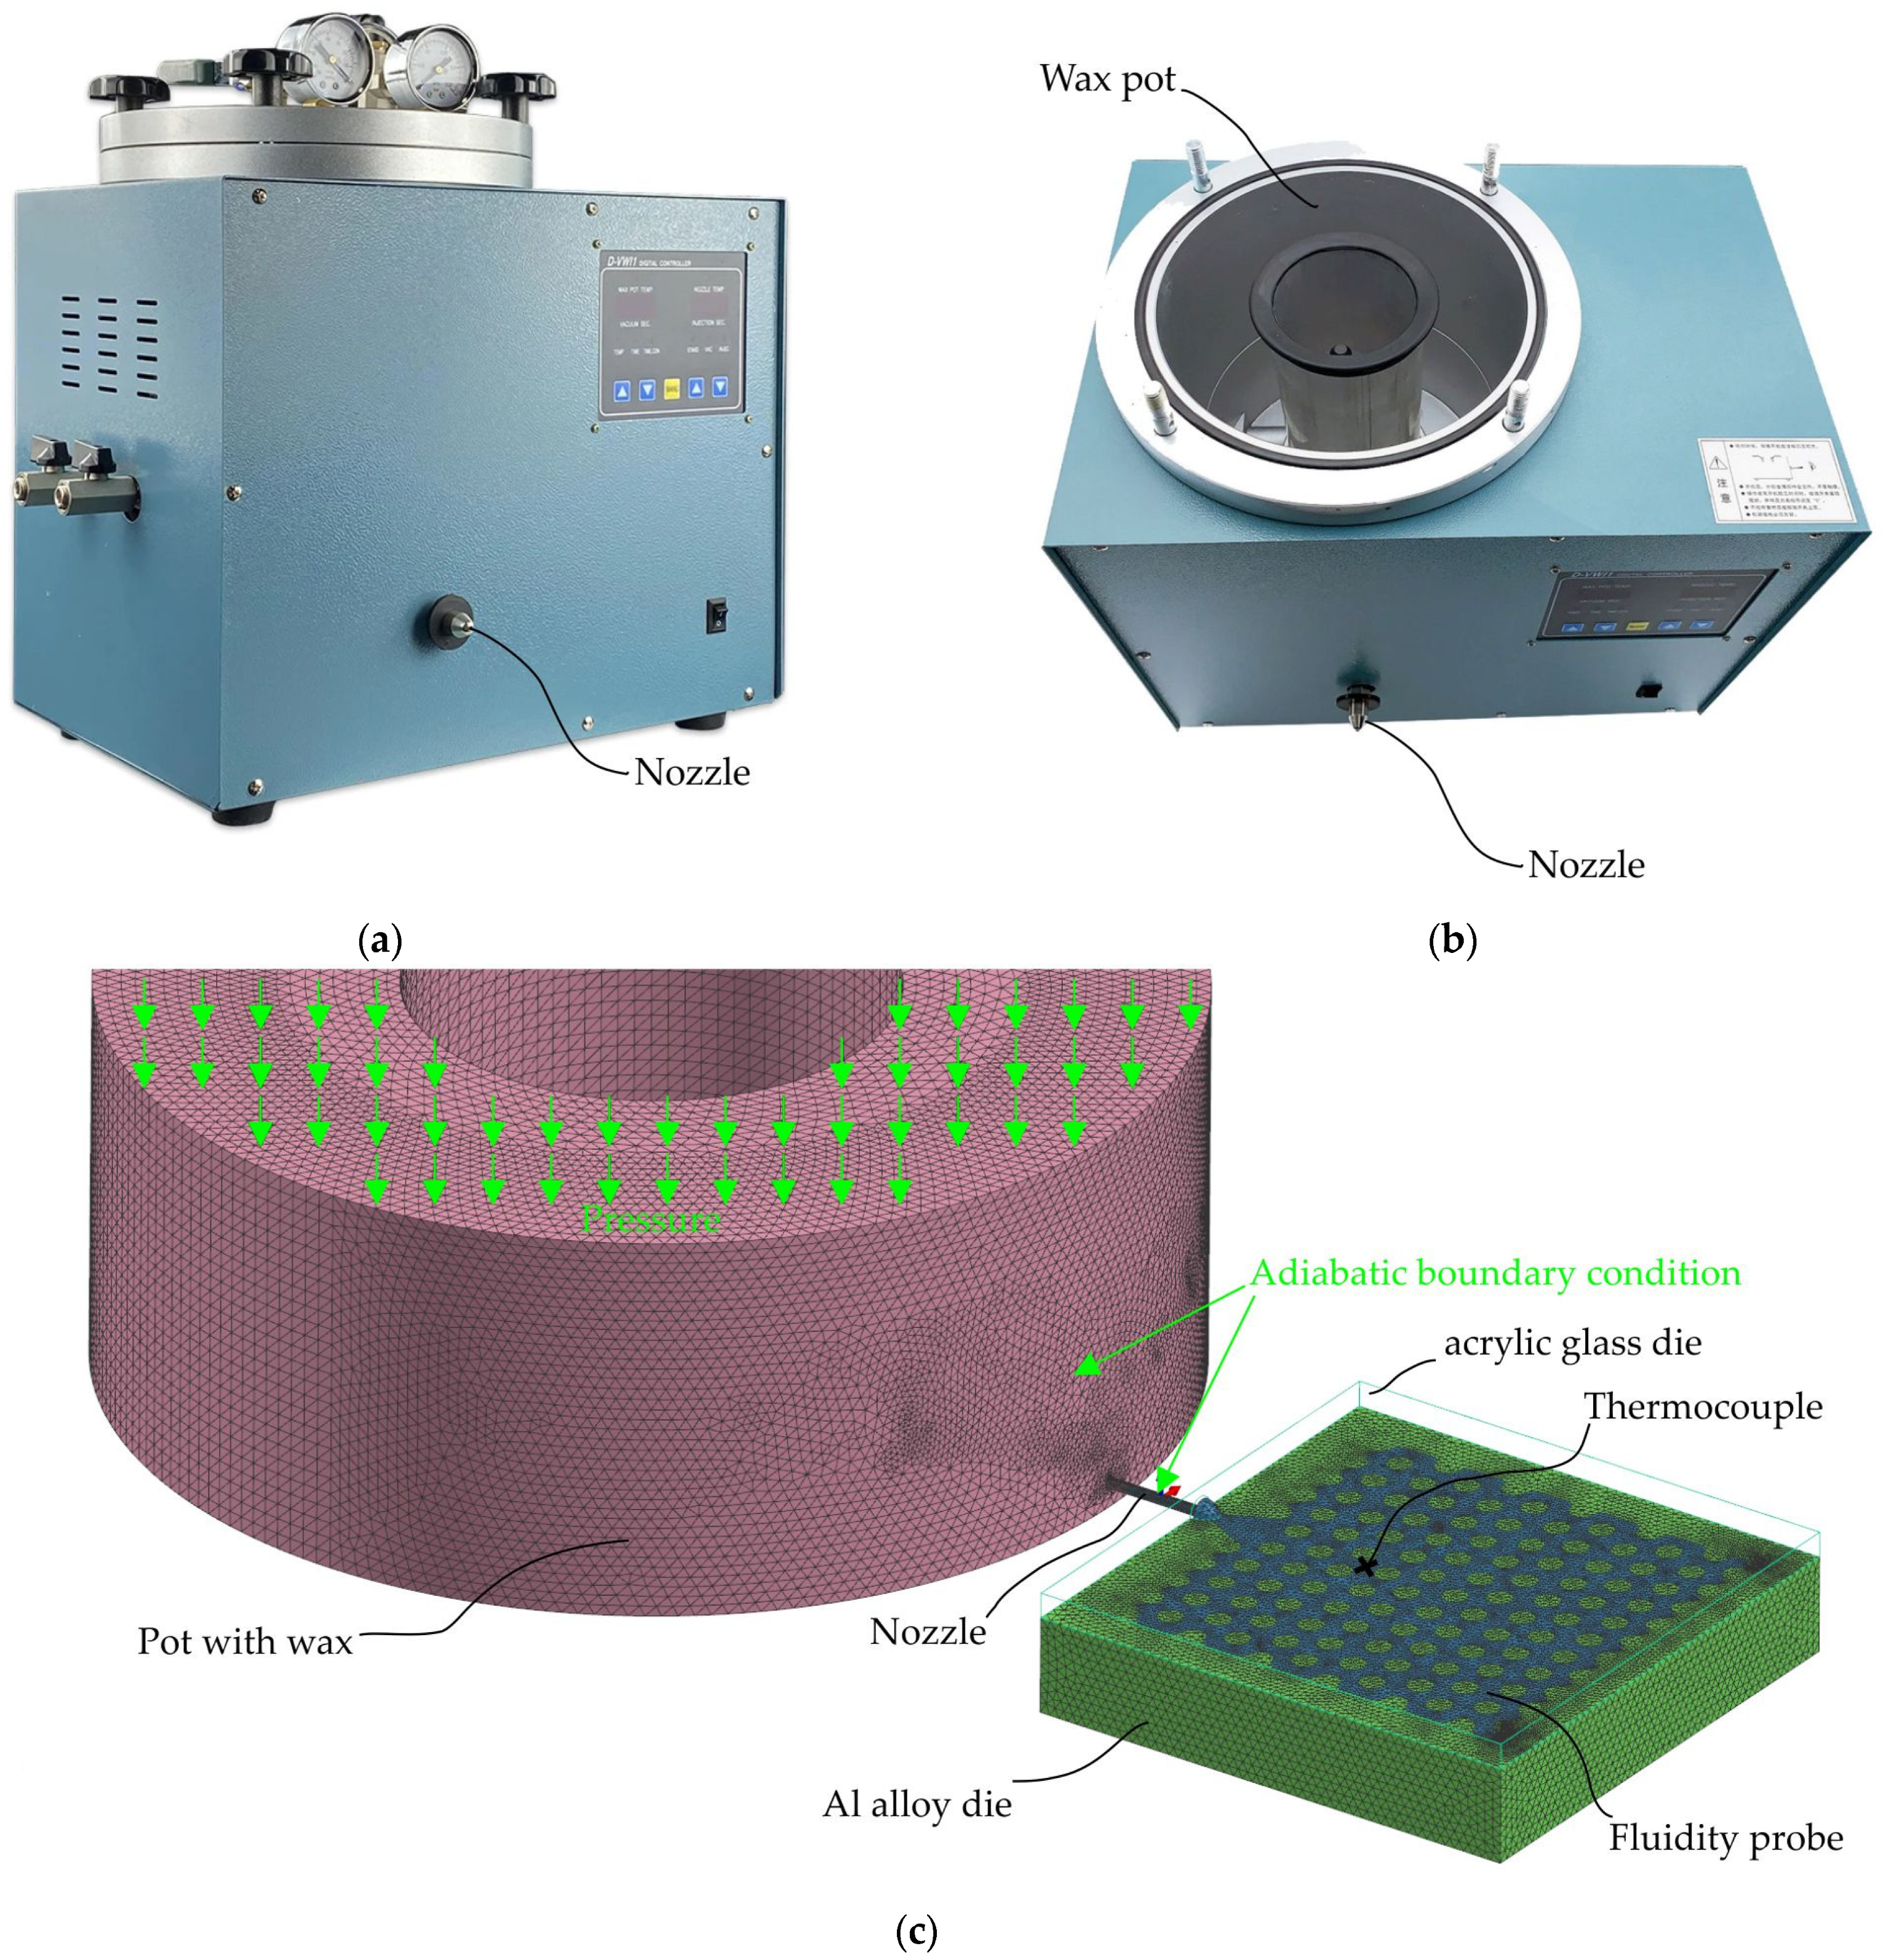
2. Materials and Methods

In this study, three commercial waxes were utilized: RG20, S1235, and S1135 (Technopark, Moscow, Russia). The characteristics of the waxes supplied by the vendor are outlined in Table 1. It can be observed that all waxes contain cross-linked polystyrene particles, with the fraction differing between the waxes. Moreover, in the S1135 wax, the cross-linked polystyrene is partially replaced by terephthalic acid.
The die for fluidity determination, which was previously utilized [16], underwent minimal modifications. The configuration and dimensions of the die are presented in Figure 1. The front plate was constructed from acrylic glass, with a thickness of 5 mm. The backplate, made from 5251 aluminum alloy, featured a cavity for a fluidity probe, which was identical to the previous iteration and is described in detail elsewhere [16]. The front acrylic glass plate was drilled and the K-type thermocouple was installed in the mold cavity for the purpose of measuring the temperature of the wax during and following the filling of the die.
Fluidity probe patterns were produced at injection temperatures of 60, 70, 80, and 90 °C, and injection pressures of 49, 98, 147, and 196 kPa. The injection was conducted on a digital vacuum wax injector D-VWI-1 (DING XIN, Shenzhen, China) depicted in Figure 2a,b. The injector wax pot and nozzle temperature were set to be identical. The injection time was 3 s. To guarantee temperature equilibrium, the wax pot was maintained for a period of two hours following a modification in the injection temperature. This was due to the low thermal conductivity of the wax and the challenges associated with mixing the wax in the wax pot [17]. The die was lubricated with oil and maintained at room temperature prior to injecting the wax.
The injection process was filmed at 300 frames per second with a Casio EXILIM EX-F1 high-speed camera. Frames corresponding to 1, 2, and 3 s were extracted from each video. To measure the filled area, each exported frame was placed behind a vector image of the mold cavity and scaled (Figure 3a). The filled probe profile was then traced, and a Boolean intersection operation was used to obtain the filled area from the entire mold cavity (Figure 3b). The filling percentage of the fluidity test was calculated as the area filled by wax relative to the total area of the probe, expressed as a percentage. The ImageJ software (version 1.52a, National Institutes of Health, Bethesda, MD, USA) was used to determine the filled and total areas of the fluidity probe.
In order to determine the interfacial heat transfer coefficient (IHTC) between the wax and the die the temperature of the wax when the fluidity probe was filled and after the solidification and cooling stages was logged using a BTM-4208SD (Lutron, Taipei, Taiwan) temperature monitoring device with 12 channels and a recording frequency of 1 s. For all waxes, the injection temperature was 90 °C. The injection pressure for the S1135 and S1235 waxes was 196 kPa and for RG20 wax was 147 kPa.

3. Simulation Procedure and Wax Properties Determining

The ProCast 2022.0 commercial simulation software was employed for the simulation of wax fluidity probe filling and solidification. A methodology based on the finite element method was utilized for the heat flow calculations, which entailed solving the Fourier thermal conduction equation, and for the calculation of the filling, which involved solving the Navier–Stokes equation [18]. The specific details and the equations utilized can be found in the referenced literature [19,20,21]. The tetrahedral mesh of the probe, die, and pot with wax was prepared and contains 1.2 M elements (Figure 2c). A pressure-driven filling algorithm was used for the die-filling simulation. The typical image showing the filling simulation results is shown in Figure 3c.
The Carreau–Yasuda model, which corresponds to non-Newtonian flow, was employed in this study, as it allows for the viscosity to be dependent upon the shear rate [12,22]. The apparent viscosity ( η a ) was calculated using Equation (1):
η a = η + ( η 0 η ) 1 + λ a γ ˙ a ( n 1 / a )
where γ ˙ is the shear rate, η is the infinite shear rate viscosity, η 0 is the zero shear rate viscosity, n is the degree to which the viscosity is affected by changes in the shear rate, a is the Yasuda coefficient, and λ is a time constant. In previous works [10,12,13], a special case of the Carreau–Yasuda model was employed for the simulation of wax flow behavior because it provided an excellent description of the experimental wax viscosity data. This special case is referred to as the Carreau model, and it is characterized by the Yasuda coefficient a = 2. The rheological data from our previous work were used to calculate the η 0 , η , λ, γ ˙ , and n parameters [16]. In this study, the parameters η 0 , η , λ, γ ˙ , and n have been defined as a function of temperature. The waxes’ phase transition temperatures and transition enthalpies also were taken from our previous work [16].
Room-temperature (25 °C) density of the wax samples (ρ) was determined via hydrostatic weighing in ethyl alcohol. The density of RG20, S1235, and S1135 waxes was 0.98, 0.99, and 1.01 g/cm3, respectively. Using the thermal expansion coefficients, obtained with a DMA 800Q (Texas Instruments, Dallas, USA) Dynamic Mechanical Analyzer, the temperature dependence of ρ was calculated. The laser flash analyzer LFA 447 (NETZSCH, Selb, Germany) was used for determining the thermal diffusivity (a). The heat capacity (CP) was determined with the help of the DSC 204F1 Phoenix (NETZSCH, Selb, Germany) calorimeter. The mean error for the apparatus used for thermal properties measurements is 2–3%. Third-order polynomials were employed to describe the temperature dependence of the thermal diffusivity, density, and heat capacity, which were then used to calculate the thermal conductivity (K) with the aid of Equation (2):
K = aρCP.
The thermal properties of the 5251 aluminum alloy, which was used for one of the die halves, were calculated using the CompuTherm LLC thermodynamic database in ProCast 2022.0 and shown in Figure 4a–c. The thermal properties of the acrylic glass form literature are presented in Figure 4d–f. Because of the close values of the thermal properties provided in the literature, the properties from ref. [23] are the average, among others, and are used for simulation.
In order to ascertain the IHTC between the wax and the die, a trial-and-error approach was employed. The temperature of the wax, as measured by a thermocouple in the fluidity probe, was compared to the simulated wax temperature at varying IHTC values. The error function, which serves as a measure of the discrepancy between the experimental and simulated temperatures, was utilized to fit the IHTC [26].

4. Results

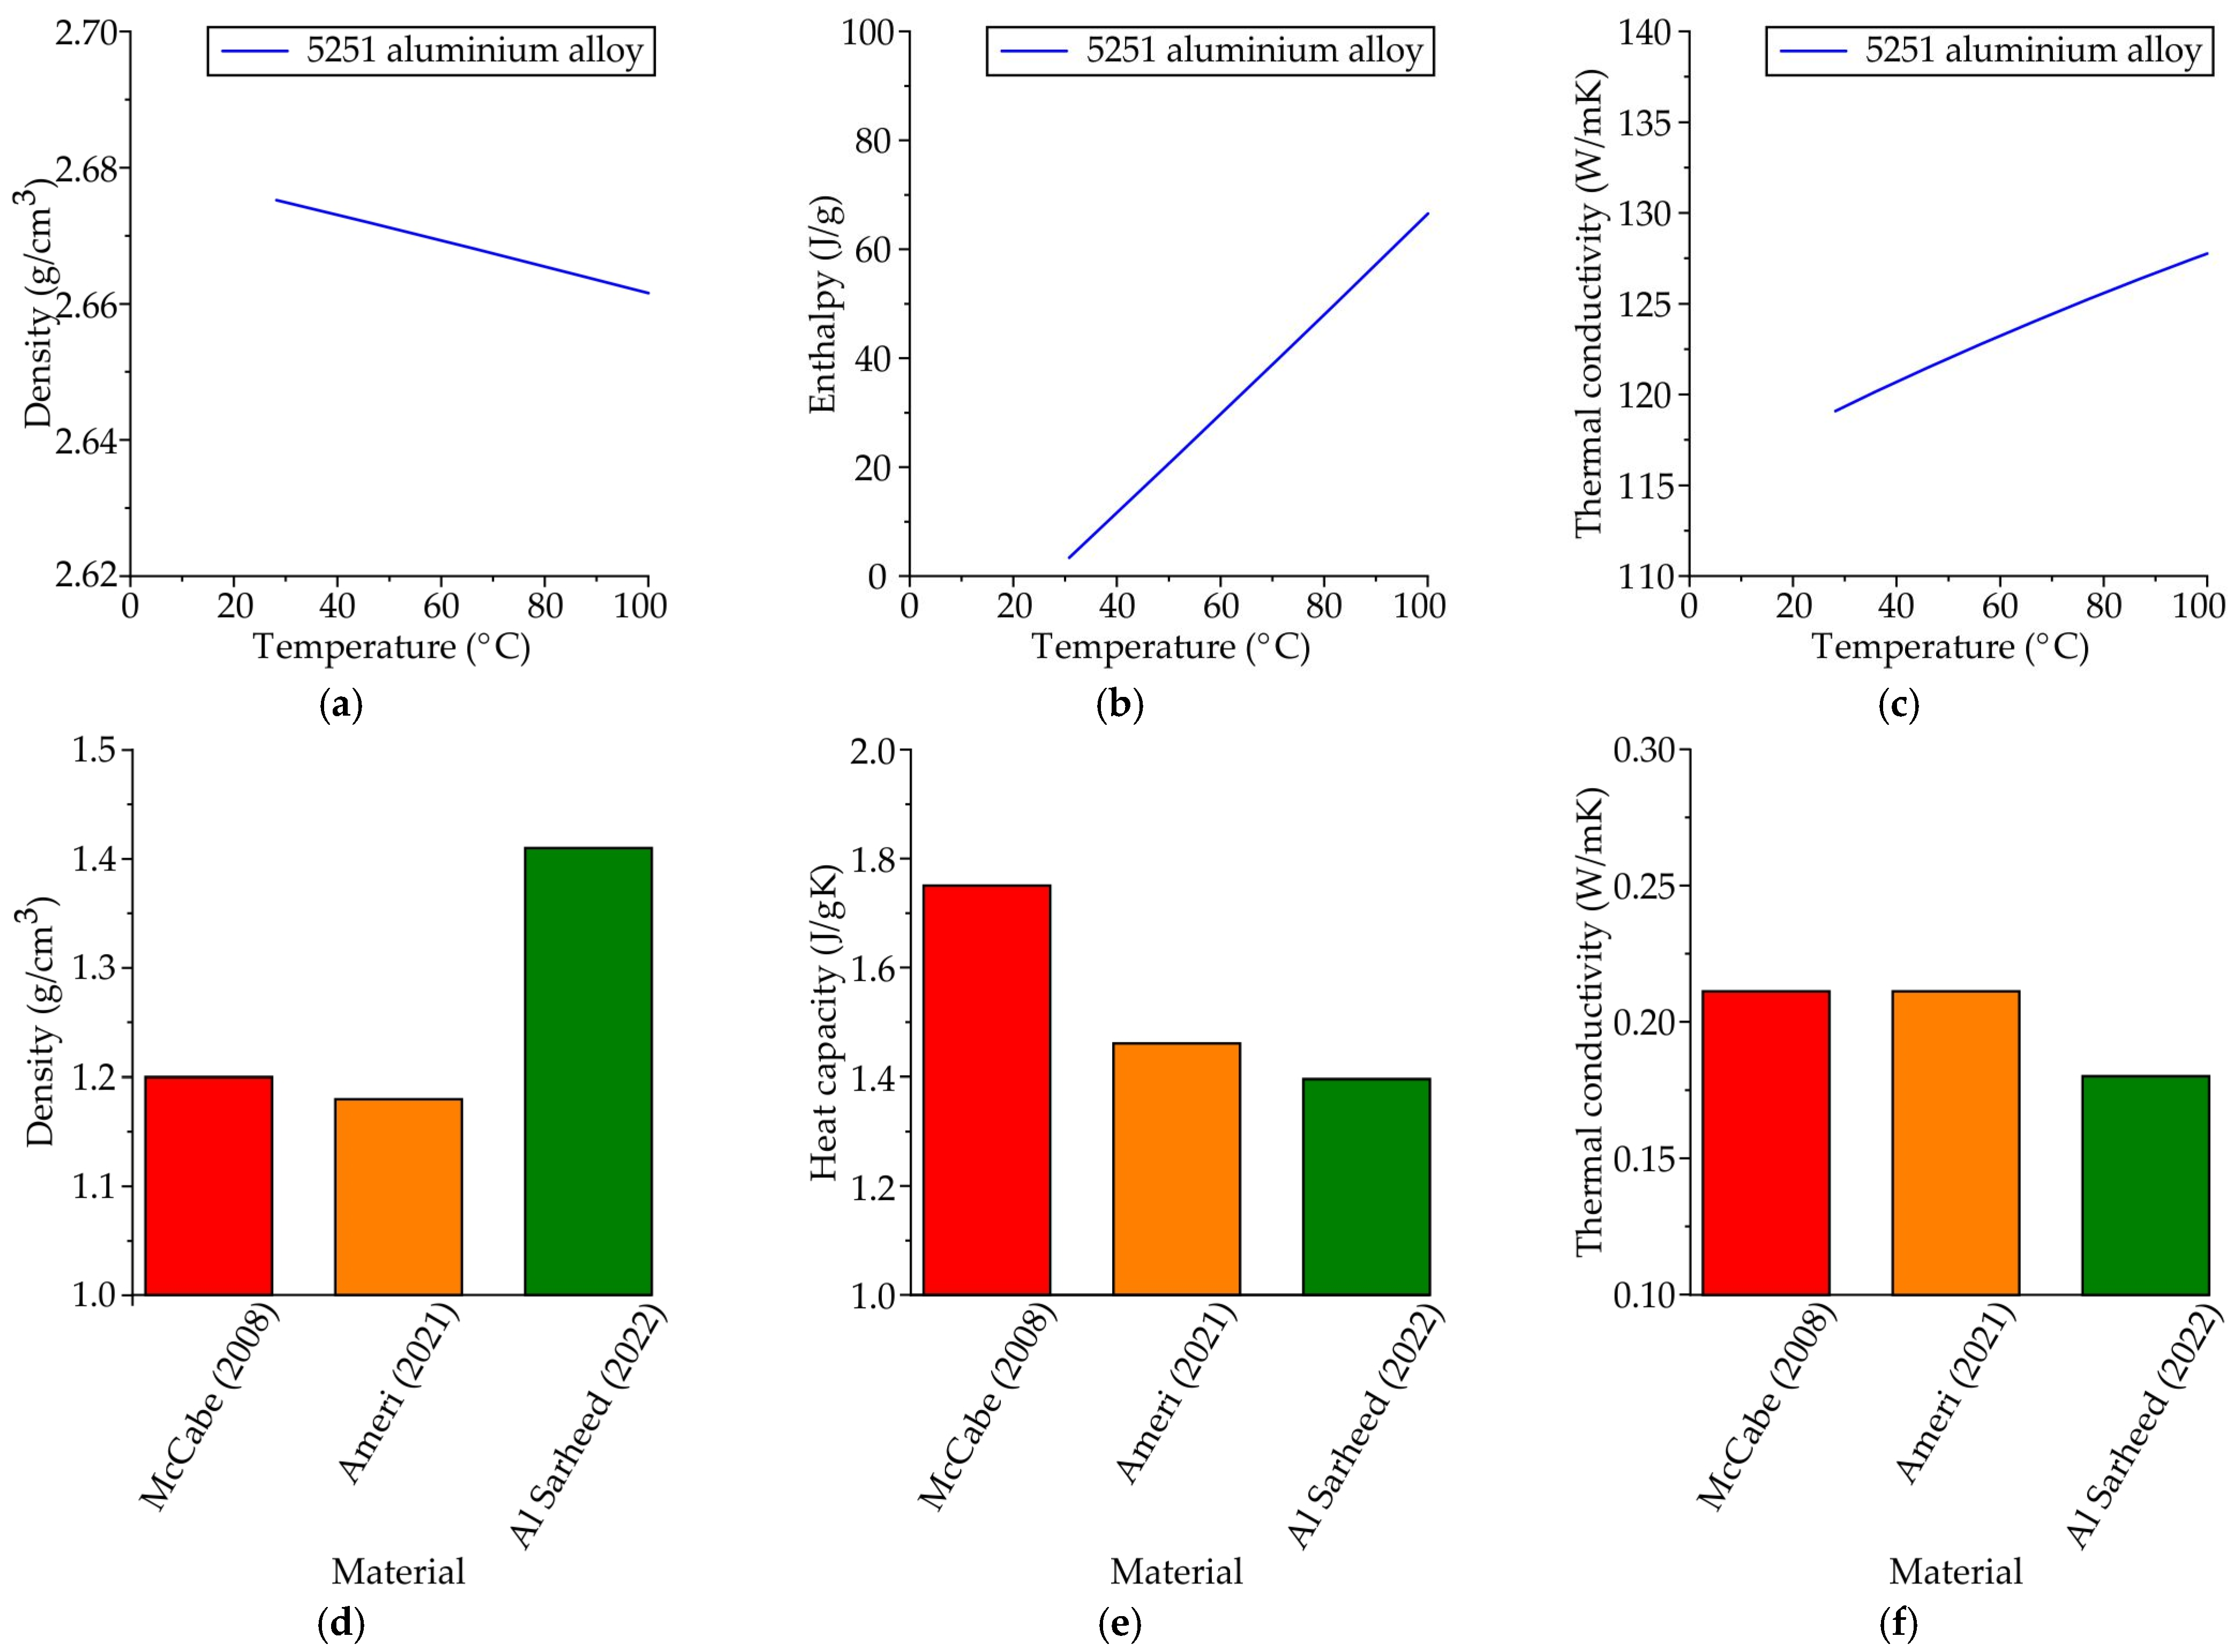
4.1. The Waxes Thermal Properties

Figure 5 shows the thermal conductivity, heat capacity, and density of RG20, S1235, and S1135 waxes obtained in this work and the thermal properties of other waxes found in the literature [12,13,14,27,28,29,30,31]. The thermal conductivity of most waxes as provided in the literature is in the short range of 0.15–0.3 W/mK. The thermal conductivity obtained in this work for RG20, S1235, and S1135 waxes are in this range. Our results provide near-linear temperature dependence of the wax’s thermal conductivity because the thermal diffusivity measurements were carried out in the solid state of the wax only. Some data from the literature demonstrate a change in the thermal conductivity of wax during the liquid–solid transition. However, this difference is close to 20%, which can be considered insignificant for the purposes of wax flow simulation [12,14,28,29]. In accordance with the obtained results, the thermal conductivity of the S1135 and S1235 waxes are the same and near 0.2 W/mK. A slightly higher thermal conductivity of ~0.26 W/mK is observed for RG20 wax.
The mean values of heat capacity of RG20, S1235, and S1135 waxes are 1.75, 1.53, and 1.46 J/gK. Thus, the heat capacity of RG20 wax is also higher than for other investigated waxes. With increasing temperature, the heat capacity of waxes also slightly increased. The same trend is observed for other wax heat capacities provided in the literature. A comparison of the heat capacity obtained in this study with that provided in the literature is challenging. In numerous articles, the heat from transitions that occur when wax crystallizes are illustrated in the heat capacity curves, without the requisite subtraction. Nevertheless, in some works proper data where transition heat was subtracted is provided, and heat capacity is in the range of 1.7–2.8 J/gK, which was a little higher than obtained in this work.
The density of the waxes under investigation is decreased with temperature increasing. For RG20 wax, a greater difference between low- and high-temperature density is observed than for S1235 and S1135 waxes. At the same time, the obtained values of density (1.00–0.81 g/cm3) are in the range of typical density for the other waxes provided in the literature (0.97–0.75 g/cm3).

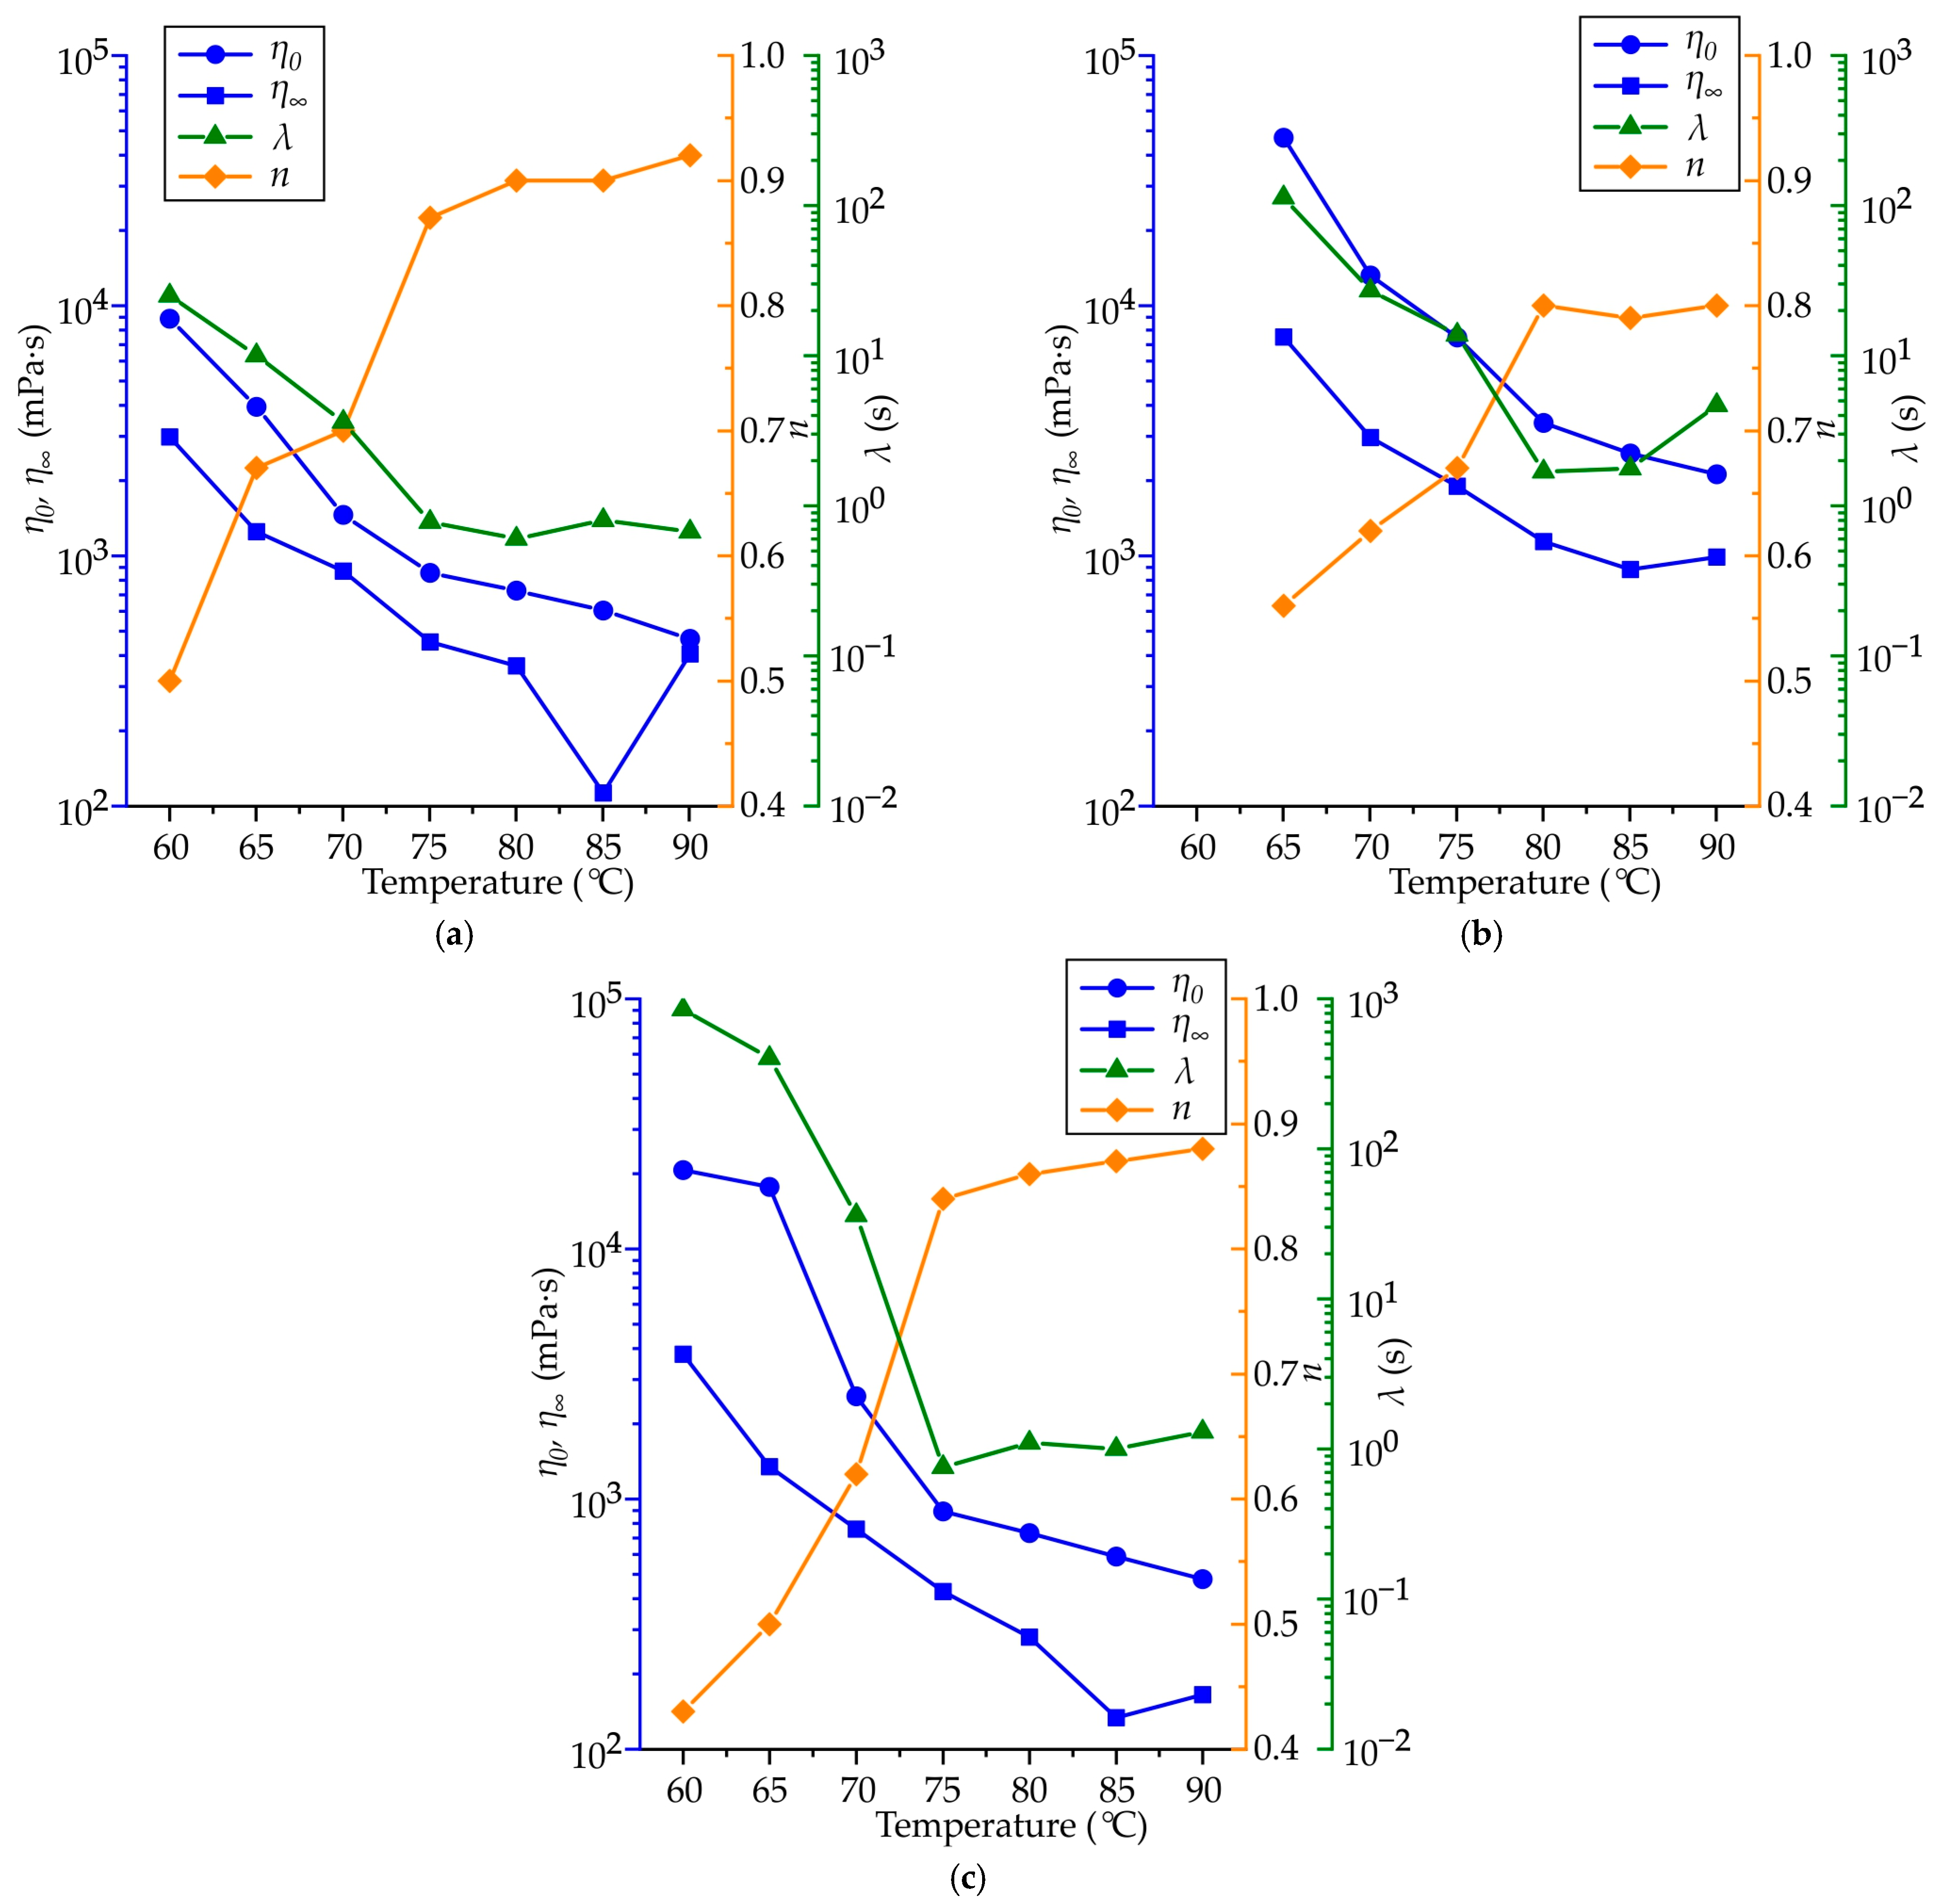
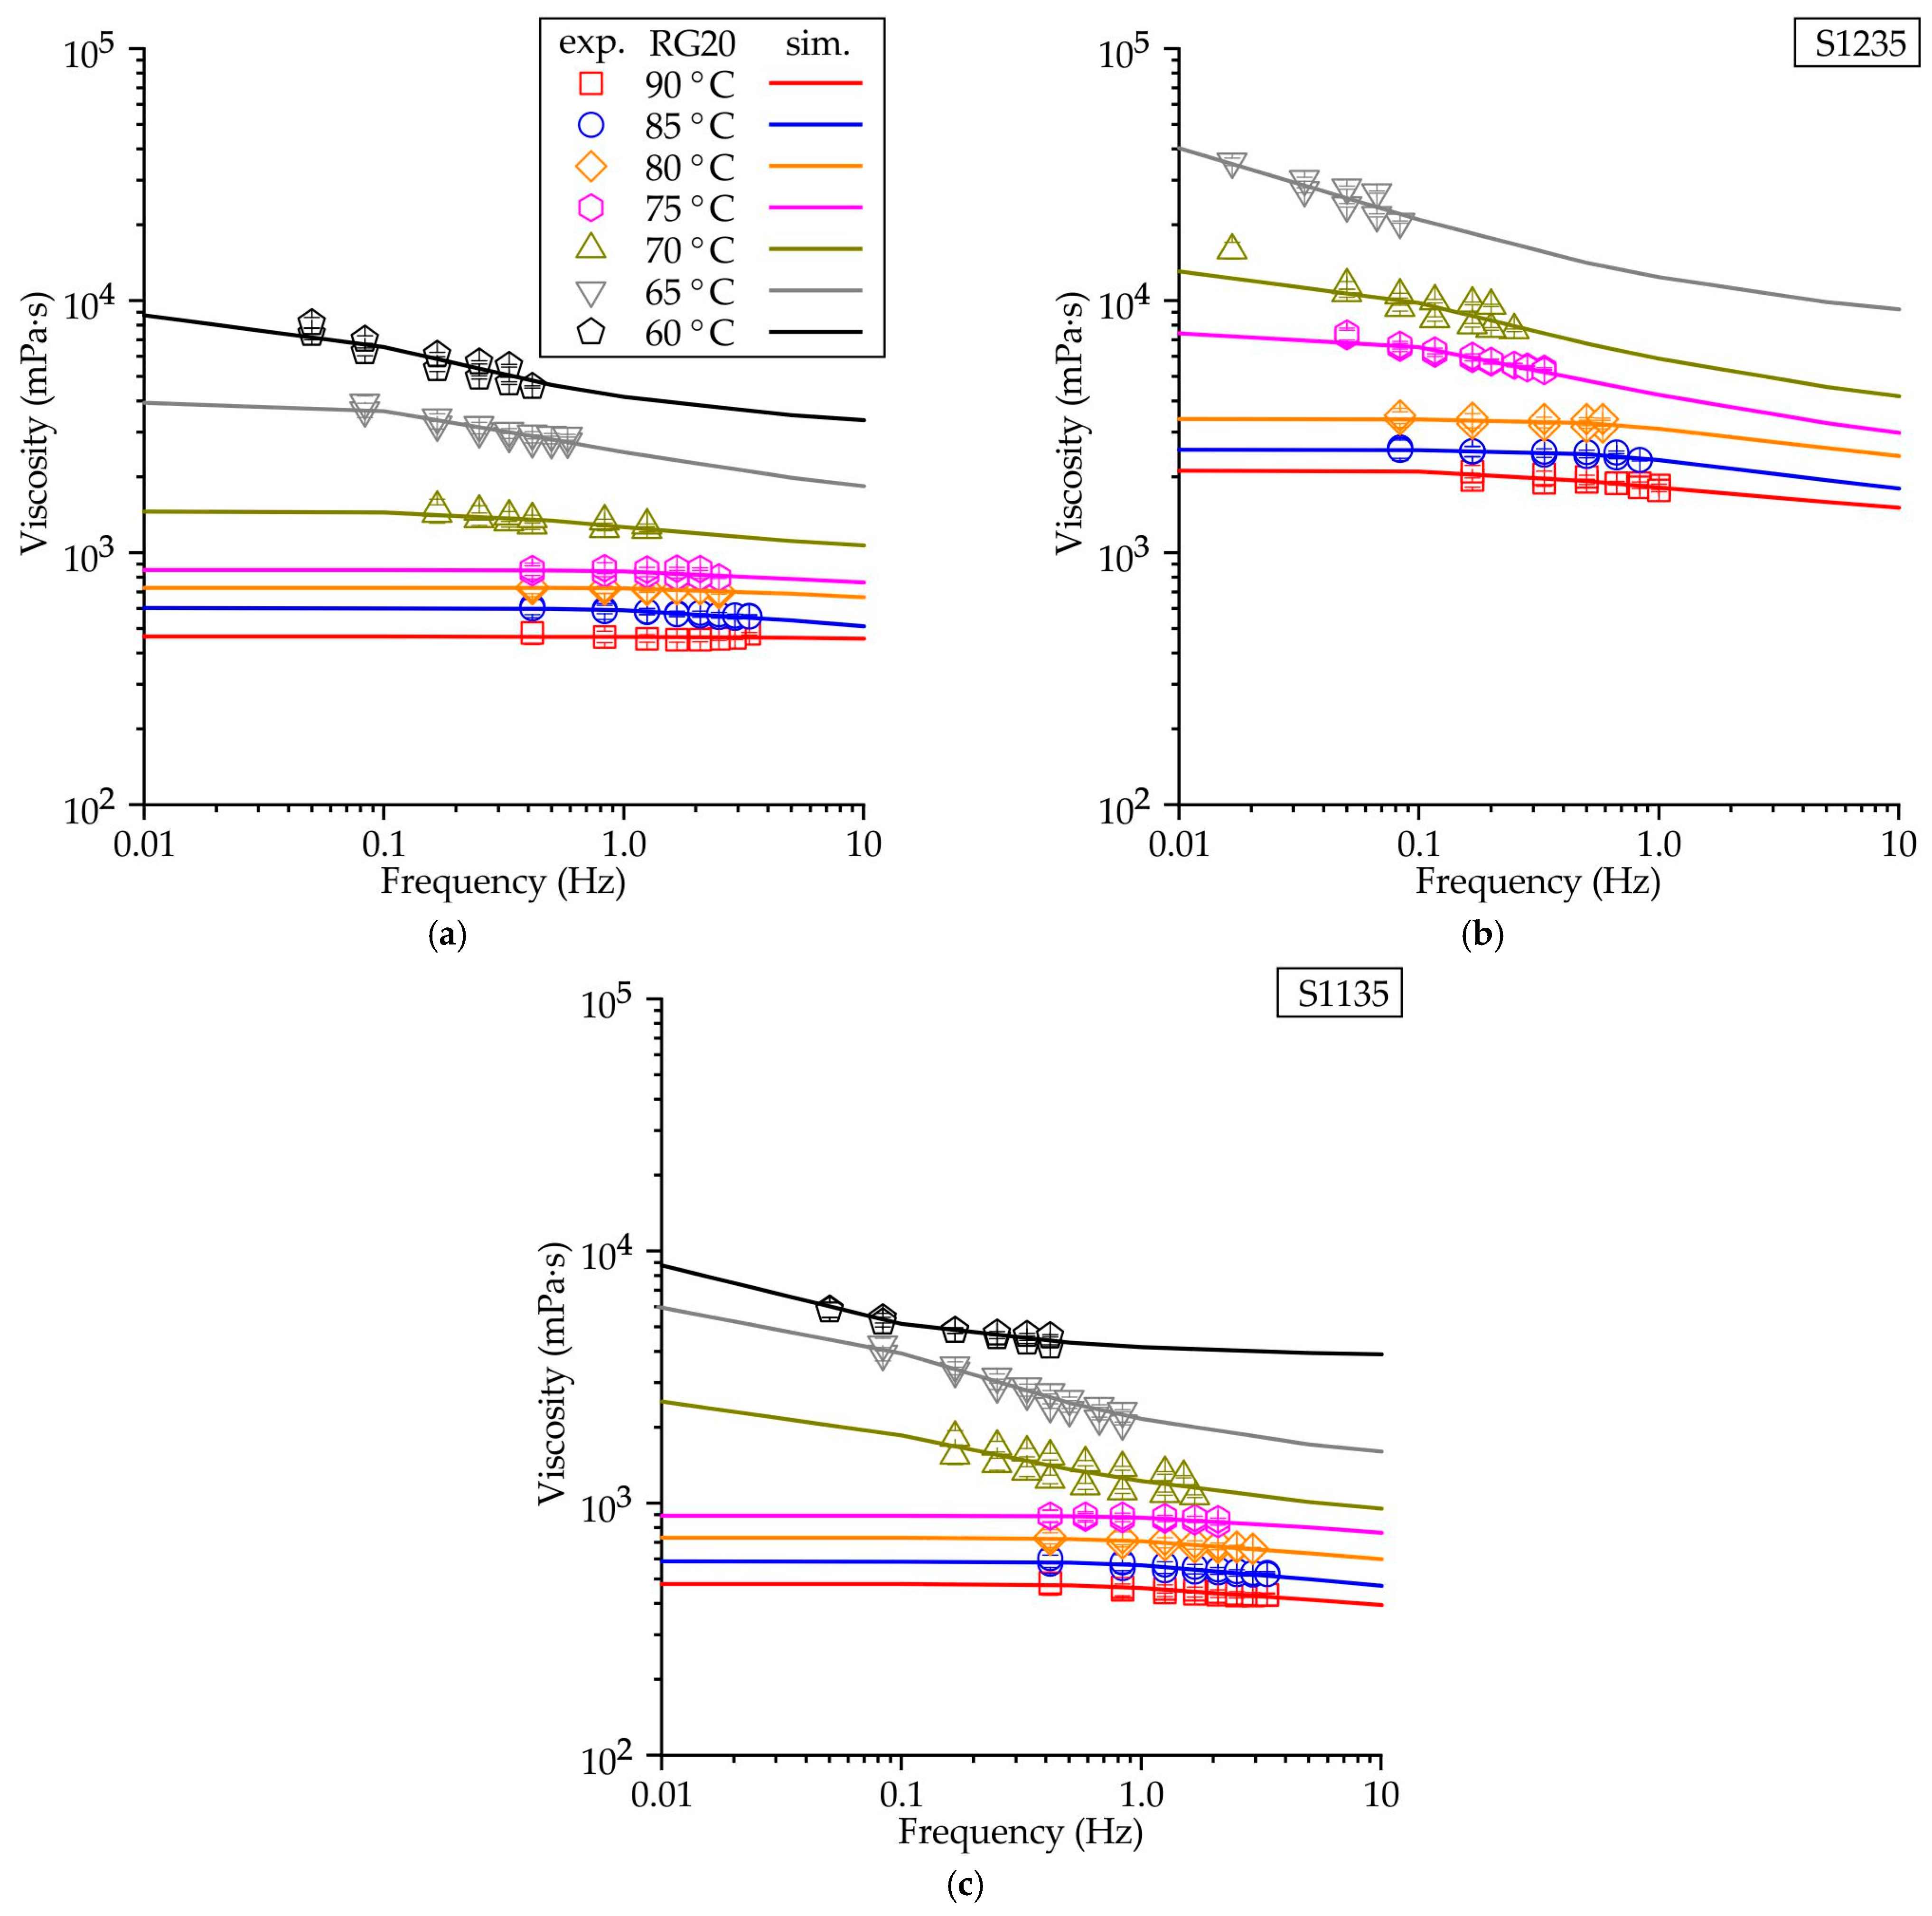
4.2. The Waxes Rheological Properties

Figure 6a–c shows the influence of temperature on the parameters η , η 0 , n, λ in the Carrea–Yasuda viscosity equation (1) fitted by experimental viscosity data from ref. [16] for RG20, S1235, and S1135 waxes. The viscosity at an infinite shear rate ( η ) and at zero shear rate ( η 0 ) are increased with decreasing temperature and higher values of η , η 0 is observed for the S1235 wax. The phase shift (λ) from which the transition between η 0 and η starts is increased with decreasing temperature. This parameter is in connection with the η and η 0 values. The sensitivity of the viscosity to the shear rate (n) is the only parameter that decreases with decreasing temperature. At temperatures between 75 and 90 °C, the dynamic viscosity of the wax remains relatively constant and is not influenced by the shear rate, and the value of n is observed to be between 0.8 and 0.9. As the temperature of the wax is decreased, the wax’s rheological behavior transitions to a non-Newtonian behavior, and the value of n shifts to a range between 0.4 and 0.6. This behavior agrees with the data from the literature [10,12,13,14,15].
In Figure 7a–c, the experimental viscosity data from ref. [16] and fitted by the Carrea equation dependence of viscosity on shear rate for RG20, S1235, and S1135 waxes were shown. As can be observed, the Carreau model equations provide an accurate description of the experimental viscosity data. The viscosity curves for RG20 and S1135 waxes are very close, and the viscosity values are lower than for S1235 wax.

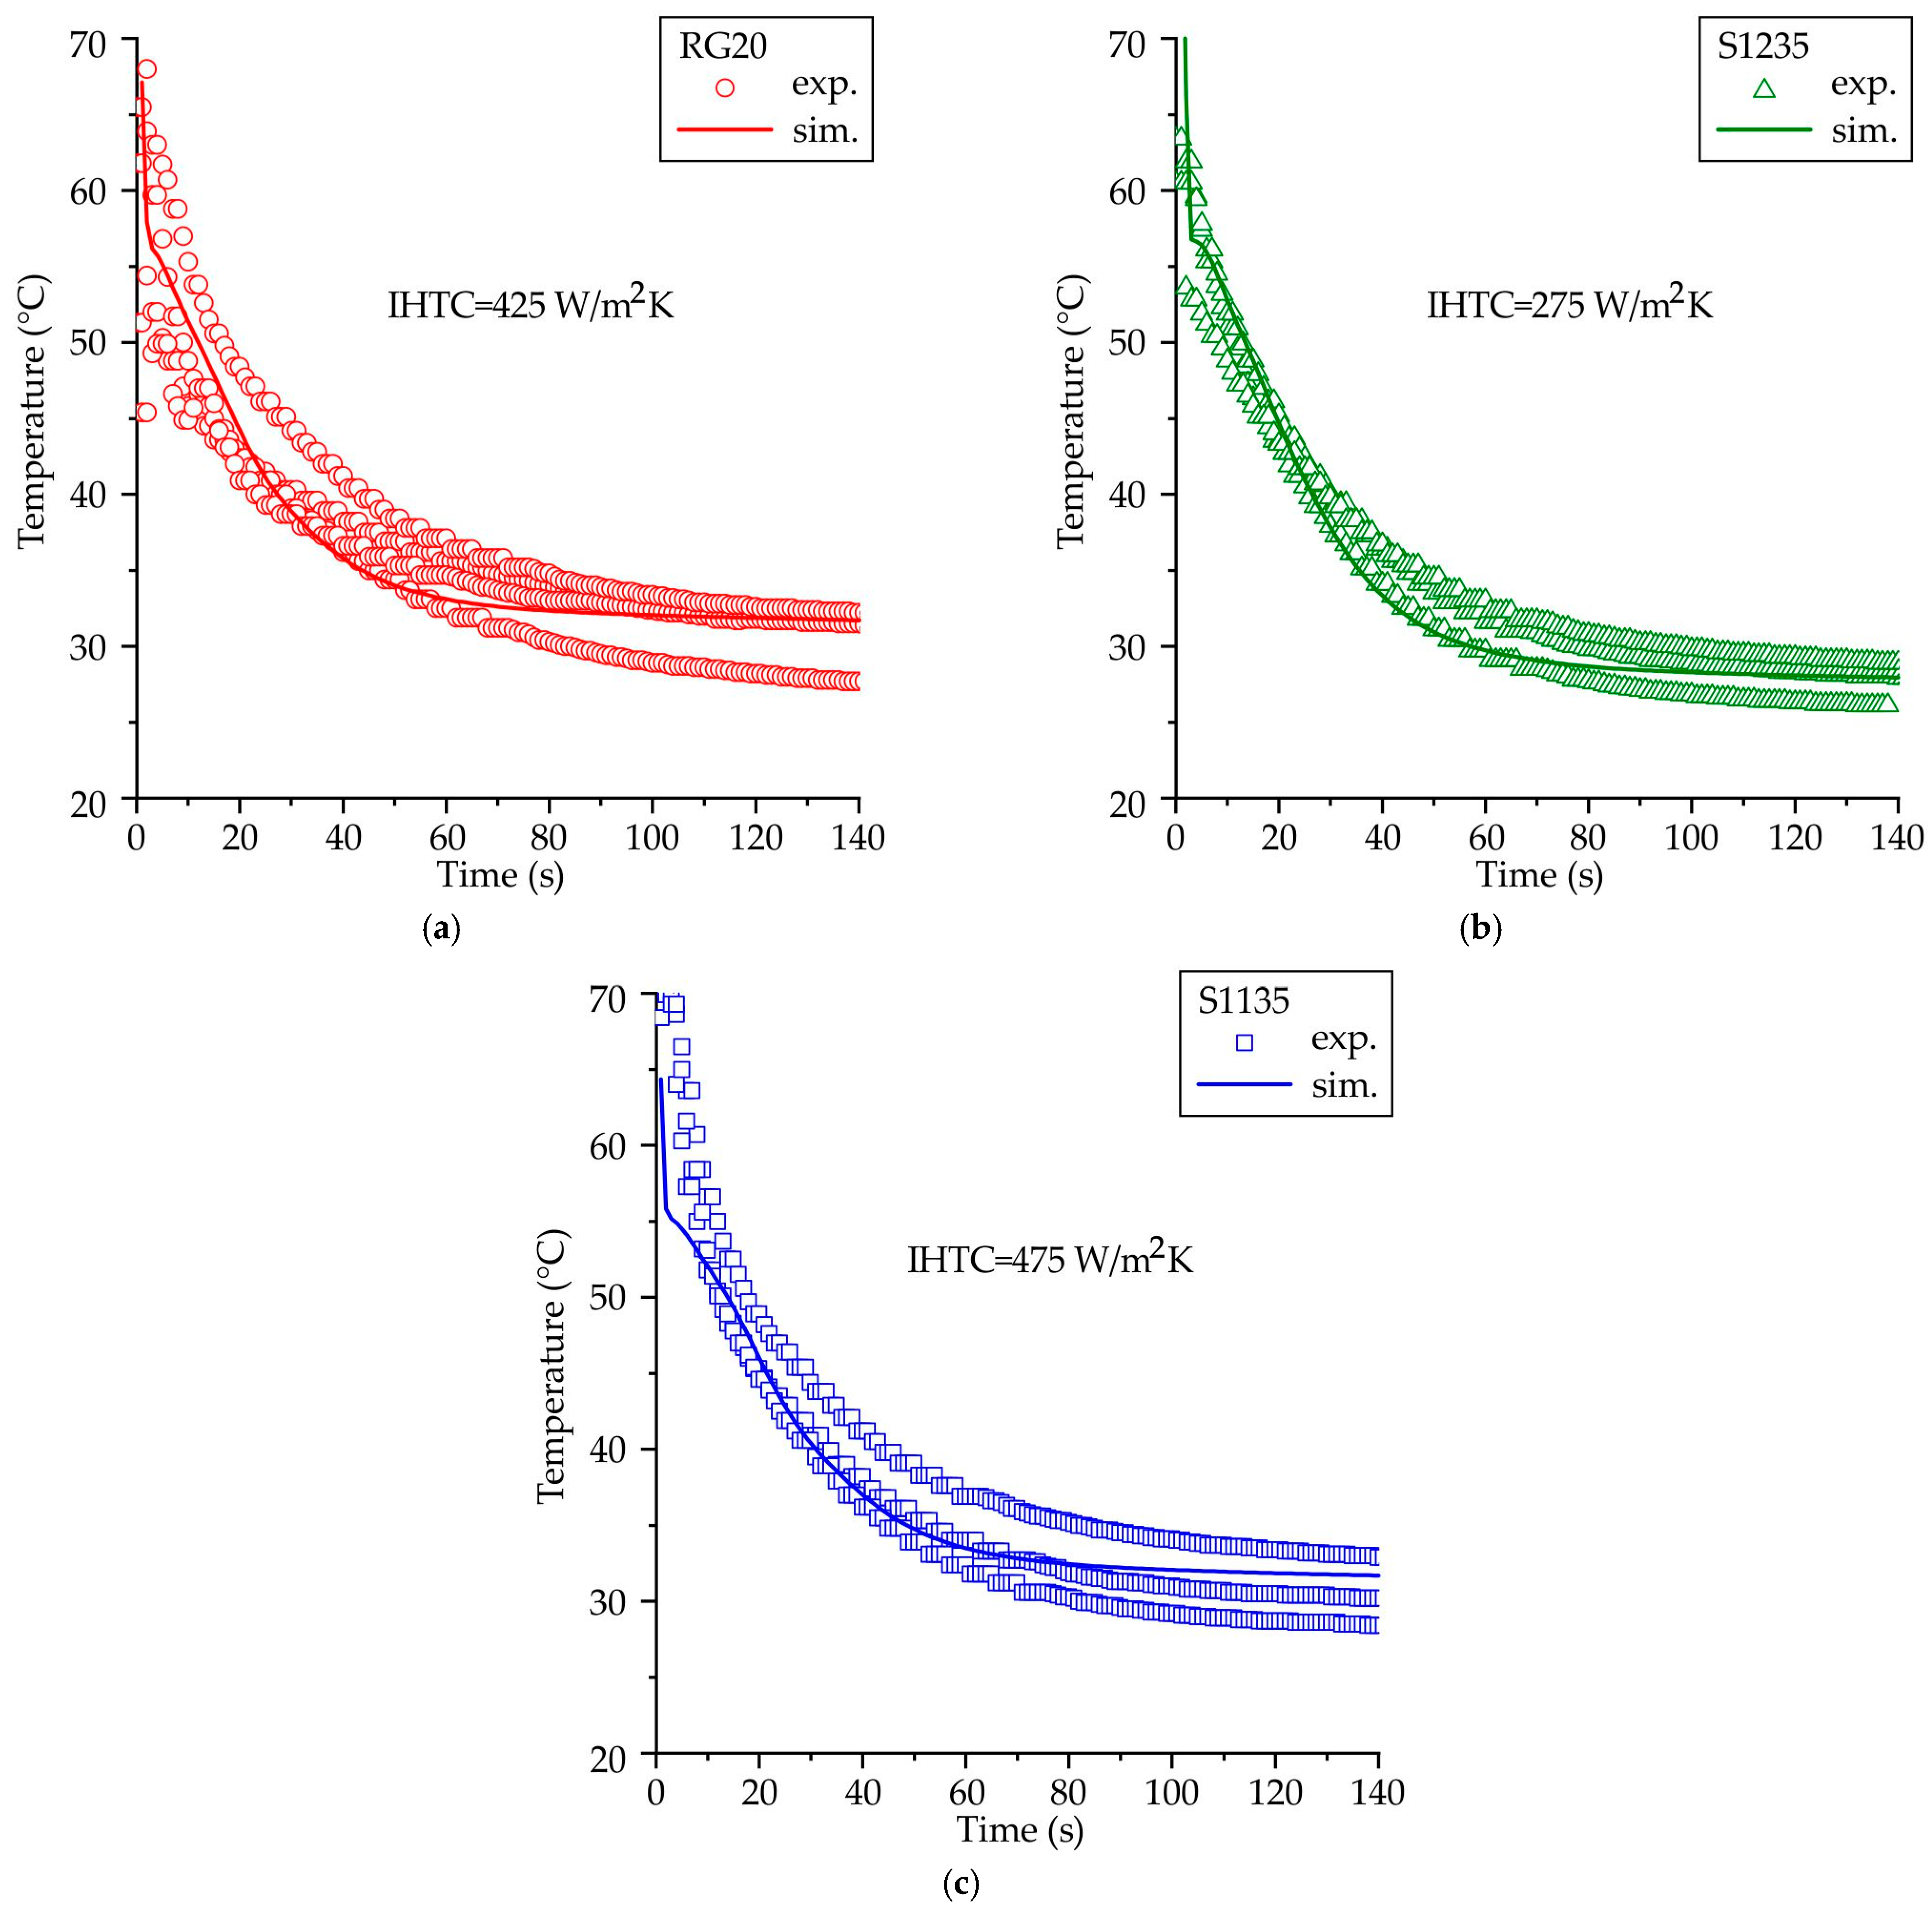
4.3. The IHTC between the Waxes and Die

The measured temperatures of the waxes from the moment when the fluidity probe started to fill up to 140 s are demonstrated in Figure 8. It can be seen that after 140 s, the probe temperature is in the range of 25–35 °C; that is, very close to room temperature. Experimental points and simulated curves obtained after IHTC fitting are very close for all investigated waxes. The fitted IHTC values for RG20, S1235, and S1135 waxes are 425, 275, and 475 W/m2K, respectively. It can be seen that IHTC between S1235 wax and die is a little lower than for RG20 and S1135 waxes. Sabau et al. [29] determine the IHTC value in the interface between wax and die was 250 W/m2K, which is close to the values obtained in this work. The low thermal diffusivity of the wax results in a nonlinear temperature profile near the interface, necessitating a more sophisticated heat transfer analysis to accurately determine the IHTC [29].

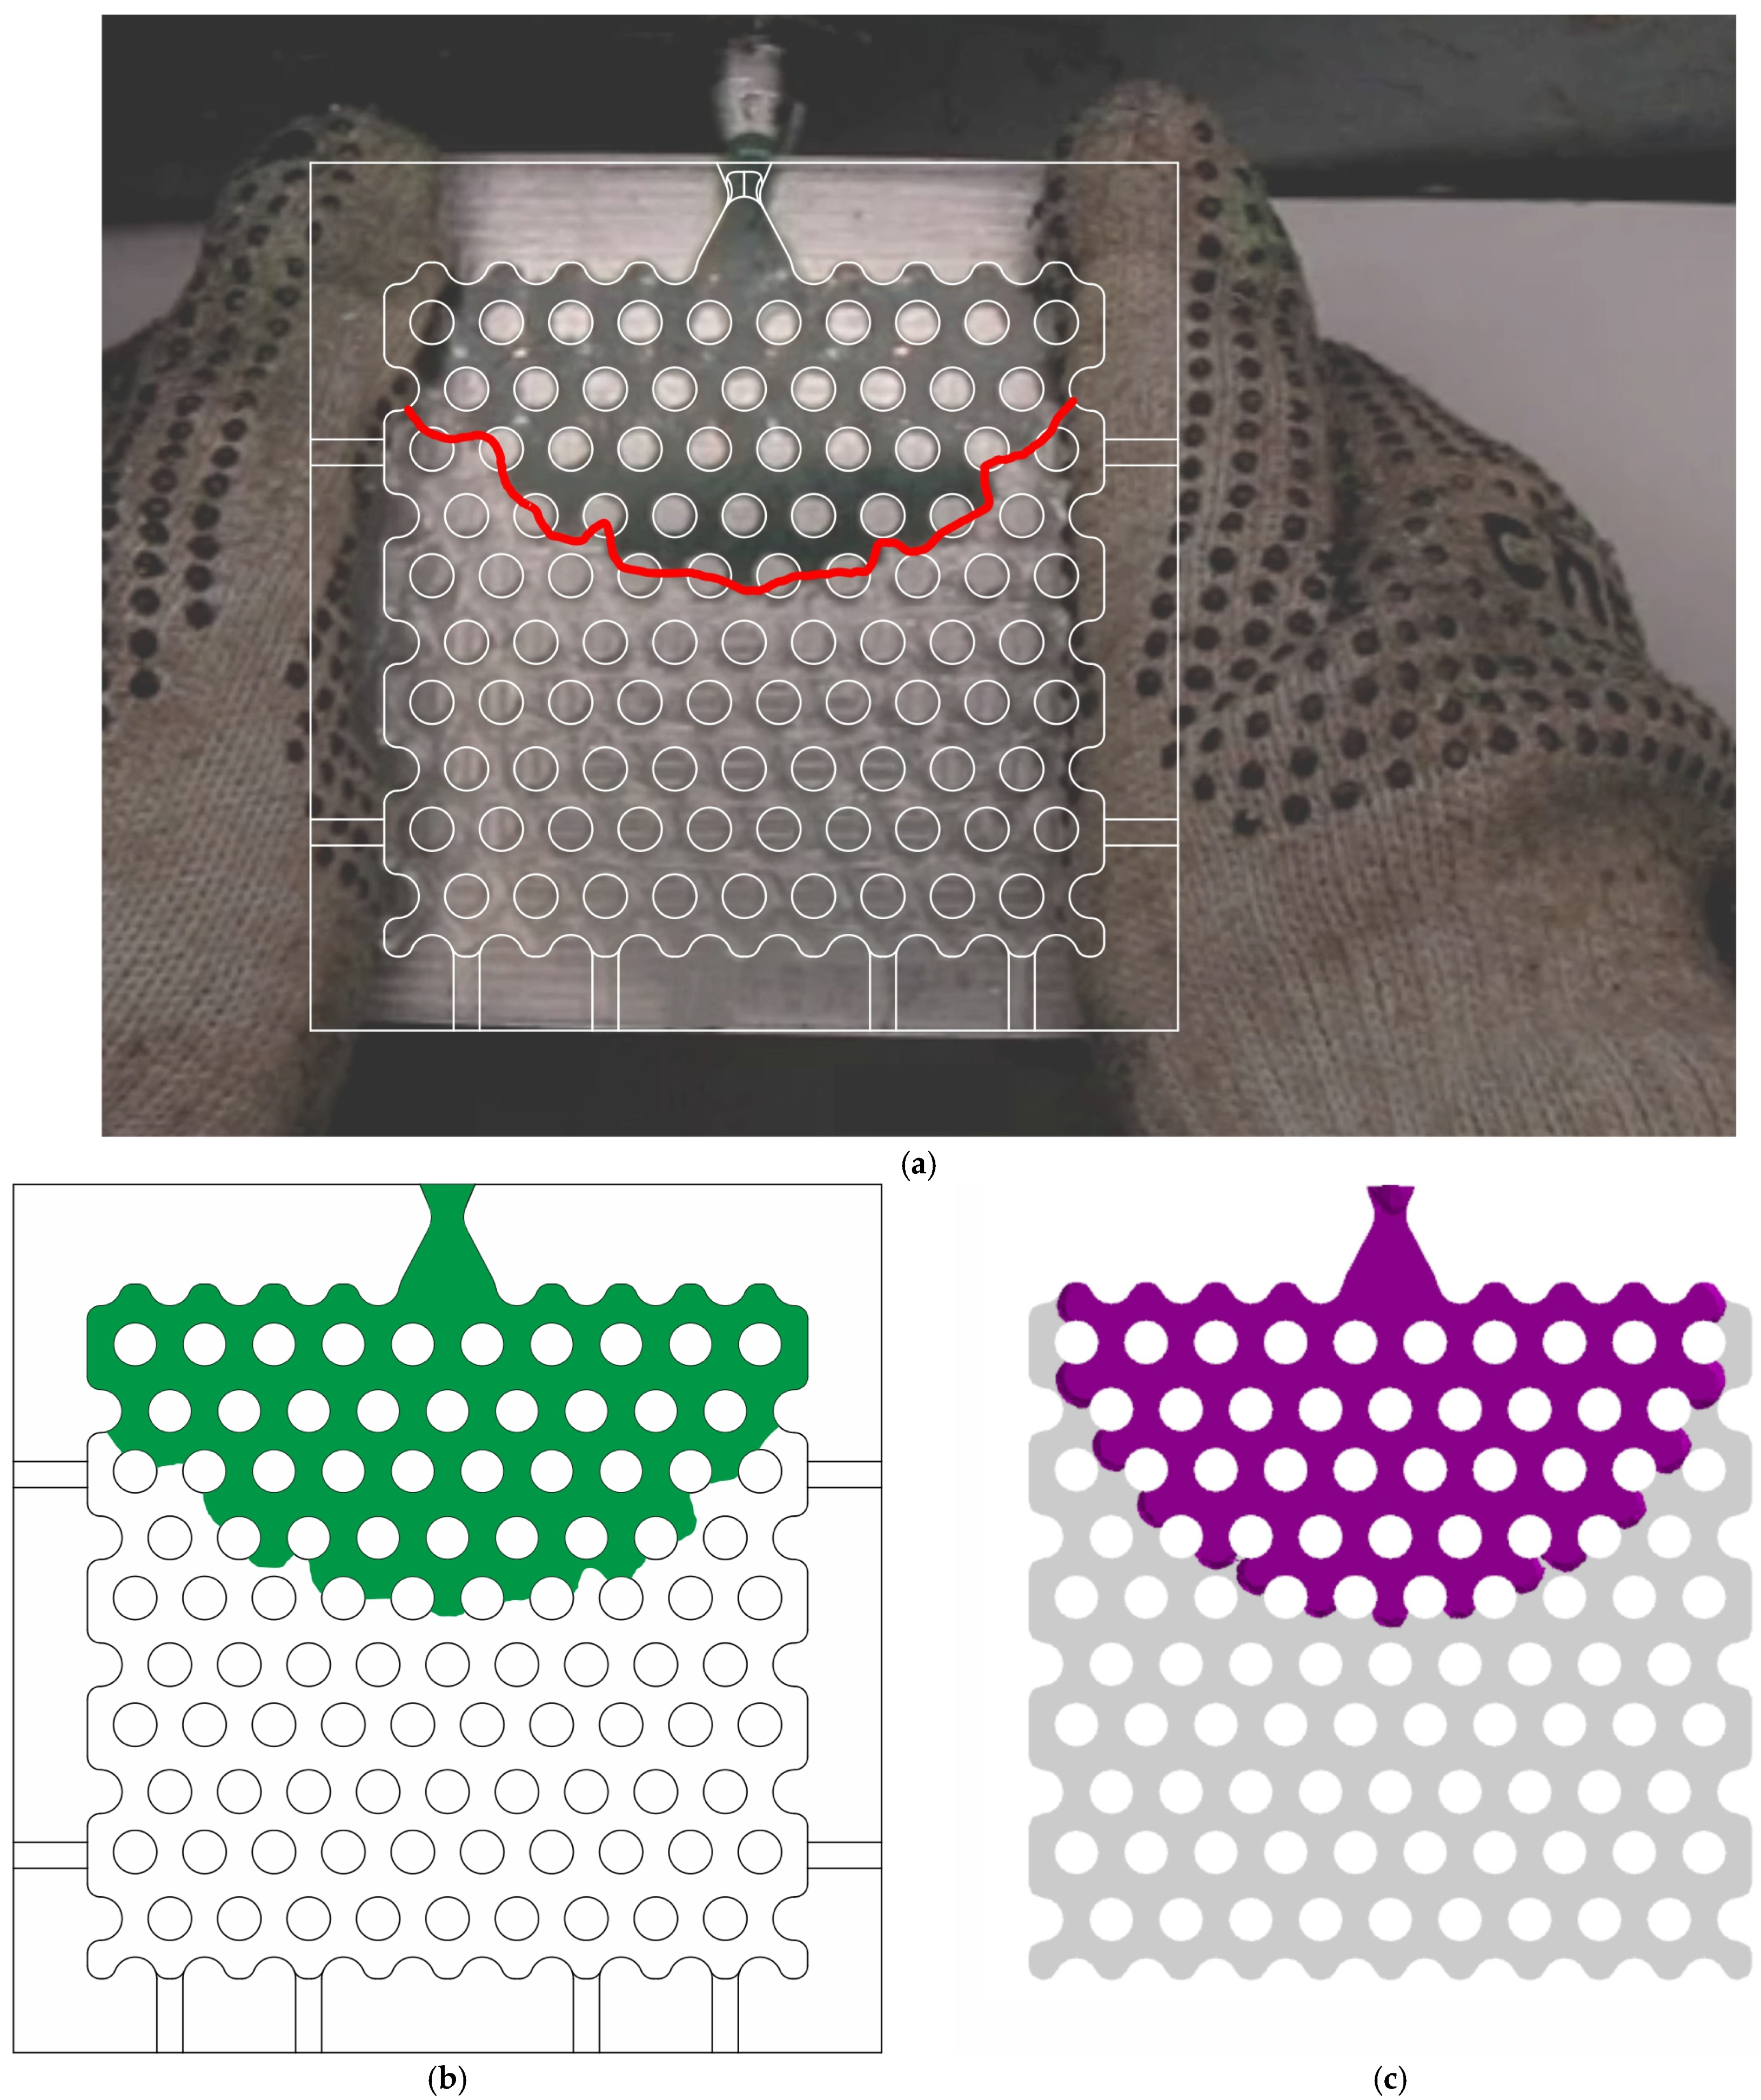
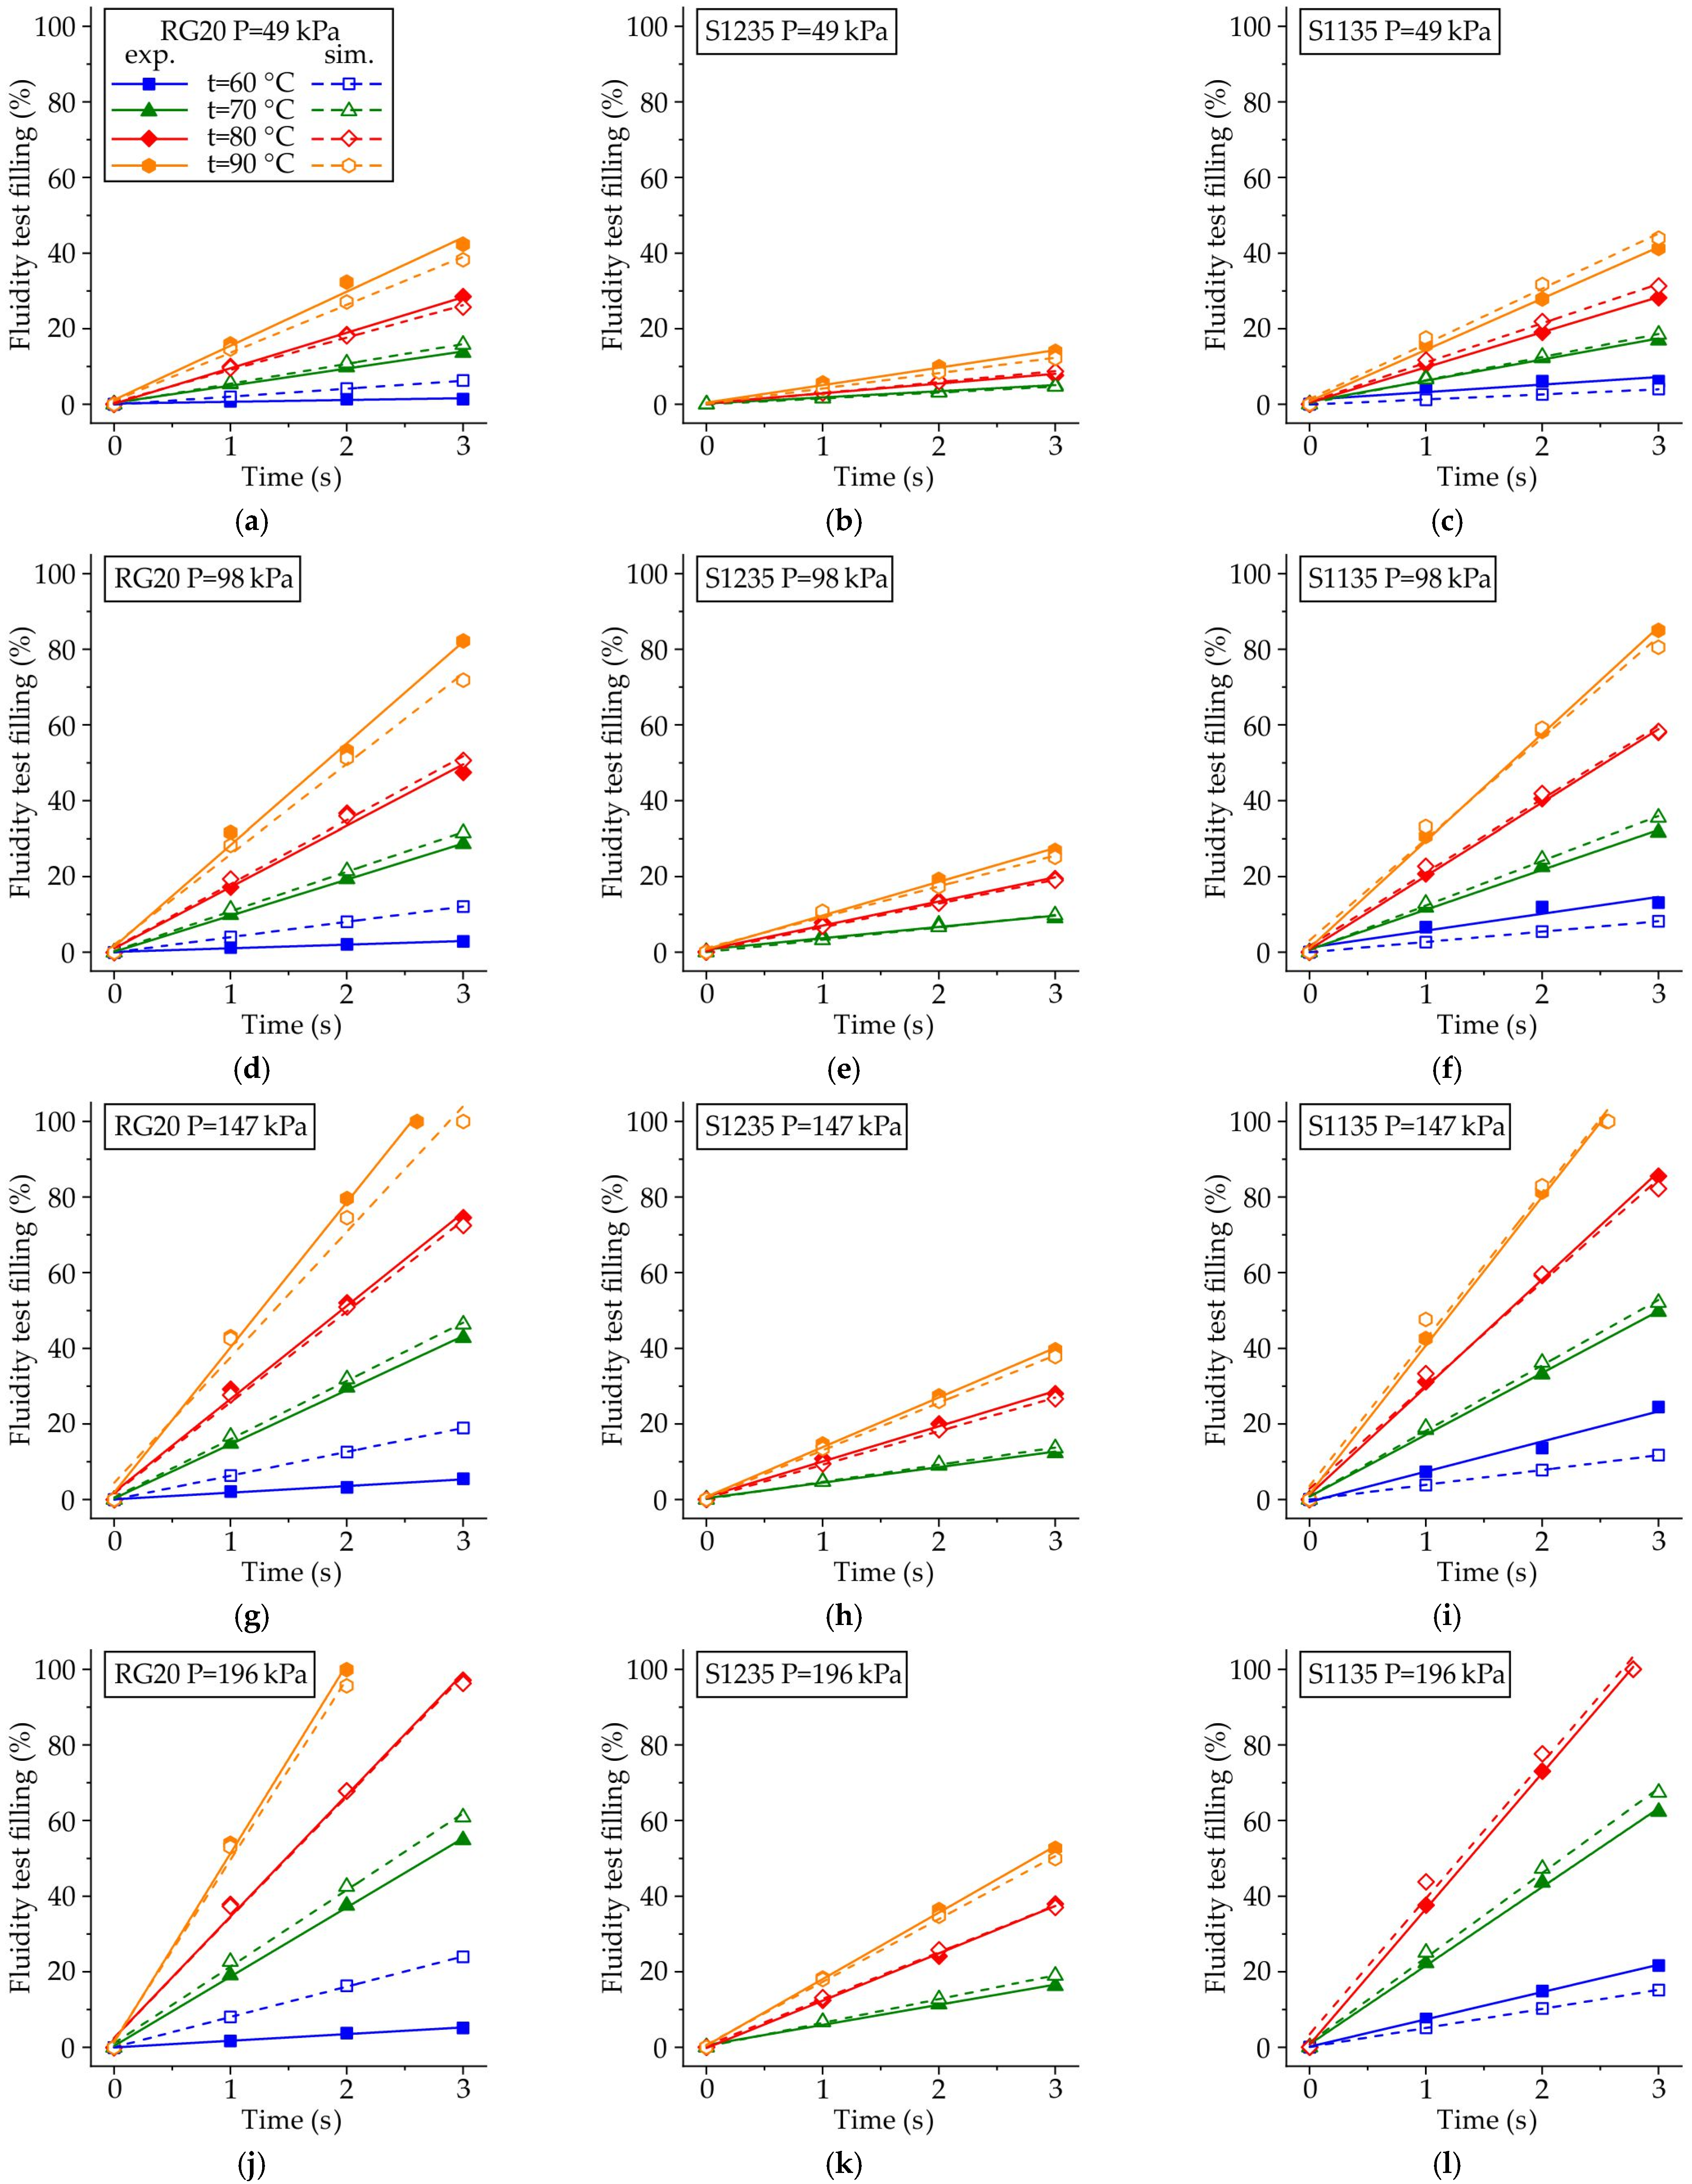
4.4. The Comparison of Experimental and Simulated Fluidity Probe Filling

Figure 9 illustrates the impact of injection temperature and pressure on the experimental and simulated fluidity probe filling fraction vs. time of injection of RG20, S1235, and S1135 waxes. For all waxes that were investigated, the linear dependence of injection time vs. filled fraction is observed both in the experiment and simulation results. Also, the experimentally observed trend of increasing the fluidity with increasing injection pressure and temperature is confirmed by simulation results. The lowest fluidity at all injection temperatures and pressures is observed for S1235 wax. It is supported by the fact that, for S1235 wax, the mold was not fully filled by 100%. However, a lot of injection conditions can be found for the full filling of the probe when the RG20 and S1135 waxes are injected. Thus, the fluidity at identical injection conditions differs for the waxes under examination due to their distinctive properties, and this phenomenon will be subjected to further rigorous examination.
A good comparison between the simulated filling percentage of the fluidity probe when the injection temperature was 70 °C and higher for all wax compositions and injection pressures was observed. A little discrepancy between experimental and simulated fluidity probe filling percentage for RG20 and S1135 waxes is observed when the injection temperature is 60 °C. This discrepancy can be associated with the lack of experimental viscosity data for the waxes at low temperatures.

5. Discussion

Analysis of waxes’ thermal properties shows that the S1235 and S1135 waxes have the same thermal properties, but RG20 has slightly different thermal properties. This difference in heat capacity, thermal conductivity, and density of the RG20 wax, as well as the S1235 and S1135 waxes, is due to the content of additives (cross-linked polystyrene and terephthalic acid). The content of additives in RG20 wax is only 18%, but in S1135 and S1235 waxes, its content is 35%.
A Carreau model was employed to elucidate the influence of temperature and shear rate on the viscosity of the waxes under investigation. The viscosity plateau for both the higher and lower shear rates, as well as the transition between them, is discernible for the waxes in examination. This phenomenon aligns with the predictions of a Carreau model. In our previous research, we identified the congealing point, at which the rheological behavior transitions from Newtonian to non-Newtonian, to be within the range of 70–80 °C [16]. The change of sensitivity of the viscosity to the shear rate (n) value is also observed at temperatures of 75–80 °C. In accordance with supplier information (Table 1), the drop melt points for RG20, S1235, and S1135 waxes are 71–77 °C. The temperature at which the sharp change in n is observed correlates with the waxes’ drop melt points. This is due to the fact that, in contrast to other chemically homogeneous compounds, wax does not melt instantaneously upon heating but rather undergoes a series of intermediate states, including solid plastic, semi-plastic, semi-liquid, and liquid [14,15].
In our previous work, we demonstrated that the parameters influencing the fluidity of the waxes are distinct from those observed in metallic alloys. The latent heat of crystallization, which typically offsets the cooling of the solidifying melt, is up to ten times lower for waxes than for metallic alloys. Additionally, the heat released during the crystallization of wax occurs at low temperatures, where the wax is in a semi-solid or solid state and does not influence on wax flow process. The primary proposed reason for the observed differences in wax flow behavior and fluidity is the difference in the viscosity of the waxes [16]. Prior to the onset of solidification, the viscosity of the wax can increase markedly, reaching values of up to 30,000 mPa·s at the liquidus temperature. This is a four-order-of-magnitude increase compared to the viscosity of metallic alloys, which ranges from 0.5 to 6.5 mPa·s [32]. The liquid wax behavior is also related to the non-Newtonian nature of the wax rheological behavior, as previously described in references [10,14,15].
The correlation between wax viscosity and fluidity has been previously established in the literature (see references [33,34]). As demonstrated in our previous research [16], the effect of wax viscosity on fluidity is also evident in the case of the waxes under examination. The higher viscosity of S1235 wax in comparison to RG20 wax can be attributed to its higher cross-linked polystyrene content. The cross-linked polystyrene content of the S1235 and RG20 waxes is 35% and 18%, respectively.
The good convergence between the simulated and experimental filling percentage of the fluidity probe in the high range of injection temperatures and pressures confirms the high accuracy of the obtained wax flow model. This, in turn, allows the model to be used for a deeper analysis of wax flow behavior in the die during the pattern wax injection process. Hereafter, the die-filling simulation was used to provide insight into the discrepancies in the RG20 and S1235 waxes’ flow behavior and fluidity.
Figure 10 illustrates the temperature, fraction solid, viscosity, and shear rate for the 1 and 2 s of RG20 and S1235 waxes injection simulation at injection temperature and pressure of 90 °C and 196 kPa, respectively. As illustrated in Figure 10a,b, it is evident that following the initial one-second interval of die filling, the temperature of the RG20 wax fluidity probe pattern undergoes a more pronounced decline than that of the S1235 wax. After two seconds (Figure 10c,d), the situation remains unchanged, with the S1235 pattern exhibiting a higher temperature. The first reason is the difference in wax/die IHTC, which for RG20 and S1235 waxes was 425 and 275 W/m2K, respectively (Figure 8). Additionally, another contributing factor is the higher filling fraction and contact area of the wax with the die for RG20 wax.
The fraction of solid for both wax patterns after one second of die filling (Figure 10e,f) is nearly zero. However, at the two-second point, a high fraction of solid, up to 0.3, is observed in RG20 wax (Figure 10g,h). In the S1235 wax pattern, the areas of solidification are also visible, albeit to a lesser extent. In accordance with the final results of die filling, the RG20 wax pattern exhibited complete filling, whereas the S1235 pattern was filled to only 60% (Figure 9). This suggests that solidification is not a determining factor for wax fluidity and that at a high fraction of the solid phase, the die was continued filling by wax.
The viscosity of the RG20 wax is observed to be lower than that of the S1235 wax after one second of filling, as illustrated in Figure 10i,j. These observations resulted in the determination of a lower shear rate for the S1235 wax in comparison with the RG20 wax (Figure 10m,n) and a lower filled die area. Following a two-second filling period, the viscosity of the RG20 wax increased (Figure 10k), yet the shear rate remained similar to that observed during the first second (Figure 10o). In contrast, the behavior of the S1235 wax was markedly different. At the two-second point in time, the highest viscosity (up to 100,000 mPa·s) and lowest shear rate are observed. It is established that the viscosity of a wax, which affects its fluidity, is dependent upon both temperature and shear rate. As evidenced in the literature, a reduction in shear rate from 100 to 0.01 s−1 has been observed to result in an increase in wax viscosity up to 104 times [35]. Therefore, the reduced fluidity of S1235 wax is linked to its elevated viscosity, which in turn results in a low shear rate and reduced flow magnitude. The high viscosity, in turn, leads to a further reduction in shear rate and an additional increase in viscosity.
The analysis of the simulation results also provides insight into the effect of injection pressure on the wax fluidity. As the injection pressure increases, the shear rate of the wax increases, while its viscosity decreases and its fluidity increases.

6. Conclusions

i.
The thermal properties of RG20, S1235, and S1135 pattern waxes were determined. At room temperature, the waxes were found to have a thermal conductivity of 0.18–0.26 W/mK, a heat capacity of 1.36–1.64 J/gK, and a density of 0.97–1.00 g/cm3.
ii.
The following parameters, namely η , η 0 , n, and λ, from the Carrea viscosity equation were determined as functions of temperature. These parameters enabled us to predict the viscosity of the RG20, S1235, and S1135 pattern waxes both at varying shear rates and temperatures. The sensitivity of the viscosity to the shear rate (n) corresponds well to the values of the drop melt point of waxes.
iii.
The IHTC for the pattern wax/die pairs was determined. The fitted IHTC values for RG20, S1235, and S1135 waxes are 425, 275, and 475 W/m2K, respectively. The simulated temperatures obtained using the determined IHTC values in this study exhibited a satisfactory correlation with the experimental temperatures.
iv.
The filling fraction of the fluidity probe was determined through experimental analysis and simulated in ProCast software for the RG20, S1235, and S1135 pattern waxes. At varying injection temperatures and pressures, a satisfactory comparison was obtained between the experimental and simulation results, confirming the high accuracy of the waxes’ thermal and rheological properties, as well as the wax/die IHTC values.
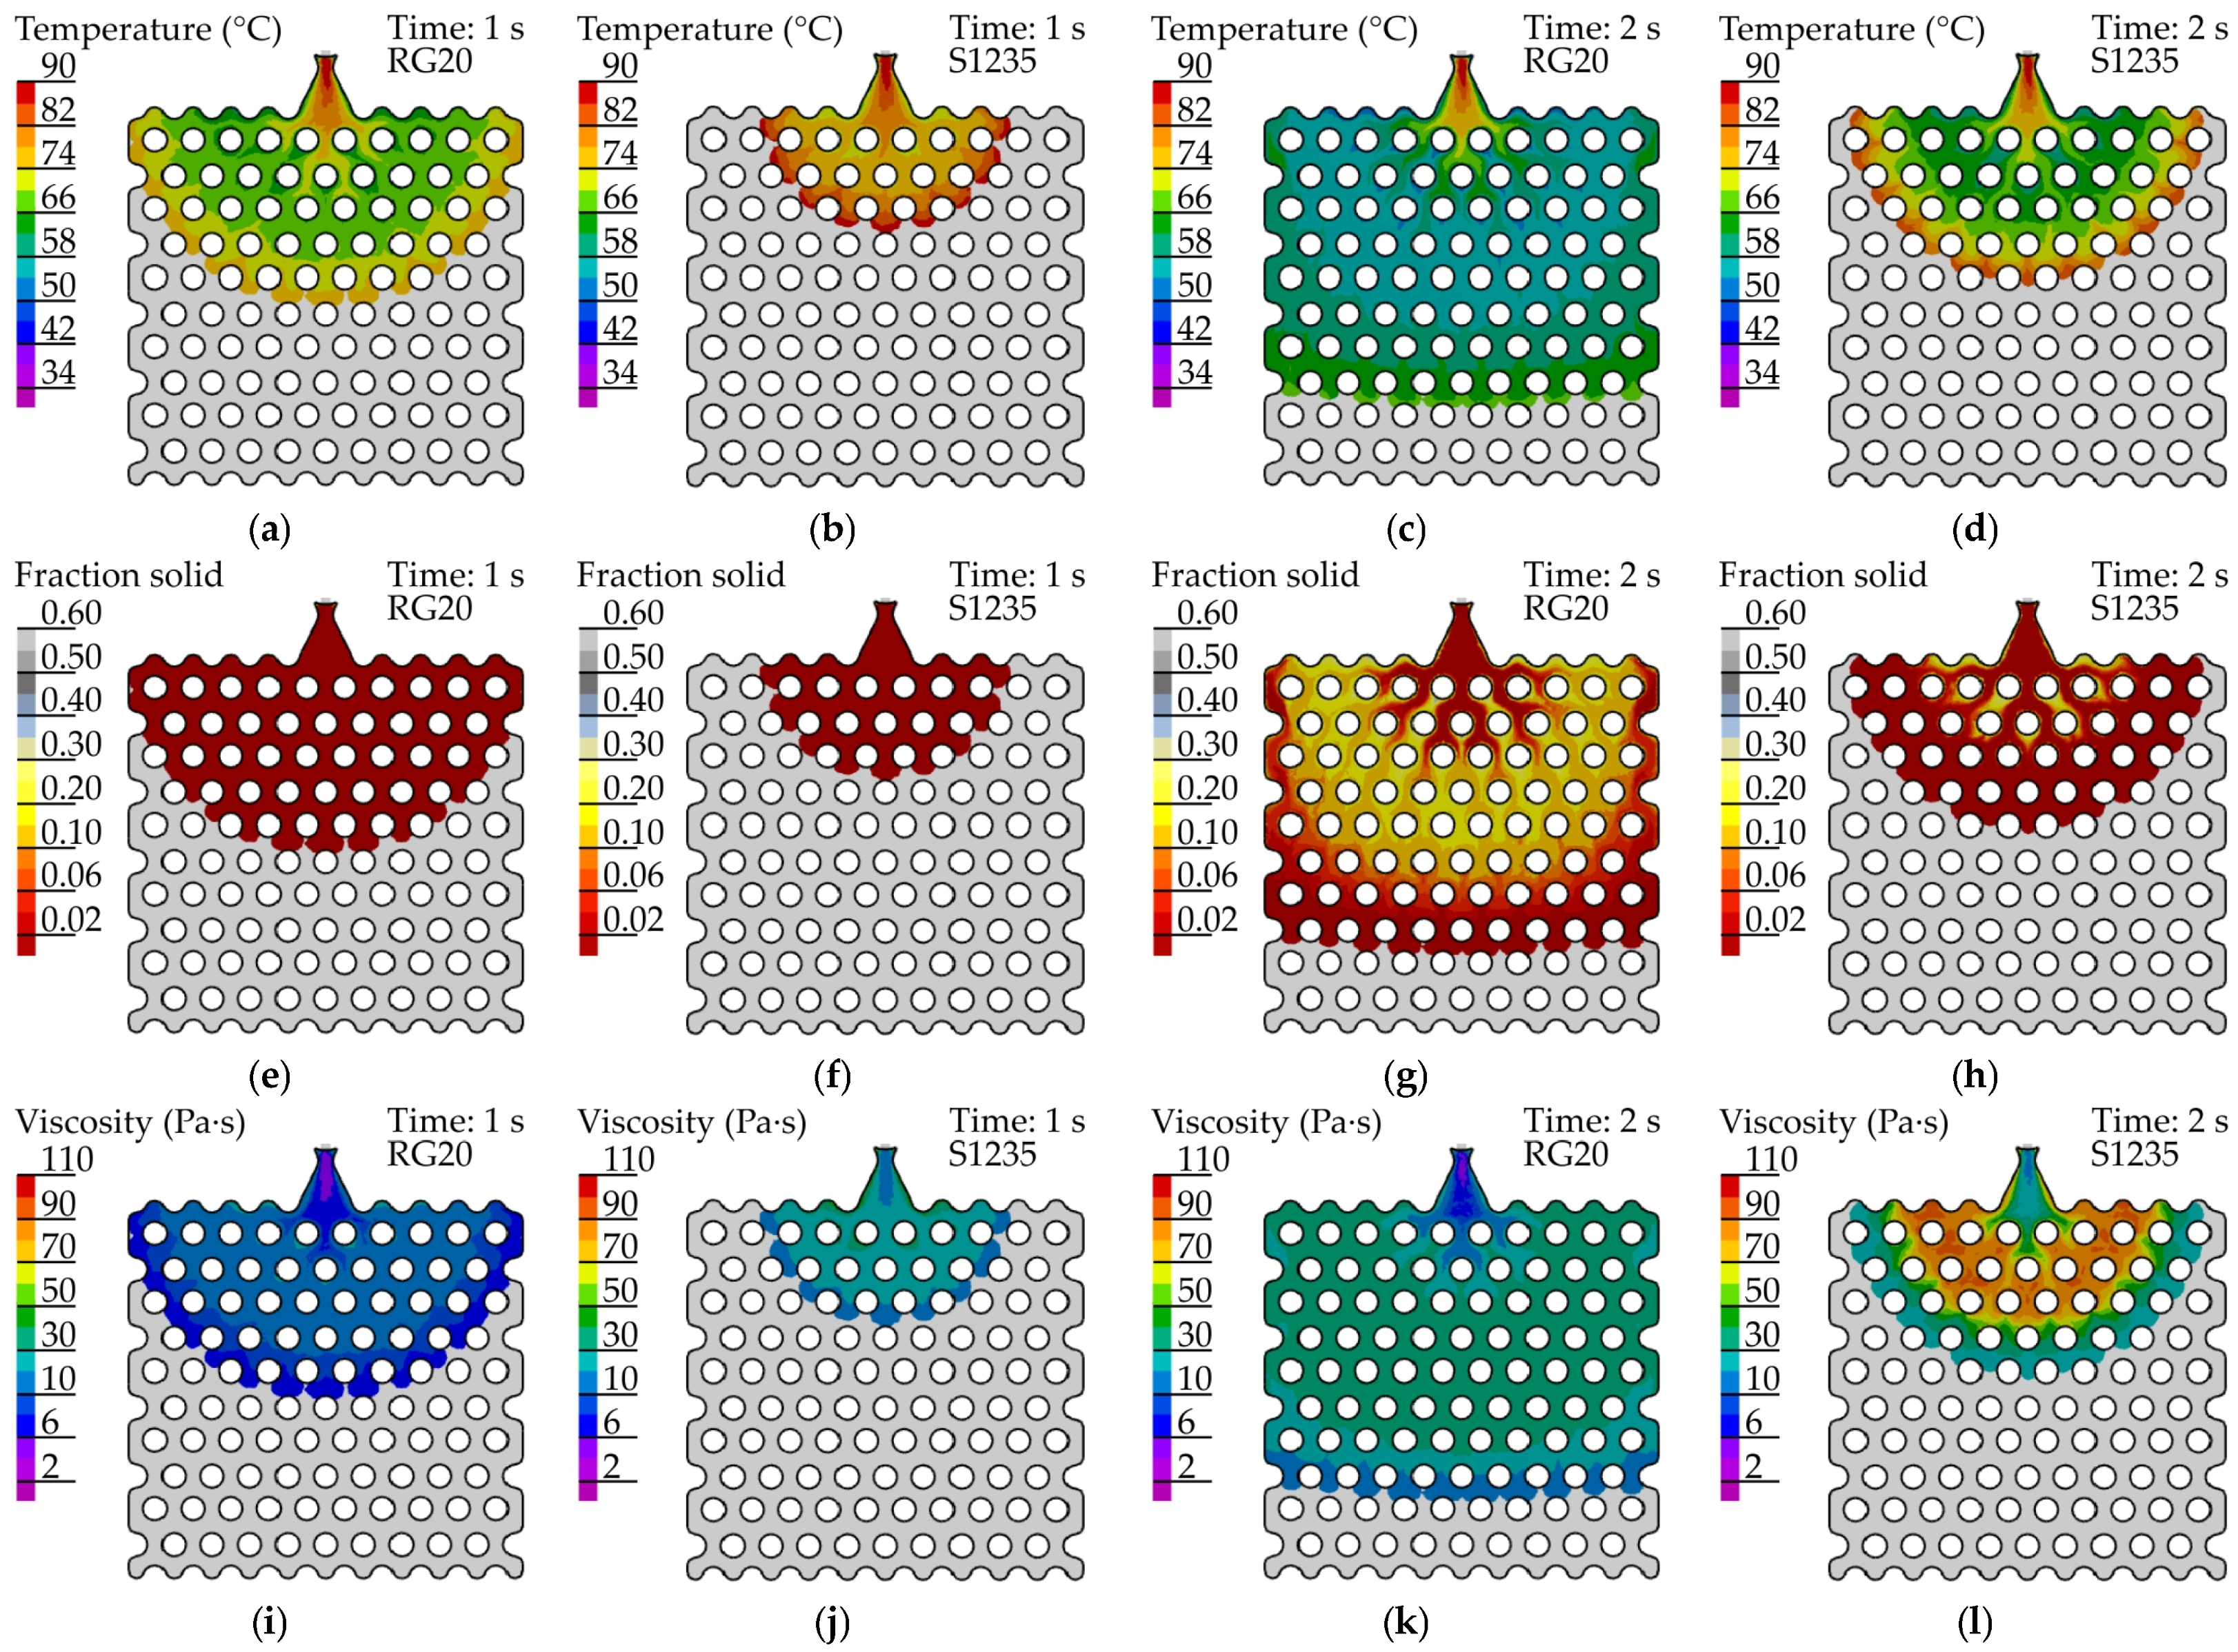
v.
It was established that the primary factor influencing the fluidity of the wax is its viscosity, which exhibits a significant increase at both decreasing temperatures and shear rates. The lowest fluidity of S1235 wax is associated with its initial high viscosity, which results in a reduced flow magnitude and thereby leads to further increases in viscosity due to low shear rate.

Author Contributions

Conceptualization, V.E.B.; methodology, A.V.K.; software, A.S.O.; validation, A.V.K., A.S.O. and E.P.K.; formal analysis, E.P.K.; investigation, A.S.O., E.P.K., A.A.S., V.E.B. and A.A.N.; resources, D.N.D.; data curation, A.V.K.; writing—original draft preparation, V.E.B.; writing—review and editing, A.S.O. and A.V.K.; visualization, A.S.O.; supervision, A.V.K. and V.D.B.; project administration, A.V.K., V.D.B. and D.N.D.; funding acquisition, V.D.B. and D.N.D. All authors have read and agreed to the published version of the manuscript.

Funding

This research received financial support from the Ministry of Science and Higher Education in the Russian Federation (Agreement No. 075-11-2022-023 from 6 April 2022) under the program “Scientific and Technological Development of the Russian Federation” according to governmental decree N 218 dated 9 April 2010.

Institutional Review Board Statement

This study did not involve humans or animals.

Informed Consent Statement

This study did not involve humans.

Data Availability Statement

The data presented in this study are available on request from the corresponding author.

Conflicts of Interest

Author Dmitry N. Dmitriev was employed by the company Public Joint Stock Company UEC "Kuznetsov". The remaining authors declare that the research was conducted in the absence of any commercial or financial relationships that could be construed as a potential conflict of interest.

References

  1. Pradyumna, R.; Sridhar, S.; Satyanarayana, A.; Chauhan, A.S.; Baig, M.A.H. Wax Patterns for Integrally Cast Rotors/Stators of Aeroengine Gas Turbines. Mater. Today Proc. 2015, 2, 1714–1722. [Google Scholar] [CrossRef]
  2. Bemblage, O.; Karunakar, D.B. A Study on the Blended Wax Patterns in Investment Casting Process. In Proceedings of the World Congress on Engineering (WCE 2011), London, UK, 6–8 July 2011; Volume 1, pp. 1–7. [Google Scholar]
  3. Singh, S.; Singh, R. Precision investment casting: A state of art review and future trends. Proc. Inst. Mech. Eng. Part B J. Eng. Manuf. 2015, 230, 2143–2164. [Google Scholar] [CrossRef]
  4. Singh, B.; Kumar, P.; Mishra, B.K. Investigations of the effect of injection parameters on the dimensional accuracy of wax patterns used in ceramic shell investment casting. Int. J. Manuf. Technol. Manag. 2010, 21, 148–159. [Google Scholar] [CrossRef]
  5. Pattnaik, S.; Karunakar, D.B.; Jha, P.K. Developments in investment casting process—A review. J. Mater. Process. Technol. 2012, 212, 2332–2348. [Google Scholar] [CrossRef]
  6. Pattnaik, S.; Karunakar, D.B.; Jha, P.K. Multi-characteristic optimization of wax patterns in the investment casting process using grey–fuzzy logic. Int. J. Adv. Manuf. Technol. 2013, 67, 1577–1587. [Google Scholar] [CrossRef]
  7. Pattnaik, S.; Karunakar, D.B.; Jha, P.K. A prediction model for the lost wax process through fuzzy-based artificial neural network. J. Mech. Eng. Sci. 2013, 228, 1259–1271. [Google Scholar] [CrossRef]
  8. Singh, B.; Kumar, P.; Mishra, B.K. Experimental investigation of wax blends in investment casting process. Indian Foundry J. 2006, 52, 29–36. [Google Scholar]
  9. Gebelin, J.-C.; Jolly, M.R.; Cendrowicz, A.M.; Blackburn, S.; Cirre, J. Simulation of die filling for the wax injection process: Part II. Numerical simulation. Metall. Mater. Trans. B 2004, 35, 761–768. [Google Scholar] [CrossRef]
  10. Piwonka, T.S.; Woodbury, K.A.; Wiest, J.M. Modeling casting dimensions: Effect of wax rheology and interfacial heat transfer. Mater. Des. 2000, 21, 365–372. [Google Scholar] [CrossRef]
  11. Gebelin, J.-C.; Cendrowicz, A.M.; Jolly, M.R. Modelling of the wax injection process for the investment casting process: Prediction of defects. In Proceedings of the Third International Conference on CFD in the Minerals and Process Industries CSIRO, Melbourne, Australia, 10–12 December 2003; pp. 415–420. [Google Scholar]
  12. Gebelin, J.-C.; Jolly, M.R.; Cendrowicz, A.M.; Blackburn, S.; Cirre, J. Simulation of die filling for the wax injection process: Part I. Models for material behavior. Metall. Mater. Trans. B 2004, 35, 755–759. [Google Scholar] [CrossRef]
  13. Gebelin, J.-C.; Jolly, M.R. Modelling of the investment casting process. J. Mater. Process. Technol. 2003, 135, 291–300. [Google Scholar] [CrossRef]
  14. Wang, D.; He, B.; Li, F.; Sun, B. Numerical Simulation of the Wax Injection Process for Investment Casting. Mater. Manuf. Process. 2013, 28, 220–224. [Google Scholar] [CrossRef]
  15. Zhang, J.; Ye, H.W.; Li, K.W.; Wang, G.; Li, F. Numerical Simulation of Mold Filling Process for Wax Pattern of the Impeller in Investment Casting. Appl. Mech. Mater. 2011, 80–81, 965–968. [Google Scholar] [CrossRef]
  16. Bazhenov, V.E.; Sannikov, A.V.; Kovyshkina, E.P.; Koltygin, A.V.; Bazlov, A.I.; Belov, V.D.; Dmitriev, D.N. The Influence of Injection Temperature and Pressure on Pattern Wax Fluidity. J. Manuf. Mater. Process. 2023, 7, 141. [Google Scholar] [CrossRef]
  17. Grzeskowiak, K.; Czarnecka-Komorowska, D.; Sytek, K.; Wojciechowski, M. Influence of waxes remelting used in investment casting on their thermal properties and linear shrinkage. Metalurgija 2015, 54, 350–352. [Google Scholar]
  18. ESI Group. ProCAST 2010.0 User’s Manual (ESI Group, 2010). Available online: https://myesi.esi-group.com/downloads/software-documentation/procast-2021.0-user-guide-visual-cast-procast-rev-b-online-online-online-online (accessed on 1 June 2024).
  19. Yang, L.; Chai, L.H.; Liang, Y.F.; Zhang, Y.W.; Bao, C.L.; Liu, S.B.; Lin, J.P. Numerical simulation and experimental verification of gravity and centrifugal investment casting low pressure turbine blades for high Nb–TiAl alloy. Intermetallics 2015, 66, 149–155. [Google Scholar] [CrossRef]
  20. Lu, S.-L.; Xiao, F.-R.; Guo, Z.-H.; Wang, L.-J.; Li, H.-Y.; Liao, B. Numerical simulation of multilayered multiple metal cast rolls in compound casting process. Appl. Therm. Eng. 2016, 93, 518–528. [Google Scholar] [CrossRef]
  21. Dantzig, J.A.; Rappaz, M. Solidification; EPFL Press: Lausanne, Switzerland, 2009; pp. 105–151. [Google Scholar]
  22. Carreau, P.J. Rheological Equations from Molecular Network Theories. Trans. Soc. Rheol. 1972, 16, 99–127. [Google Scholar] [CrossRef]
  23. Ameri, M.; Farzan, H.; Nobari, M. Evaluation of Different Glazing Materials, Strategies, and Configurations in Flat Plate Collectors Using Glass and Acrylic Covers: An Experimental Assessment. Iran. J. Energy Environ. 2021, 12, 297–306. [Google Scholar] [CrossRef]
  24. McCabe, J.F.; Walls, A.W.G. Applied Dental Materials, 9th ed.; Blackwell Publishing Ltd.: Oxford, UK, 2008; pp. 21–209. [Google Scholar]
  25. Al Sarheed, M.; Sedaghat, A.; Malayer, M.A.; Salem, H.; Oloomi, S.A.A.; Hussam, W.K.; Al Anazi, A.A.; Sharifpur, M. Manufacturing Wood-Plastic Composites and Their Thermal Performance in Building Envelope (Version 1). Preprint 2022. [Google Scholar] [CrossRef]
  26. Bazhenov, V.E.; Tselovalnik, Y.V.; Koltygin, A.V.; Belov, V.D. Investigation of the interfacial heat transfer coefficient at the metal–mold interface during casting of an A356 aluminum alloy and AZ81 magnesium alloy into steel and graphite molds. Int. J. Met. 2021, 15, 625–637. [Google Scholar] [CrossRef]
  27. Bonilla, W.; Masood, S.H.; Iovenitti, P. An Investigation of Wax Patterns for Accuracy Improvement in Investment Cast Parts. Int. J. Adv. Manuf. Technol. 2001, 18, 348–356. [Google Scholar] [CrossRef]
  28. Sabau, A.S.; Viswanathan, S. Material properties for predicting wax pattern dimensions in investment casting. Mater. Sci. Eng. A 2003, 362, 125–134. [Google Scholar] [CrossRef]
  29. Sabau, A.S.; Viswanathan, S. Prediction of Wax Pattern Dimensions in Investment Casting. AFS Trans. 2002, 110, 733–746. [Google Scholar]
  30. Burlaga, B.; Kroma, A.; Poszwa, P.; Kłosowiak, R.; Popielarski, P.; Stręk, T. Heat Transfer Analysis of 3D Printed Wax Injection Mold Used in Investment Casting. Materials 2022, 15, 6545. [Google Scholar] [CrossRef] [PubMed]
  31. Ukrainczyk, N.; Kurajica, S.; Šipušić, J. Thermophysical Comparison of Five Commercial Paraffin Waxes as Latent Heat Storage Materials. Iranian (Iranica) Chemical and Biochemical Engineering Quarterly. Chem. Biochem. Eng. Q. 2010, 24, 129–137. [Google Scholar]
  32. Battezzati, L.; Greer, A.L. The viscosity of liquid metals and alloys. Acta Metall. 1989, 37, 1791–1802. [Google Scholar] [CrossRef]
  33. Taşcıoğlu, S.; İnem, B.; Akar, N. Conversion of an investment casting sprue wax to a pattern wax by the modification of its properties. Mater. Des. 2004, 25, 499–505. [Google Scholar] [CrossRef]
  34. Taşcıoğlu, S.; Akar, N. A novel alternative to the additives in investment casting pattern wax compositions. Mater. Des. 2003, 24, 693–698. [Google Scholar] [CrossRef]
  35. Chakravorty, S. The Properties of Waxes Used in the Investment Casting Industry: Final Report; NPL Report No. CMMT(A)245; National Physical Laboratory: Middlesex, UK, 1999; pp. 2–8. [Google Scholar]
Figure 1. The scheme of die utilized for the fluidity test: (a) the top and cross-sectional views, and (b) a three-dimensional representation of the probe and die.
Jmmp 08 00213 g001
Figure 2. Digital vacuum wax injector (a) front view, (b) view without top showing wax pot configuration, and (c) mesh used for wax-filling simulation with set boundary conditions.
Jmmp 08 00213 g002
Figure 3. (a) The exported frame with a vector image of the mold cavity after scaling; (b) experimental probe profile after tracing and Boolean intersection operation used for filled fraction calculation, and (c) the simulated wax fluidity probe filling results. All data (experimental and simulated) correspond to 1 s of filling the probe of RG20 wax at injection pressure and temperature of 196 kPa and 80 °C, respectively.
Jmmp 08 00213 g003
Figure 4. Thermal properties of the die: (ac) 5251 aluminum alloy calculated via ProCast thermodynamic database and (df) acrylic glass properties from references: Ameri (2021) [23], McCabe (2008) [24], and Al Sarheed (2022) [25]. (a,d) density; (b) enthalpy; (c,f) thermal conductivity; (e) heat capacity.
Jmmp 08 00213 g004
Figure 5. Thermal properties of the waxes obtained in this work (strength lines) and provided in the from references: Gebelin (2004) [12], Gebelin (2003) [13], Wang (2012) [14], Bonilla (2001) [27], Sabau (2003) [28], Sabau (2002) [29], Burlaga (2022) [30], Ukrainczyk (2010) [31] (dashed lines). (a) thermal conductivity; (b) heat capacity; (c)density.
Jmmp 08 00213 g005
Figure 6. Influence of temperature on the parameters η , η 0 , n, λ in Carrea viscosity equation fitted by experimental viscosity data form [16] for (a) RG20, (b) S1235, and (c) S1135 waxes.
Jmmp 08 00213 g006
Figure 7. The fitted Carrea viscosity curves and experimental viscosity data form [16] for (a) RG20, (b) S1235, and (c) S1135 waxes at various temperatures.
Jmmp 08 00213 g007
Figure 8. The experimental and simulated cooling curves obtained for (a) RG20, (b) S1235, and (c) S1135 waxes. The simulated cooling curves were obtained at IHTC, determined by comparison of experimental and simulated temperatures.
Jmmp 08 00213 g008
Figure 9. Experimental and simulated fluidity (filled fraction of the probe) of (a,d,g,j) RG20, (b,e,h,k) S1235, and (c,f,i,l) S1135 waxes, depending on the time after filling start and injection temperatures at injection pressures. (ac) P = 49 kPa, (df) P = 98 kPa, (gi) P = 147 kPa, and (jl) P = 196 kPa.
Jmmp 08 00213 g009
Figure 10. Simulated (ad) temperature, (eh) fraction solid, (il) viscosity, (mp) shear rate for (a,c,e,g,i,k,m,o) RG20, and (b,d,f,h,j,l,n,p) S1235 waxes for filling time (a,b,e,f,i,j,m,n) 1 s and (c,d,g,h,k,l,o,p) 2 s. The injection temperature and pressure were 90 °C and 196 kPa, respectively.
Jmmp 08 00213 g010aJmmp 08 00213 g010b
Table 1. Wax properties provided by the supplier.
WaxRG20S1235S1135
AdditivesCross-linked polystyrene particlesCross-linked polystyrene particlesCross-linked polystyrene particles/terephthalic acid
Additives content (%)183522/13
Drop melt point (°C)717775
Viscosity at 100 °C (mPa·s)310400350
Linear shrinkage (%)0.650.650.7
Ash content (%)0.020.040.03
Disclaimer/Publisher’s Note: The statements, opinions and data contained in all publications are solely those of the individual author(s) and contributor(s) and not of MDPI and/or the editor(s). MDPI and/or the editor(s) disclaim responsibility for any injury to people or property resulting from any ideas, methods, instructions or products referred to in the content.

