Article

Influence of Interpass Temperature on the Simulated Coarse-Grained Heat-Affected Zone of a Circumferentially Welded 2.25Cr-1Mo Steel Pipe Joint

by
Paulo Henrique Grossi Dornelas
1,*,
João da Cruz Payão Filho
2,
Victor Hugo Pereira Moraes e Oliveira
2 and
Francisco Werley Cipriano Farias
1
1
UNIDEMI, Department of Mechanical and Industrial Engineering, NOVA School of Science and Technology, Universidade NOVA de Lisboa, 2829-516 Caparica, Portugal
2
Programa de Engenharia Metalúrgica e de Materiais, Universidade Federal do Rio de Janeiro (UFRJ), Rio de Janeiro 21941-972, Brazil
*
Author to whom correspondence should be addressed.
J. Manuf. Mater. Process. 2024, 8(6), 248; https://doi.org/10.3390/jmmp8060248
Submission received: 14 October 2024 / Revised: 29 October 2024 / Accepted: 4 November 2024 / Published: 6 November 2024

Abstract

:
To reduce manufacturing costs, energy companies aim to maximize the deposition rate during welding operations by increasing the interpass temperature (IT), thereby minimizing the cooling time. However, IT can significantly affect weldment performance, particularly its Charpy V-notch (CVN) impact energy (toughness). The present study investigates the effect of increasing IT beyond the limit specified by the ASME B31.3 (315 °C) on the CVN impact energy (−30 °C) of the simulated coarse-grained heat-affected zone (CGHAZ) of a 2.25Cr-1Mo steel submerged arc welded (SAW). The CGHAZ thermal cycles were obtained through finite element method simulations and physically replicated using a Gleeble machine. The increase in IT beyond the ASME-specified limit significantly reduces the CVN impact energy of the CGHAZ. However, the values obtained remained above the minimum required threshold (NORSOK M630, 42 J). The main effect of increased IT was grain coarsening. Additionally, an inverse linear relationship was observed between effective grain size (EGS) and CVN impact energy. The steel’s microstructure showed non-significant sensitivity to variations in IT within the studied range. These findings suggest that, under the conditions studied, increasing IT could be a viable option for optimizing production by reducing welding time and potentially lowering costs.

1. Introduction

To strengthen their position in a highly competitive market, oil and gas companies are investing in solutions to reduce manufacturing and production costs. One approach is to shorten welding time by increasing the deposition rate through higher heat input [1], elevated welding current [2], and the use of multiple torches/wires, such as tandem and twin [3,4]. However, excessive heat accumulation in the weld joint can raise the interpass temperature (IT) beyond specified limits (e.g., as defined by the ASME B31.3 code [5]), requiring cooling pauses (i.e., reducing process efficiency). Additionally, elevated IT can cause a coarse and brittle microstructure in the heat-affected zone (HAZ), particularly in the coarse-grained HAZ (CGHAZ), compromising the joint’s fracture toughness [6,7,8,9,10]. Consequently, studying the upper limit of IT has become essential in welding cost-reduction strategies, as IT impacts both process efficiency (minimizing idle time) and weldment performance.
Numerical, thermodynamic, and physical simulations play a crucial role in advancing welding research. Computational simulations models of welding thermal cycles and microstructures in both the weld metal and HAZ reduce the time and resources needed to evaluate how welding parameter changes impact joint behavior [11,12,13]. The multiphysical nature of welding, along with rapid thermal cycles and nonlinear material properties, makes FEM simulations complex [14]. However, recent computational advances have enhanced the use of welding simulations [15,16], providing insights into effects that are difficult to measure experimentally, such as uneven IT distribution and its impact on joint performance. In addition to numerical methods, thermodynamic simulations (e.g., Calphad) have been widely adopted to predict physical properties and phase transformations during heat treatments and welding thermal cycles [17,18]. Likewise, thermo-mechanical simulators (e.g., Gleeble machine) have been effectively used to replicate HAZ thermal cycles and enlarge specific HAZ regions. These methods are widely accepted and recognized for their efficiency in welding research [19,20,21].
Among materials commonly used in the energy industry, it can be highlighted the 2.25Cr-1Mo steel, which is typically recognized for its creep resistance, and it is widely used in pressure vessels operating at temperatures up to 540 °C [22]. However, welding thermal cycles can disrupt the balance of high strength and toughness in the CGHAZ, especially for high-hardenability steels. Additionally, few studies have investigated the influence of cooling rate (which is significantly affected by IT) on the CGHAZ Charpy V-notch (CVN) impact energy of 2.25Cr-1Mo steel welds.
Given the challenges associated with heat accumulation during continuous welding, this study aimed to investigate the effect of IT above 315 °C (ASME B31.3 [5]) on the CVN impact energy of the simulated CGHAZ of a 2.25Cr-1Mo steel pipe welded by submerge arc welding (SAW). The welding thermal cycles were simulated using commercial FEM software (Sysweld®, v.2022.0), and the CGHAZ was thermally reproduced with a Gleeble machine. The samples were analyzed using optical microscopy (OM), electron backscatter diffraction (EBSD), as well as CVN impact tests at −30 °C and Vickers microhardness.

2. Materials and Methods

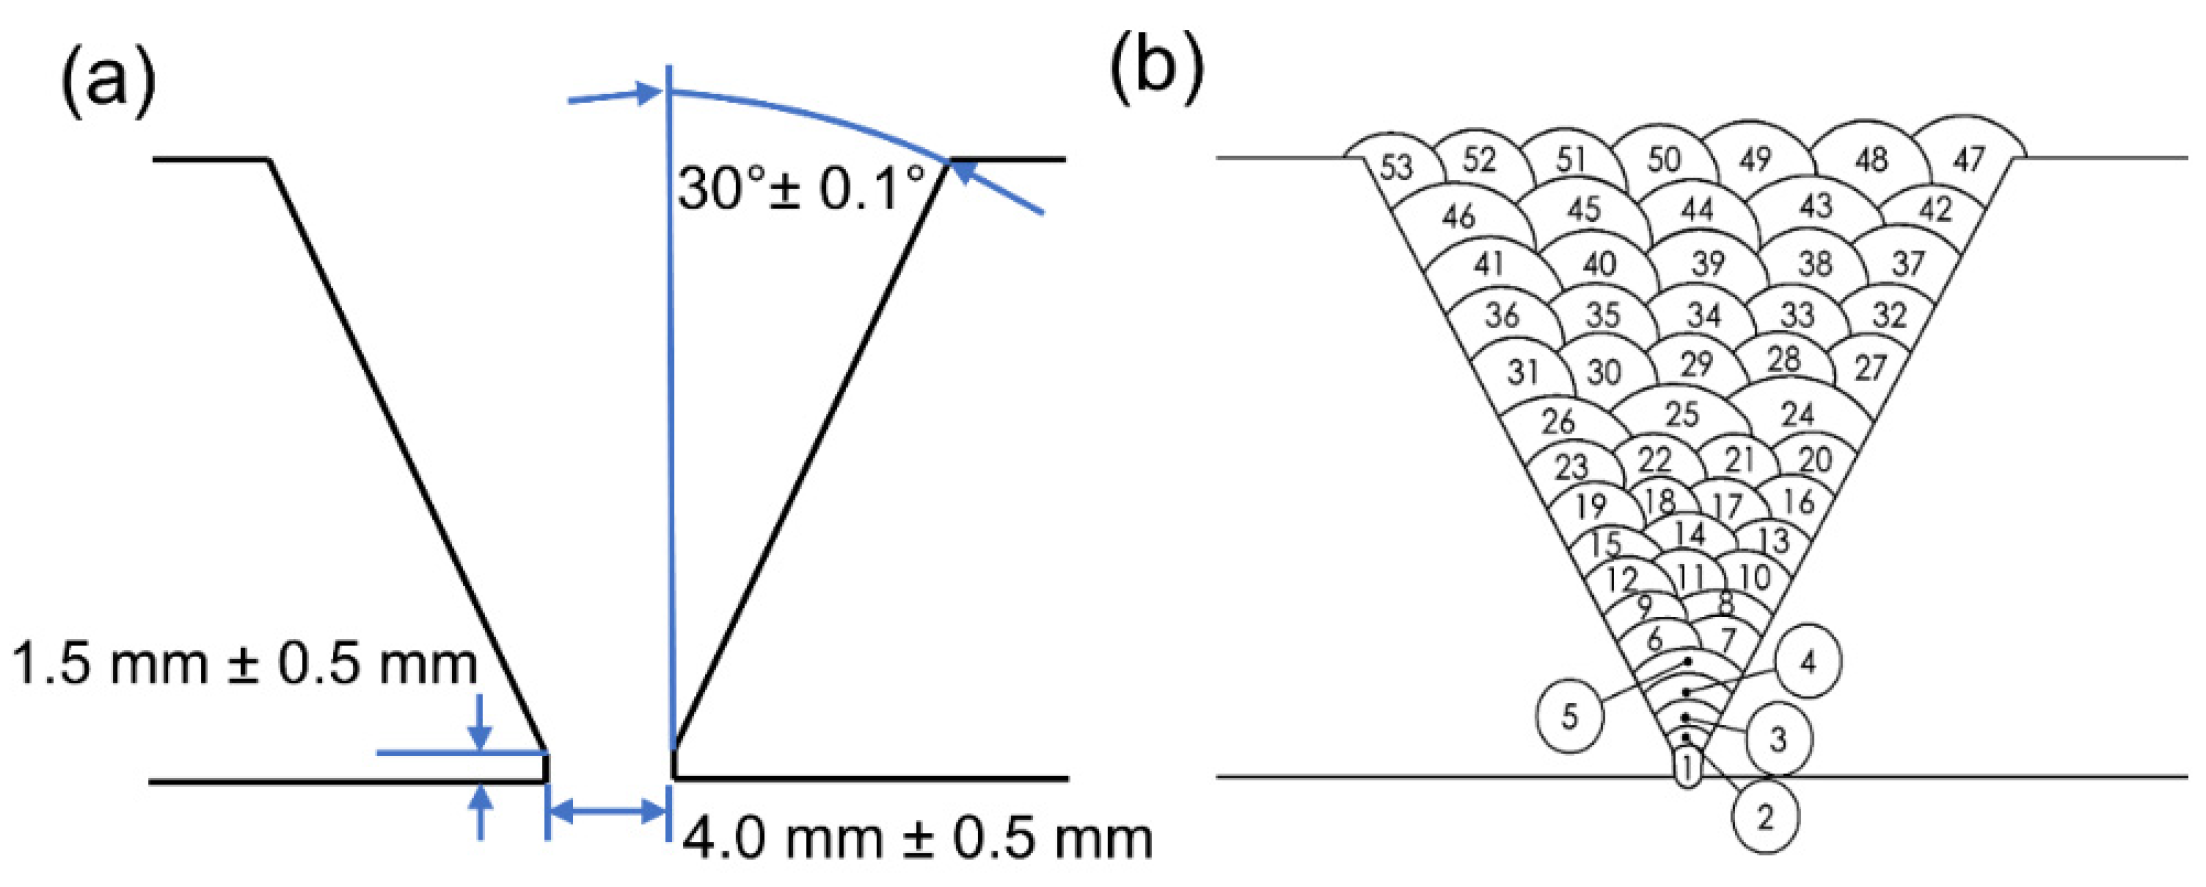
2.1. Materials and Welding

A 2.25Cr-1Mo steel pipe, normalized, with a ferritic + pearlite microstructure (Figure 1), was girth welded using gas tungsten arc (GTAW, 1–4 root and hot passes) and SAW (5–53 fill and cap passes). Table 1 shows the chemical composition of the pipe. Table 2 shows the GTAW and SAW parameters. The IT was monitored using K-type thermocouples welded on the surface of the base metal 25 mm from the groove. Given this steel’s high hardenability, post-welding heat treatment (PWHT) is required for stress relief. The PWHT (655 °C/1 h) was selected based on ASME B31.3 [5], which recommends stress relief temperatures between 620 and 720 °C for Cr-Mo steels. Figure 2 illustrates the groove dimensions and a schematic of the welding pass sequence.

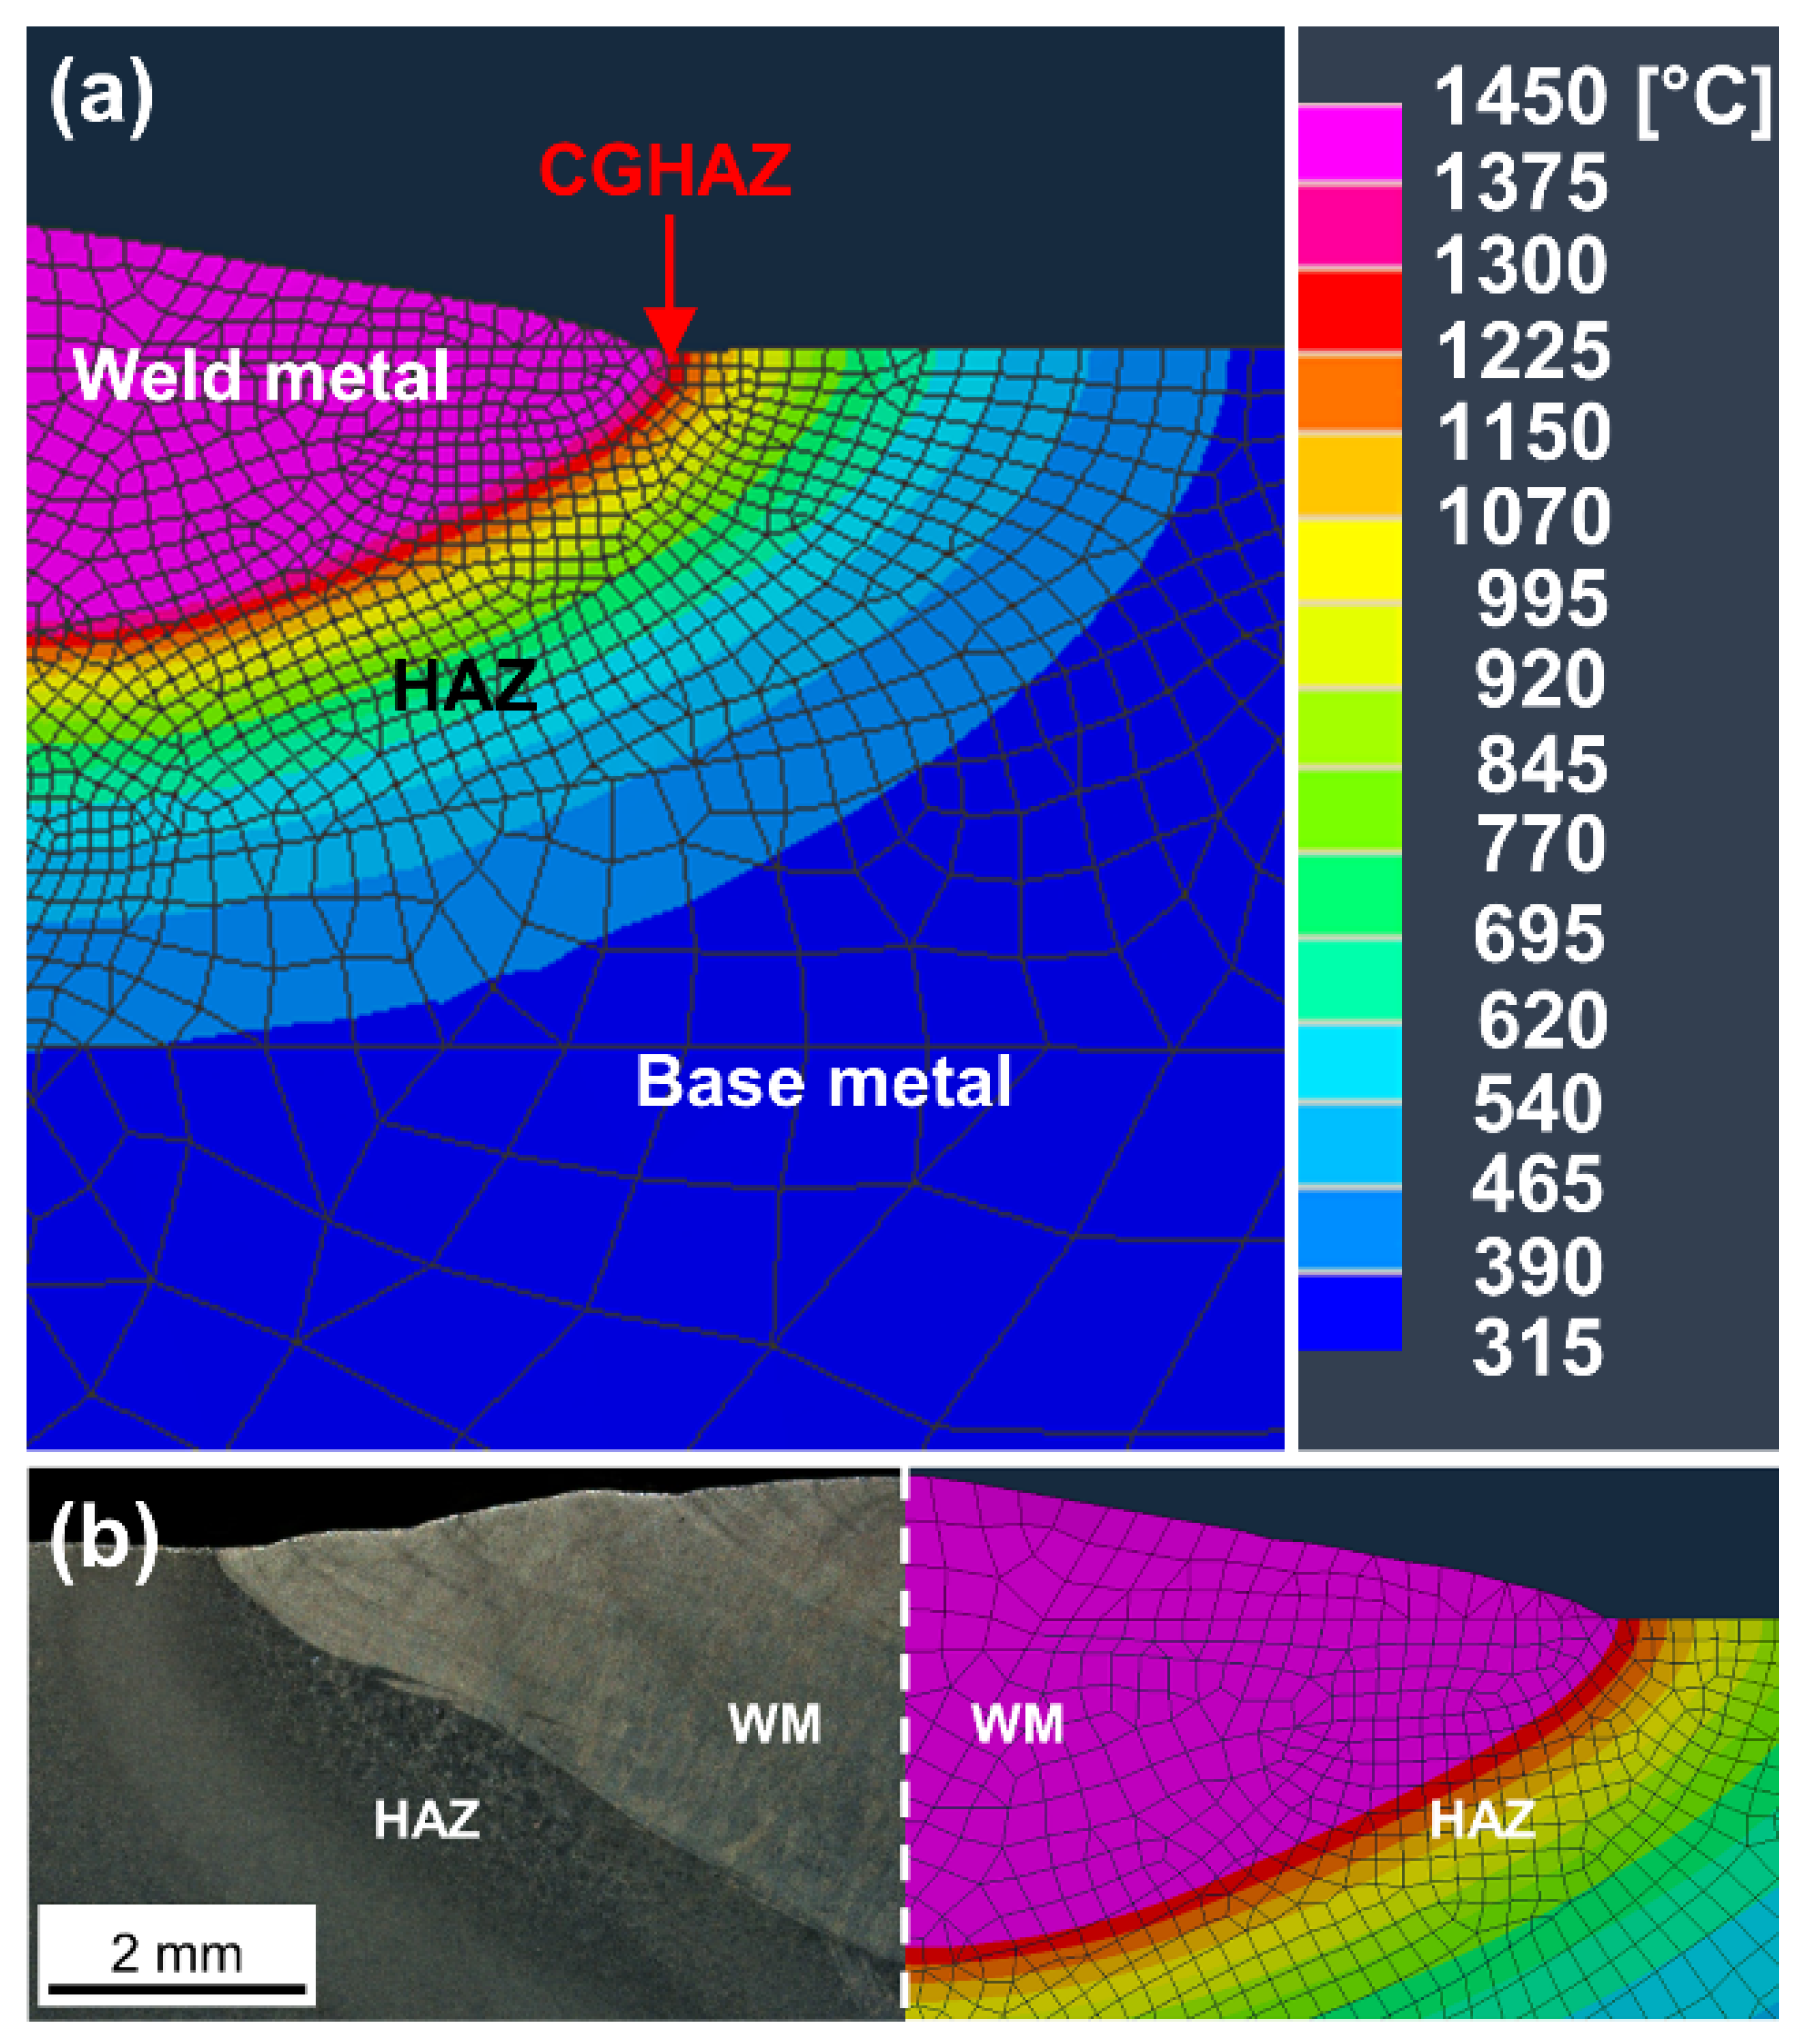
2.2. Welding Simulation

2.2.1. Welding Modeling

The welding was modeled using the fundamental heat conduction equation in multiphase solids, Equation (1), with a moving heat source (Goldak et al. [23]). In Equation (1), k , ρ , and c p represent the thermal conductivity, density, and specific heat at a constant pressure, respectively, and Q ˙ represents the generated heat per volume. These isotropic material properties were obtained from thermodynamic simulations (JMatPro® v.13.3, Figure 3) based on the chemical composition of the pipe (Table 1). The same properties were used for the base and weld metals due to their similarities in chemical compositions.
x k T x + y k T y + z k T z + Q ˙ = ρ c p T t
The Goldak et al. [23] double-ellipsoids model is represented in Equation (2), where f and r denote the front and rear quadrants of the double-ellipsoids, respectively. q i , ν , and t represent the power density distribution in the double-ellipsoid, the welding speed (Table 2), and time, respectively. a , b , and c i (Table 3) indicate the semi-axes of the double-ellipsoid. f i denotes the fraction of the heat at the front ( f f , Table 3) and rear ( f r = 2 f f ). η , U , and I represent the thermal efficiency of the welding process (0.95), the electric arc voltage (Table 2), and the welding current (Table 2), respectively.
q i x , y , z , t = 6 3 f i η U I a b c i π π e x p 3 x 2 a 2 3 y 2 b 2 3 z ν t 2 c i 2 , i = f   a n d   r
The present model simulated only the cap pass (the last one). The initial condition assumed that the IT in the CGHAZ (15 mm from the groove) was 315 °C. The boundary condition accounted for heat flow due to radiation and convection in the welded joint. The weld metal elements were simulated using the birth-and-death technique. The procedures for executing, documenting, and validating the welding simulations followed the ISO 18166 standard [24]. For a more detailed mathematical and modeling description, consult [11].

2.2.2. Welding Validation

The welding simulation was validated by comparing the thermal cycles recorded by thermocouples positioned 10 and 25 mm from the groove (Figure 4) with those obtained from the computational model (Figure 5). This approach aligns with the procedure outlined in ISO 18166 [24] and is a typical procedure adopted in the literature [11,25,26]. Based on the comparison of peak temperatures (Figure 6), the model demonstrated approximately 90% accuracy, with the cooling rate matching the experimentally measured value. Once the model was validated for an IT of 315 °C, additional simulations were conducted for ITs of 400, 475, and 550 °C, and the thermal cycles in the CGHAZ (Figure 6) were experimentally replicated.
The time required to cool from 800 to 500 °C (t8/5) within the HAZ significantly influences the primary phase transformations of high-strength low-alloy steels (HSLA) [26,27]. The t8/5 value serves as a key indicator for predicting the resulting microstructures and mechanical properties of the HAZ. Table 4 shows the cooling rate for each IT calculated based on t8/5.

2.3. Microstructural and Mechanical Characterization

The simulated welding thermal cycles (Figure 6) were thermally reproduced in a Gleeble 3800 thermo-mechanical simulator using specimens machined in the pipe-rolling direction (10 mm × 10 mm × 80 mm). After the physical simulation, the samples underwent the PWHT at 655 °C for 1 h. These specimens were used for CVN impact testing, Vickers microhardness (HV1) tests, and microstructural characterization.
The optical microscopy and EBSD samples were prepared via traditional grinding and polishing, with an additional step of mechanical polishing using colloidal silica (SiO2, 0.04 μm). The OM was performed using a Zeiss Axio Imager M2m. The grain boundaries were revealed through immersion etching (2 g of acid picric, C6H3N3O7, in 98 mL). EBSD analysis was performed using a Bruker e−Flash instrument with an accelerating voltage of 20 kV, a step size of 0.3 μm, and a working distance of 17 mm. Data post-processing was conducted in MTEX (a free and open-source toolbox). The prior austenite grain size (PAGS) and effective grain size (EGS) were measured using the intercept method (ASTM E112 [28]).
The CVN impact testing was conducted using a JBW-300 pendulum impact tester at −30 °C, following ASTM A370 [29]. The Vickers microhardness test was performed at room temperature using an HV-1000 Digimet hardness tester, applying a load of 1 kgf for a dwell time of 20 s, following ASTM E92 [30].

3. Results and Discussion

Figure 7 shows that the microstructures for tested IT (315, 400, 475, and 550 °C) consist of a combination of tempered martensite and bainite. Figure 8 shows the microhardness and CVN impact energy as a function of the IT. Despite variations in IT, there does not appear to be a significant effect on the overall microstructure aspects. This observation suggests that increasing the IT, which corresponds to a decrease in the cooling rate [31], does not induce notable modifications in the phase proportions, despite altering PAGS (Figure 9). This can be attributed to the inverse relationship between IT and PAGS with cooling rate: a higher IT tends to increase PAGS (due to longer soaking times at elevated temperatures, which enhances the material’s hardenability) while reducing the cooling rate (favoring bainite formation and resulting in lower hardness). Consequently, this is reflected in the hardness measurements, as confirmed by the results shown in Figure 8a, where the hardness values remain relatively consistent across the different ITs. The difference in hardness values between quenched martensite and bainite is reduced due to the diffusion promoted by the PWHT.
Figure 8b shows a significant drop in CVN impact energy with the increase in the IT. This reduction suggests that, while the microstructure remains predominantly tempered martensitic + bainitic and the hardness values are stable, another factor adversely affects the material’s impact energy. It is well known that higher heat input, i.e., lower cooling rates, during welding increases the grain size (i.e., PAGS), which can reduce impact energy, particularly at lower temperatures [32,33]. Additionally, an increase in IT similarly affects the cooling rate [34]. Therefore, the PAGS was measured and plotted against each IT, as depicted in Figure 9. Figure 9a shows that an increase in IT leads to a corresponding increase in PAGS. The rise in IT = 315 °C to 400 °C resulted in a significant increase in PAGS; however, from IT = 400 °C to 475 °C and 550 °C, there was no notable increase as these values fell within the margin of error. Although the increase in IT resulted in a decrease in CVN impact energy, the increase in PAGS due to IT cannot be identified as the primary factor contributing to the lower CVN impact energy. This is because PAGS did not increase for temperatures higher than 400 °C, yet CVN impact energy continued to decline significantly. Therefore, while the relationship between IT and PAGS is evident, it is essential to consider other factors that may influence CVN impact energy. The linear fitting (Figure 9b) between PAGS and absorbed energy corroborates this assumption.
The CVN impact energy of a material refers to its ability to resist crack propagation through its microstructure. In other words, several factors can influence crack propagation, either facilitating or hindering it. Lipetzky and Kreher [35] reported that high-angle grain boundaries (HAGB) can deflect transgranular crack propagation, contributing to higher impact energy by increasing crack energy dissipation. In addition, Bhattacharjee et al. [36] reported that only the EGS was directly related to material’s toughness. Zhou et al. [37] defined EGS as the distance between two consecutive points with misorientation (θ) greater than 50°. Therefore, materials with a finer EGS and/or a greater proportion of high-angle grain boundaries (HAGBs) typically exhibit improved impact energy [36,38,39,40]. EGS can be interpreted as a free path for crack propagation without deflection, meaning less energy is spent during propagation until a boundary is reached and the crack direction changes (deflection). Thus, a smaller EGS results in a higher number of crack deflections (increased energy consumption) and, consequently, higher impact energy.
Figure 10a illustrates that as the IT increases, there is a corresponding rise in the EGS. Unlike the behavior observed with PAGS, where the increase in IT did not significantly affect the grain size beyond a certain point, higher IT resulted in a continuous increase in EGS. To further evaluate the direct relationship between EGS and impact energy, Figure 10b shows a linear fit of EGS against absorbed energy, yielding an R2 value of 0.98, indicating an almost perfect correlation between these two variables. This strong correlation allows us to conclude that the reduction in impact energy with increasing IT is primarily controlled by the growth in EGS.
The influence of EGS on crack propagation is further illustrated in the point-to-point analysis shown in Figure 11, which relates the crack propagation distance in the microstructure to the misorientation of the microstructure. Assuming a straight-line crack propagation from point 0 to point 160, the increased IT promoted longer propagation distances without crack deflection, indicating a larger EGS. As a result, the crack can propagate minimal energy loss, leading to reduced impact energy. This suggests that the enlarged grain structure at higher IT facilitates easier crack progression, ultimately lowering the material’s resistance to impact loading.
Considering the as-supplied condition and the parameters studied in this work, increasing the IT can be a valid alternative for reducing production costs. Despite the reduction in CVN impact energy observed with higher IT, the values remained above the minimum required (NORSOK M630,42 J [41]). However, this statement is based solely on the properties evaluated in this study. For practical application, it is essential to assess other mechanical properties to ensure the material’s overall performance, especially in demanding service conditions. Therefore, while higher IT shows potential for cost optimization, further investigation is needed to confirm its viability in real-world applications.

4. Conclusions

This study investigated the effect of increasing the interpass temperature (IT) beyond 315 °C, as specified by the ASME B31.3 [5], on the CVN impact energy of the simulated coarse grain heat-affected zone (CGHAZ) in 2.25Cr-1Mo steel welded by submerged arc welding. Based on the results obtained, the following conclusions can be drawn:
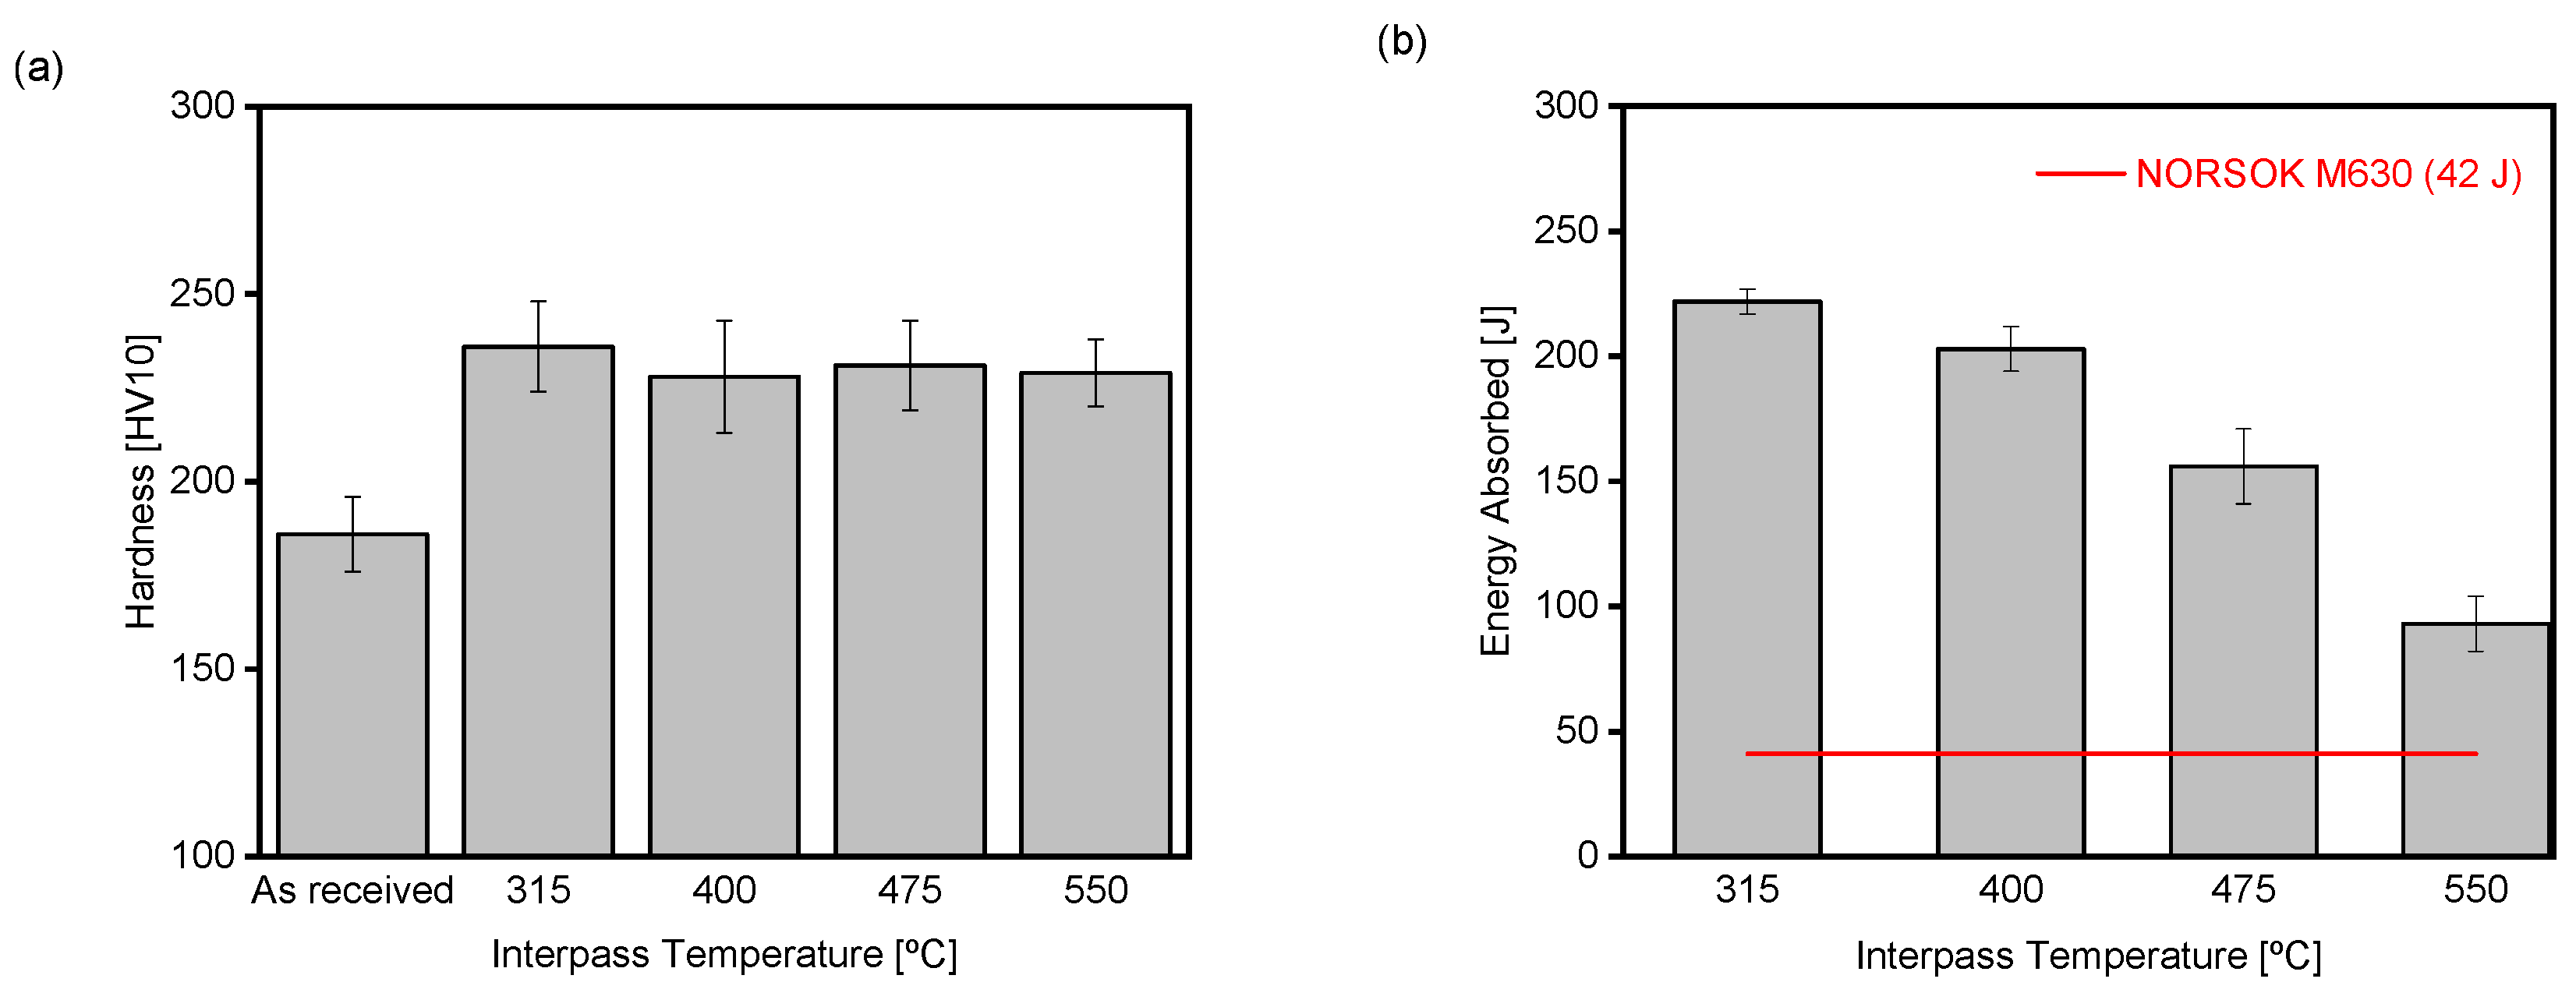
  • The increase in IT higher than that indicated by the ASME B31.3 significantly reduces the CVN impact energy of the CGHAZ of the 2.25Cr-1Mo steel.
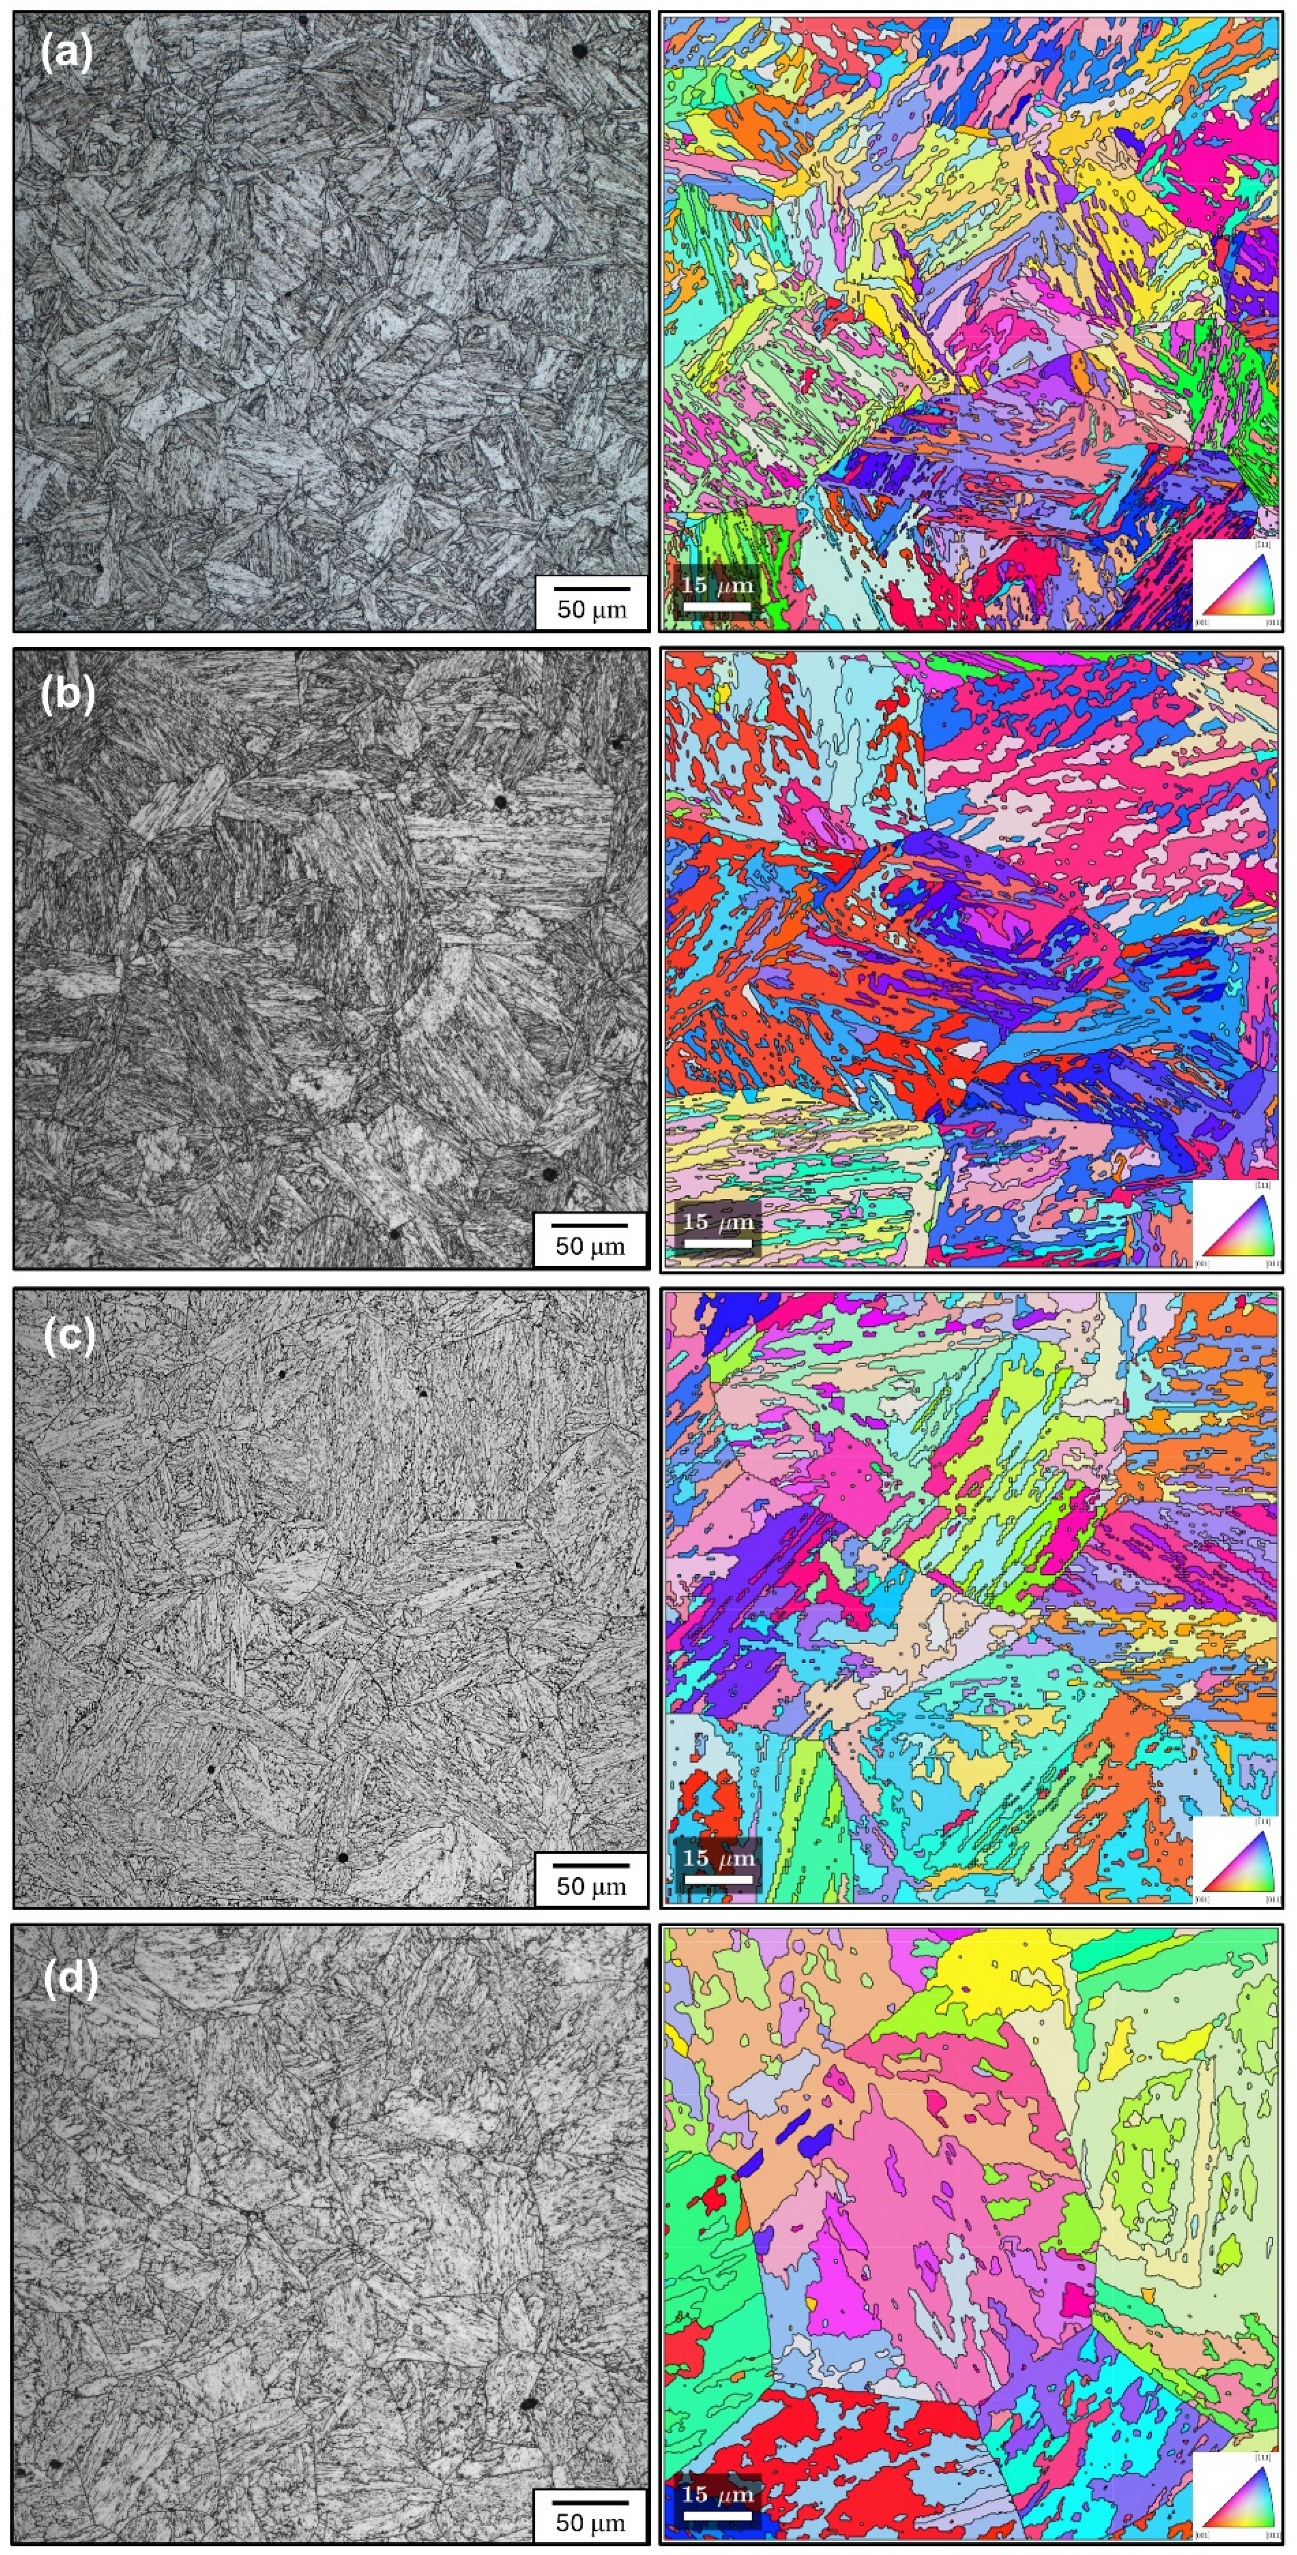
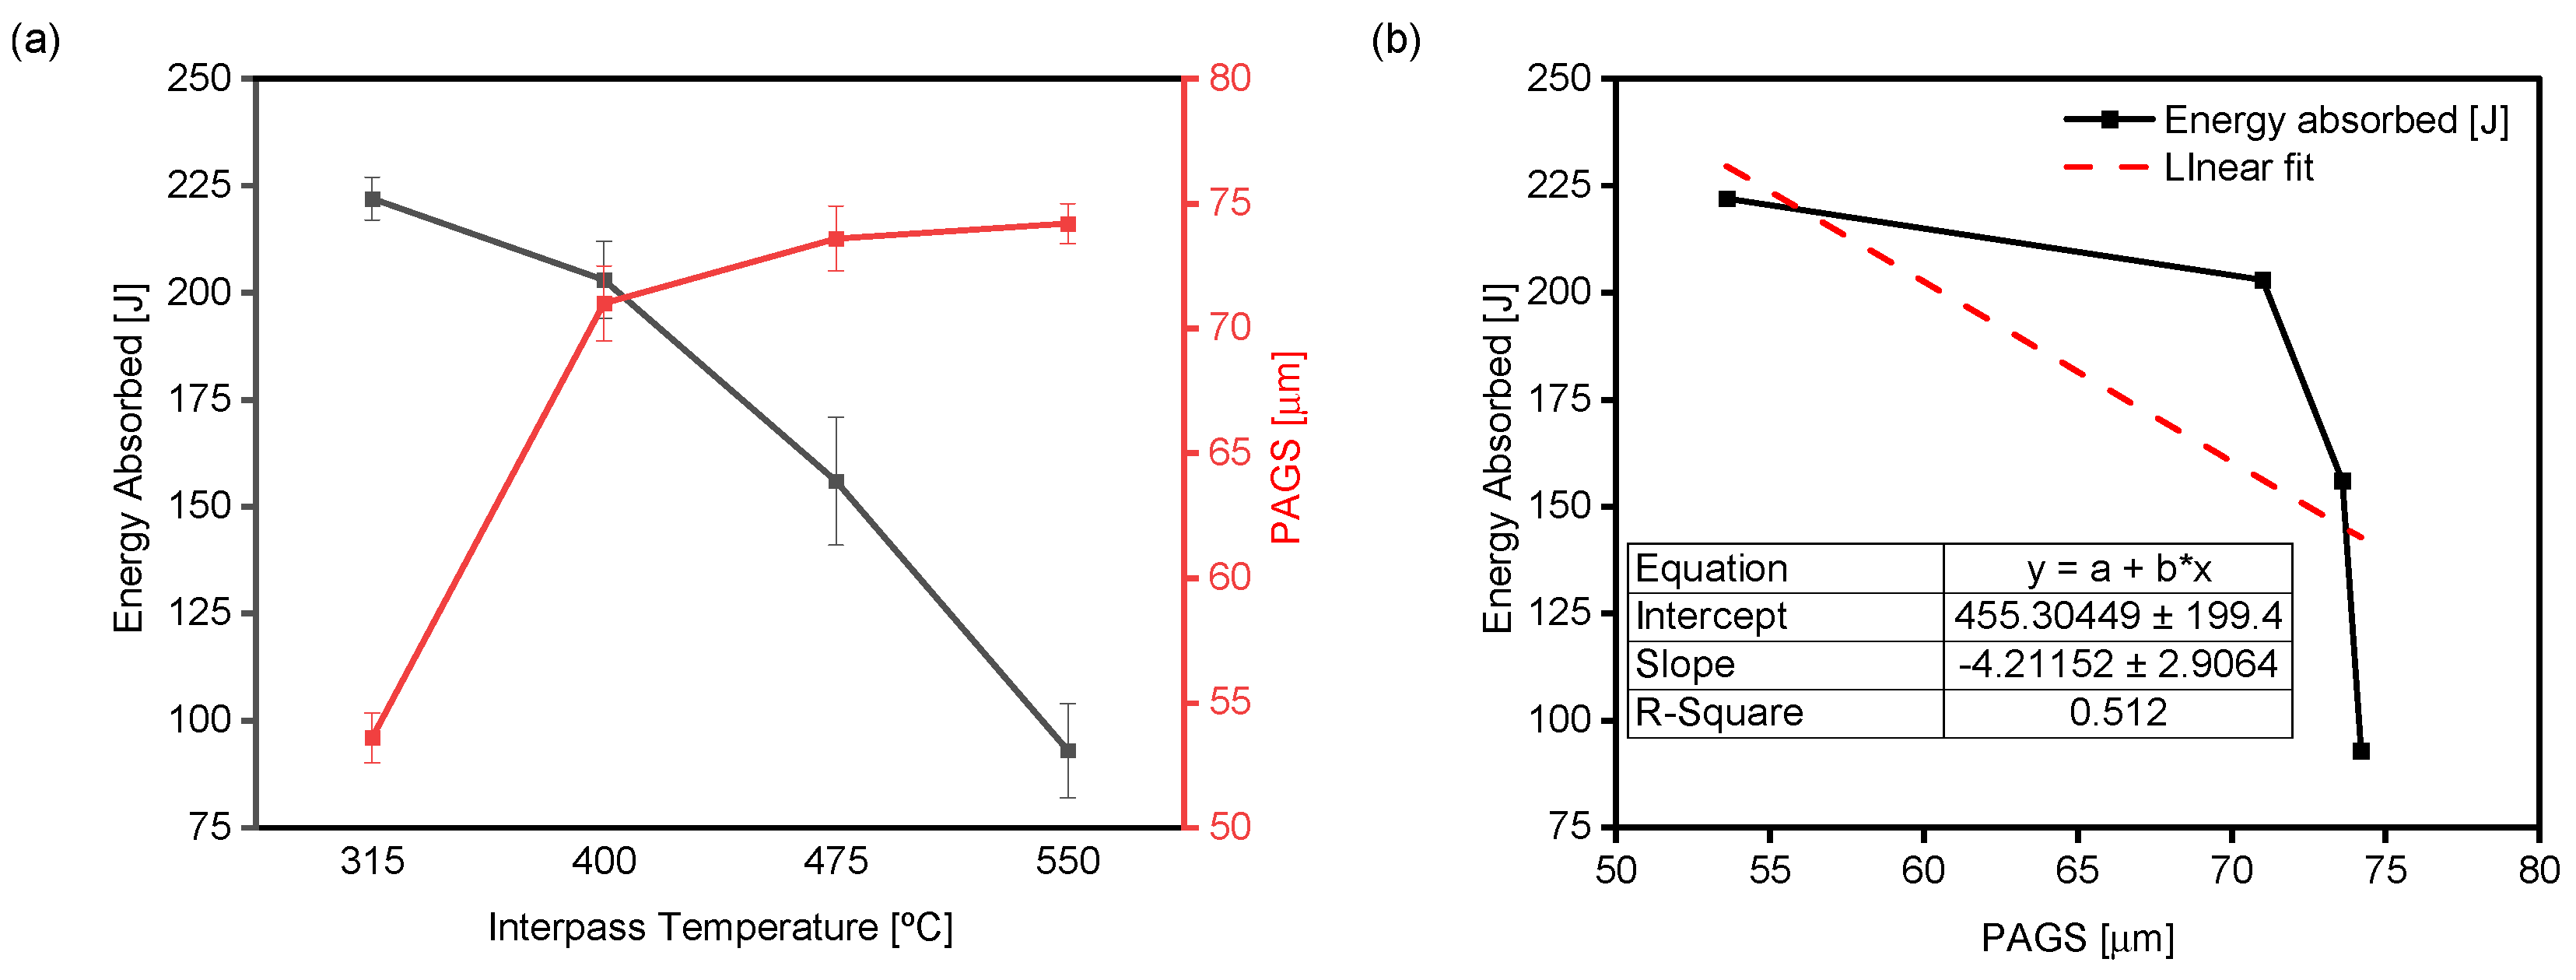
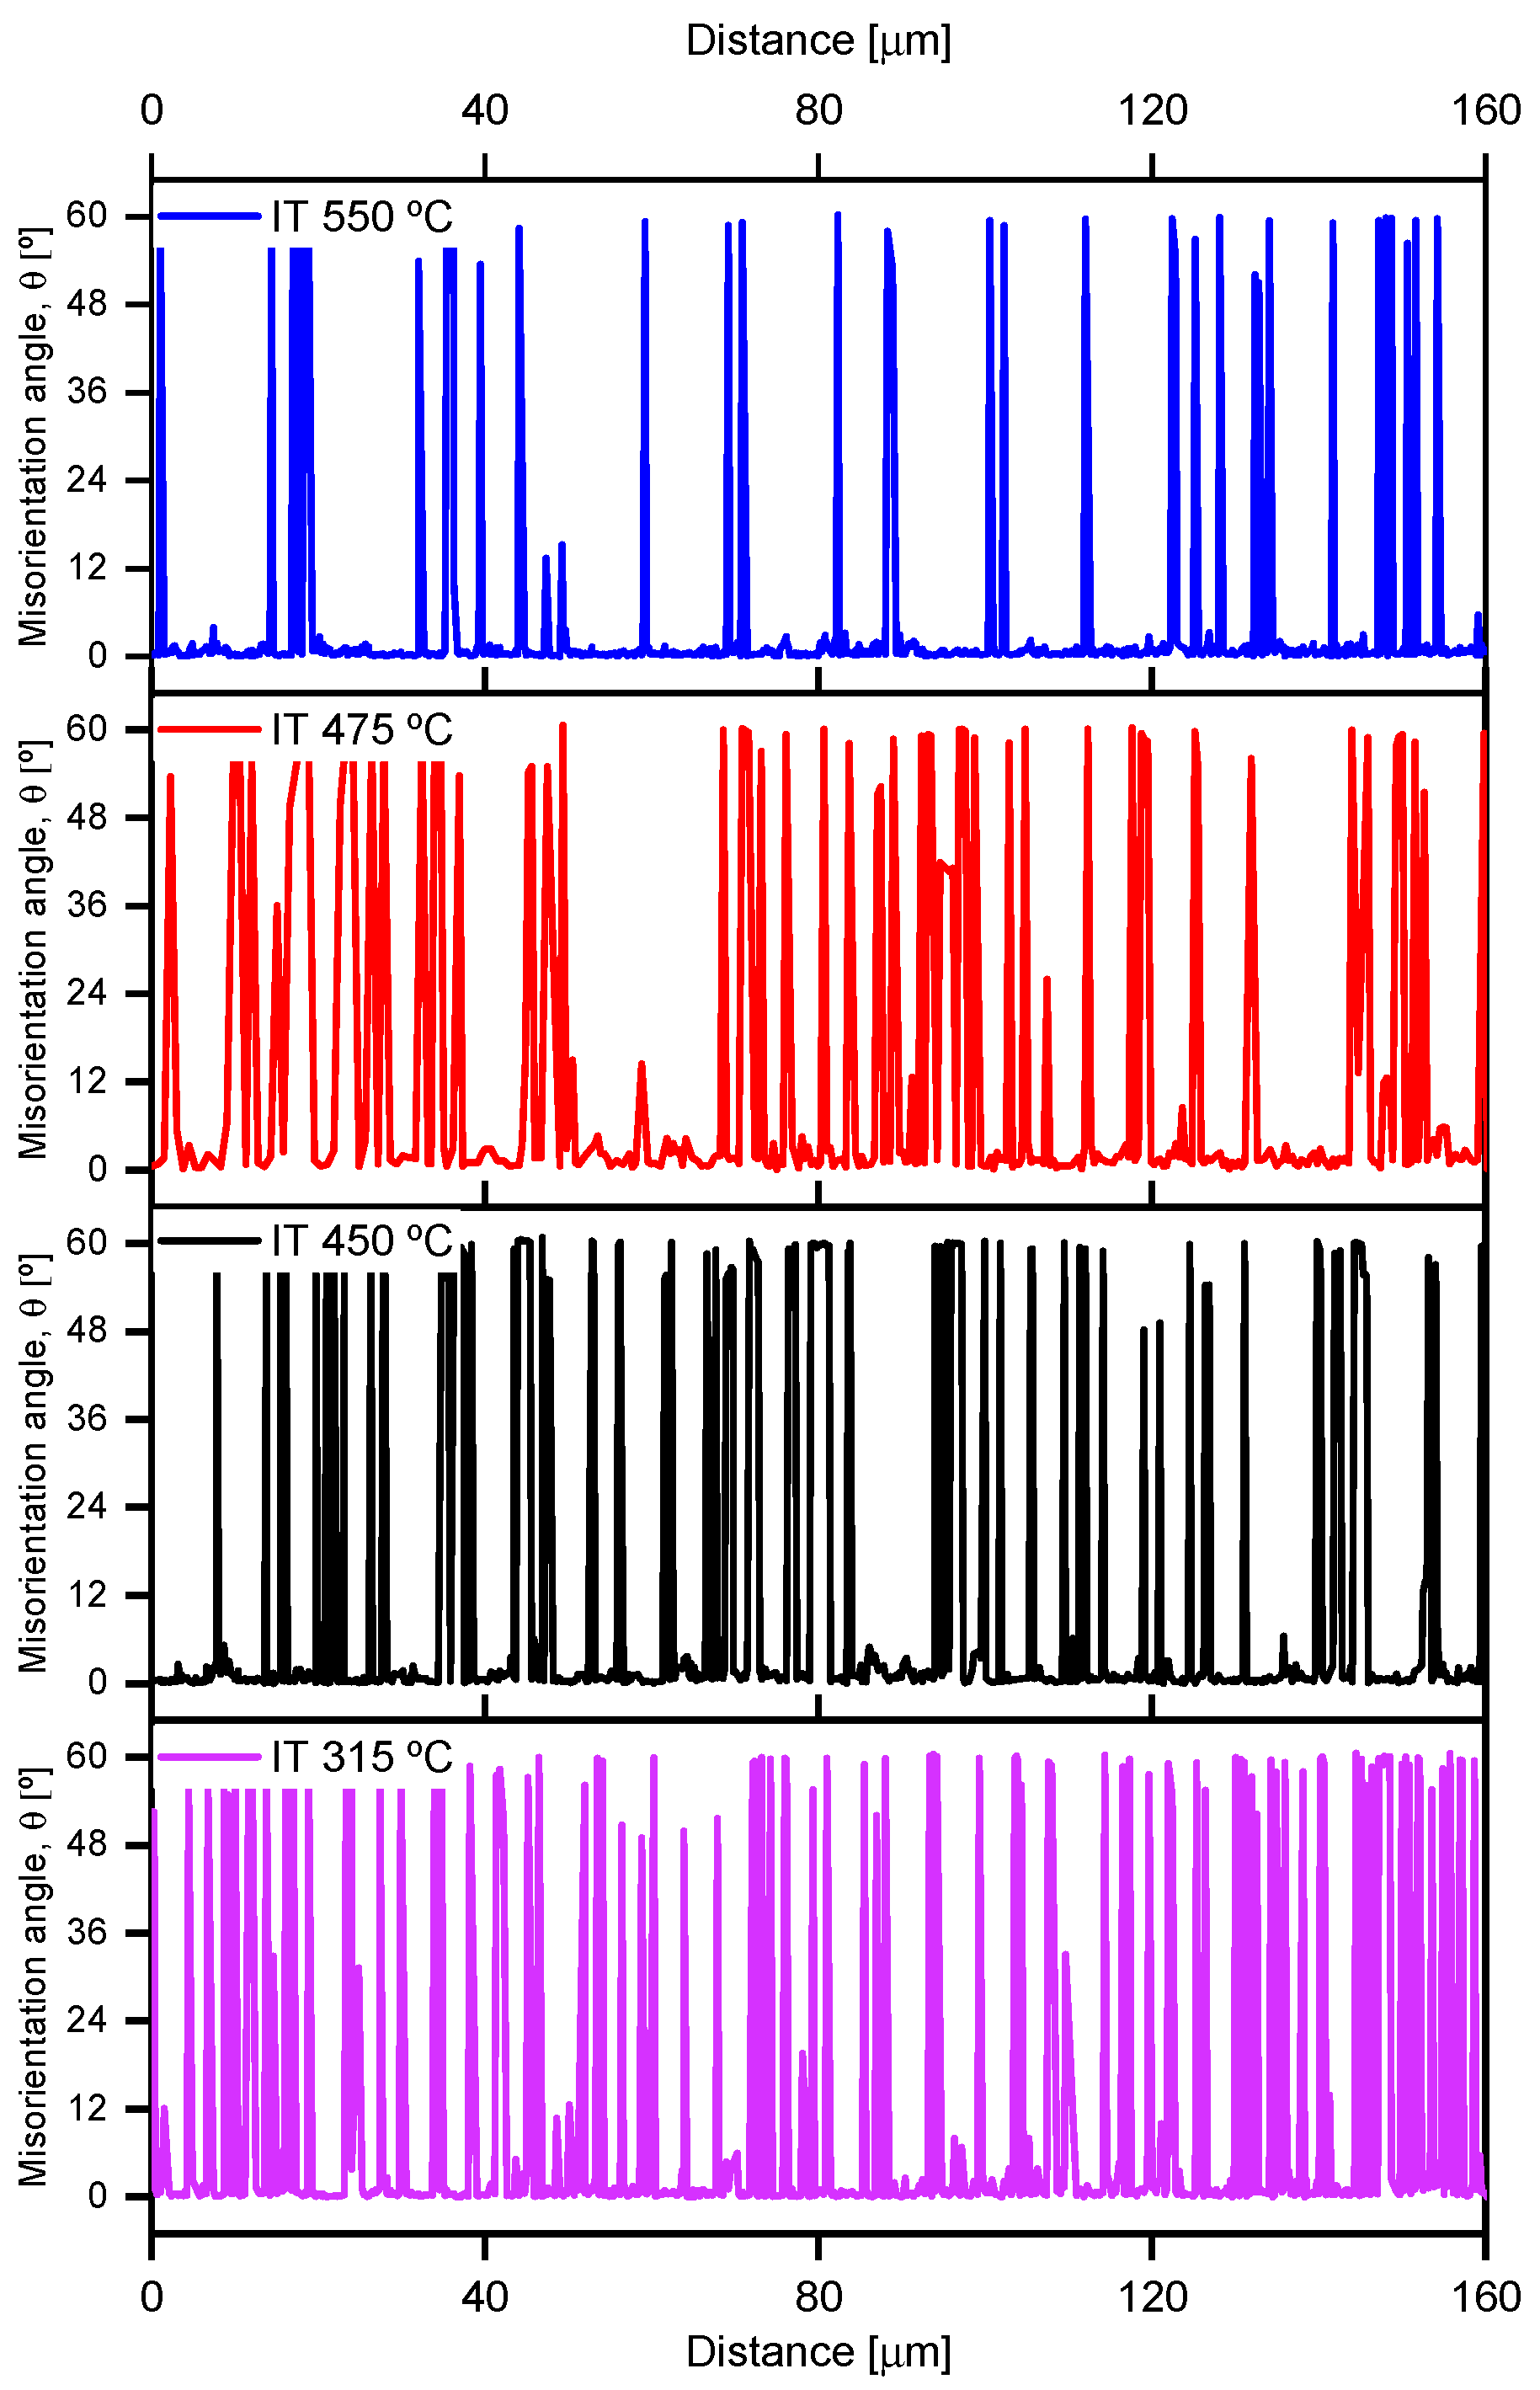
  • The primary influence of IT was observed on the effective grain size (EGS), where an increase in IT correlates with coarsening of the grains. There is an inverse relationship between the EGS and the Charpy impact energy.
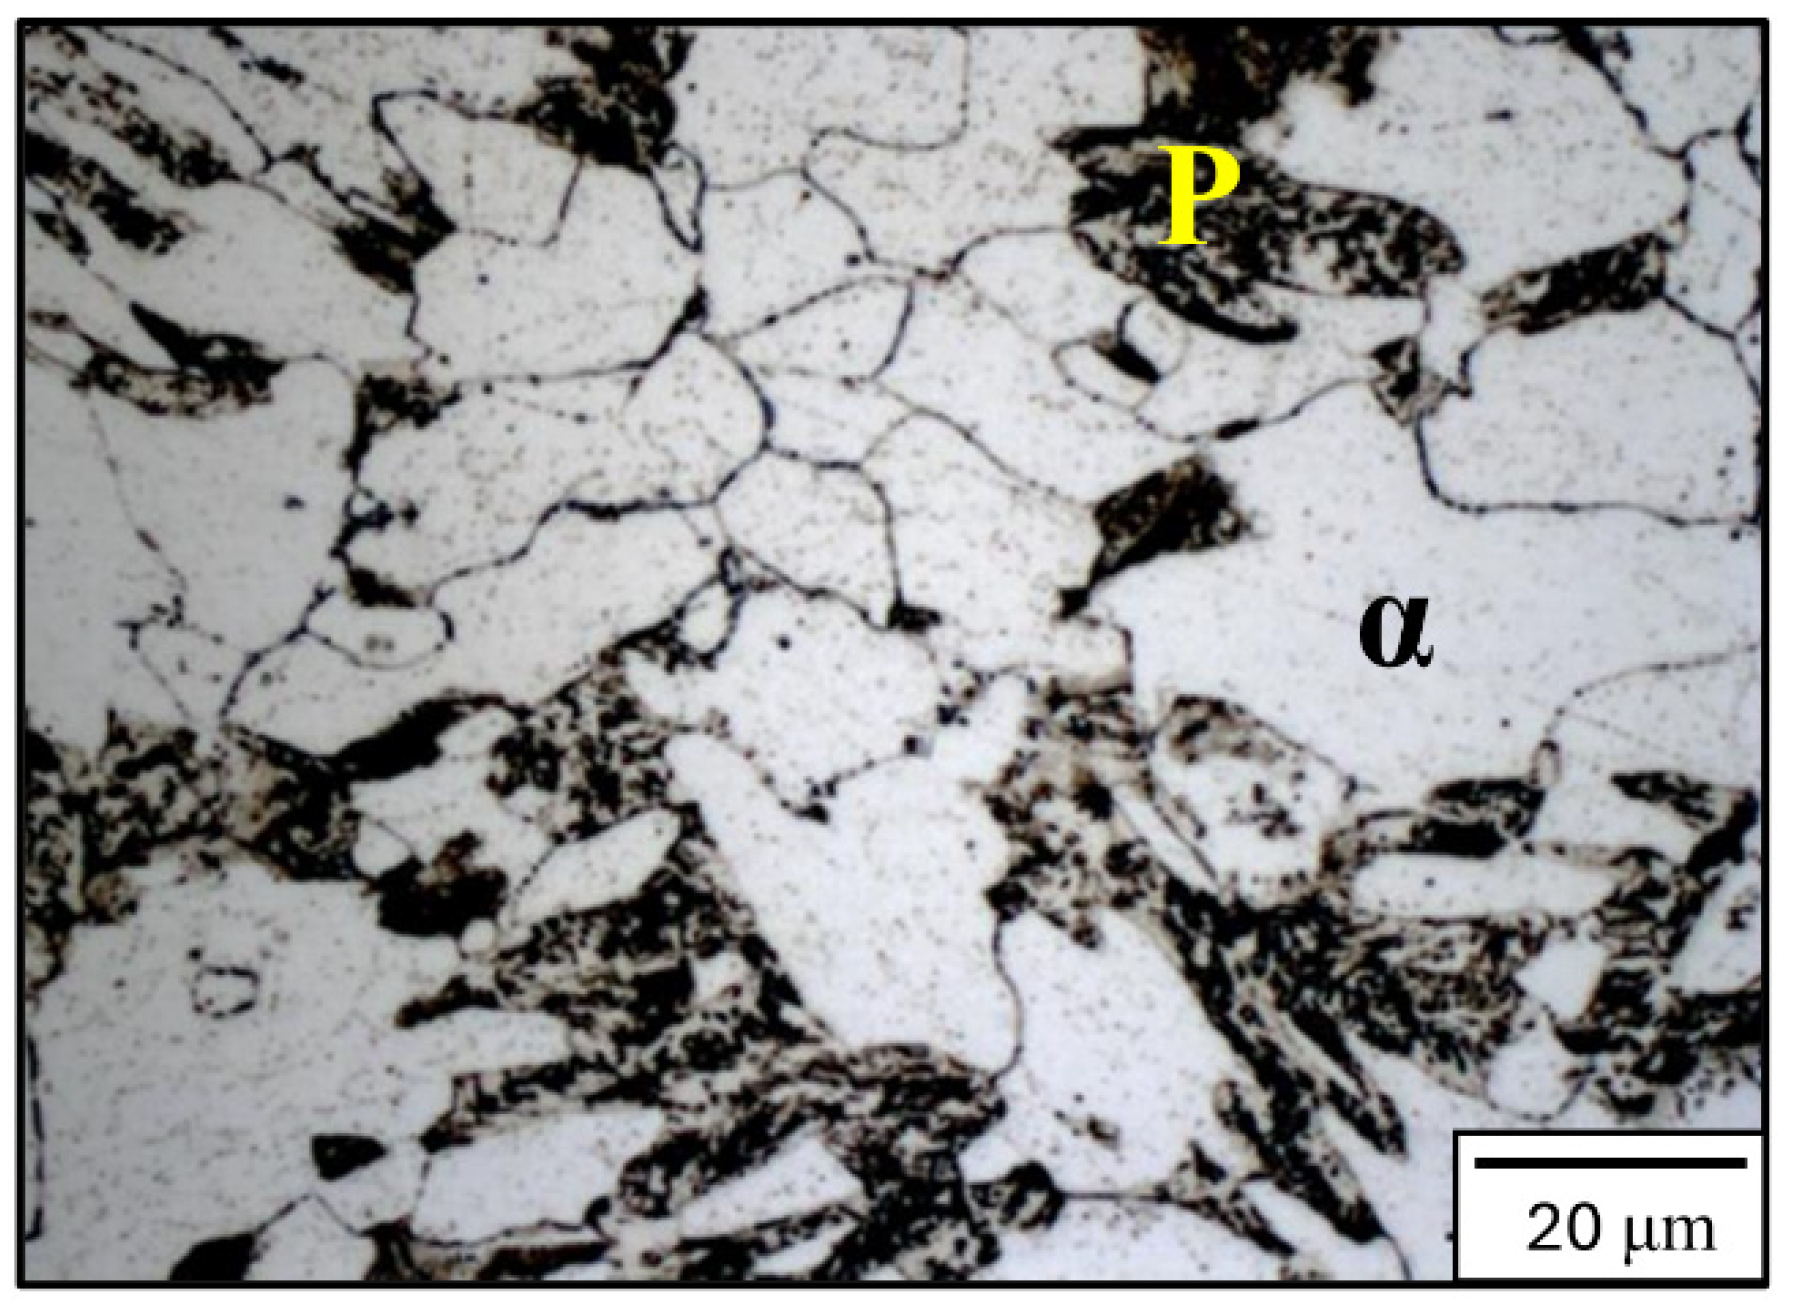
  • The phases/microconstituents present in 2.25Cr-1Mo steel appear to be almost insensitive to variations within the studied IT range, showing little observable change.

Author Contributions

Conceptualization, P.H.G.D., F.W.C.F., V.H.P.M.e.O. and J.d.C.P.F.; methodology, P.H.G.D., V.H.P.M.e.O. and F.W.C.F.; software, V.H.P.M.e.O.; validation, P.H.G.D., F.W.C.F. and V.H.P.M.e.O.; formal analysis, P.H.G.D. and F.W.C.F.; investigation, P.H.G.D., F.W.C.F. and V.H.P.M.e.O.; resources, J.d.C.P.F.; data curation, P.H.G.D. and F.W.C.F.; writing—original draft preparation, P.H.G.D. and F.W.C.F.; writing—review and editing, P.H.G.D., F.W.C.F., V.H.P.M.e.O. and J.d.C.P.F.; visualization, P.H.G.D. and F.W.C.F.; supervision, J.d.C.P.F.; project administration, V.H.P.M.e.O. and J.d.C.P.F.; funding acquisition, V.H.P.M.e.O. and J.d.C.P.F. All authors have read and agreed to the published version of the manuscript.

Funding

This work was funded by Petróleo Brasileiro S. A. (Petrobras) and Agência Nacional do Petróleo, Gás Natural e Biocombustíveis (ANP)—grant 2016/00335-0.

Data Availability Statement

The data presented in this study are available on request from the corresponding author.

Conflicts of Interest

The authors declare no conflicts of interest.

References

  1. Barbosa, L.H.S.; Modenesi, P.J.; Godefroid, L.B.; Arias, A.R. Fatigue Crack Growth Rates on the Weld Metal of High Heat Input Submerged Arc Welding. Int. J. Fatigue 2019, 119, 43–51. [Google Scholar] [CrossRef]
  2. Layus, P.; Kah, P.; Martikainen, J.; Gezha, V.V.; Bishokov, R.V. Multi-Wire SAW of 640 MPa Arctic Shipbuilding Steel Plates. Int. J. Adv. Manuf. Technol. 2014, 75, 771–782. [Google Scholar] [CrossRef]
  3. Martina, F.; Ding, J.; Williams, S.; Caballero, A.; Pardal, G.; Quintino, L. Tandem Metal Inert Gas Process for High Productivity Wire Arc Additive Manufacturing in Stainless Steel. Addit. Manuf. 2019, 25, 545–550. [Google Scholar] [CrossRef]
  4. Scalet Rossini, L.F.; Valenzuela Reyes, R.A.; Spinelli, J.E. Double-Wire Tandem GMAW Welding Process of HSLA50 Steel. J. Manuf. Process. 2019, 45, 227–233. [Google Scholar] [CrossRef]
  5. ASME Code for Pressure Piping; B31.3; The American Society of Mechanical Engineers: New York, NY, USA, 2022.
  6. Dornelas, P.H.G.; Payão Filho, J.d.C.; Moraes e Oliveira, V.H.P.; Moraes, D.d.O.; Zumpano Júnior, P. Influence of Interpass Temperature on the Simulated HAZ of a Clad API 5L X65 Pipe Joint Welded with a Gas Metal Arc. Weld. World 2022, 66, 213–226. [Google Scholar] [CrossRef]
  7. Dornelas, P.H.G.; Payão Filho, J.d.C.; Moraes e Oliveira, V.H.P.; Moraes, D.d.O.; Zumpano Júnior, P. Studying the Influence of the Interpass Temperature on the Heat-Affected Zone of an API 5L X65 Steel Welded Pipe Joint through Computational and Physical Simulations. Int. J. Press. Vessel. Pip. 2021, 194, 104548. [Google Scholar] [CrossRef]
  8. Wang, X.L.; Tsai, Y.T.; Yang, J.R.; Wang, Z.Q.; Li, X.C.; Shang, C.J.; Misra, R.D.K. Effect of Interpass Temperature on the Microstructure and Mechanical Properties of Multi-Pass Weld Metal in a 550-MPa-Grade Offshore Engineering Steel. Weld. World 2017, 61, 1155–1168. [Google Scholar] [CrossRef]
  9. Shi, Y.; Han, Z. Effect of Weld Thermal Cycle on Microstructure and Fracture Toughness of Simulated Heat-Affected Zone for a 800MPa Grade High Strength Low Alloy Steel. J. Mater. Process Technol. 2008, 207, 30–39. [Google Scholar] [CrossRef]
  10. Sirin, K.; Sirin, S.Y.; Kaluc, E. Influence of the Interpass Temperature on t 8/5 and the Mechanical Properties of Submerged Arc Welded Pipe. J. Mater. Process Technol. 2016, 238, 152–159. [Google Scholar] [CrossRef]
  11. Dornelas, P.H.G.; Farias, F.W.C.; e Oliveira, V.H.P.M.; de Oliveira Moraes, D.; Júnior, P.Z.; da Cruz Payão Filho, J. Influence of Welding Interpass Temperature on Charpy V-Notch Impact Energy of Coarse-Grain Heat-Affected Zone of AISI 4130 Steel Pipe. Int. J. Adv. Manuf. Technol. 2020, 108, 2197–2211. [Google Scholar] [CrossRef]
  12. da Silva, L.O.P.; Lima, T.N.; Júnior, F.M.d.S.; Callegari, B.; Folle, L.F.; Coelho, R.S. Heat-Affected Zone Microstructural Study via Coupled Numerical/Physical Simulation in Welded Superduplex Stainless Steels. Crystals 2024, 14, 204. [Google Scholar] [CrossRef]
  13. Park, J.-H.; Kim, D.-S.; Cho, D.-W.; Kim, J.; Pyo, C. Influence of Thermal Flow and Predicting Phase Transformation on Various Welding Positions. Heat. Mass. Transf. 2024, 60, 195–207. [Google Scholar] [CrossRef]
  14. Lindgren, L.-E. FINITE ELEMENT MODELING AND SIMULATION OF WELDING PART 1: INCREASED COMPLEXITY. J. Therm. Stress. 2001, 24, 141–192. [Google Scholar] [CrossRef]
  15. Slováček, M.; Vaněk, M.; Kik, T. Use of Welding Process Numerical Analyses as Technical Support in Industry. Part 2: Methodology and Validation. Biul. Inst. Spaw. 2015, 1, 25–32. [Google Scholar] [CrossRef] [PubMed]
  16. Restecka, M.; Jachym, R. IT Systems Used for Welding Process Simulations and Simulators of Thermal-Strain Cycles. Biul. Inst. Spaw. 2016, 60, 23–29. [Google Scholar] [CrossRef]
  17. Javaheri, V.; Nyyssönen, T.; Grande, B.; Porter, D. Computational Design of a Novel Medium-Carbon, Low-Alloy Steel Microalloyed with Niobium. J. Mater. Eng. Perform. 2018, 27, 2978–2992. [Google Scholar] [CrossRef]
  18. Park, J.; Lee, S.; Kang, S.; Jeon, J.; Lee, S.H.; Kim, H.; Choi, H. Complex Effects of Alloy Composition and Porosity on the Phase Transformations and Mechanical Properties of Powder Metallurgy Steels. Powder Technol. 2015, 284, 459–466. [Google Scholar] [CrossRef]
  19. Moeinifar, S.; Kokabi, A.H.; Hosseini, H.R.M. Effect of Tandem Submerged Arc Welding Process and Parameters of Gleeble Simulator Thermal Cycles on Properties of the Intercritically Reheated Heat Affected Zone. Mater. Des. 2011, 32, 869–876. [Google Scholar] [CrossRef]
  20. Guo, Y.H.; Lin, L.; Zhang, D.; Liu, L.; Lei, M.K. Microstructure and Mechanical Properties of Heat-Affected Zone of Repeated Welding AISI 304N Austenitic Stainless Steel by Gleeble Simulator. Metals 2018, 8, 773. [Google Scholar] [CrossRef]
  21. Liu, W.; Lu, F.; Yang, R.; Tang, X.; Cui, H. Gleeble Simulation of the HAZ in Inconel 617 Welding. J. Mater. Process Technol. 2015, 225, 221–228. [Google Scholar] [CrossRef]
  22. Ray, A.K.; Tiwari, Y.N.; Roy, P.K.; Chaudhuri, S.; Bose, S.C.; Ghosh, R.N.; Whittenberger, J.D. Creep Rupture Analysis and Remaining Life Assessment of 2.25Cr–1Mo Steel Tubes from a Thermal Power Plant. Mater. Sci. Eng. A 2007, 454–455, 679–684. [Google Scholar] [CrossRef]
  23. Goldak, J.; Bibby, M.; Moore, J.; House, R.; Patel, B. Computer Modeling of Heat Flow in Welds. Met. Trans. B 1986, 17, 587–600. [Google Scholar] [CrossRef]
  24. ISO/TS 18166; Numerical Welding Simulation—Execution and Documentation. International Organization for Standardization: Geneva, Switzerland, 2016.
  25. Bate, S.K.; Charles, R.; Warren, A. Finite Element Analysis of a Single Bead-on-Plate Specimen Using SYSWELD. Int. J. Press. Vessel. Pip. 2009, 86, 73–78. [Google Scholar] [CrossRef]
  26. Dornelas, P.H.G.; Payão Filho, J.d.C.; Farias, F.W.C.; Moraes e Oliveira, V.H.P.; Moraes, D.d.O.; Zumpano Júnior, P. FEM-Thermodynamic Simulation Methodology to Predict the Influence of T8/5 on the Coarse Grain Heat-Affected Zone of a Cr-Mo Low-Alloy Steel Pipe. J. Manuf. Process 2020, 60, 520–529. [Google Scholar] [CrossRef]
  27. American Welding Society. Welding Processes, Part 1; American Welding Society: Doral, NW, USA, 2004. [Google Scholar]
  28. ASTM E112; Standard Test Methods for Determining Average Grain Size. ASTM International: West Conshohocken, PA, USA, 2024.
  29. ASTM A370; Standard Test Methods and Definitions for Mechanical Testing of Steel Products. ASTM International: West Conshohocken, PA, USA, 2024.
  30. ASTM E92; Standard Test Methods for Vickers Hardness and Knoop Hardness of Metallic Materials. ASTM International: West Conshohocken, PA, USA, 2017.
  31. Dornelas, P.H.G.; Payão Filho, J.d.C.; Moraes e Oliveira, V.H.P.; Moraes, D.d.O.; Zumpano Júnior, P. Effect of the Interpass Temperature on Simulated Heat-Affected Zone of Gas Metal Arc Welded API 5L X70 Pipe Joint. Int. J. Adv. Manuf. Technol. 2022, 119, 261–274. [Google Scholar] [CrossRef]
  32. Elrefaey, A.; Javadi, Y.; Francis, J.A.; Callaghan, M.D.; Leonard, A.J. Evolution of Microstructure and Toughness in 2.25Cr-1Mo Steel Welds. Int. J. Press. Vessel. Pip. 2018, 165, 20–28. [Google Scholar] [CrossRef]
  33. Schönmaier, H.; Krein, R.; Schmitz-Niederau, M.; Schnitzer, R. Influence of the Heat Input on the Dendritic Solidification Structure and the Mechanical Properties of 2.25Cr-1Mo-0.25V Submerged-Arc Weld Metal. J. Mater. Eng. Perform. 2021, 30, 7138–7151. [Google Scholar] [CrossRef]
  34. Dornelas, P.H.G.; Payão Filho, J.d.C.; Farias, F.W.C.; Moraes e Oliveira, V.H.P.; Moraes, D.d.O.; Zumpano Júnior, P. Influence of the Interpass Temperature on the Microstructure and Mechanical Properties of the Weld Metal (AWS A5.18 ER70S-6) of a Narrow Gap Welded API 5L X70 Pipe Joint. Int. J. Press. Vessel. Pip. 2022, 199, 104690. [Google Scholar] [CrossRef]
  35. Lipetzky, P.; Kreher, W. Grain Boundary Toughness Effects on Crack Propagation in Brittle Polycrystals. Mater. Sci. Eng. A 1996, 205, 110–116. [Google Scholar] [CrossRef]
  36. Bhattacharjee, D.; Knott, J.F.; Davis, C.L. Charpy-Impact-Toughness Prediction Using an “Effective” Grain Size for Thermomechanically Controlled Rolled Microalloyed Steels. Met. Mater. Trans. A 2004, 35, 121–130. [Google Scholar] [CrossRef]
  37. Zhou, T.; Yu, H.; Wang, S. Effect of Microstructural Types on Toughness and Microstructural Optimization of Ultra-Heavy Steel Plate: EBSD Analysis and Microscopic Fracture Mechanism. Mater. Sci. Eng. A 2016, 658, 150–158. [Google Scholar] [CrossRef]
  38. Kim, S.; Lee, S.; Lee, B.S. Effects of Grain Size on Fracture Toughness in Transition Temperature Region of Mn–Mo–Ni Low-Alloy Steels. Mater. Sci. Eng. A 2003, 359, 198–209. [Google Scholar] [CrossRef]
  39. Park, Y.J.; Bernstein, I.M. The Process of Crack Initiation and Effective Grain Size for Cleavage Fracture in Pearlitic Eutectoid Steel. Met. Trans. A 1979, 10, 1653–1664. [Google Scholar] [CrossRef]
  40. Hwang, B.; Kim, Y.G.; Lee, S.; Kim, Y.M.; Kim, N.J.; Yoo, J.Y. Effective Grain Size and Charpy Impact Properties of High-Toughness X70 Pipeline Steels. Met. Mater. Trans. A 2005, 36, 2107–2114. [Google Scholar] [CrossRef]
  41. NORSOK M630; Material Data Sheets and Element Data Sheets for Piping. Norwegian Technology Centre: Oslo, Norway, 2020.
Figure 1. Optical microscopy of the 2.25Cr-1Mo base metal as received, identifying the pearlite (P) and ferrite (α) constituents.
Jmmp 08 00248 g001
Figure 2. (a) Groove dimensions and (b) schematic of the welding pass sequence.
Jmmp 08 00248 g002
Figure 3. Density, specific heat, and thermal conductivity at a constant pressure of the 2.25Cr-1Mo steel pipe obtained from JMatPro® thermodynamic simulation.
Jmmp 08 00248 g003
Figure 4. Simulated and measured welding thermal cycles 10 and 25 mm away from the groove.
Jmmp 08 00248 g004
Figure 5. (a) Temperature map obtained using the FEM model and (b) macrographs of the weld cap pass with the simulated joint for an interpass temperature (IT) of 315 °C, showing the weld metal (WM), heat-affected zone (HAZ), coarse-grained heat-affected zone (CGHAZ), and base material (adapted from [11,26]).
Jmmp 08 00248 g005
Figure 6. Simulated welding thermal cycles of the CGHAZ for the studied interpass temperatures (IT).
Jmmp 08 00248 g006
Figure 7. Optical (left) and EBSD (right) micrographs of the simulated CGHAZ for IT = (a) 315, (b) 400, (c) 475, and (d) 550 °C.
Jmmp 08 00248 g007
Figure 8. (a) Vickers microhardness and (b) Charpy-V notch impact energy (−30 °C) as a function of the interpass temperature.
Jmmp 08 00248 g008
Figure 9. (a) Energy absorbed and prior austenite grain size (PAGS) as a function of the interpass temperature and (b) linear fitting between PAGS and absorbed energy.
Jmmp 08 00248 g009
Figure 10. (a) Energy absorbed and effective grain size (EGS) as a function of the interpass temperature, and (b) linear fitting between EGS and absorbed energy.
Jmmp 08 00248 g010
Figure 11. Point-to-point analysis of the simulated CGHAZ.
Jmmp 08 00248 g011
Table 1. Chemical composition (wt.%) of the 2.25Cr-1Mo steel pipe obtained by optical emission spectroscopy.
Chemical Element CMnSiPSCrMoNiNb+Ti+VAlCuFe
wt [%]0.140.540.340.030.012.090.950.120.060.020.08Bal.
Table 2. Parameters adopted for the gas tungsten arc (GTAW) and submerged arc welding (SAW).
ParameterGTAW PassSAW Pass
Root (1)Hot (2–4)Fill (5–46)Cap (47–53)
Welding position5G1GR
Filler metalAWS A5.28 (ER90S-B3)AWS A5.23 (F9P2-EB3R-B3R)
Shielding gas99.99%Ar
FluxAWS S 62 4 FB SNi1Mo
Current type/polarityDC/-DC/+
Voltage [V]11–13.511.8–16.226.4–32.226.7–32.6
Welding current, I [A]111–136159–262435–531456–558
Welding speed, WS [cm/min]5.6–6.88.1–12.128.7–35.028.9–36.5
Stick-out [mm]10–20
Heat input, HI [kJ/mm]1.3–1.61.4–2.12.4–2.92.5–3.0
Interpass temperature, IT [°C]315
Preheating temperature, T0 [°C]230
Table 3. Goldak double-ellipsoid heat-source parameters. ff represents the fraction of the heat in the front quadrant, and a, b, cf, and cr represent the semi-axes of the double-ellipsoid.
Heat Sourceffabcfcr
11.172.750.807.702.30
21.207.500.607.502.50
Table 4. Cooling rate calculated based on t8/5 of the CGHAZ at studied interpass temperatures (IT).
IT [°C]t8/5 [s]Cooling Rate [°C/s]
3151520.0
4003010.0
475803.8
5502101.4
Disclaimer/Publisher’s Note: The statements, opinions and data contained in all publications are solely those of the individual author(s) and contributor(s) and not of MDPI and/or the editor(s). MDPI and/or the editor(s) disclaim responsibility for any injury to people or property resulting from any ideas, methods, instructions or products referred to in the content.

