Article

Effect of Different Annealing Methods on ULTEM 9085 Parts Manufactured by Material Extrusion

1
College of Engineering, Birmingham City University, Birmingham B4 7XG, UK
2
Engineering Department, MGE (Colchester) Ltd., Colchester CO4 9HY, UK
*
Author to whom correspondence should be addressed.
J. Manuf. Mater. Process. 2024, 8(6), 258; https://doi.org/10.3390/jmmp8060258
Submission received: 24 September 2024 / Revised: 11 November 2024 / Accepted: 12 November 2024 / Published: 14 November 2024

Abstract

:
A common practice of improving the performance of parts manufactured by material extrusion is annealing. In this work, ULTEM 9085 parts were subjected to three different annealing methods to compare their effectiveness in terms of dimensional stability, hardness, surface roughness, tensile strength, microstructure and flexural strength. The annealing methods involved heating ULTEM 9085 parts inside an oven in three different ways: direct oven annealing by placing the parts on a tray, fluidized bed annealing with sharp sand surrounding the parts and sandwiching the parts between metal plates. Annealing for all three methods was conducted at temperatures of 180 °C, 190 °C and 200 °C with time intervals of 1 h, 2 h and 3 h. The results showed that direct oven annealing provides consistent results under all scenarios. Better dimensional accuracies were observed with fluidized bed annealing, and metal plate annealing is better suited to ensuring an improved surface finish and higher hardness values. For the tensile test, direct oven annealing yielded the most consistent and optimal results with an increase of up to 28.1% in tensile strength, whereas the other two methods performed better at lower temperatures. Direct oven annealing also led to improved ductility and higher elongation at break. Moreover, microstructural analysis of the fracture surfaces indicated enhanced coalescence for direct oven annealing. In terms of flexural testing, metal plate annealing proved to be more effective, with an increase of up to 13.9% in flexural strength. The other two methods demonstrated consistent results, with direct oven annealing showing slightly higher values compared with unannealed ULTEM 9085 samples. This work provides a useful comparison among different annealing methods that can be used to enhance the performance of ULTEM 9085 parts for different engineering applications.

1. Introduction

Additive manufacturing (AM) processes have significantly changed the way parts are designed and manufactured due to a myriad of benefits including design flexibility, reductions in production costs, material availability, shortening the product development cycle and reductions in the part count [1]. AM has transformed various industrial sectors, including automotive, aerospace, bioprinting, textiles, electronics and medical, by enabling the production of highly customized, lightweight and complex components [2,3,4]. Beyond terrestrial applications, AM has also demonstrated its potential in space exploration. Notably, the European Space Agency achieved a significant milestone by utilizing metal AM technology to produce the first metal part ever manufactured in space [5]. This advancement highlights AM’s capability to reduce reliance on Earth-based supply chains and enable in situ production of critical components in space, paving the way for sustainable long-term space missions and operations. AM’s adaptability across such diverse sectors underscores its growing importance as a versatile manufacturing technology.
As per ISO/ASTM 52900:2021 [6], there are seven categories of AM processes, namely binder jetting, directed energy deposition, material extrusion, material jetting, powder bed fusion, sheet lamination and vat polymerization. Out of these seven categories, material extrusion is one of the most used methods due to its ease of operation, cost-effectiveness and versatility in materials [7]. Fused deposition modeling (FDM), also known as fused filament fabrication (FFF), is a material extrusion process that typically makes use of a thermoplastic material filament to build parts layer by layer by depositing melted material through a heated nozzle. Common criticisms of the FDM process include the rough surface finish with visible lines, dimensional inaccuracies and limited mechanical performance, thus limiting their applicability [8]. Optimization of the FDM process’s parameters (e.g., extrusion temperature, layer height, infill pattern and print orientation) is crucial for achieving the desired results. Extensive research has been conducted on improving print quality through process optimization, with a focus on enhancing the tensile strength, surface finish, and overall part performance [9,10,11,12].
A diverse range of thermoplastics is available for FDM applications, spanning from widely used materials such as PLA (polylactic acid) and ABS (acrylonitrile butadiene styrene) to advanced, high-performance thermoplastics such as PEI (polyetherimide) and PEEK (polyether ether ketone). Among the high-performance PEI materials, ULTEM (the brand name for a high-performance thermoplastic material, manufactured by Stratasys) has gained immense popularity, especially ULTEM 9085, which is among the strongest of Stratasys’s FDM materials and is well suited for high-strength/low-weight applications. This material exhibits exceptional impact resistance and outstanding chemical tolerance, making it highly suitable for demanding applications in industries such as aerospace, automotive and electronics. Due to its robust mechanical properties and versatility, ULTEM 9085 has become the focus of numerous research studies aimed at exploring its performance under various conditions, including different fabrication techniques, post-processing methods and environmental factors. For example, Cicala et al. [13] compared the rheological, morphological and thermomechanical properties of ULTEM 9085 with polyetherimide blends modified by either polycarbonate or polyethylene terephthalate glycol. Shelton et al. [14] investigated the influence of the thermal profile during the FDM process on the interlayer bonding characteristics of ULTEM 9085 components. Padovano et al. [15] performed tensile and flexural tests on ULTEM 9085 samples manufactured in different build orientations to show their impact on mechanical performance. The thermal and thermo-oxidative behavior was also examined, with no significant weight variation observed up to the temperature of 447.5 °C.
Despite rapid advancements in the optimization of processing parameters and high-performance material development, FDM-printed parts often exhibit anisotropic behavior, with inferior mechanical properties compared with their traditionally manufactured counterparts (e.g., via injection molding). This has led to increasing interest in post-processing techniques, such as annealing, to improve the performance of the printed parts. Annealing is a heat treatment process that has been extensively studied for its potential to relieve internal stresses, enhance crystallinity and improve the mechanical strength of thermoplastic materials. In the context of FDM-printed components, annealing offers the ability to address warping, residual stresses and layer adhesion issues [16]. Various annealing methods, including conventional oven heating, pressure-assisted annealing and microwave annealing, have been explored in the literature, each offering distinct advantages depending on the material and the desired mechanical outcomes. Studies have shown that annealing can significantly impact the dimensional stability, tensile strength and thermal resistance of printed parts, particularly for high-performance polymers such as ULTEM 9085. Zhang and Moon [17] proposed a novel low-temperature thermal annealing methodology for FFF-printed ULTEM 9085 parts where coupons are annealed with specialized support structures. This approach significantly enhanced ductility, with improvements of up to 27% for XY coupons and 5% for XZ coupons. Furthermore, mesostructure and fracture surface analyses revealed increased coalescence and chevron patterns, highlighting the improved material behavior following the annealing process. De Bruijn et al. [18] investigated the impact of time, temperature and a pressurized environment for annealing ULTEM 9085 flexural samples using the design of experiments methodology. They provided recommended levels for time and temperature to obtain enhanced flexural strength and average surface roughness, namely 3 h and 200 °C. In a subsequent study, De Bruijn et al. [19] utilized a combined thermal annealing and isostatic pressing process to optimize the mechanical and surface finish of FDM-printed ULTEM 9085 parts with Doehlert experimental designs. They identified that 4.4 h of annealing in a pressurized environment at 200.5 °C reduced the surface roughness by more than 90% and made it 75% more resistant to bending stresses. In addition to various annealing methods, post-process cooling plays a crucial role in ensuring optimal material performance. Controlled cooling after annealing provides superior stress relief, reducing the risk of warping and distortion while enhancing the mechanical properties. In contrast, rapid cooling can lead to thermal shock, resulting in cracks, warping and the formation of residual stresses, which can compromise the integrity of the material. In this context, Glaskova-Kuzmina et al. [20] examined the impact of different post-process cooling conditions (oven cooling, printer cooling and room temperature cooling) on ULTEM 9085 parts by tensile testing and dynamic mechanical thermal analysis of samples FDM-printed in three orthogonal planes. They demonstrated minimal variations between samples cooled either in the printer or oven (due to controlled cooling) and a notable difference for samples cooled at room temperature (rapid cooling leading to thermal shock). These works clearly indicate the significance of different annealing and cooling methods in improving the performance of FDM-printed ULTEM 9085 parts.
Given the importance of mechanical performance in critical applications, understanding the influence of different annealing methods on FDM-printed ULTEM 9085 is crucial. By evaluating the effects of different methods on key properties such as dimensional stability, surface roughness, hardness, tensile strength and flexural strength across various temperatures and times, this work aims to provide valuable insights for optimizing the mechanical performance and surface quality of ULTEM 9085 parts. This comparison among different annealing methods offers tailored manufacturing solutions, meeting diverse engineering needs through material-specific post-processing insights for high-performance polymer components.

2. Methodology

2.1. Material and Manufacturing Process

ULTEM 9085 filaments are a high-performance polyetherimide FDM thermoplastic from Stratasys, with excellent physical and mechanical properties for highly demanding and specialty applications [21]. It has been used in this work to manufacture three types of parts for testing. The dimensions of the parts are based on British and International Standards and include a BS EN ISO 527-2:2012 tensile test sample [22], a BS EN ISO 868:2003 hardness test sample [23] and a BS EN ISO 178:2019 three-point flexural testing sample [24]. All the ULTEM 9085 samples were printed in the flat orientation (as shown in Figure 1) on the Stratasys Fortus 450mc FDM system (Stratasys, Edina, MN, USA) with a build envelope of 406 mm × 355 mm × 406 mm. The build chamber of the printer was set to a temperature of 195 °C to help maintain a controlled thermal environment and to improve the interlayer adhesion. All the samples were manufactured with a layer height of 0.254 mm (nozzle diameter), a ±45° raster angle and a solid part infill style [19,20].

2.2. Annealing Methods

The manufactured ULTEM 9085 parts were subjected to three annealing methods inside the Thermo Scientific Heraeus Oven (Thermo Fisher Scientific, Waltham, MA, USA). Annealing temperatures and times for all three methods were chosen as per [18] and are shown in Table 1. The samples were placed in the oven according to the specified annealing methods and subjected to the designated temperature and duration. After the annealing time elapsed, the oven was turned off and the samples were left to cool inside the oven until they reached room temperature. The first method was conventional annealing, where the samples were placed on a tray (L × W × H; 300 mm × 210 mm × 40 mm) and placed in the oven at a specified temperature and then allowed to cool after the time had elapsed (this is referred to as direct oven annealing). The second method was fluidized bed annealing with sharp sand (referred to as sand annealing), and the parts were submerged in the sand bed to be uniformly annealed. The tray was filled with sand to a height of 30 mm, and the samples were placed midway deep in the sand. For this work, sharp sand, also known as coarse sand or grit sand, was used, which typically contains larger particles with angular edges. The angular shape of the particles in sharp sand allows for better contact between them, which promotes more efficient heat transfer. This method can provide excellent temperature control and allows for fast heat transfer. In the third method, the samples were sandwiched between two aluminum metal plates fitted with nuts and bolts (referred to as metal plate annealing). Each plate was 200 mm long, 50 mm wide and 10 mm thick, and weighed 400 g. The nuts were tightened with a torque wrench with a torque value of 30 Nm to avoid sideways movement of the samples. Although the three methods shared the oven as the heating mechanism, the medium (air, sand and metal plates) surrounding the ULTEM 9085 samples offered unique advantages in terms of heat transfer and temperature control, with the gradual cooling process playing a crucial role in minimizing residual stress and enhancing the mechanical properties. The three annealing methods are shown in Figure 2.

2.3. Measurements and Experimental Testing

All the measurements were taken before and after annealing to ascertain the impact of annealing on the samples. K-type thermocouples, with an operating range of −100 °C to 500 °C, were fixed to the surface of the samples with heat-resistant Kapton tape. They were connected to an OM-HL-EH-TC 3927 data logger (Omega, Norwalk, CT, USA) and the temperature distribution on the samples was recorded, starting from room temperature to annealing and finally coming back to room temperature after cooling.
The dimensions of the dog-bone tensile samples were measured using a digital Vernier caliper, and surface roughness analysis was undertaken using a Surftest SJ-210 (Mitutoyo, Andover, UK) contact-type surface profilometer [25] according to ISO 21920-2:2021 [26], as shown in Figure 3. Three measurements were taken on each sample with a measuring speed of 0.5 mm/s. To ensure a comprehensive analysis of the different annealing methods, the surfaces of the samples before and after annealing were also observed under a Hitachi TM3030 desktop scanning electron microscope. This can provide a visual representation of the surface morphology, supporting the surface roughness values. After surface analysis, the dog-bone samples were subjected to tensile testing on an INSTRON 3382 Universal Testing Machine with a speed of 1 mm/min as per BS EN ISO 527-2:2012 [22]. Scanning electron microscopy (SEM) was also employed to observe the fracture mechanism of the samples before and after annealing. The fractured surfaces were carefully cut to size to fit atop the SEM platform. No surface treatment was applied to avoid contamination of the fractured surfaces.
The square samples were subjected to indentation hardness as per BS EN ISO 868:2003 [23] using a Shore D durometer. The indentation was measured on five different points to obtain an average hardness value. The hardness test was followed by three-point flexural testing of the rectangular sample on an INSTRON 3382 Universal Testing Machine with a speed of 2 mm/min as per BS EN ISO 178:2019 [24]. Furthermore, five samples per test condition were used to ensure statistical reliability and account for material variability.

3. Results and Discussion

3.1. Dimensional Analysis

As annealing is intended to relieve internal stresses built up due to the layer-by-layer deposition of the FDM process, dimensional changes are common [16,27]. The changes can be observed along any of the three axes (X, Y and Z) through shrinkage or expansion. This is attributed to the way FFF-printed samples cool, where internal tensions, stresses and entrapped air bubbles become locked between the layers during the solidification process. These factors can negatively affect the structural integrity and overall performance of the printed part. The dimensions of the ULTEM 9085 samples were measured using a digital Vernier caliper, and their deviations are shown in Table 2. The dimensions are shown as delta percentages and are calculated using Equation (1) as follows:
L   % = L f i n a l L i n i t i a l L i n i t i a l × 100
where L f i n a l is the measured dimension after annealing, L i n i t i a l is the measured dimension prior to annealing and L is the dimensional change in various directions.
Table 2 clearly demonstrates that dimensional changes along the X and Y axes are less than 2%, while those along the Z-axis are below 4% across all three annealing methods. These results indicate a relatively stable dimensional response in the X and Y directions, with slightly greater variability observed in the Z-axis, likely due to the anisotropic behavior of the material during the thermal treatment. In terms of changes in length (X-axis), all the methods demonstrated shrinkage, with direct oven annealing showing increased values with rising temperature. At 180 °C and 190 °C, the highest values were observed at the longest annealing time interval of 3 h at 0.56% and 1.13%, respectively. At 200 °C, however, the highest values of 1.9% were observed at annealing time intervals of 1 and 2 h with a reduction to 1.46% at a 3 h interval. Reduced dimensional changes observed at high annealing times, compared with shorter intervals, occur due to the material reaching thermal equilibrium over extended periods. During annealing, the material gradually undergoes stress relief and molecular rearrangement. Initially, at shorter times, rapid changes in the dimensions may be seen as the internal stresses are alleviated. However, with prolonged annealing, the material’s internal structure stabilizes, reducing further dimensional changes. It is also important to note that with higher times, most of the residual stresses have already been relieved, and the rate of further structural changes slows down, leading to minimal additional shrinkage or expansion. Additionally, extended annealing times allow for a more uniform distribution of heat throughout the part, which helps avoid localized distortions and contributes to more consistent dimensional stability. Annealing with metal plates yielded the lowest shrinkage values at all temperatures, with the highest value being 0.43%. Sand annealing demonstrated similar behavior to direct oven annealing, with the highest value being observed for the 2 h time interval at 200 °C.
The changes in the width (Y-axis) were minimal for all methods at temperatures of 180 °C and 190 °C, with the highest expansion being 0.76% (3 h time interval at 190 °C). The highest shrinkage was observed to be 1.9% during the 3 h annealing period at 200 °C with sand annealing, while the most significant expansion, 1.3%, was recorded under the same conditions during metal plate annealing. It is also important to note that metal plate annealing showed expansion along the Y-axis, whereas the other two methods demonstrated shrinkage. The opposite was observed for thickness, and the effect increased with rising temperature. At 200 °C, direct oven annealing showed the highest expansion of 3.3% at a 1 h interval, whereas 3.7% shrinkage was observed at the 3 h interval with metal plate annealing. This is due to the added pressure of the 10 mm thick metal plates as the material is constrained in the Z-axis (vertical direction) due to the pressure from the plates. As a result, the heat-induced relaxation of internal stresses and the coalescence of polymer chains must express itself in other directions, typically leading to expansion along the X- or Y-axis (lateral directions) as the material reaches thermal equilibrium [28]. This suggests that different annealing methods result in distinct thermal behaviors, affecting the dimensional stability of the printed parts. Among the three methods, sand annealing demonstrated the least dimensional changes due to the sand physically supporting the ULTEM 9085 samples, helping to maintain their shape and preventing warping or deformation during heating and insulating the parts during the cooling phase, further reducing the risk of thermal shock and ensuring a gradual decrease in temperature.
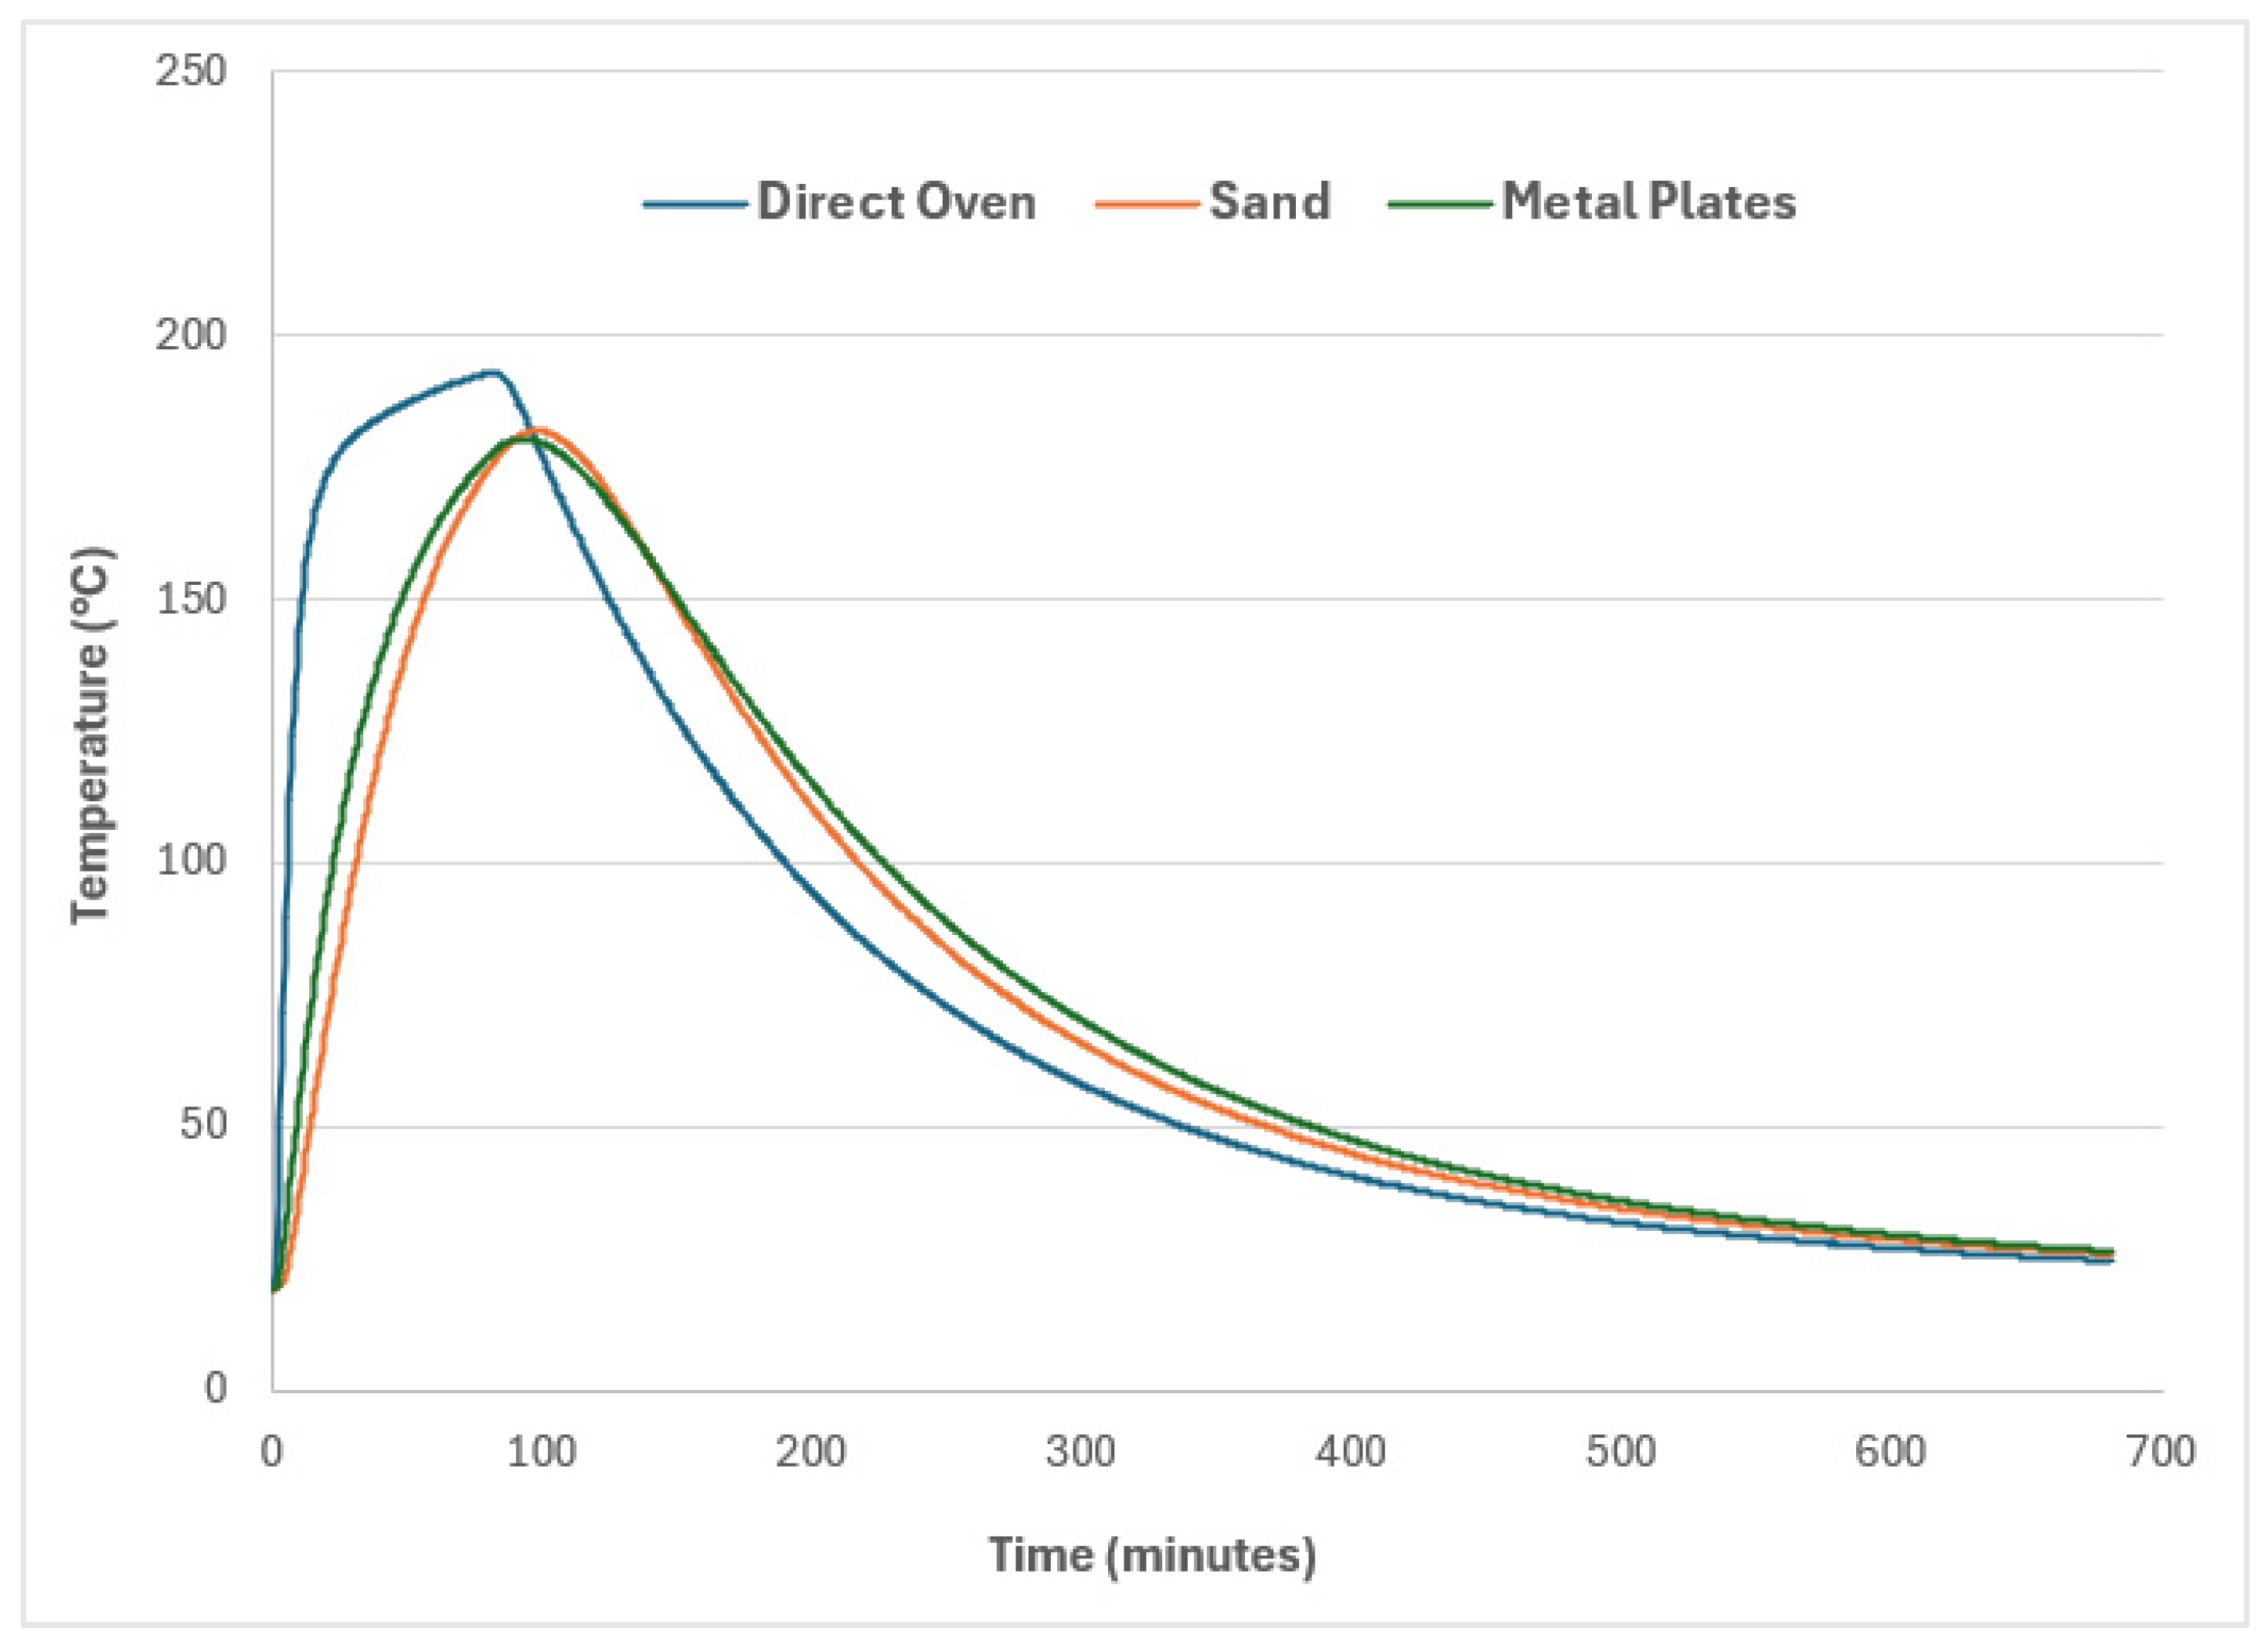
It is evident that the three different annealing methods led to varying results, which can be further analyzed via the temperature distribution as measured by the K-type thermocouples. Figure 4 displays the temperature versus time measurements for ULTEM 9085 samples annealed for one hour at 200 °C using the three different annealing methods, followed by cooling to room temperature. The direct oven annealing curve shows a rapid rise to the target temperature, followed by stable maintenance, reflecting consistent heating and cooling due to uniform exposure. The sand annealing method demonstrates a slower, more gradual temperature increase and decrease, likely due to sand’s insulating properties, which reduce thermal conductivity and lead to a less abrupt thermal profile. The metal plate method exhibits an intermediate heating profile, where the metal contact stabilizes the heating rate, though not as uniformly as direct oven exposure. The heating and cooling rates vary with each method, which can impact the dimensional stability and material properties. Oven annealing offers the most rapid temperature rise and fall, while sand annealing provides a more controlled thermal transition, which clearly benefits the dimensional stability of ULTEM 9085 samples, as evidenced in Table 2.

3.2. Surface Roughness Analaysis

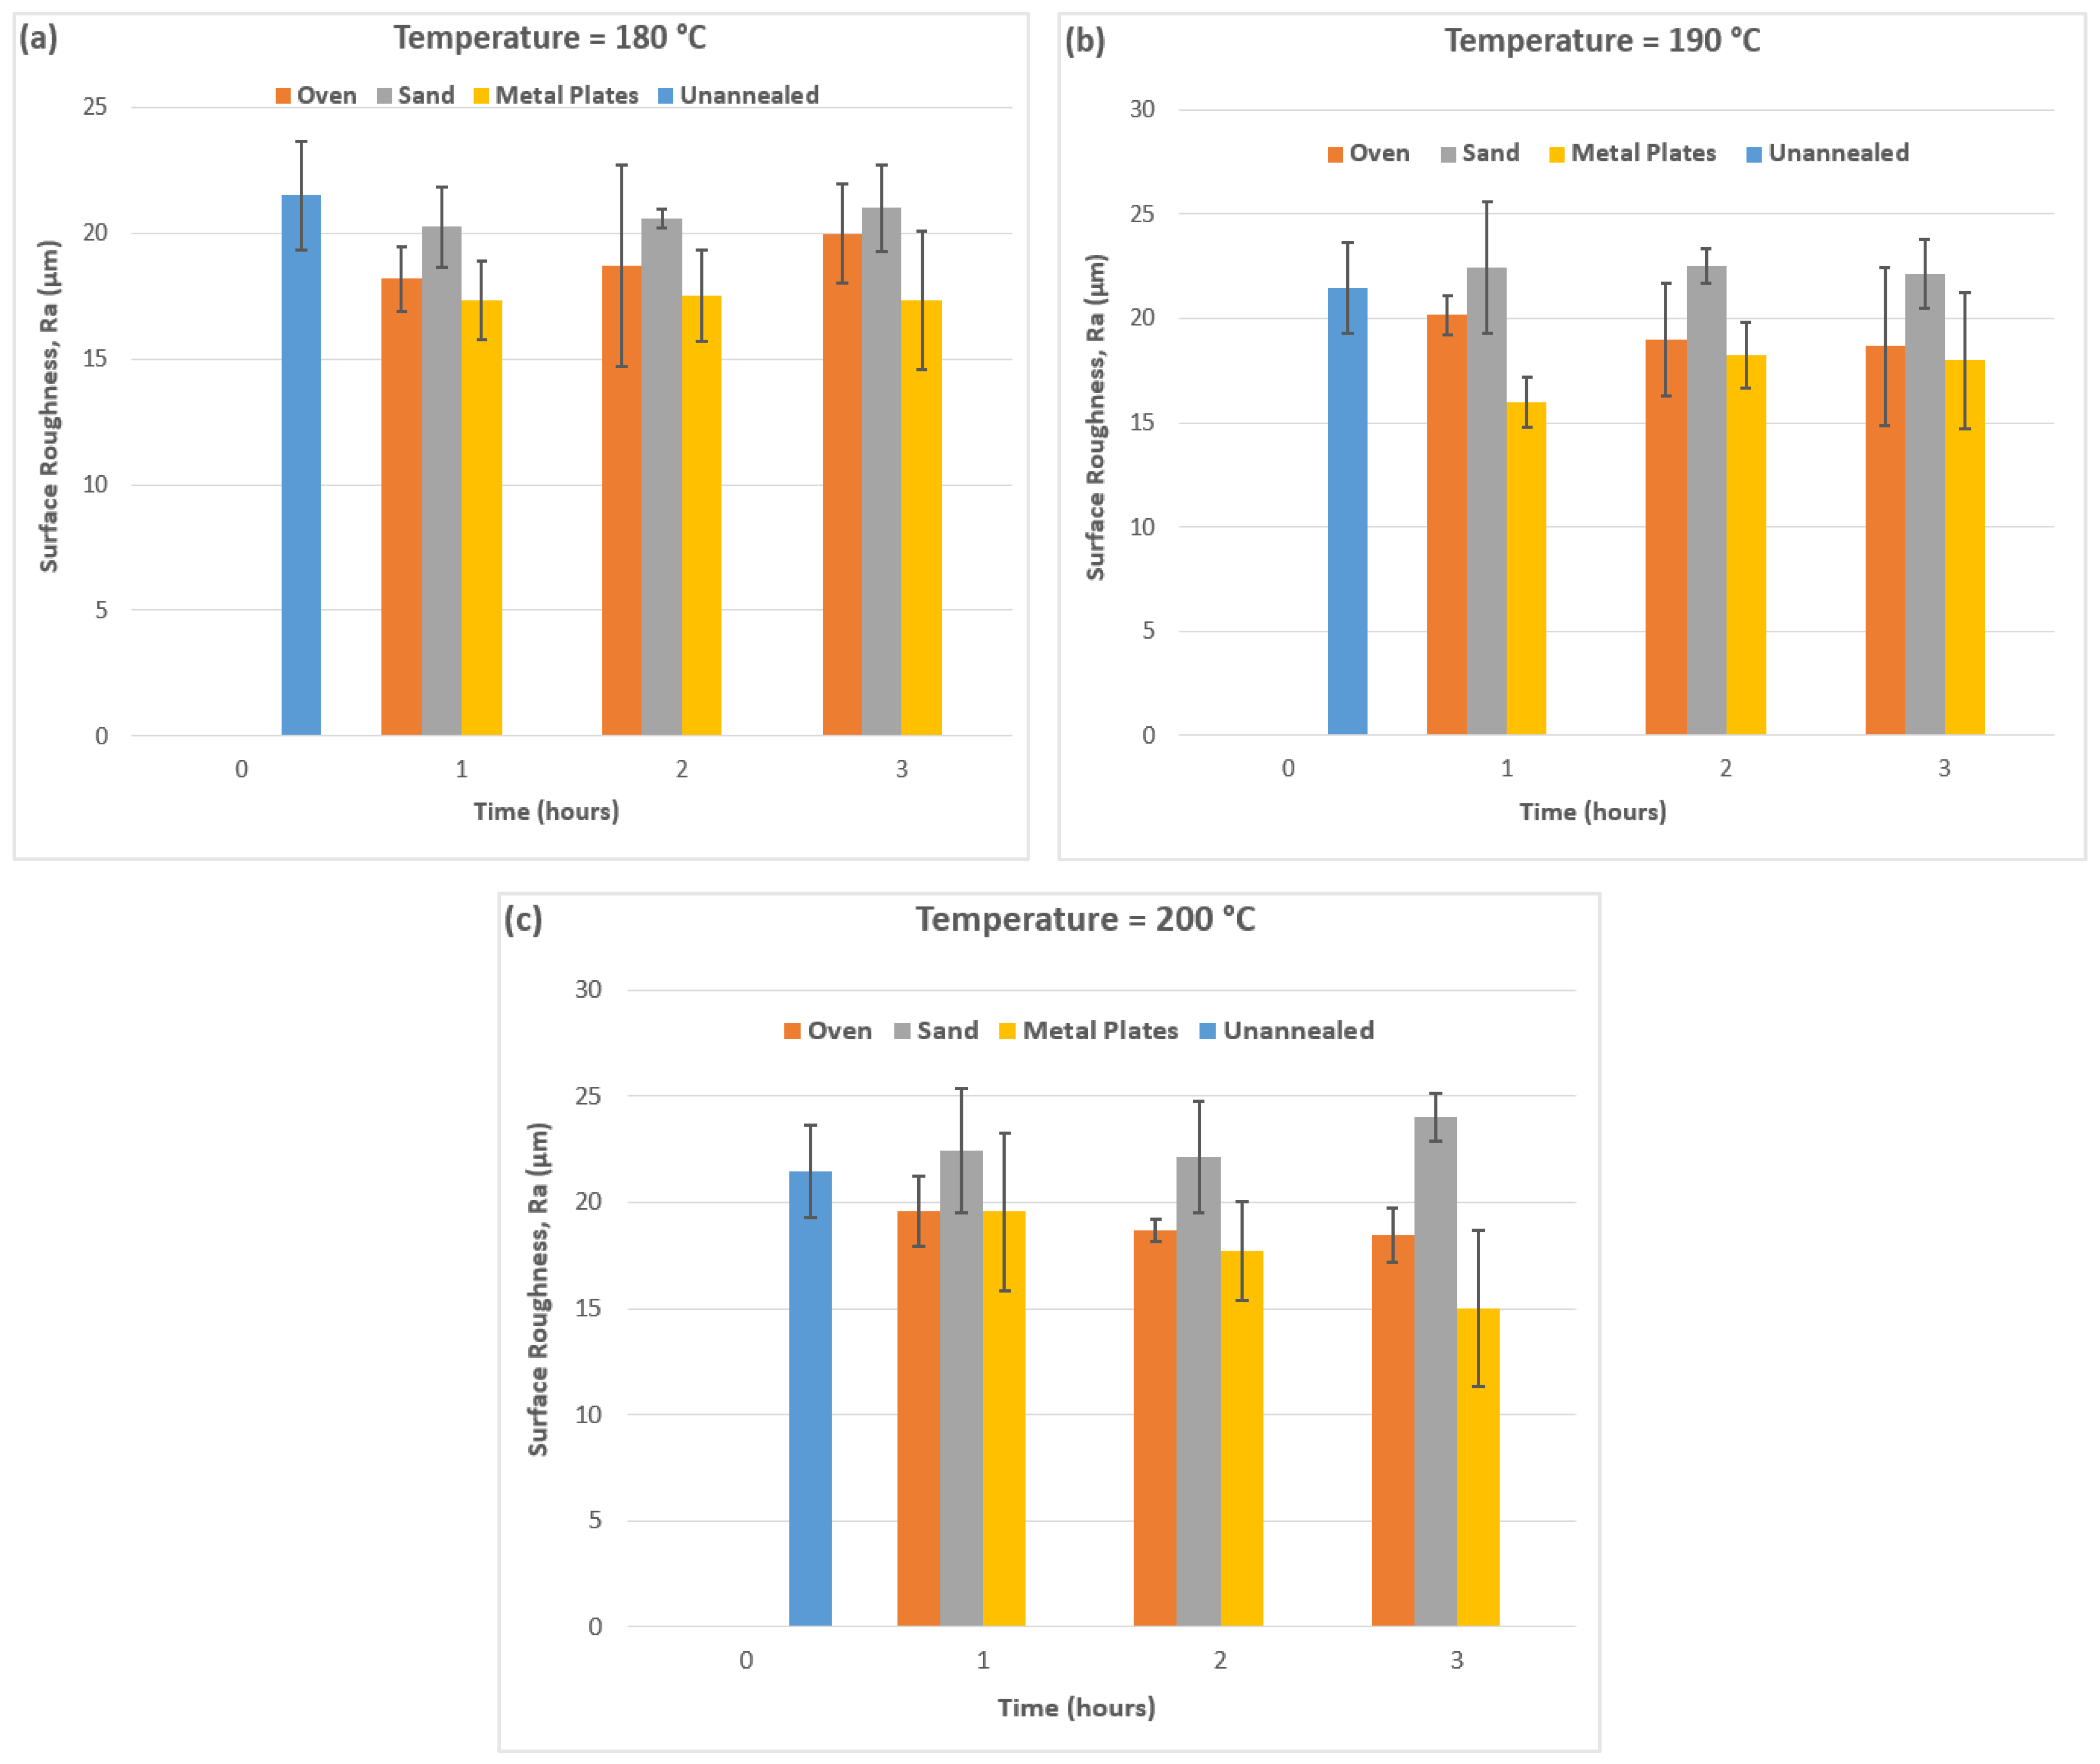
ULTEM 9085 samples were submerged in sand, sandwiched between metal plates and placed in a tray to be annealed inside an oven. In each scenario, the surfaces of the samples were in contact with different media that can affect the surface finish. Additionally, the layer-by-layer nature of the FDM process introduces distinct layer lines, which exacerbate the challenges associated with achieving a smooth surface finish [11,29,30]. Therefore, this test was performed to assess the impact of varying annealing conditions and contact media on the surface roughness of ULTEM 9085 samples. For this purpose, a Surftest SJ-210 contact-type surface profilometer was used, and all the samples were measured with the traverse direction being diagonally across the building direction at an angle of 45°. The average surface roughness (Ra) values measured along the length of the samples are shown in Figure 5.
It is evident from Figure 5a that the surface roughness of the samples improved with direct oven annealing at 180 °C with an increase in the annealing time interval as the lowest value of 18.1 μm was observed at the 1 h time interval. The values did not change significantly for sand with an increase in annealing times. However, the most consistent and lowest surface roughness values were observed for the metal plates at around 17 μm compared with 21.4 μm for unannealed ULTEM 9085 samples. This can be attributed to the uniform pressure applied by the plates, which helped flatten any surface irregularities and imperfections caused by the layer-by-layer deposition process of FDM. The metal plates ensure even heat distribution across the surface and promote uniform thermal expansion. The combination of controlled heat and pressure encourages the layers to fuse more cohesively, reducing the visibility of layer lines and improving the overall surface smoothness. At 190 °C (Figure 5b), the same phenomenon was observed but with higher values for sand annealing at around 22 μm. The lowest values were observed for metal plates, namely 15.9 μm at a 1 h interval. As per Figure 5c, oven annealing demonstrated improvements in the surface finish at higher annealing time intervals, with the lowest value being 18.4 μm. Sand-annealed samples continued to show a poor surface finish, with values as high as 24 μm. This is due to the uneven contact between the samples and the granular sand particles. Additionally, any movement or shifting of the part in the sand during the annealing process (shrinkage or expansion; Section 3.1) could further exacerbate surface imperfections. As was the case at 180 °C and 190 °C, metal plates showed the lowest surface roughness value, as 14.9 μm at the 3 h time interval. These results clearly indicate that metal plates are better suited to ensuring a better surface finish due to the added pressure and controlled heat while annealing, and sand annealing leads to a poor surface finish due to abrasion by the sand particles causing surface irregularities. Direct oven annealing, while yielding more consistent results compared with unannealed samples [11,19], falls short in performance when compared with the metal plate annealing method. This is primarily due to the lack of applied external pressure during direct oven annealing, which limits the reduction of surface irregularities.
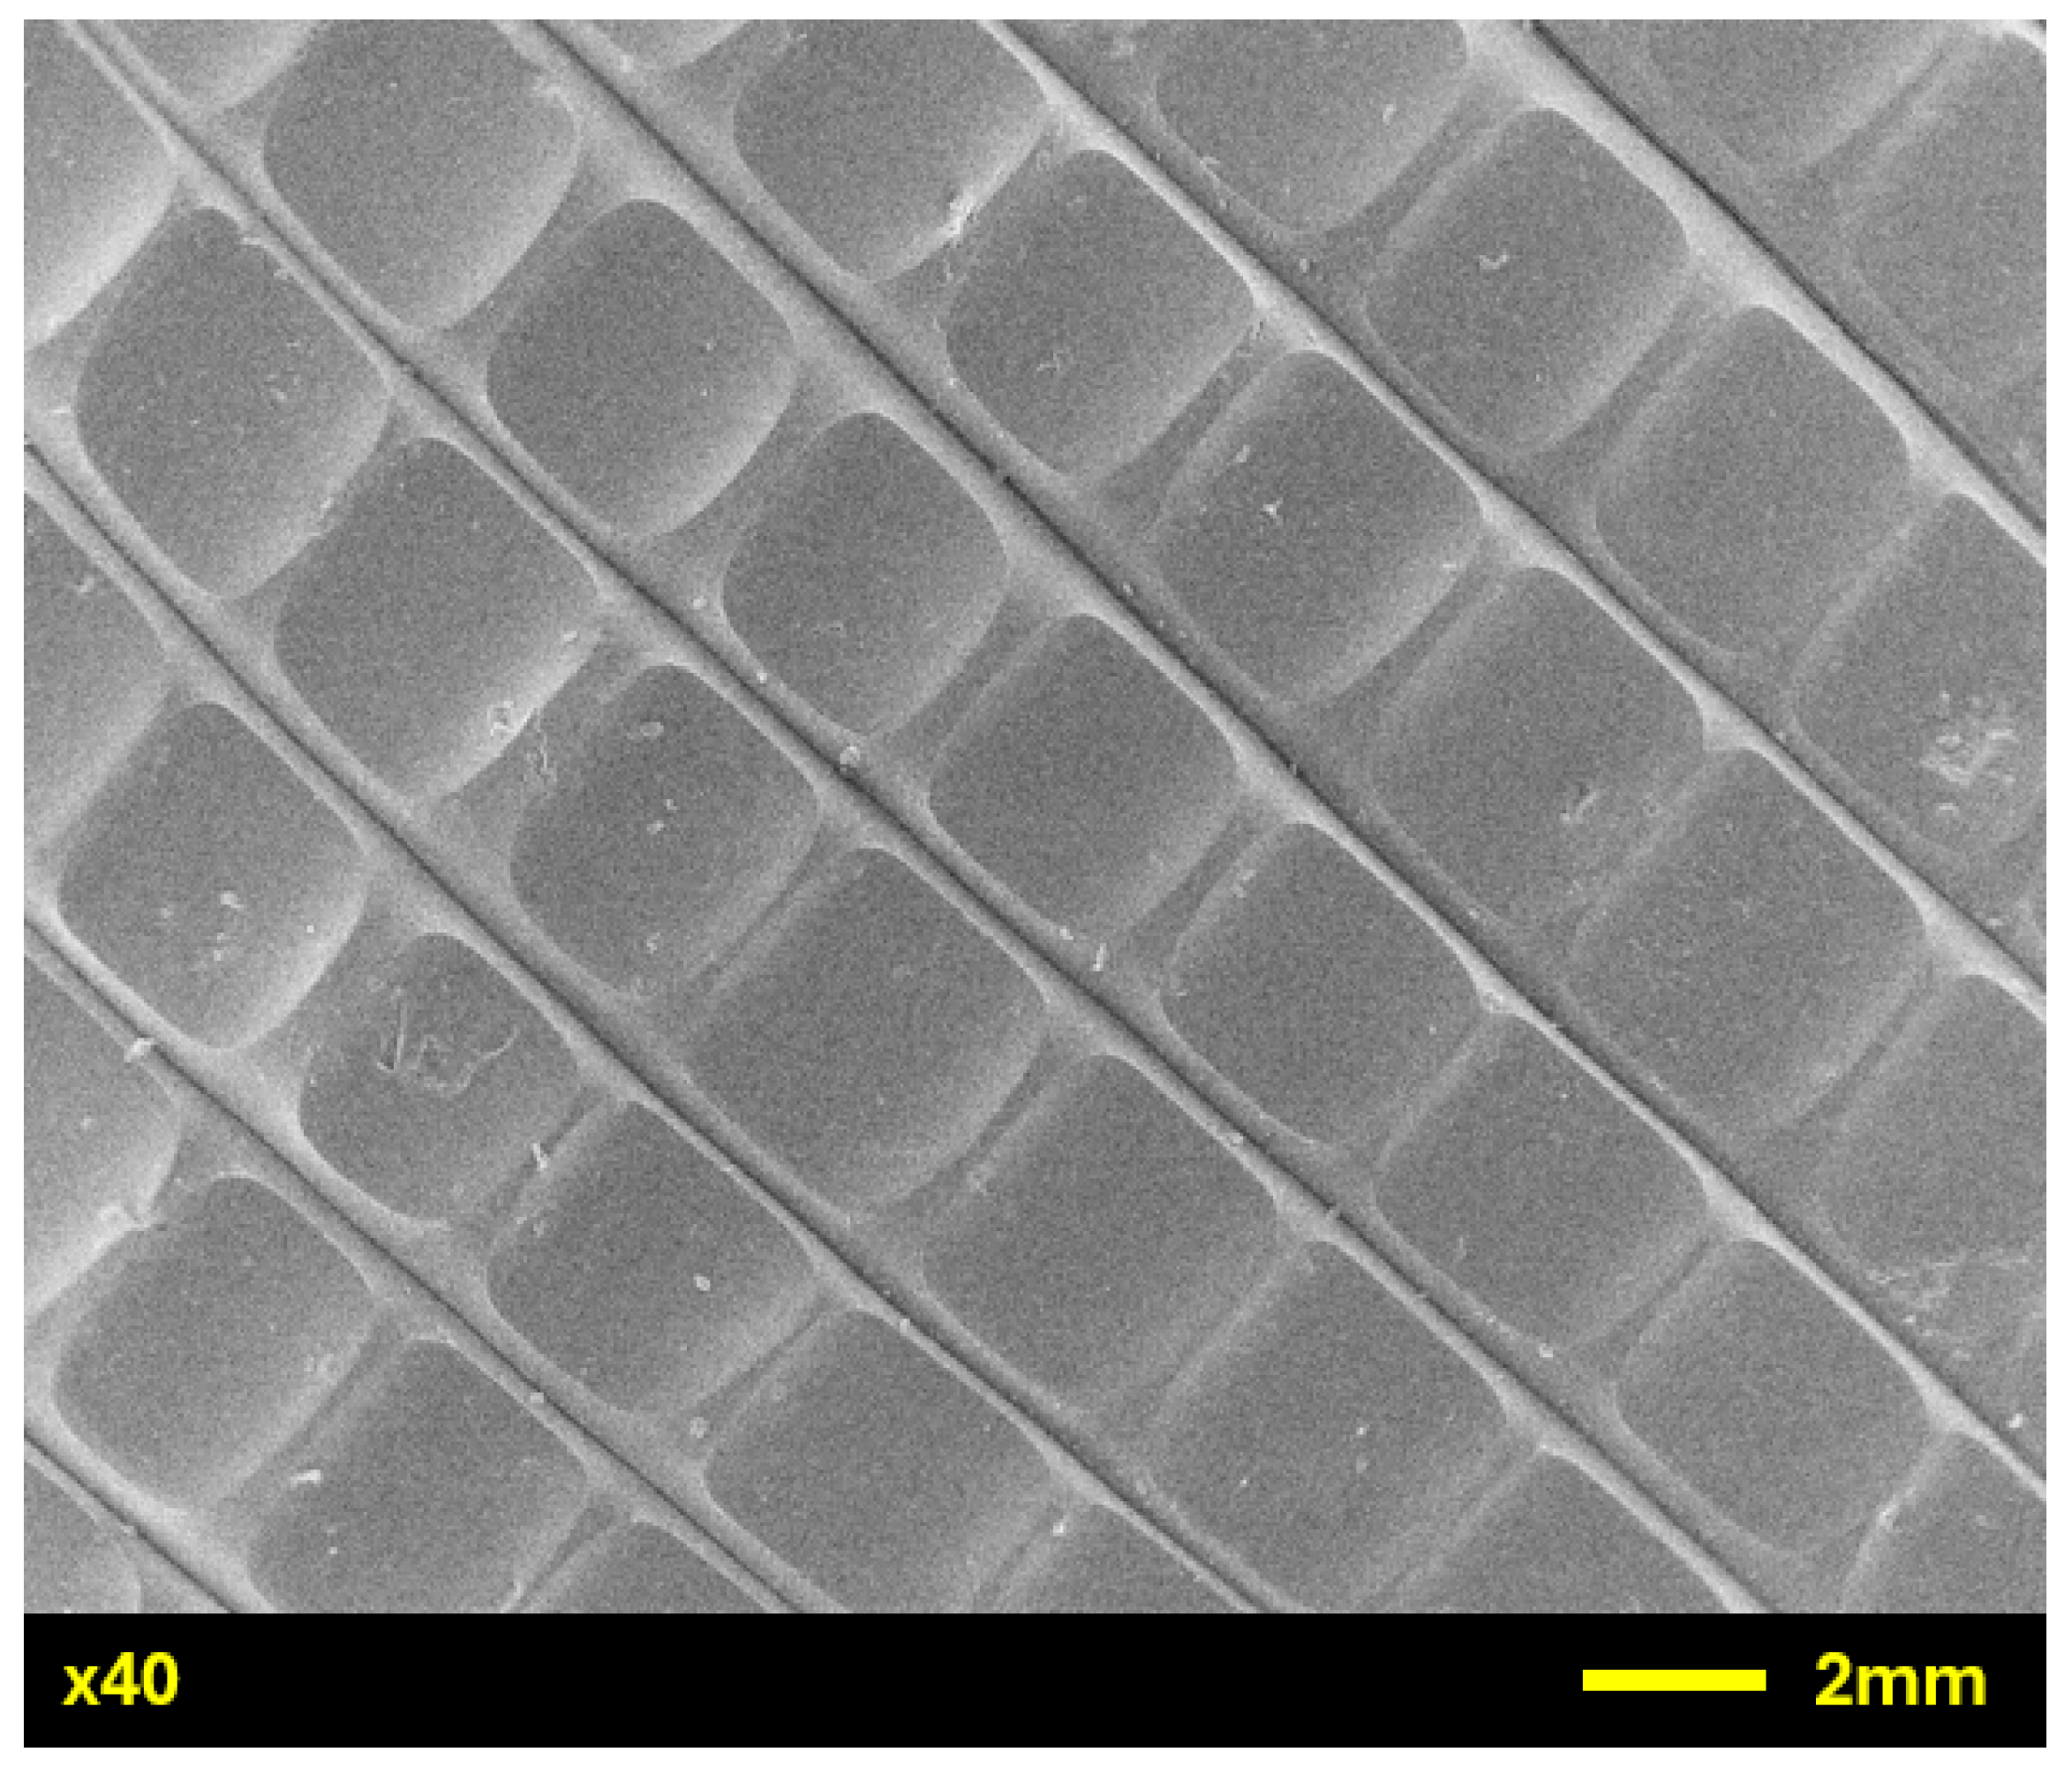
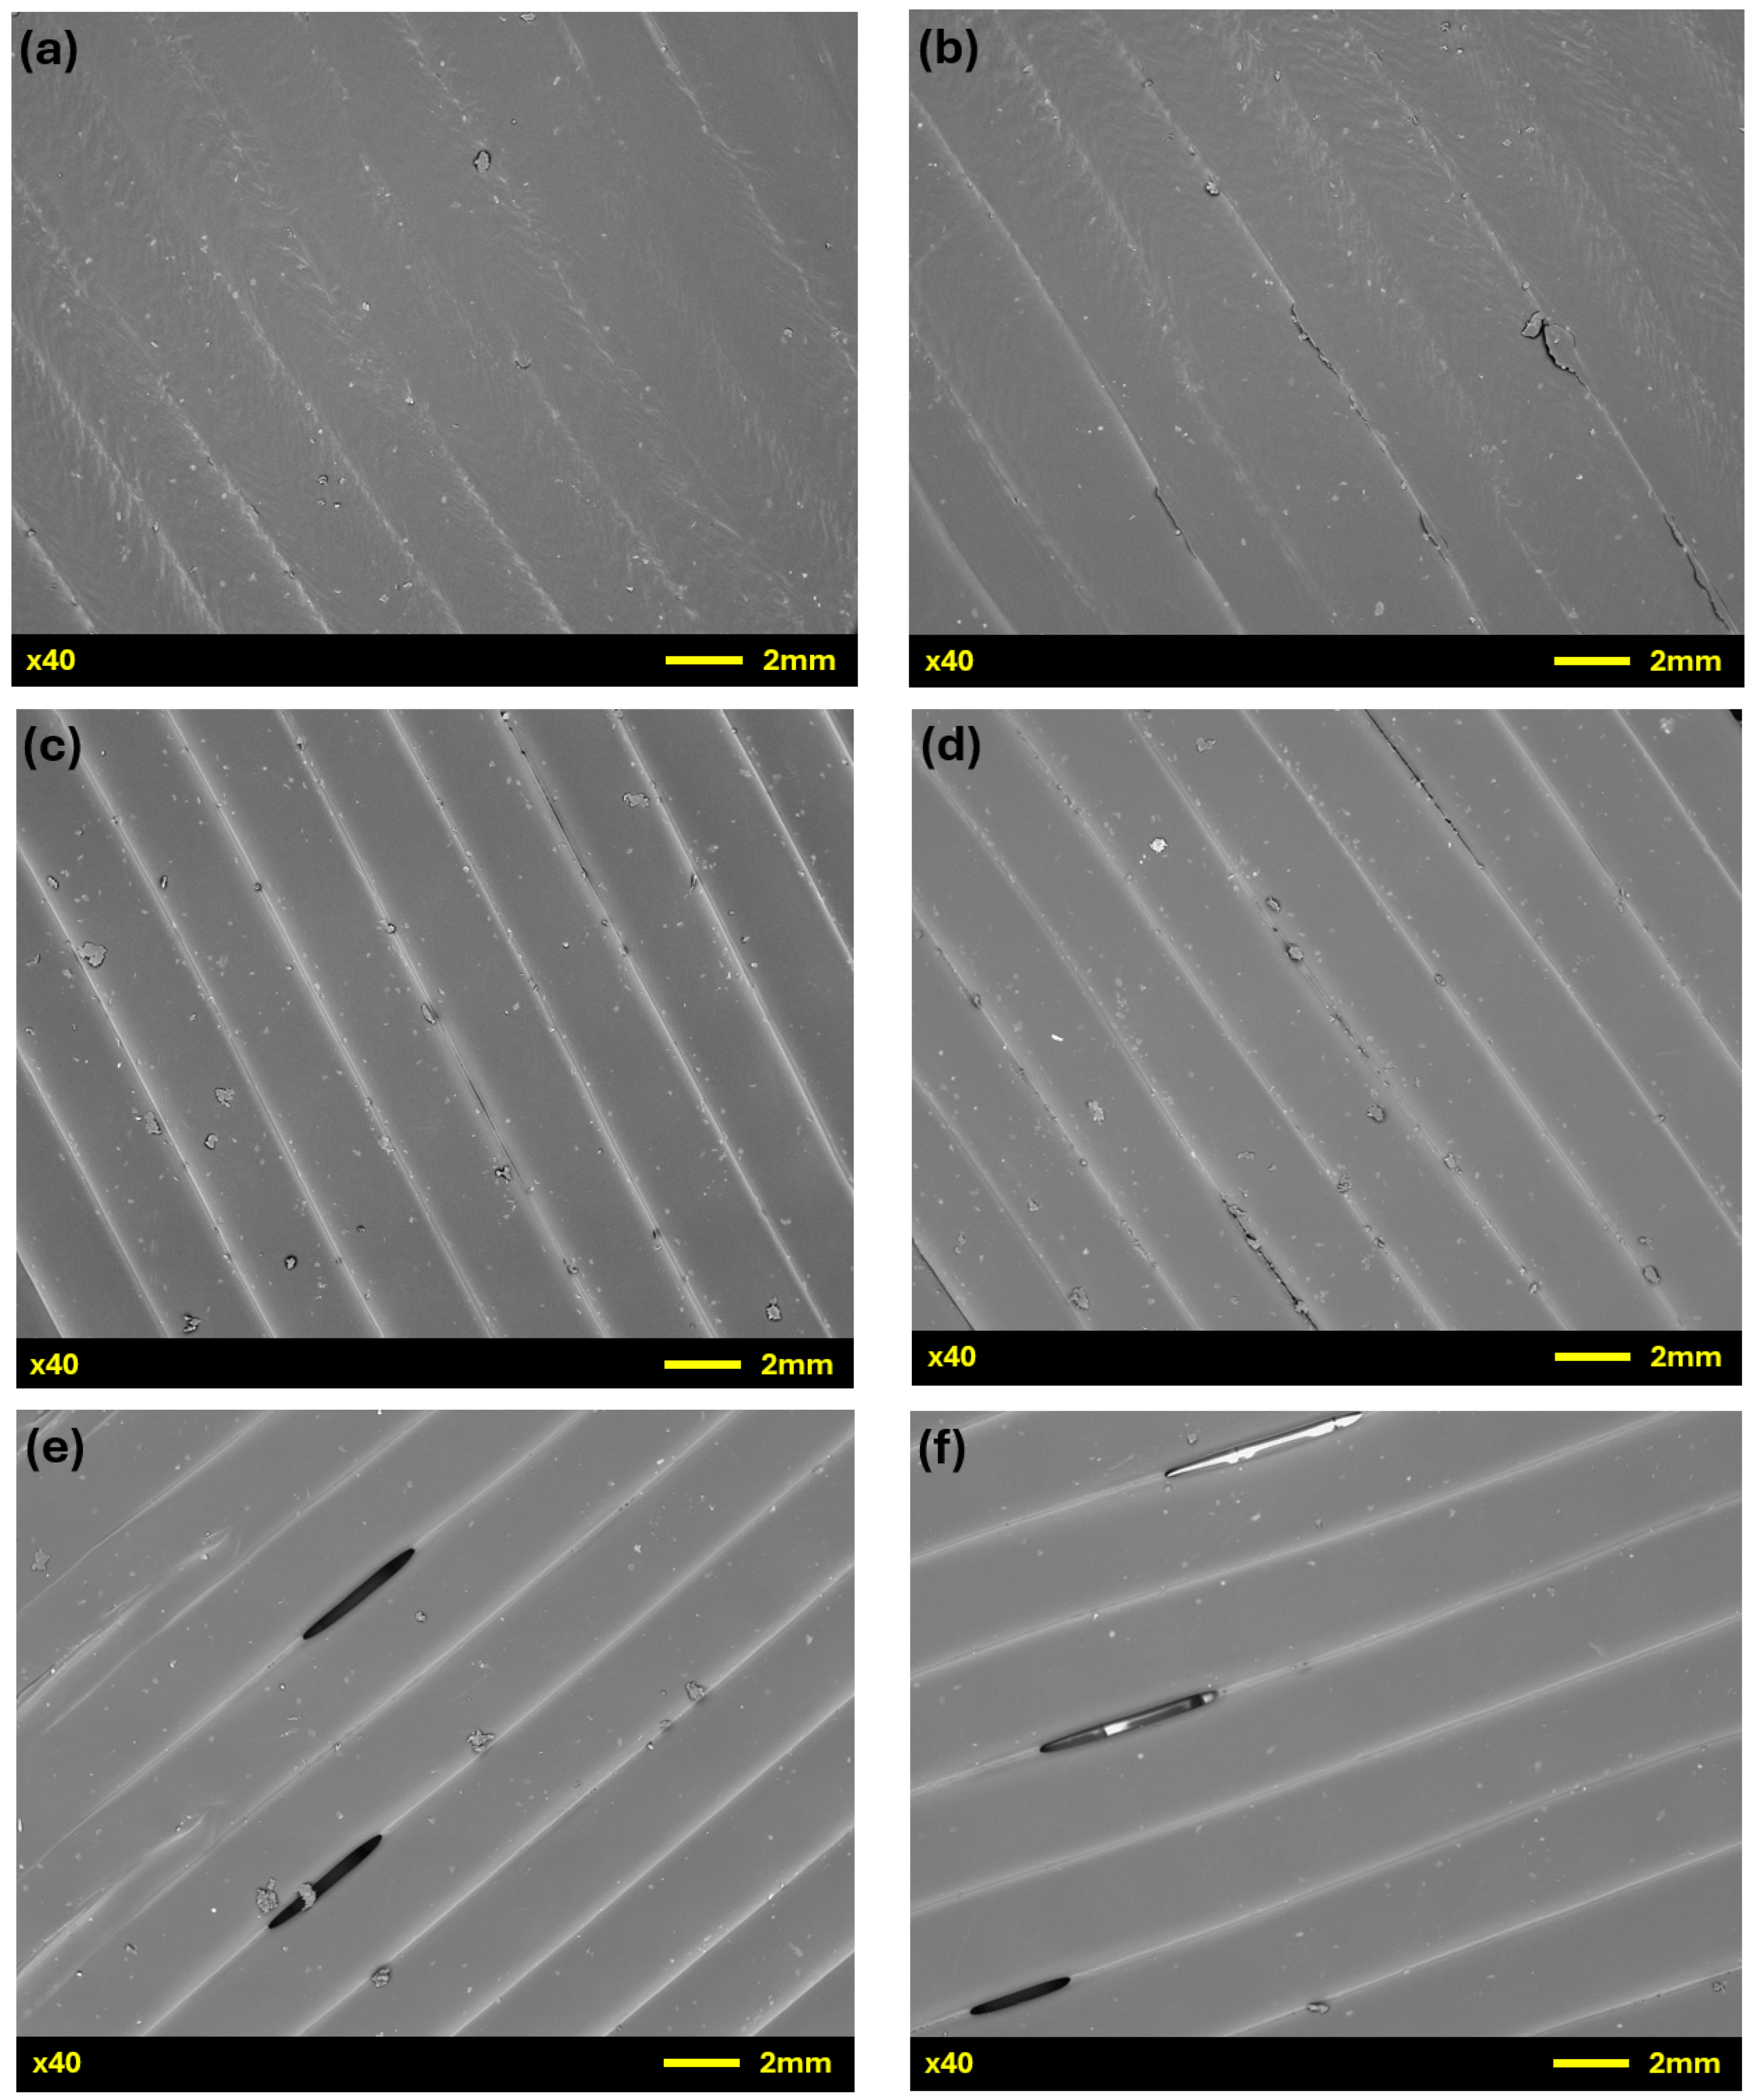
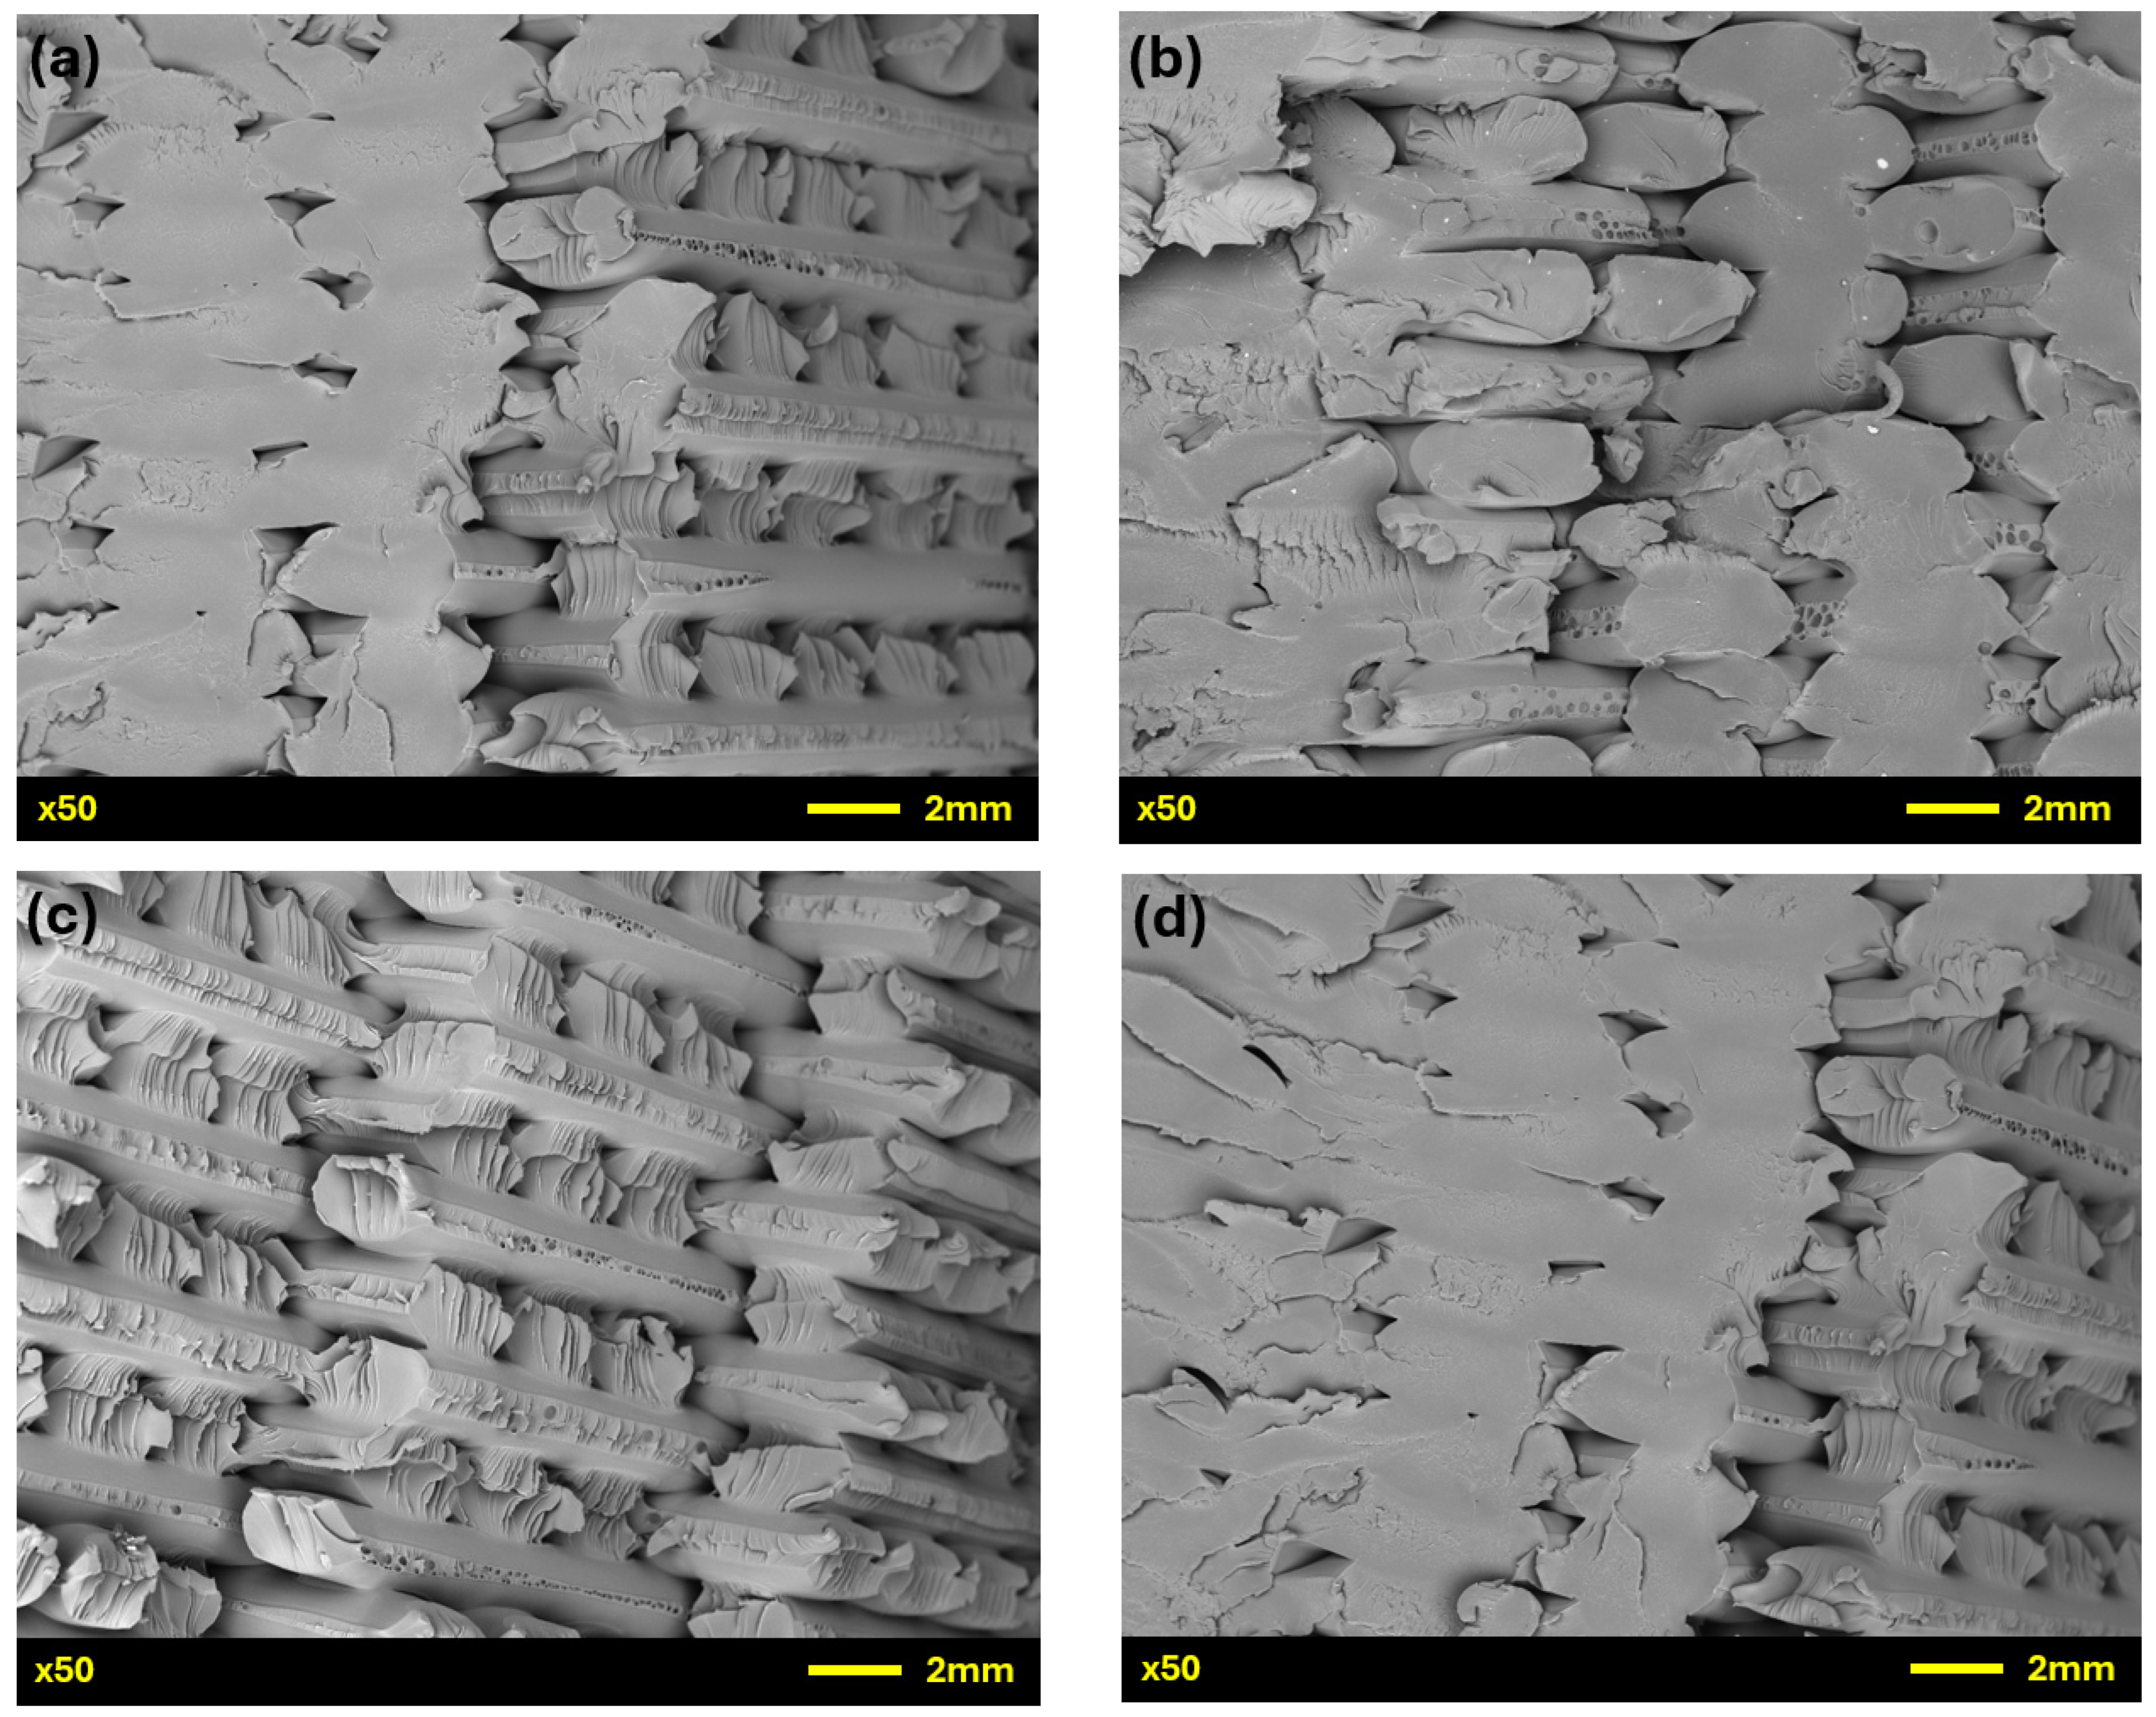
In examining the surface roughness, profilometer data give precise numerical values that quantify the effect of each annealing method on the surface quality at different temperatures and time intervals. The profilometer measurements revealed that the lowest surface roughness values were observed with metal plate annealing, whereas sand annealing produced rougher textures, possibly due to abrasive particle contact. Microstructural analysis via SEM complements these data by highlighting the morphological changes responsible for these variations. It is evident from Figure 6 that unannealed ULTEM 9085 shows visible layer lines and surface irregularities, primarily due to incomplete layer fusion and micro-gaps between deposited layers, indicating areas where the material did not fully fuse. These characteristics contribute to a higher surface roughness (21.4 μm), that correspond to the SEM-observed morphology. On the other hand, annealing reduced these irregularities through thermal relaxation and polymer chain realignment, creating smoother surfaces that are visible in Figure 7 for the three annealing methods (the best and worst micrographs for each method). The SEM micrograph with the lowest value (14.9 μm) for metal plate annealing (Figure 7a) shows a relatively uniform surface with minor scratches or grooves, suggesting a smoother finish. This indicates a well-annealed sample, where thermal treatment has allowed the material to relax, reducing surface irregularities and achieving a low surface roughness value. Figure 7b shows more pronounced surface defects, with a value (19.5 μm) closer to the unannealed sample (21.4 μm). This could be due to incomplete annealing, residual stresses or more substantial material deformation during preparation.
The difference between the highest (20.1 μm) and lowest (18.1 μm) surface roughness values for direct oven annealing is not significant, as evident from the micrographs in Figure 7c,d. With minimal visible pits and scratches along the layer lines, direct oven annealing demonstrates a better surface finish compared with unannealed ULTEM 9085 samples. However, the surface in this method is still not as uniform as that of samples annealed between metal plates, likely due to the absence of any constraining surface during the annealing process. The slight exposure to airflow may introduce subtle inconsistencies in heat distribution across the sample, resulting in minor surface roughness variations. Figure 7e,f show the SEM micrographs with the lowest and highest surface roughness values, respectively. They reveal a much rougher surface texture compared with the other methods, with visible irregularities, unfused layers and embedded particles. Sand is a less effective medium for uniform heat transfer and can cause localized temperature differences, contributing to uneven surface softening. Additionally, fine sand particles may adhere to or indent the material’s surface during annealing, further degrading the surface quality. The lack of uniform support and the abrasive nature of sand make it the least effective method for achieving smooth surface finishes.

3.3. Tensile Testing

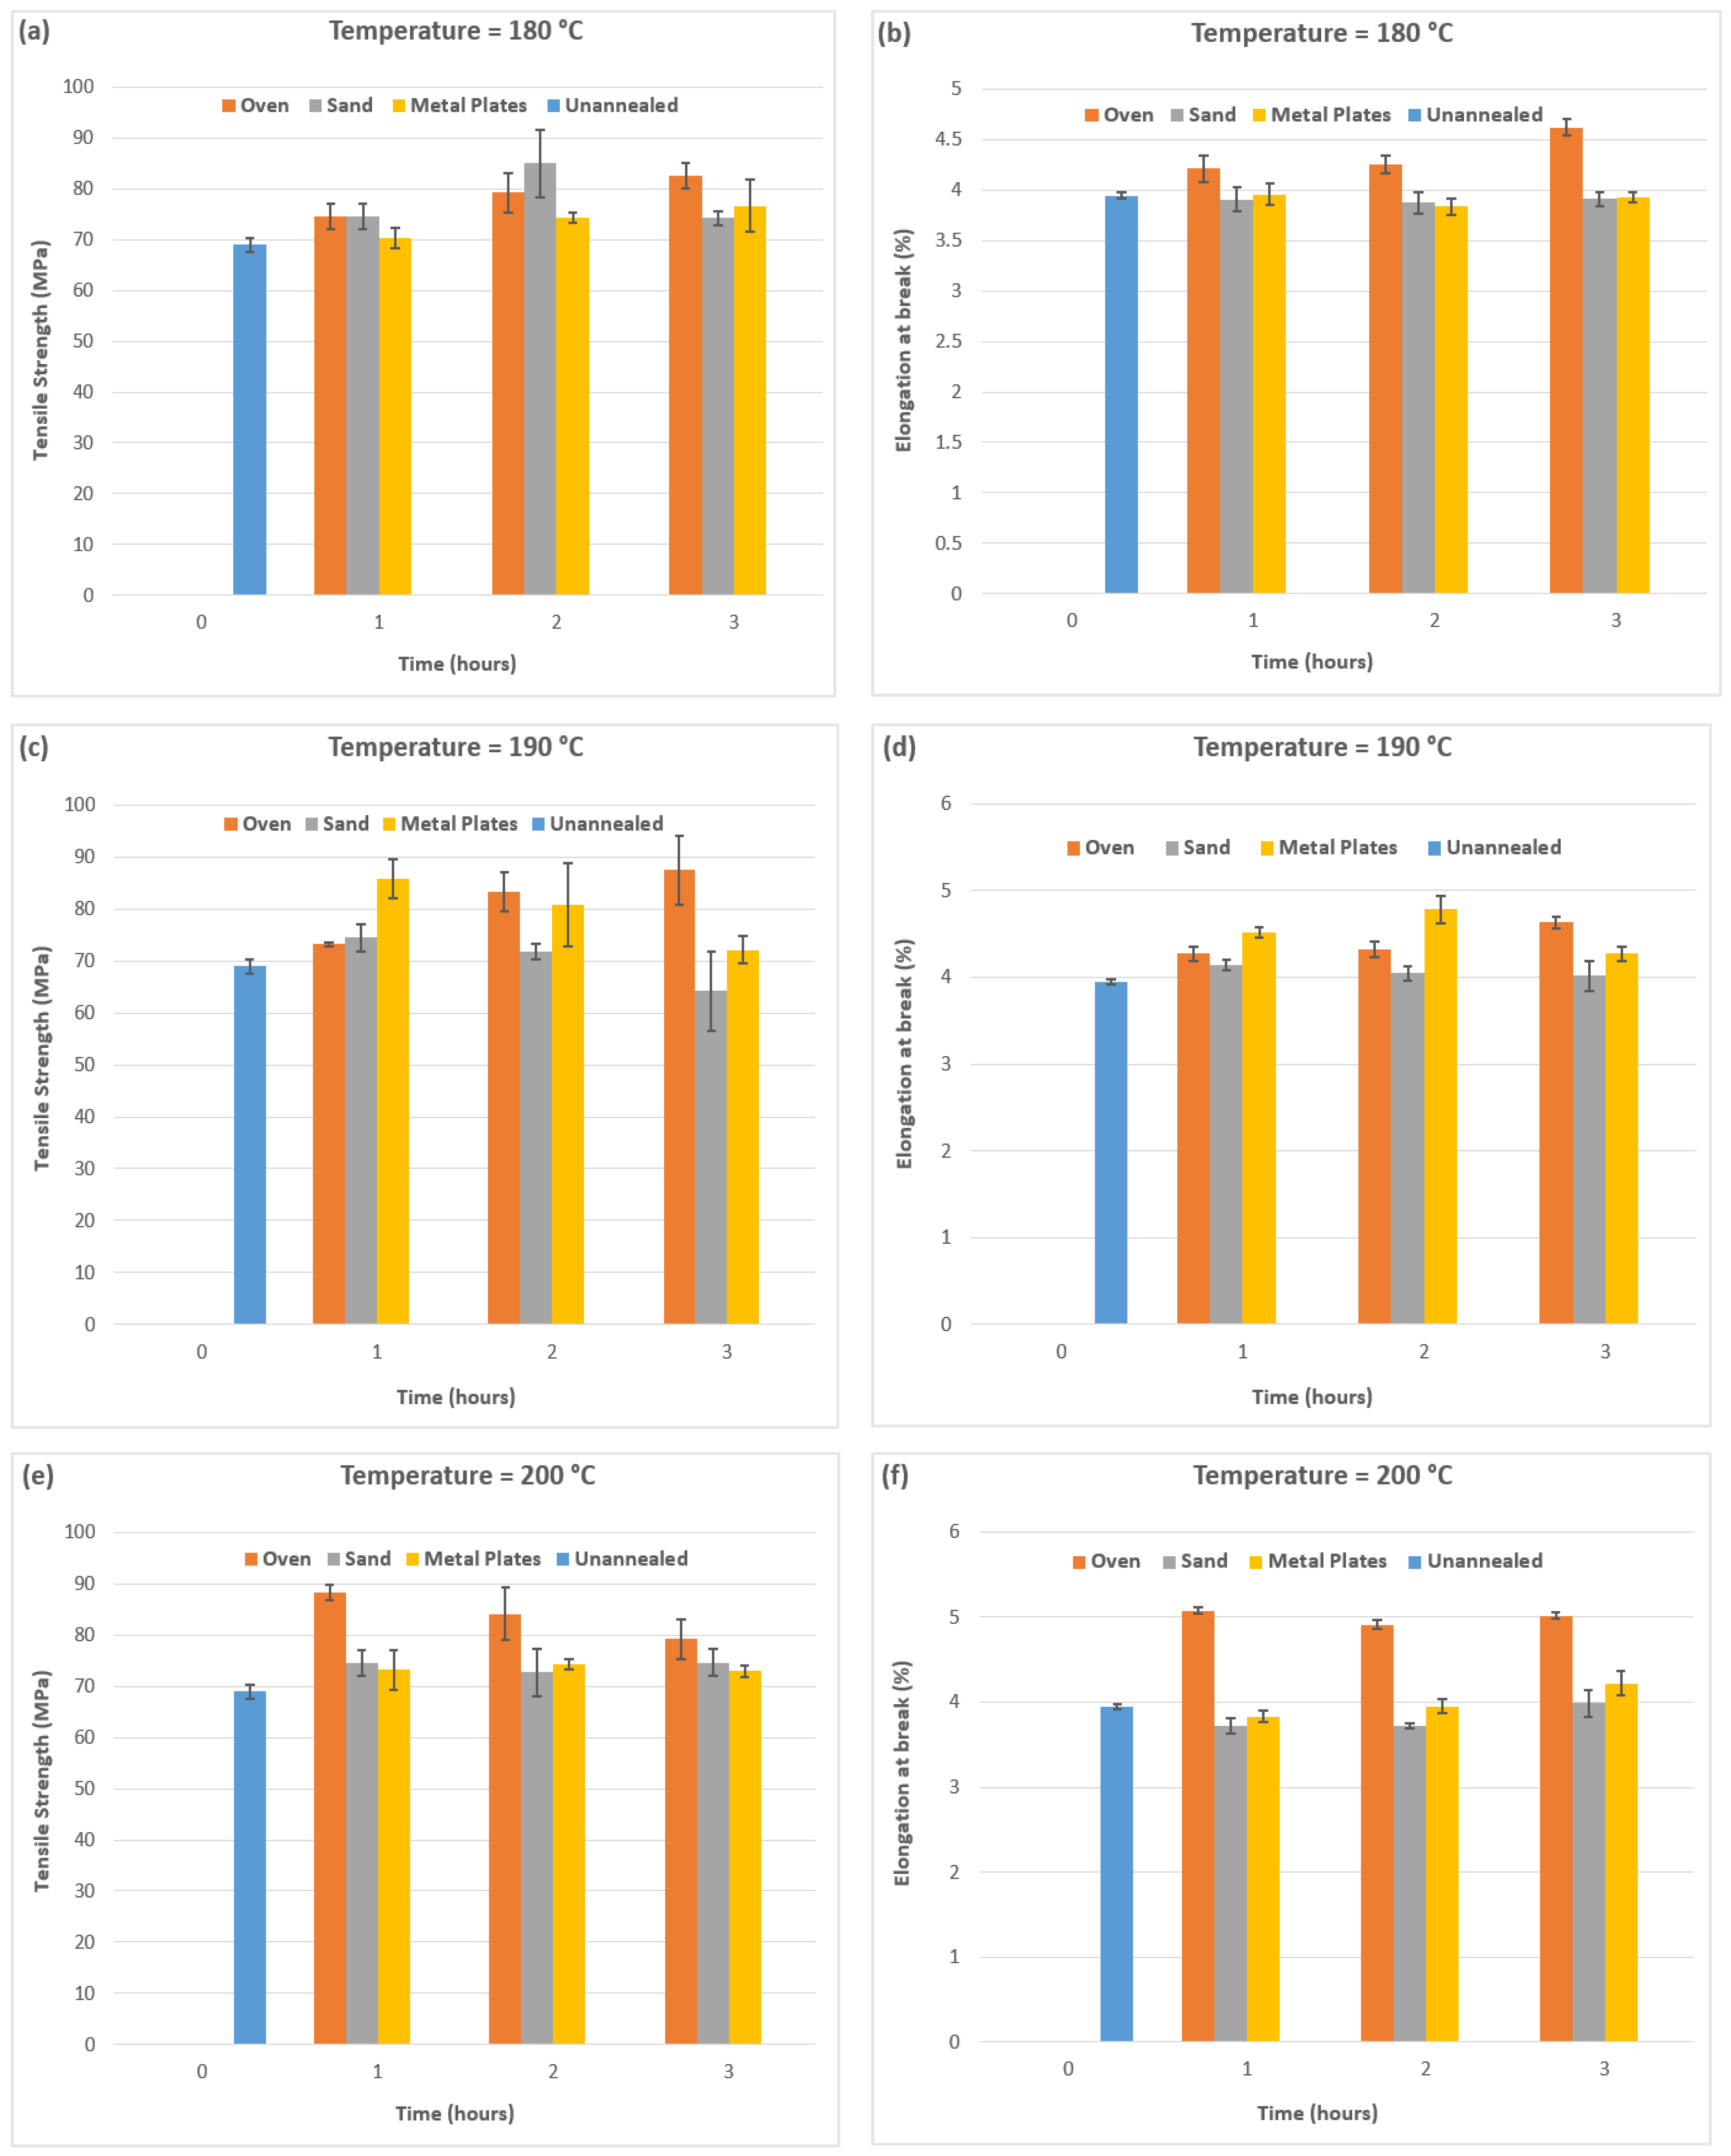
The last series of tests to be performed on the ULTEM 9085 dog-bone samples were tensile tests, and the results are shown in Figure 8. Annealing has been shown to improve the tensile properties of thermoplastics [15,16], and this work compared three different methods to ascertain the impact on the mechanical performance of ULTEM 9085 samples. All methods demonstrated higher values compared with unannealed ULTEM 9085 samples, highlighting the positive effects of annealing. Figure 8a showed a gradual increase in tensile strength with increased annealing time intervals for both direct oven annealing and metal plate annealing. The highest values were observed at the 3 h time interval and showed an increase of 19.7% for direct oven annealing and 11% for metal plates, compared with unannealed ULTEM 9085 samples. However, sand annealing showed the highest increase of 14.8% at the 2 h interval, showing more consistent heat transfer and stress relief compared with other methods at 180 °C. However, the increase in tensile strength from sand annealing did not lead to an increase in the ductility of the samples, as this was observed only with direct oven annealing (Figure 8b).
At 190 °C (Figure 8c), both sand annealing and metal plate annealing showed a decrease in tensile strength with increased time intervals. Metal plate annealing showed the highest value at a 1 h interval, with an increase of 24.5% in tensile strength, whereas the sand annealing samples showed values comparable with unannealed samples. This indicates that increased annealing time intervals negatively affected the sand annealing and metal plate annealing results due to excessive heat transfer at longer intervals, causing degradation of the properties. Direct oven annealing, however, yielded the highest increase of 26.9% at the 3 h interval. As can be seen from Figure 8d, slightly higher elongation at break values were observed at 190 °C, especially at the 2 h time interval for metal plates. However, direct oven annealing showed a gradual increase with the time intervals, indicating a significant effect compared with sand and metal plate annealing.
Figure 8e showed the highest tensile strength at the 1 h interval for direct oven annealing (28.1%) before decreasing gradually to 14.8% at the 3 h interval, compared with the unannealed samples. The other two methods showed slightly higher values, but higher temperatures did not aid in further enhancement of the mechanical strength. Similarly, the elongation at break values also increased and continued to stay consistent for direct oven annealing at all time intervals (Figure 8f). The reason for direct oven annealing leading to enhanced elongation at break for ULTEM 9085 samples compared with sand and metal plate annealing could lie in the heat distribution differences and the stability of the thermal environment. In direct oven annealing, heat is applied evenly and rapidly (Figure 4), allowing the polymer chains in ULTEM 9085 to reach temperatures near their glass transition point quickly. This rapid heating boosts chain mobility, encouraging faster stress relaxation and enhancing ductility. The uniform temperature distribution also minimizes thermal gradients, which can prevent premature failure during tensile testing by promoting even stress relief across the structure. In contrast, sand and metal plate annealing deliver heat gradually and may introduce thermal inconsistencies due to their contact-based nature. These inconsistencies can result in uneven stress relaxation and localized points of weakness, thereby limiting elongation at break. The gradual heating and cooling in the sand and metal plate methods may improve the surface finish (Section 3.2) and dimensional stability (Section 3.1), but they restrict the mobility of the polymer chains, leading to lower elongation compared with direct oven annealing. According to these results, direct oven annealing is clearly the optimal method for enhancing the tensile strength of ULTEM 9085 samples at different annealing temperatures and time intervals, with sand and metal plates showing good results at lower temperatures.
These results are consistent with the work of Zhang and Moon [17], as they used annealing temperatures of 170 °C and 180 °C for significantly longer time intervals of 24 and 96 h. They made use of specialized support structures during annealing and observed enhanced ductility and significant improvements in tensile strength for ULTEM 9085 parts printed in the flat orientation (XY).
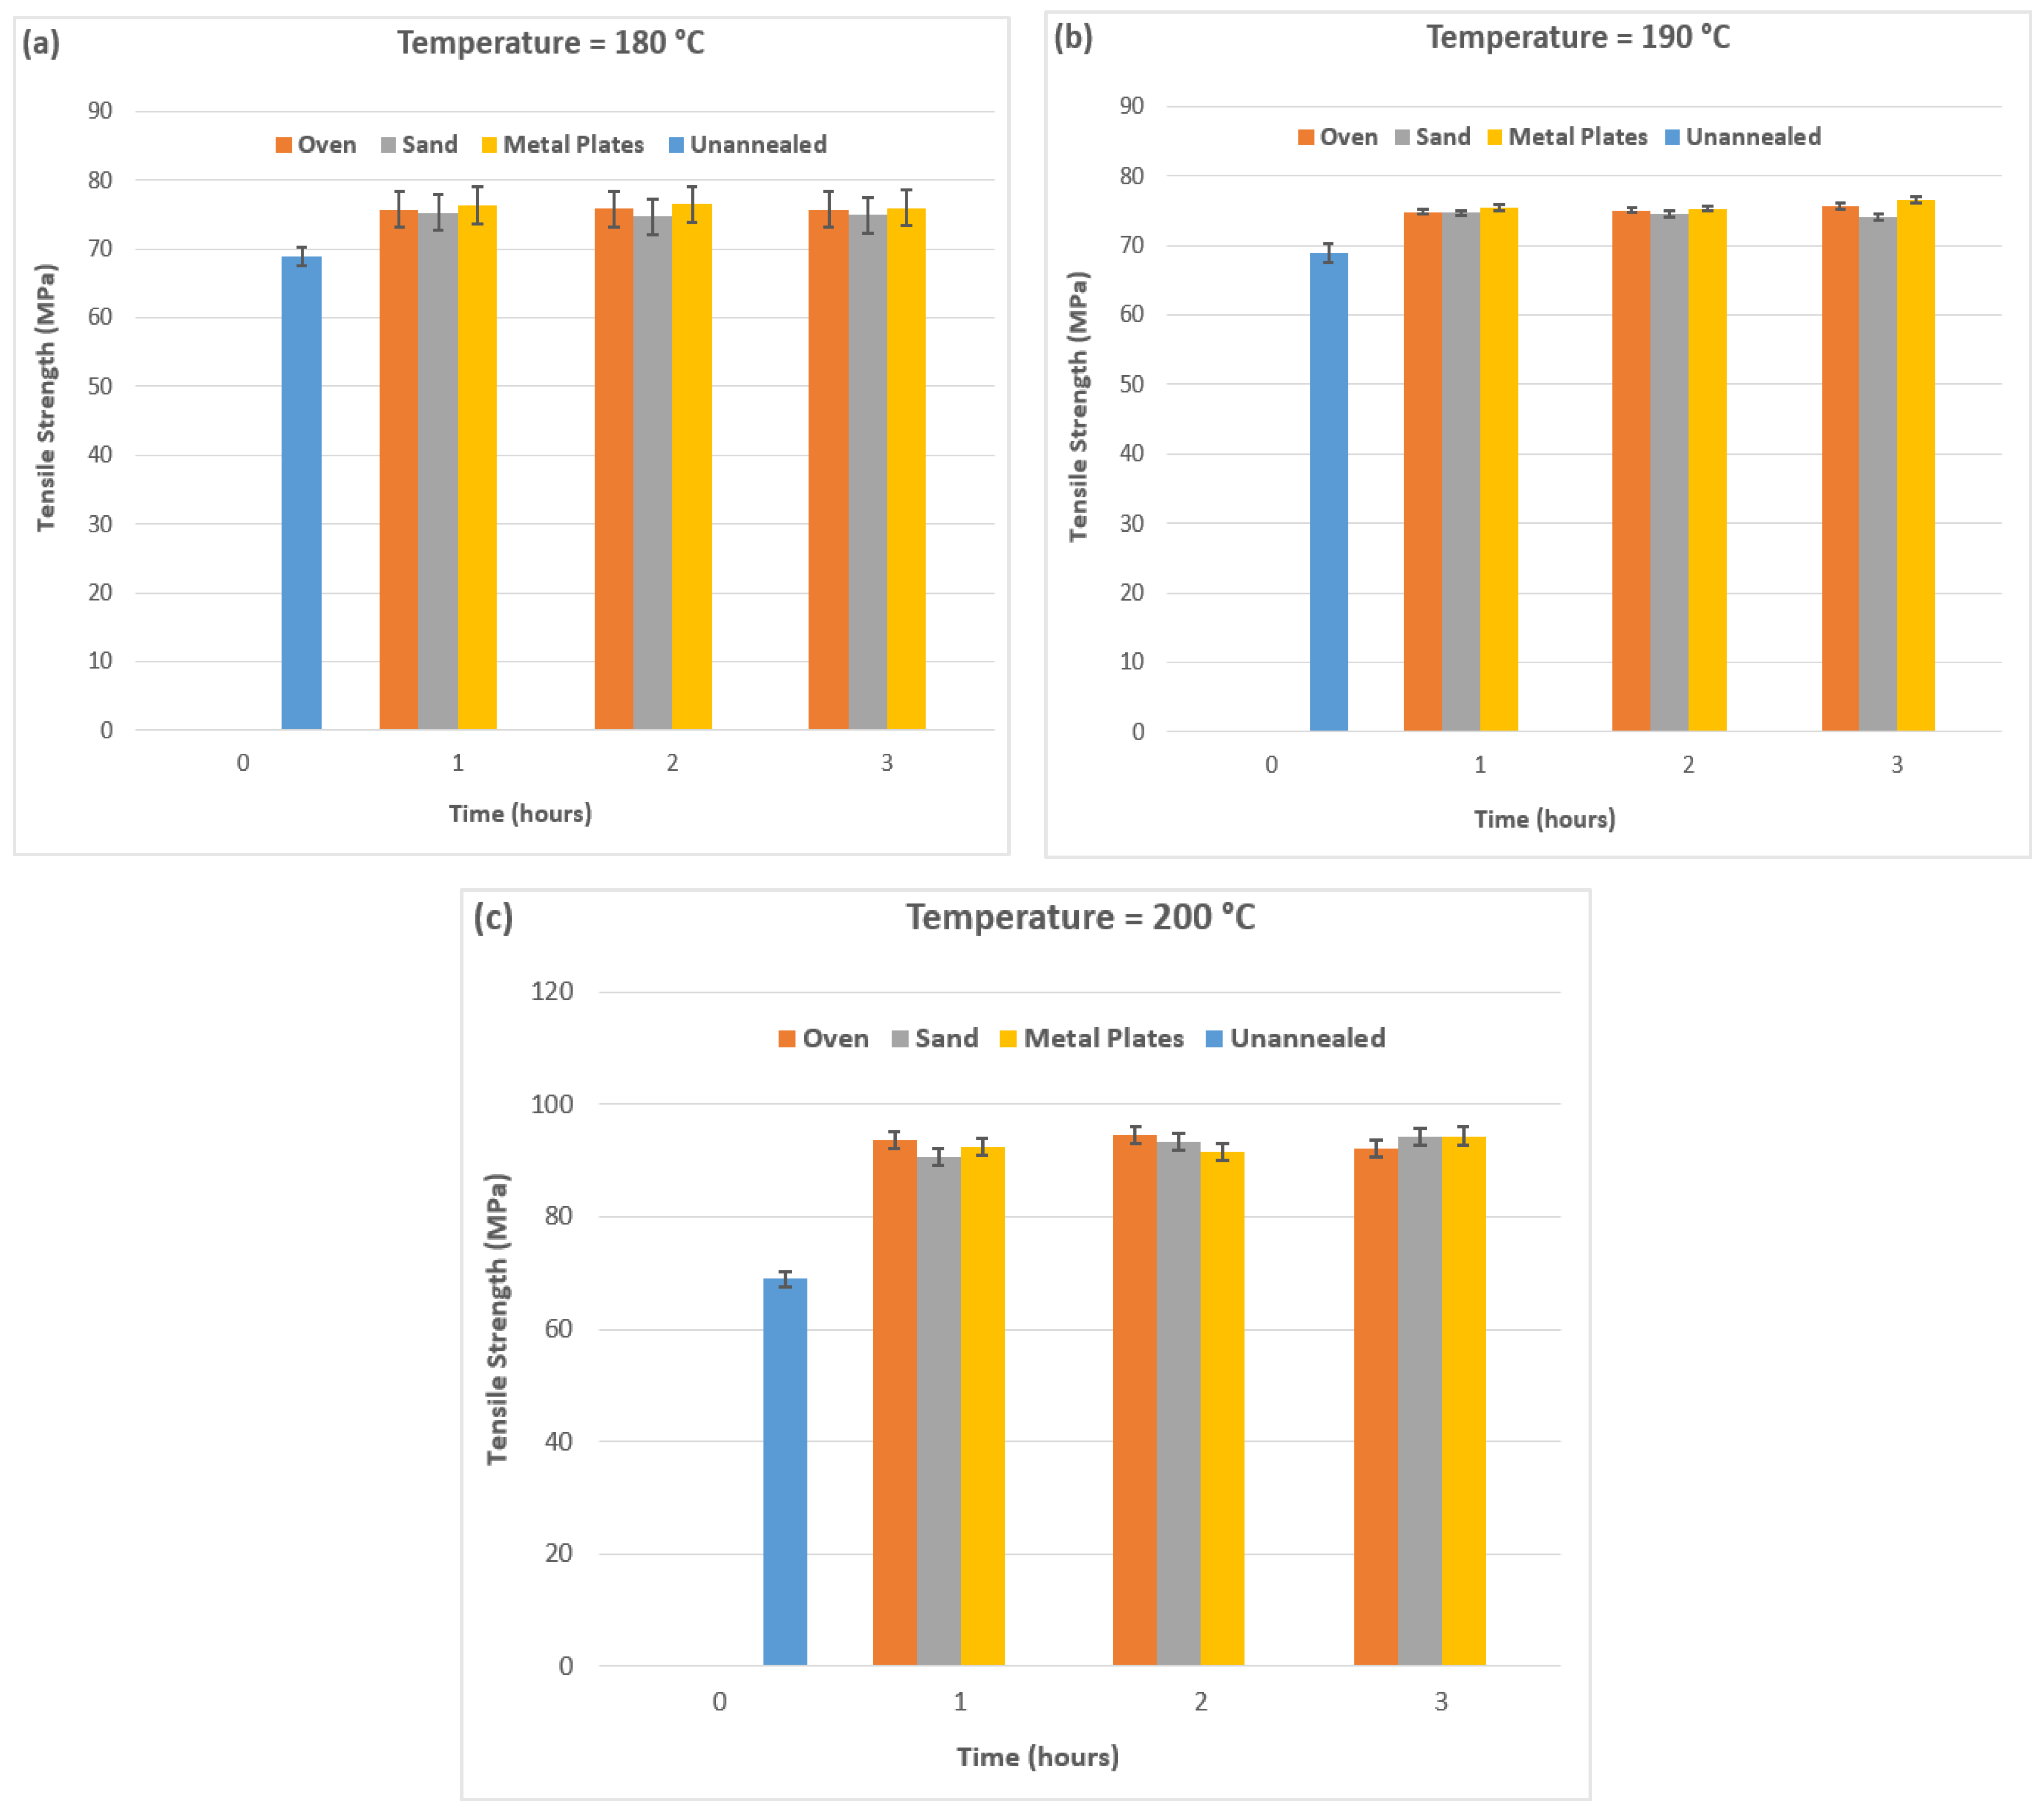
It was shown in Section 3.1 that annealing led to dimensional changes in the ULTEM 9085 samples due to thermal expansion, shrinkage and redistribution of the internal stresses. This dimensional shift impacts how tensile strength is measured and ensures that the results accurately reflect the material’s load-bearing capacity post-annealing. Therefore, it is important to analyze the impact of such changes to ensure that designers and manufacturers can compensate them for ULTEM 9085 parts. Figure 9 shows the tensile strength results based on the real cross-sectional area post-annealing to ensure a better understanding of the load-bearing capacity. At 180 °C (Figure 9a), peak tensile strength was observed for metal plate annealing at 1 and 2 h intervals, before dropping slightly at the 3 h interval. On the other hand, both direct oven and sand annealing showed consistent results. Similar results were observed at 190 °C (Figure 9b) for all three annealing methods. The highest tensile strength values were observed at 200 °C (Figure 9c), highlighting the impact of dimensional changes (Section 3.1), as the highest deviations in thickness were observed at this temperature. Direct oven annealing showed the highest tensile strength, with an increase of 37.2% (2 h interval), whereas sand and metal plate annealing showed similar increases of 36.8% (3 h interval) and 36.9% (3 h interval), respectively. However, it is important to consider that at these time intervals, the changes in width and thickness were quite significant (Table 2). Direct oven and sand annealing showed shrinkage along the Y-axis (width) and expansion along the Z-axis (thickness). On the other hand, metal plate annealing showed expansion along the Y-axis (width) and shrinkage along the Z-axis (thickness). These changes account for the increase in tensile strength post-annealing. Compared with unannealed ULTEM 9085, all methods provide higher tensile strengths with the altered cross-sectional area, which should be considered while designing ULTEM 9085 parts.

3.4. Hardness Testing

The annealing process can significantly influence the hardness values of materials [16,27], similar to its impact on surface finish. Through controlled heating and cooling, annealing reduces internal stresses and allows for better atomic rearrangement, which can enhance the material’s hardness. However, the degree of improvement in hardness is dependent on a variety of factors, such as the annealing method and duration. The utilization of three methods aimed to provide a comparative analysis of their effectiveness for enhancing the hardness of ULTEM 9085 samples. On average, five values were taken from each square sample, equidistant from each other. The results of Shore D hardness are shown in Figure 10.
The unannealed samples showed a hardness value of 76.6 HD. It is evident that all temperatures and time intervals yielded higher values compared with the unannealed samples, demonstrating the effectiveness of the three annealing methods. At 180 °C (Figure 10a), the hardness values increased with increased time intervals for all methods, and the highest hardness values were obtained for direct oven annealing as 83.3 HD, with an increase of 8.7% compared with the unannealed ULTEM 9085 samples. With a rise in temperature to 190 °C (Figure 10b) and 200 °C (Figure 10c), the values remained consistent for oven and sand annealing. Direct oven annealing showed slightly higher values compared with sand annealing, and metal plates demonstrated the highest values with increased time intervals, namely 86.3 HD (an increase of 11.2%). These results are consistent with the discussion in Section 3.2, with metal plate annealing resulting in an improved surface finish and the highest hardness values at increased temperatures and time intervals. Direct oven annealing showed consistent results with higher values, and sand annealing showed the lowest increase in hardness values compared with the unannealed ULTEM 9085 samples.

3.5. Flexural Testing

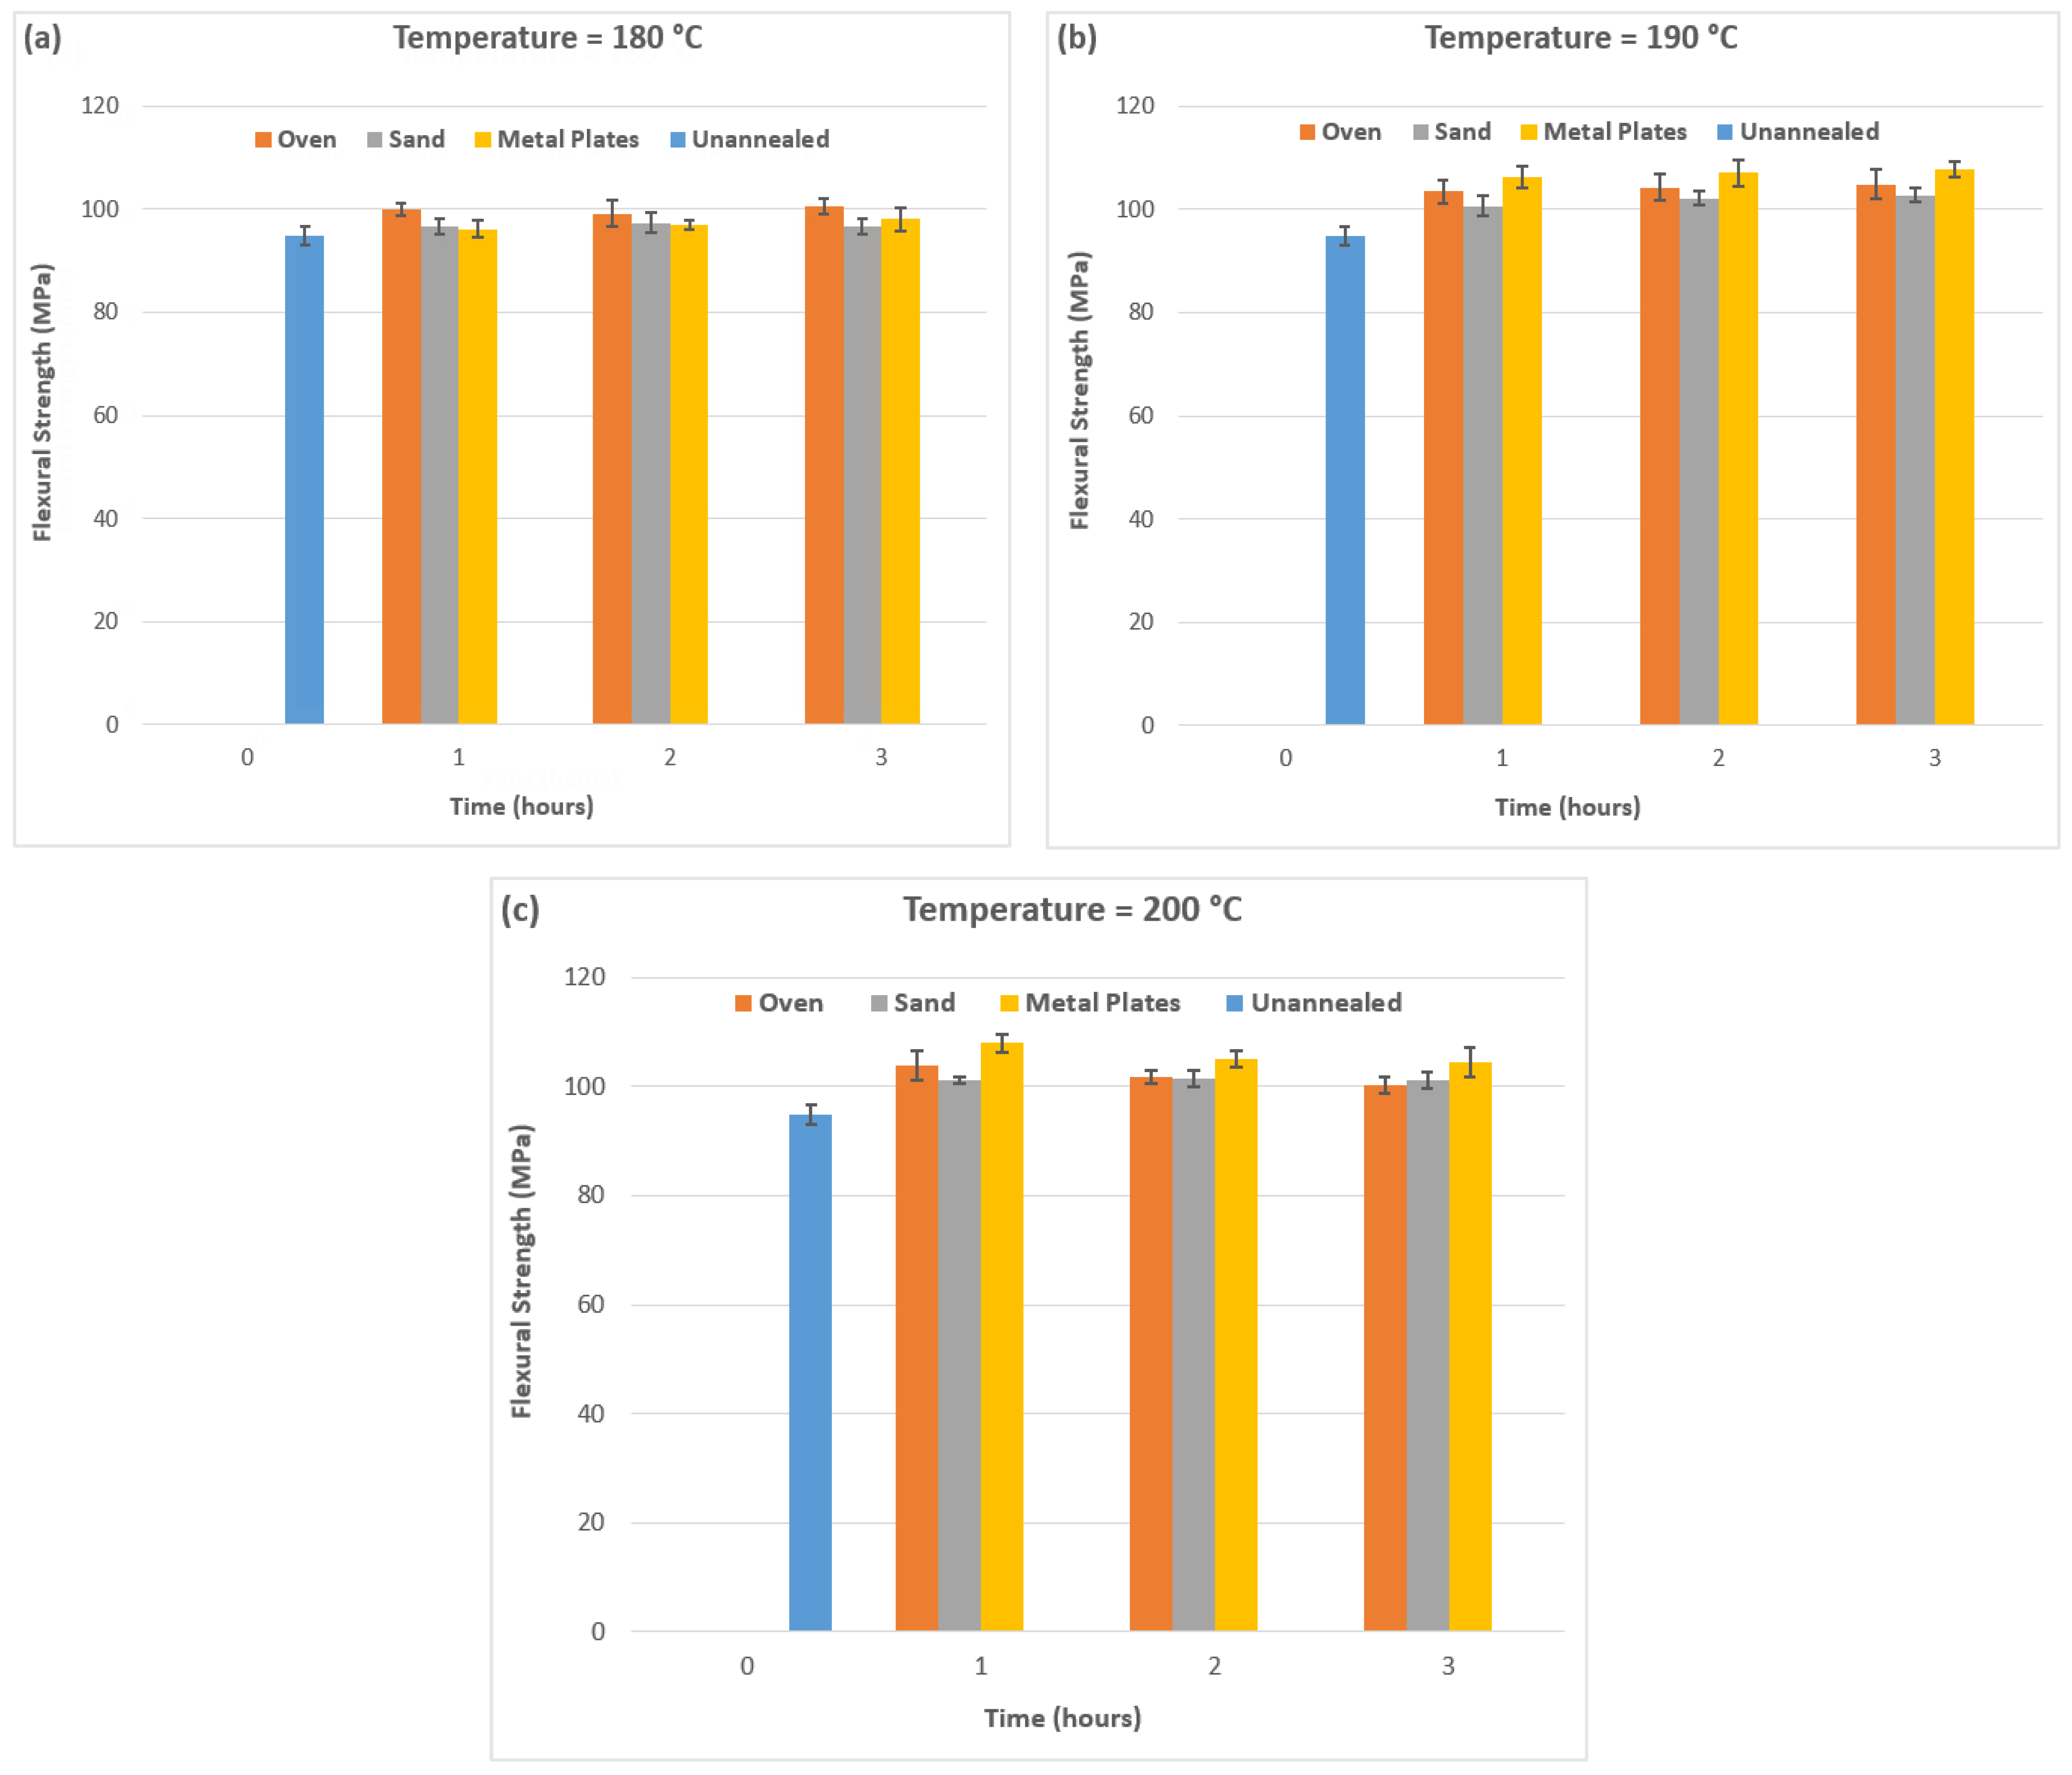
Three-point flexural testing was used in this work to ascertain the flex or bending properties of ULTEM 9085 samples. The results from the testing are shown in Figure 11. Similar to tensile testing, all annealed samples showed higher values compared with unannealed ULTEM 9085 rectangular samples. However, it is to be noted that the increase was not as high as was observed for tensile testing. This is largely due to the way the stresses are distributed. While tensile tests apply uniform stress across the entire cross-section, flexural tests concentrate multidirectional stress at the surface, limiting the effectiveness of annealing in improving the load capacity. FDM-printed parts are highly anisotropic, with weaker interlayer bonds in the Z direction [18,19]. In tensile tests, annealing can improve interlayer bonding by reducing residual stresses and enhancing molecular diffusion between layers [16,17]. However, in a three-point flexural test, the bending stresses can still exploit weaker areas near the surface layers, thus limiting the impact of annealing on the fracture load.
At 180 °C (Figure 11a), the highest flexural strength was observed at the 3 h time interval for direct oven annealing, as an increase of 6% was observed, compared with unannealed ULTEM 9085 rectangular samples. The other two methods showed values comparable with the unannealed samples, indicating minimal benefits of using them at 180 °C. At 190 °C (Figure 11b), direct oven and metal plate annealing demonstrated flexural strengths, with the latter showing an increase of 13.7% at the 3 h time interval. This was mainly due to the improved surface uniformity and higher hardness values (Section 3.2 and Section 3.4), as metal plates apply consistent pressure during annealing, which promotes more uniform heat distribution and better interlayer bonding in FDM-printed parts. The same pattern was observed in Figure 11c at 200 °C, with metal plates showing a slight increase in flexural strength to 13.9% at the 1 h interval and gradually reducing as the time interval increased. Direct oven and sand annealing showed consistent results at all temperatures, with direct oven annealing demonstrating higher flexural strength values. While direct oven annealing produced optimal tensile test results, metal plate annealing proved more effective for flexural tests, leading to higher flexural strength values. The reason for this difference lies in how each annealing method influences the sample’s mechanical structure. Metal plates apply uniform pressure during the annealing process, reducing surface defects and ensuring better heat transfer to improve interlayer bonding. In contrast, direct oven annealing, while effective in reducing internal stresses and improving tensile strength, does not provide the same level of structural reinforcement in bending scenarios. Therefore, metal plate annealing is better suited for scenarios where flexural strength is the primary concern, such as in three-point bending tests.
While metal plate annealing showed higher flexural strength values, direct oven annealing demonstrated consistent results at all annealing temperatures and time intervals. This is consistent with the work of De Bruijn et al. [18], who investigated the impact of time, temperature and a pressurized environment for annealing ULTEM 9085 flexural samples using the design of experiments methodology. They showed that increases in the annealing temperature and time play a crucial role in enhancing the flexural strength of ULTEM 9085 samples. They observed the highest flexural strength at 3 h and 200 °C, both with (112 MPa) and without a vacuum (87 MPa). In this current work, metal plate annealing showed the highest flexural strength of 108 MPa, but at the 1 h time interval and 200 °C, it had slightly lower values than vacuum annealing but much higher than the oven-annealed values.

3.6. Microstructural Analysis

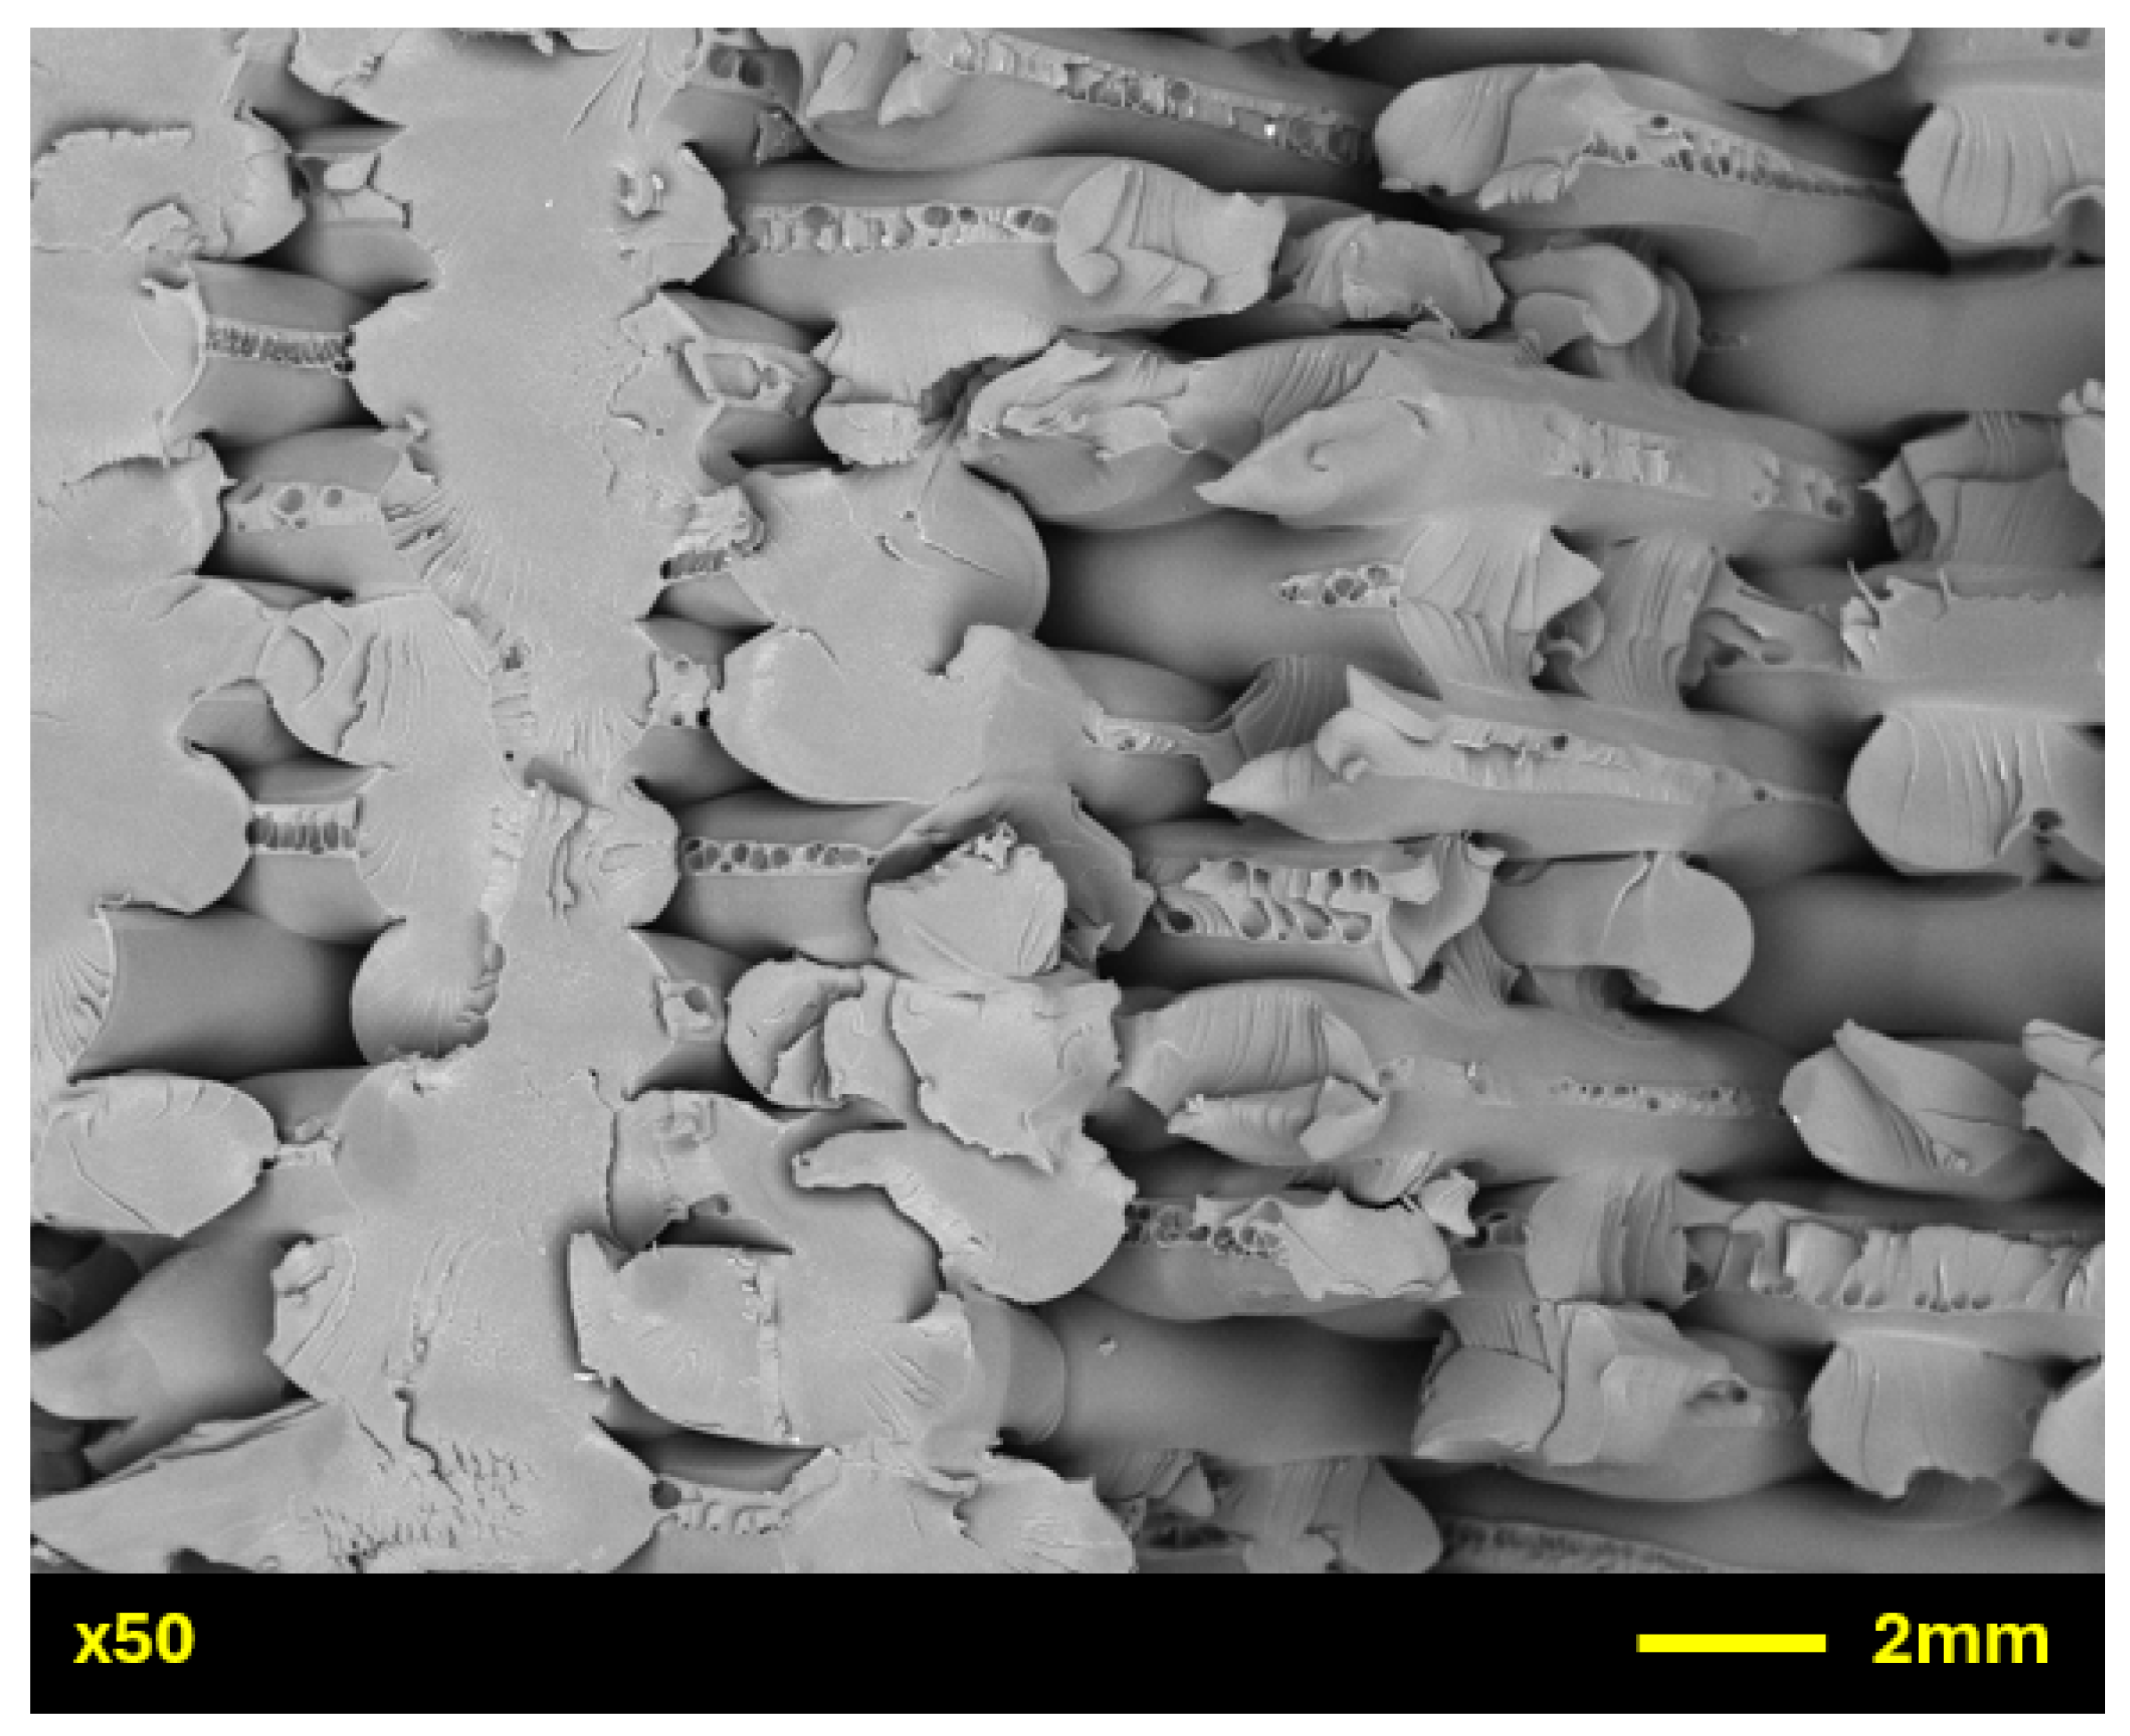
In addition to observing the surfaces of annealed and unannealed ULTEM 9085 samples with a scanning electron microscope, microstructural analysis was also performed on the fracture surfaces. Figure 12 shows the SEM micrograph for the fracture surface of unannealed ULTEM 9085 after tensile testing.
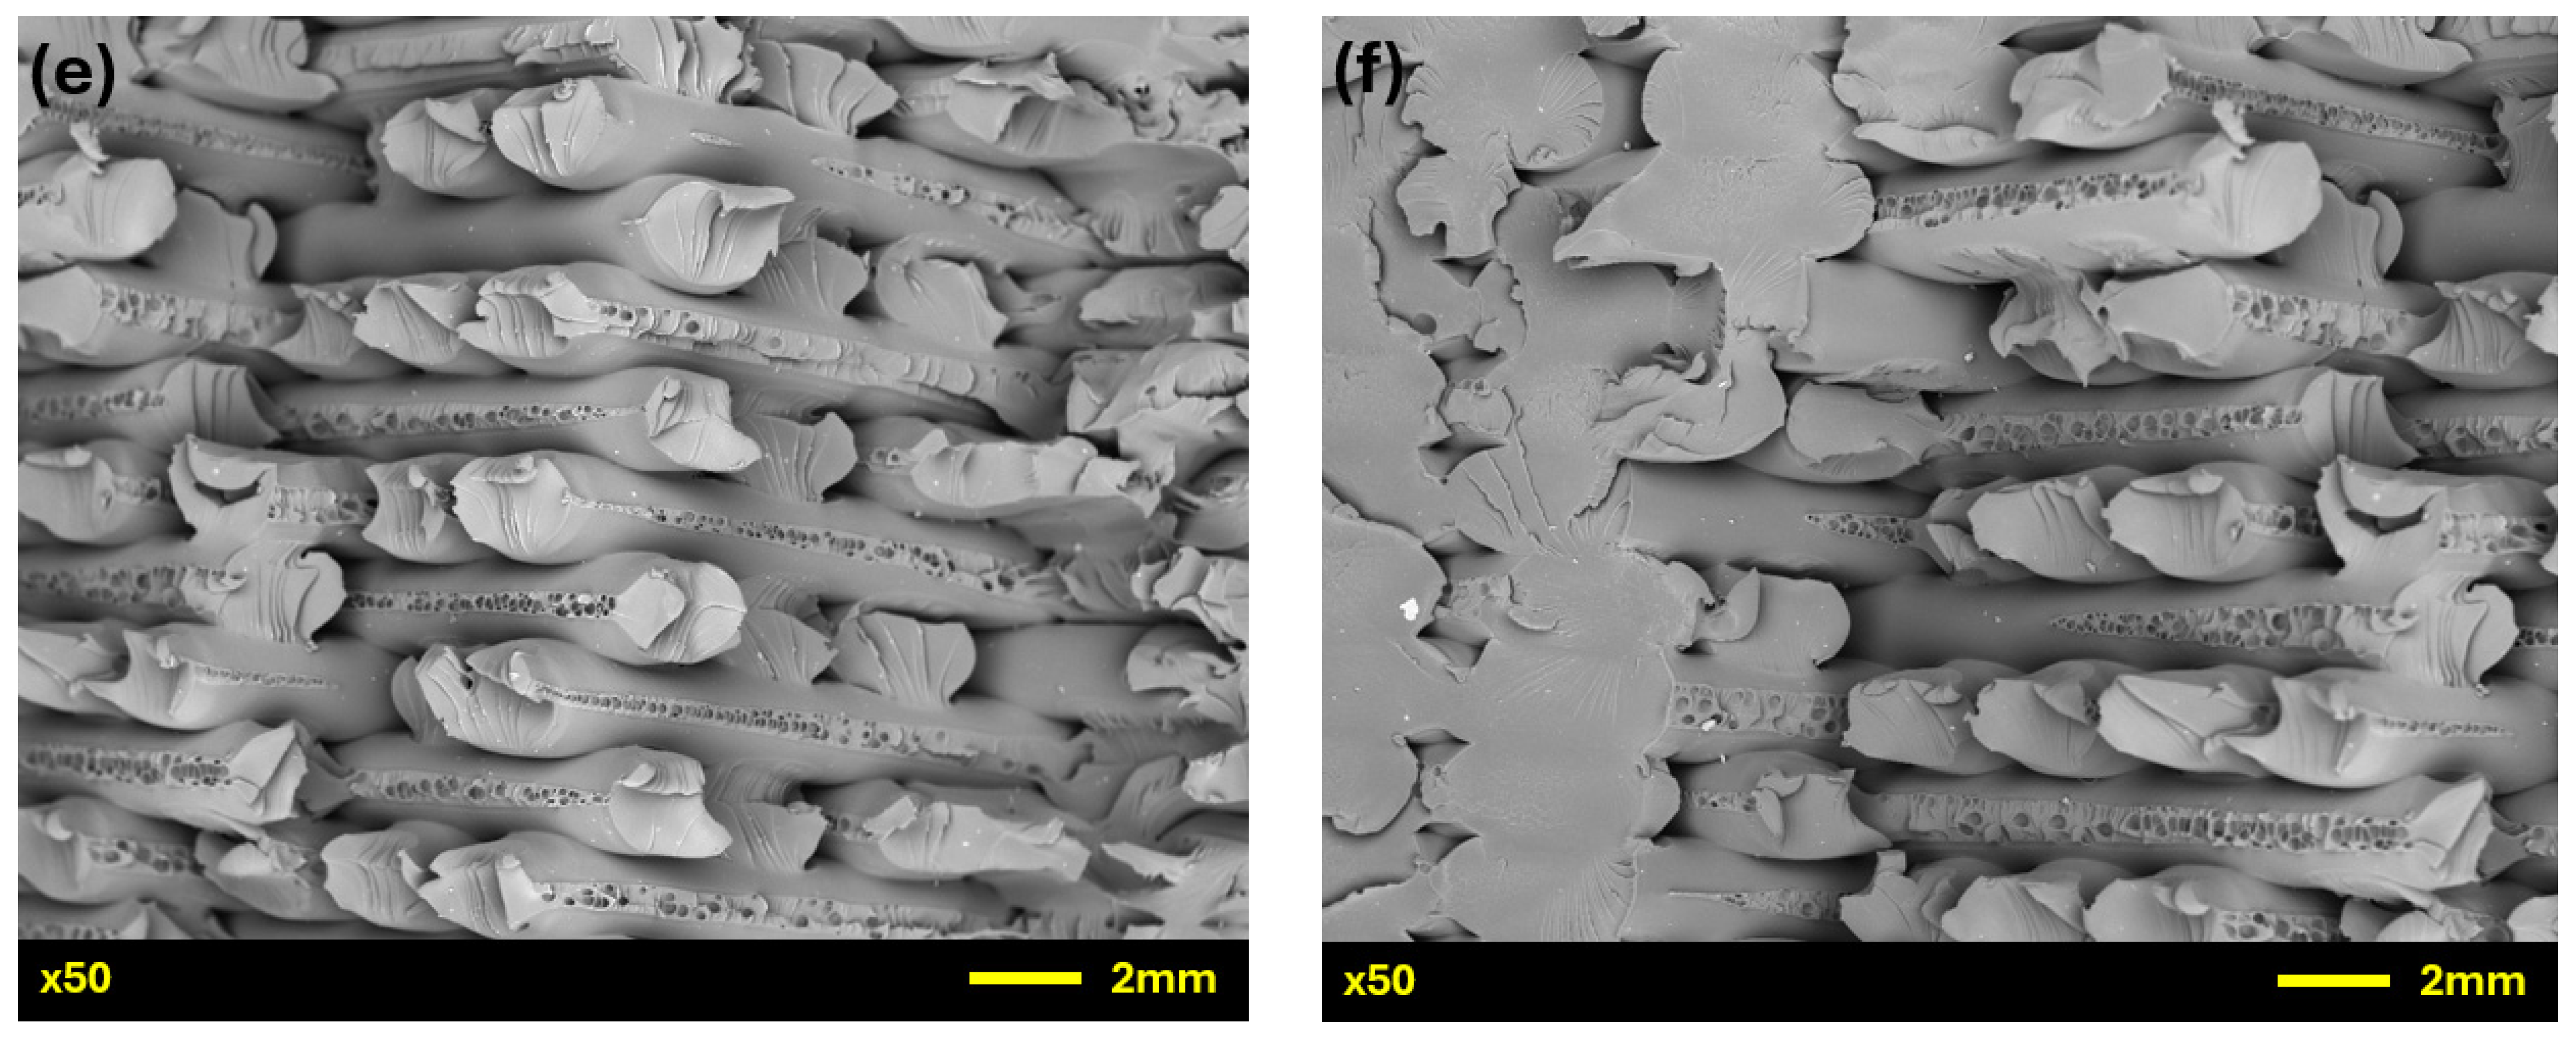
SEM micrographs for the lowest and highest ULTEM 9085 samples in terms of tensile strength from the three annealing methods are shown in Figure 13. For direct oven annealing, both ductile and brittle failure regions were observed, with features such as stretched fibrils and micro-voids. The fracture began with a brittle morphology (Figure 13a), characterized by a relatively flat surface with little crazing. As the crack propagated through the cross-sectional area, it changed to a more ductile morphology (Figure 13b), with an increase in the stress whitening or crazing of the individual filament. The change from brittle to ductile can be observed for the sample with the lowest tensile strength (Figure 13a) and the sample with the highest lowest tensile strength (Figure 13b). This response to stress is often seen in polymers exhibiting fibrillar characteristics [31]. Metal plate annealing also showed similar characteristics, indicative of enhanced ductility. However, the effect was not as significant as that of direct oven annealing at higher temperatures (Section 3.3). Figure 13c shows unevenly distributed micro-voids with clear layer lines (lowest tensile strength sample), whereas reduced micro-voids and plastic deformation can be observed in Figure 13d (highest tensile strength sample). The metal plates ensured a uniform temperature and controlled environment during annealing, which reduced residual stresses. This is also the reason for the small difference between the highest tensile test values for metal plate annealing (85.8 MPa), compared with direct oven annealing (88.3 MPa).
With sand annealing, rougher fracture surfaces with more brittle characteristics are observed due to the non-uniform temperature distribution and the abrasive interaction of the sand with the ULTEM 9085 samples (Figure 13e,f). The SEM analysis shows cleavage planes and less stretching in the fracture region, indicating a lower energy absorption before failure. The sand medium can trap air pockets or create uneven heat distribution, leading to residual stresses that make the material more prone to brittle fracture under tensile loads. Consequently, sand-annealed samples have a higher density of microcracks and irregular fracture surfaces.

4. Material Quality Characterization

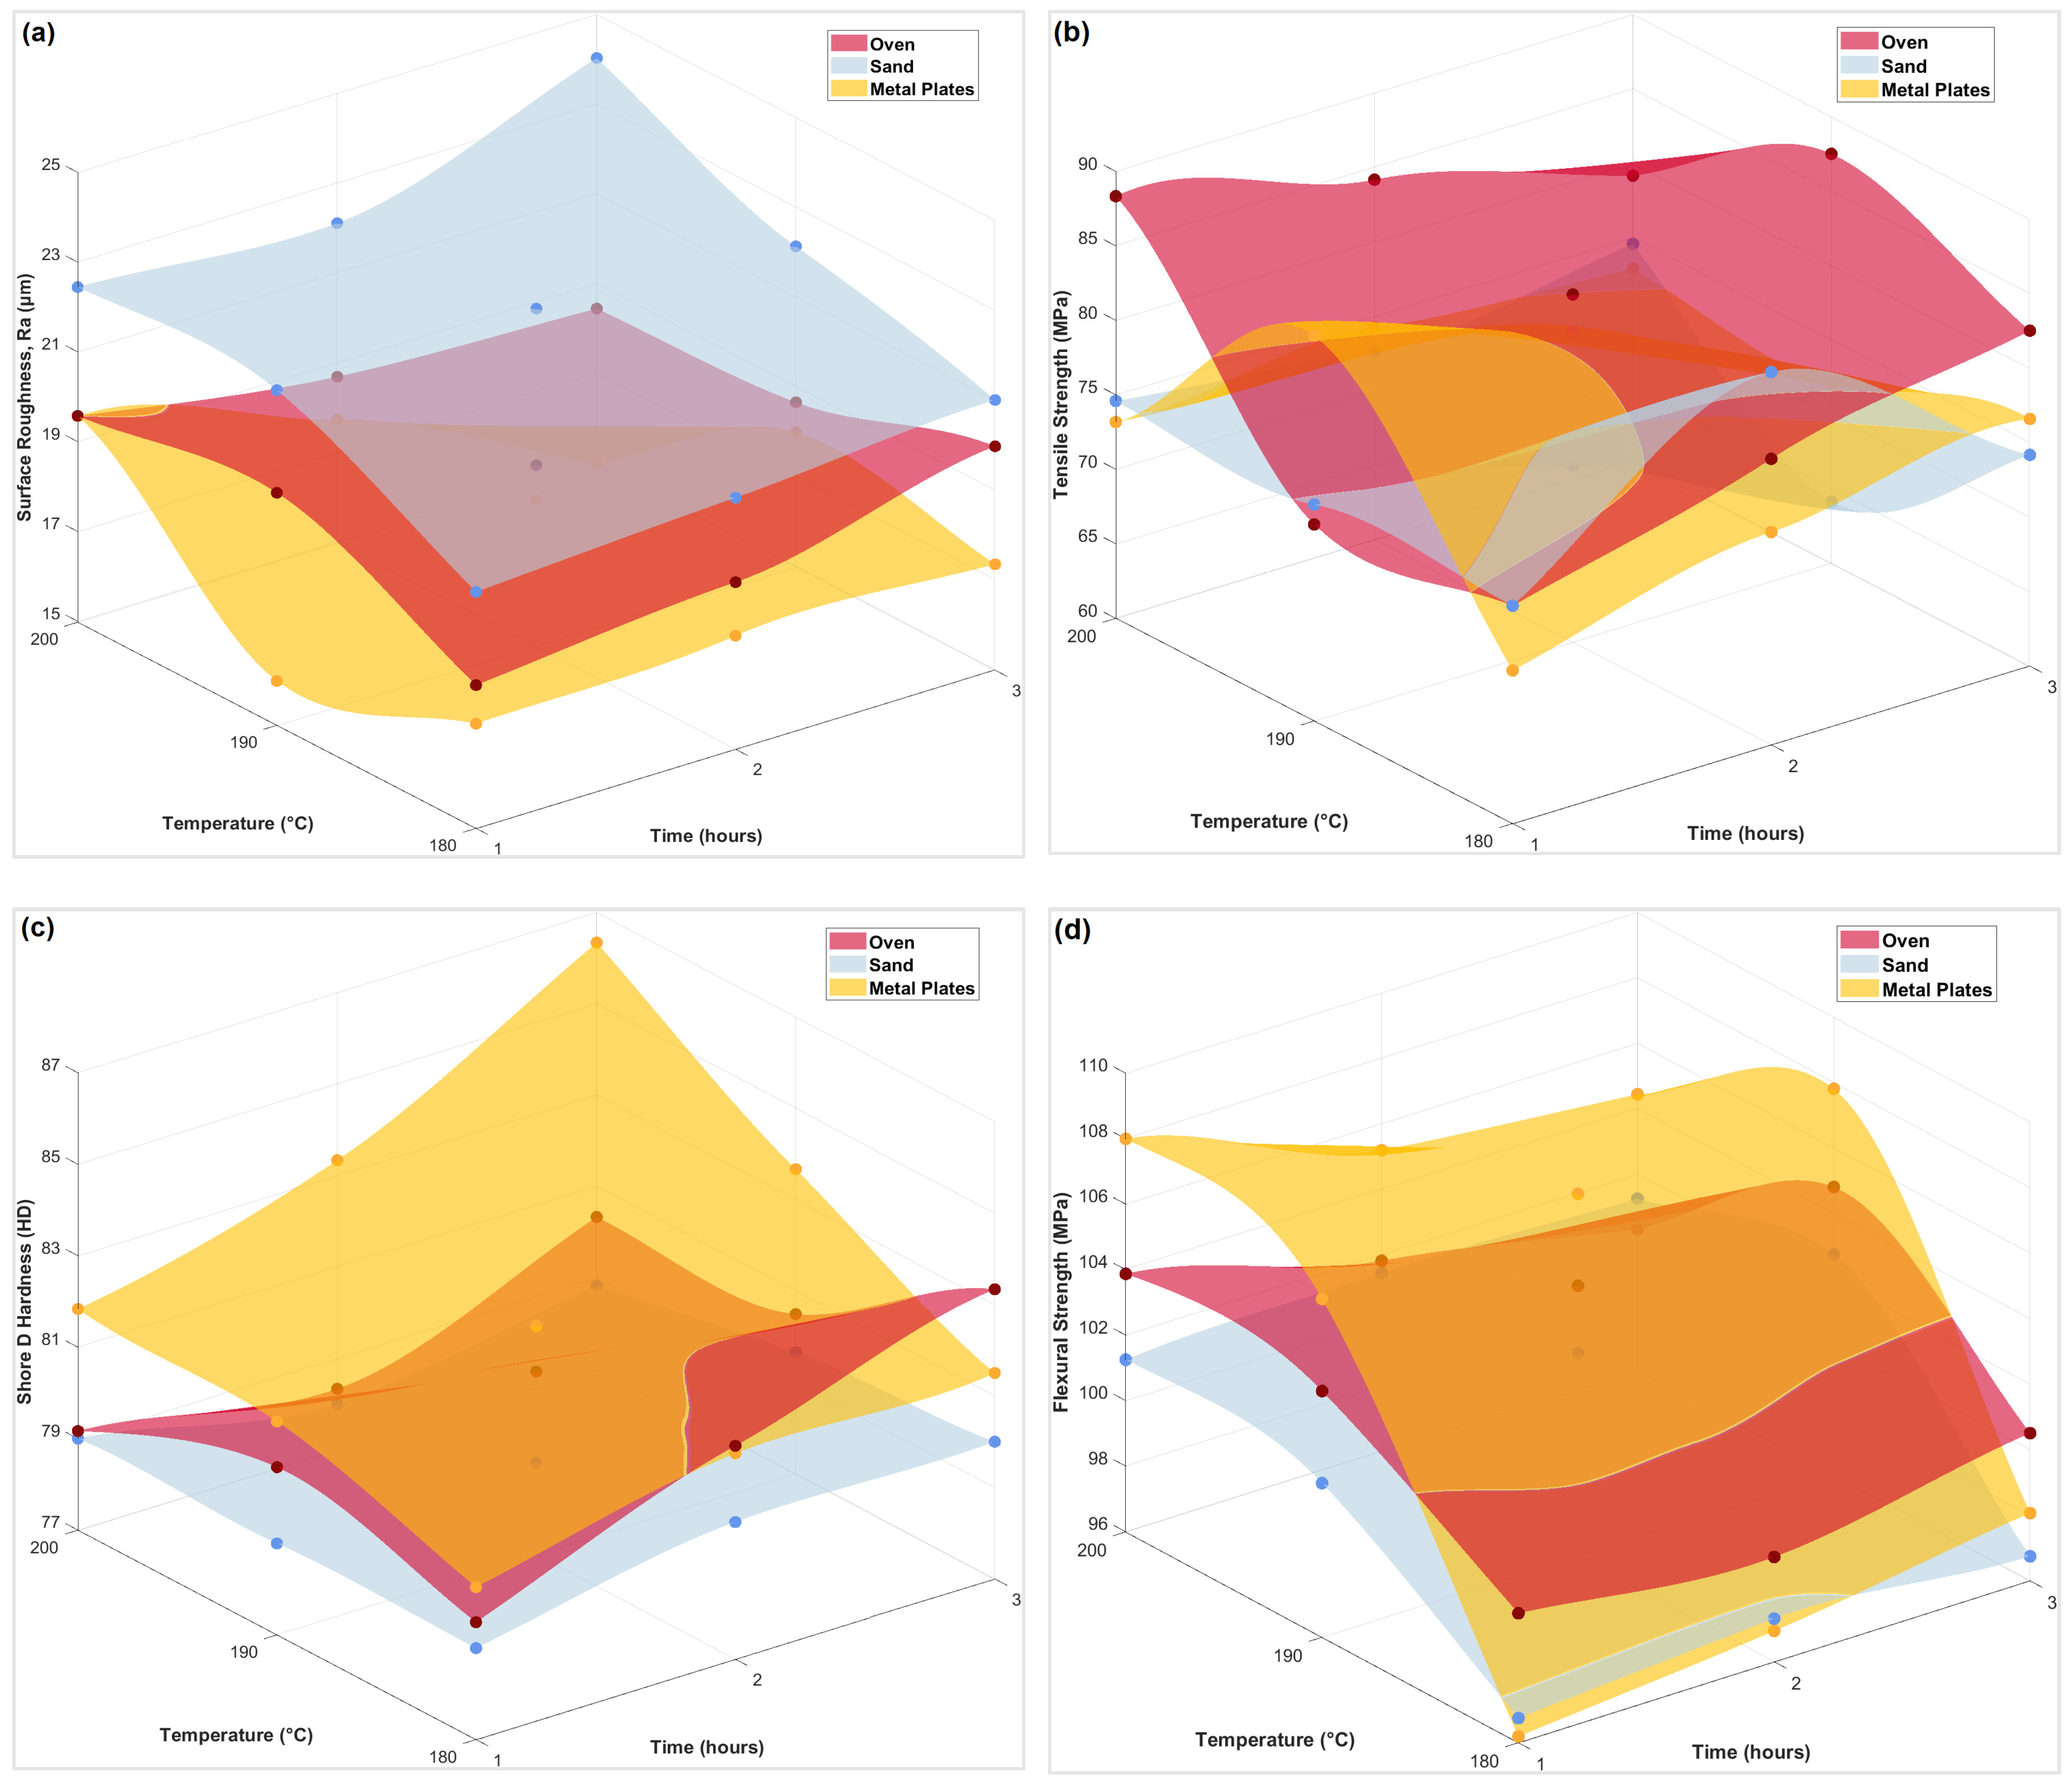
This work is focused on a comparison among three different annealing methods for FDM-printed ULTEM 9085 parts. The preceding sections have demonstrated the effect of these methods on the dimensional accuracy, surface roughness, tensile, hardness and flexural performance, with varying degrees of effectiveness. Therefore, it is imperative to identify the optimal set of parameters to achieve the desired properties in ULTEM 9085 parts. It has been observed that metal plate annealing is better suited to achieve a better surface finish, as well as high hardness values and flexural loads. Direct oven annealing yielded the most consistent and higher fracture load values for tensile testing, whereas sand annealing demonstrated better dimensional stability. However, there are also combinations of annealing temperatures and durations across the three methods that resulted in superior performance for specific conditions. For instance, sand annealing yielded a higher tensile strength at a 2 h interval for 180 °C, while metal plate annealing demonstrated enhanced results at a 1 h interval for 190 °C (Figure 8). These variations highlight the importance of tailoring the annealing process to the specific requirements of the material and application, optimizing both the mechanical properties and performance of FDM-printed ULTEM 9085 parts. Further investigation into these tailored annealing conditions can lead to more refined manufacturing strategies for high-performance components. Therefore, Figure 14 shows surface plots for roughness, tensile strength (as per Figure 8), hardness and flexural strength for the three annealing methods. If the focus is on achieving the lowest surface roughness for an aesthetic application, then metal plate annealing should be the preferred choice. However, when the objective is to combine various attributes together, then the presented comparison among the three annealing methods with the associated variables (time and temperature) becomes critical to ensure that the optimal combination can be identified for a specific engineering application. In this context, consider that a product made of ULTEM 9085 is required to have a maximum surface roughness of 19 μm (Figure 14a), a tensile strength of over 84 MPa (Figure 14b), a hardness of over 78 HD (Figure 14c) and a flexural strength of more than 103 MPa (Figure 14d). Most direct oven and metal plate annealing scenarios are well-suited for this application. While some sand annealing scenarios meet the technical requirements, they fall short in delivering the desired surface finish, making them less practical for this context. Both direct oven annealing and metal plate annealing provide one combination each that fulfils the requirements, as presented in Table 3. In this case, either of these samples can be manufactured, as their properties are very similar. However, metal plate annealing should be preferred, as it shows better characteristics for all parameters except tensile strength. This is an important aspect of the analysis that helps in quantifying the results and enabling the user to understand the benefits of other annealing methods that can be used instead of conventional annealing to achieve optimal results for different applications.

5. Conclusions

In this work, a comparative analysis has been provided for three different annealing methods that were used to anneal ULTEM 9085 parts. They include direct oven annealing, fluidized bed annealing with sharp sand and metal plate annealing. The annealing process for all three methods was conducted at temperatures of 180 °C, 190 °C and 200 °C, with time intervals of 1 h, 2 h and 3 h. This comparative analysis provides valuable insights into optimizing the post-processing techniques for FDM-printed components, contributing to improved performance and reliability in industrial applications. It is evident from the results that fluidized bed annealing with sharp sand yielded better dimensional stability because the fine grains of sand provide uniform support around the samples, thus reducing deformation. The sand acts as an insulating medium, allowing for more controlled heat distribution and slower, uniform cooling. This helps minimize warping and shrinkage compared with direct oven or metal plate annealing, where uneven heat distribution or constrained surfaces can cause distortions. The surface finish was improved with metal plate annealing due to the pressure of the plates that reduced layer lines and surface irregularities more effectively than sand or direct oven annealing. The lowest value of surface roughness was observed to be 14.9 μm at a 3 h time interval for 200 °C, with a reduction of 43.6% in the surface finish compared with unannealed ULTEM 9085 samples.
Direct oven annealing yielded consistently high results for tensile testing under all scenarios, with the highest increase being observed to be 28.1% for the 1 h interval at 200 °C. Sand annealing and metal plate annealing showed higher fracture loads at 180 °C (2 h interval) and 190 °C (1 h interval), respectively. Furthermore, direct oven annealing also led to enhanced elongation at break for ULTEM 9085 samples compared with sand and metal plate annealing. Tensile strength analysis was also conducted using the altered cross-sectional area post-annealing to ascertain the real load-bearing capacity of ULTEM 9085 samples. This analysis is useful to ensure designers can compensate for dimensional changes as per the tensile strength requirements for ULTEM 9085 parts subjected to different annealing methods.
Hardness testing results followed a similar pattern to surface roughness, with metal plates annealing demonstrating the highest hardness numbers for all scenarios. The highest increase was observed to be 11.2% for the 3 h time interval at 200 °C, compared with unannealed samples. Even though the increase in fracture loads during three-point flexural testing is not as significant as that of tensile testing, metal plate annealing yielded an increase of 13.8% for the 1 h interval at 200 °C, with sand annealing and direct oven annealing also showing consistent results with lower fracture loads.
For future work, the parameters could be changed to ascertain the impact of the different annealing methods. These include increasing the annealing time interval and temperature, changing the type of sand used and the depth at which the samples are submerged, increasing/decreasing the dimensions of the metal plates and applied pressure, and changing the material. By carefully manipulating these variables, the performance of FDM-printed ULTEM 9085 parts can be significantly enhanced, thus improving their suitability for high-performance applications such as aerospace and automotive industries.

Author Contributions

J.B. conceptualised the idea, designed the methodology, undertook data curation, investigation, acquired resources, formal analysis, project administration, manuscript writing, and reviewing and editing; H.A. undertook data curation, investigation, formal analysis and manuscript writing; M.A.A.K. and V.M. undertook data curation, investigation and formal analysis. All authors have read and agreed to the published version of the manuscript.

Funding

This research did not receive any external funding.

Data Availability Statement

The data can be made available on reasonable request.

Conflicts of Interest

Author V.M. was employed by MG Electric (Colchester) Ltd. company. The remaining authors declare that the research was conducted without any commercial or financial relationships that could be construed as potential conflicts of interest.

References

  1. Islam, M.A.; Mobarak, M.H.; Rimon, M.I.H.; Al Mahmud, M.Z.; Ghosh, J.; Ahmed, M.M.S.; Hossain, N. Additive manufacturing in polymer research: Advances, synthesis, and applications. Polym. Test. 2024, 132, 108364. [Google Scholar] [CrossRef]
  2. Srivastava, M.; Rathee, S. Additive manufacturing: Recent trends, applications and future outlooks. Prog. Addit. Manuf. 2022, 7, 261–287. [Google Scholar] [CrossRef]
  3. Leal, R.; Barreiros, F.M.; Alves, L.; Romeiro, F.; Vasco, J.C.; Santos, M.; Marto, C. Additive manufacturing tooling for the automotive industry. Int. J. Adv. Manuf. Technol. 2017, 92, 1671–1676. [Google Scholar] [CrossRef]
  4. Butt, J.; Onimowo, D.A.; Gohrabian, M.; Sharma, T.; Shirvani, H. A desktop 3D printer with dual extruders to produce customised electronic circuitry. Front. Mech. Eng. 2018, 13, 528–534. [Google Scholar] [CrossRef]
  5. First Metal Part 3D Printed in Space. Available online: https://phys.org/news/2024-09-metal-3d-space.html#:~:text=Additive%20manufacturing%20in%20space%20will,relying%20on%20resupplies%20and%20redundancies (accessed on 15 September 2024).
  6. ISO/ASTM 52900:2021; Additive Manufacturing—General Principles—Fundamentals and Vocabulary. International Organization for Standardization: Geneva, Switzerland, 2021.
  7. Oleff, A.; Küster, B.; Stonis, M.; Overmeyer, L. Process monitoring for material extrusion additive manufacturing: A state-of-the-art review. Prog. Addit. Manuf. 2021, 6, 705–730. [Google Scholar] [CrossRef]
  8. Park, S.I.; Rosen, D.W.; Choi, S.K.; Duty, C.E. Effective mechanical properties of lattice material fabricated by material extrusion additive manufacturing. Addit. Manuf. 2014, 1, 12–23. [Google Scholar]
  9. Jiang, J.; Xu, X.; Stringer, J. Optimization of process planning for reducing material waste in extrusion based additive manufacturing. Robot. Comput. Manuf. 2019, 59, 317–325. [Google Scholar] [CrossRef]
  10. Butt, J.; Bhaskar, R.; Mohaghegh, V. Analysing the effects of layer heights and line widths on FFF-printed thermoplastics. Int. J. Adv. Manuf. Technol. 2022, 121, 7383–7411. [Google Scholar] [CrossRef]
  11. Butt, J.; Bhaskar, R.; Mohaghegh, V. Investigating the effects of extrusion temperatures and material extrusion rates on FFF-printed thermoplastics. Int. J. Adv. Manuf. Technol. 2021, 117, 2679–2699. [Google Scholar] [CrossRef]
  12. Kechagias, J.; Chaidas, D.; Vidakis, N.; Salonitis, K.; Vaxevanidis, N. Key parameters controlling surface quality and dimensional accuracy: A critical review of FFF process. Mater. Manuf. Process. 2022, 37, 963–984. [Google Scholar] [CrossRef]
  13. Cicala, G.; Ognibene, G.; Portuesi, S.; Blanco, I.; Rapisarda, M.; Pergolizzi, E.; Recca, G. Comparison of Ultem 9085 Used in Fused Deposition Modelling (FDM) with Polytherimide Blends. Materials 2018, 11, 285. [Google Scholar] [CrossRef] [PubMed]
  14. Shelton, T.E.; Willburn, Z.A.; Hartsfield, C.R.; Cobb, G.R.; Cerri, J.T.; Kemnitz, R.A. Effects of thermal process parameters on mechanical interlayer strength for additively manufactured Ultem 9085. Polym. Test. 2020, 81, 106255. [Google Scholar] [CrossRef]
  15. Padovano, E.; Galfione, M.; Concialdi, P.; Lucco, G.; Badini, C. Mechanical and thermal behavior of ULTEM® 9085 fabricated by fused-deposition modeling. Appl. Sci. 2020, 10, 3170. [Google Scholar] [CrossRef]
  16. Butt, J.; Bhaskar, R. Investigating the effects of annealing on the mechanical properties of FFF-printed thermoplastics. J. Manuf. Mater. Process. 2020, 4, 38. [Google Scholar] [CrossRef]
  17. Zhang, Y.; Moon, S.K. The effect of annealing on additive manufactured ULTEM™ 9085 mechanical properties. Materials 2021, 14, 2907. [Google Scholar] [CrossRef]
  18. de Bruijn, A.C.; Gómez-Gras, G.; Pérez, M.A. Thermal annealing as a post-process for additively manufactured Ultem 9085 parts. Procedia Comput. Sci. 2022, 200, 1308–1317. [Google Scholar] [CrossRef]
  19. de Bruijn, A.C.; Gómez-Gras, G.; Fernández-Ruano, L.; Farràs-Tasias, L.; Pérez, M.A. Optimization of a combined thermal annealing and isostatic pressing process for mechanical and surface enhancement of Ultem FDM parts using Doehlert experimental designs. J. Manuf. Process. 2023, 85, 1096–1115. [Google Scholar] [CrossRef]
  20. Glaskova-Kuzmina, T.; Dejus, D.; Jātnieks, J.; Aniskevich, A.; Sevcenko, J.; Sarakovskis, A.; Zolotarjovs, A. Effect of post-printing cooling conditions on the properties of ULTEM printed parts. Polymers 2023, 15, 324. [Google Scholar] [CrossRef]
  21. ULTEM™ 9085 Resin. Available online: https://www.stratasys.com/uk/materials/materials-catalog/fdm-materials/ULTEM-9085-resin/ (accessed on 16 September 2024).
  22. BS EN ISO 527-2:2012; Plastics—Determination of Tensile Properties–Part 2: Test Conditions for Moulding and Extrusion Plastics. British, European and International Standard: London, UK, 2012.
  23. BS EN ISO 868:2003; Plastics and Ebonite–Determination of Indentation Hardness by Means of a Durometer (Shore Hardness). British, European and International Standard: London, UK, 2018.
  24. BS EN ISO 178:2019; Plastics—Determination of Flexural Properties. British, European and International Standard: London, UK, 2019.
  25. Mitutoyo: SJ-210—Portable Surface Roughness Tester. Available online: https://www.mitutoyo.com/products/form-measurement-machine/surface-roughness/sj-210-portable-surface-roughness-tester-2/ (accessed on 16 September 2024).
  26. ISO 21920-2:2021; Geometrical Product Specifications (GPS)—Surface Texture: Profile—Part 2: Terms, Definitions and Surface Texture Parameters. International Organization for Standardization (ISO): Geneva, Switzerland, 2021.
  27. Hart, K.R.; Dunn, R.M.; Sietins, J.M.; Mock, C.M.H.; Mackay, M.E.; Wetzel, E.D. Increased fracture toughness of additively manufactured amorphous thermoplastics via thermal annealing. Polymer 2018, 144, 192–204. [Google Scholar] [CrossRef]
  28. Rane, R.; Kulkarni, A.; Prajapati, H.; Taylor, R.; Jain, A.; Chen, V. Post-process effects of isothermal annealing and initially applied static uniaxial loading on the ultimate tensile strength of fused filament fabrication parts. Materials 2020, 13, 352. [Google Scholar] [CrossRef]
  29. Alsoufi, M.S.; Elsayed, A.E. How surface roughness performance of printed parts manufactured by desktop FDM 3D printer with PLA+ is influenced by measuring direction. Am. J. Mech. Eng. 2017, 5, 211–222. [Google Scholar]
  30. Garg, A.; Bhattacharya, A.; Batish, A. On surface finish and dimensional accuracy of FDM parts after cold vapor treatment. Mater. Manuf. Process. 2016, 31, 522–529. [Google Scholar] [CrossRef]
  31. Parrington, R.J. Fractography of metals and plastics. Pract. Fail. Anal. 2002, 2, 16–19. [Google Scholar] [CrossRef]
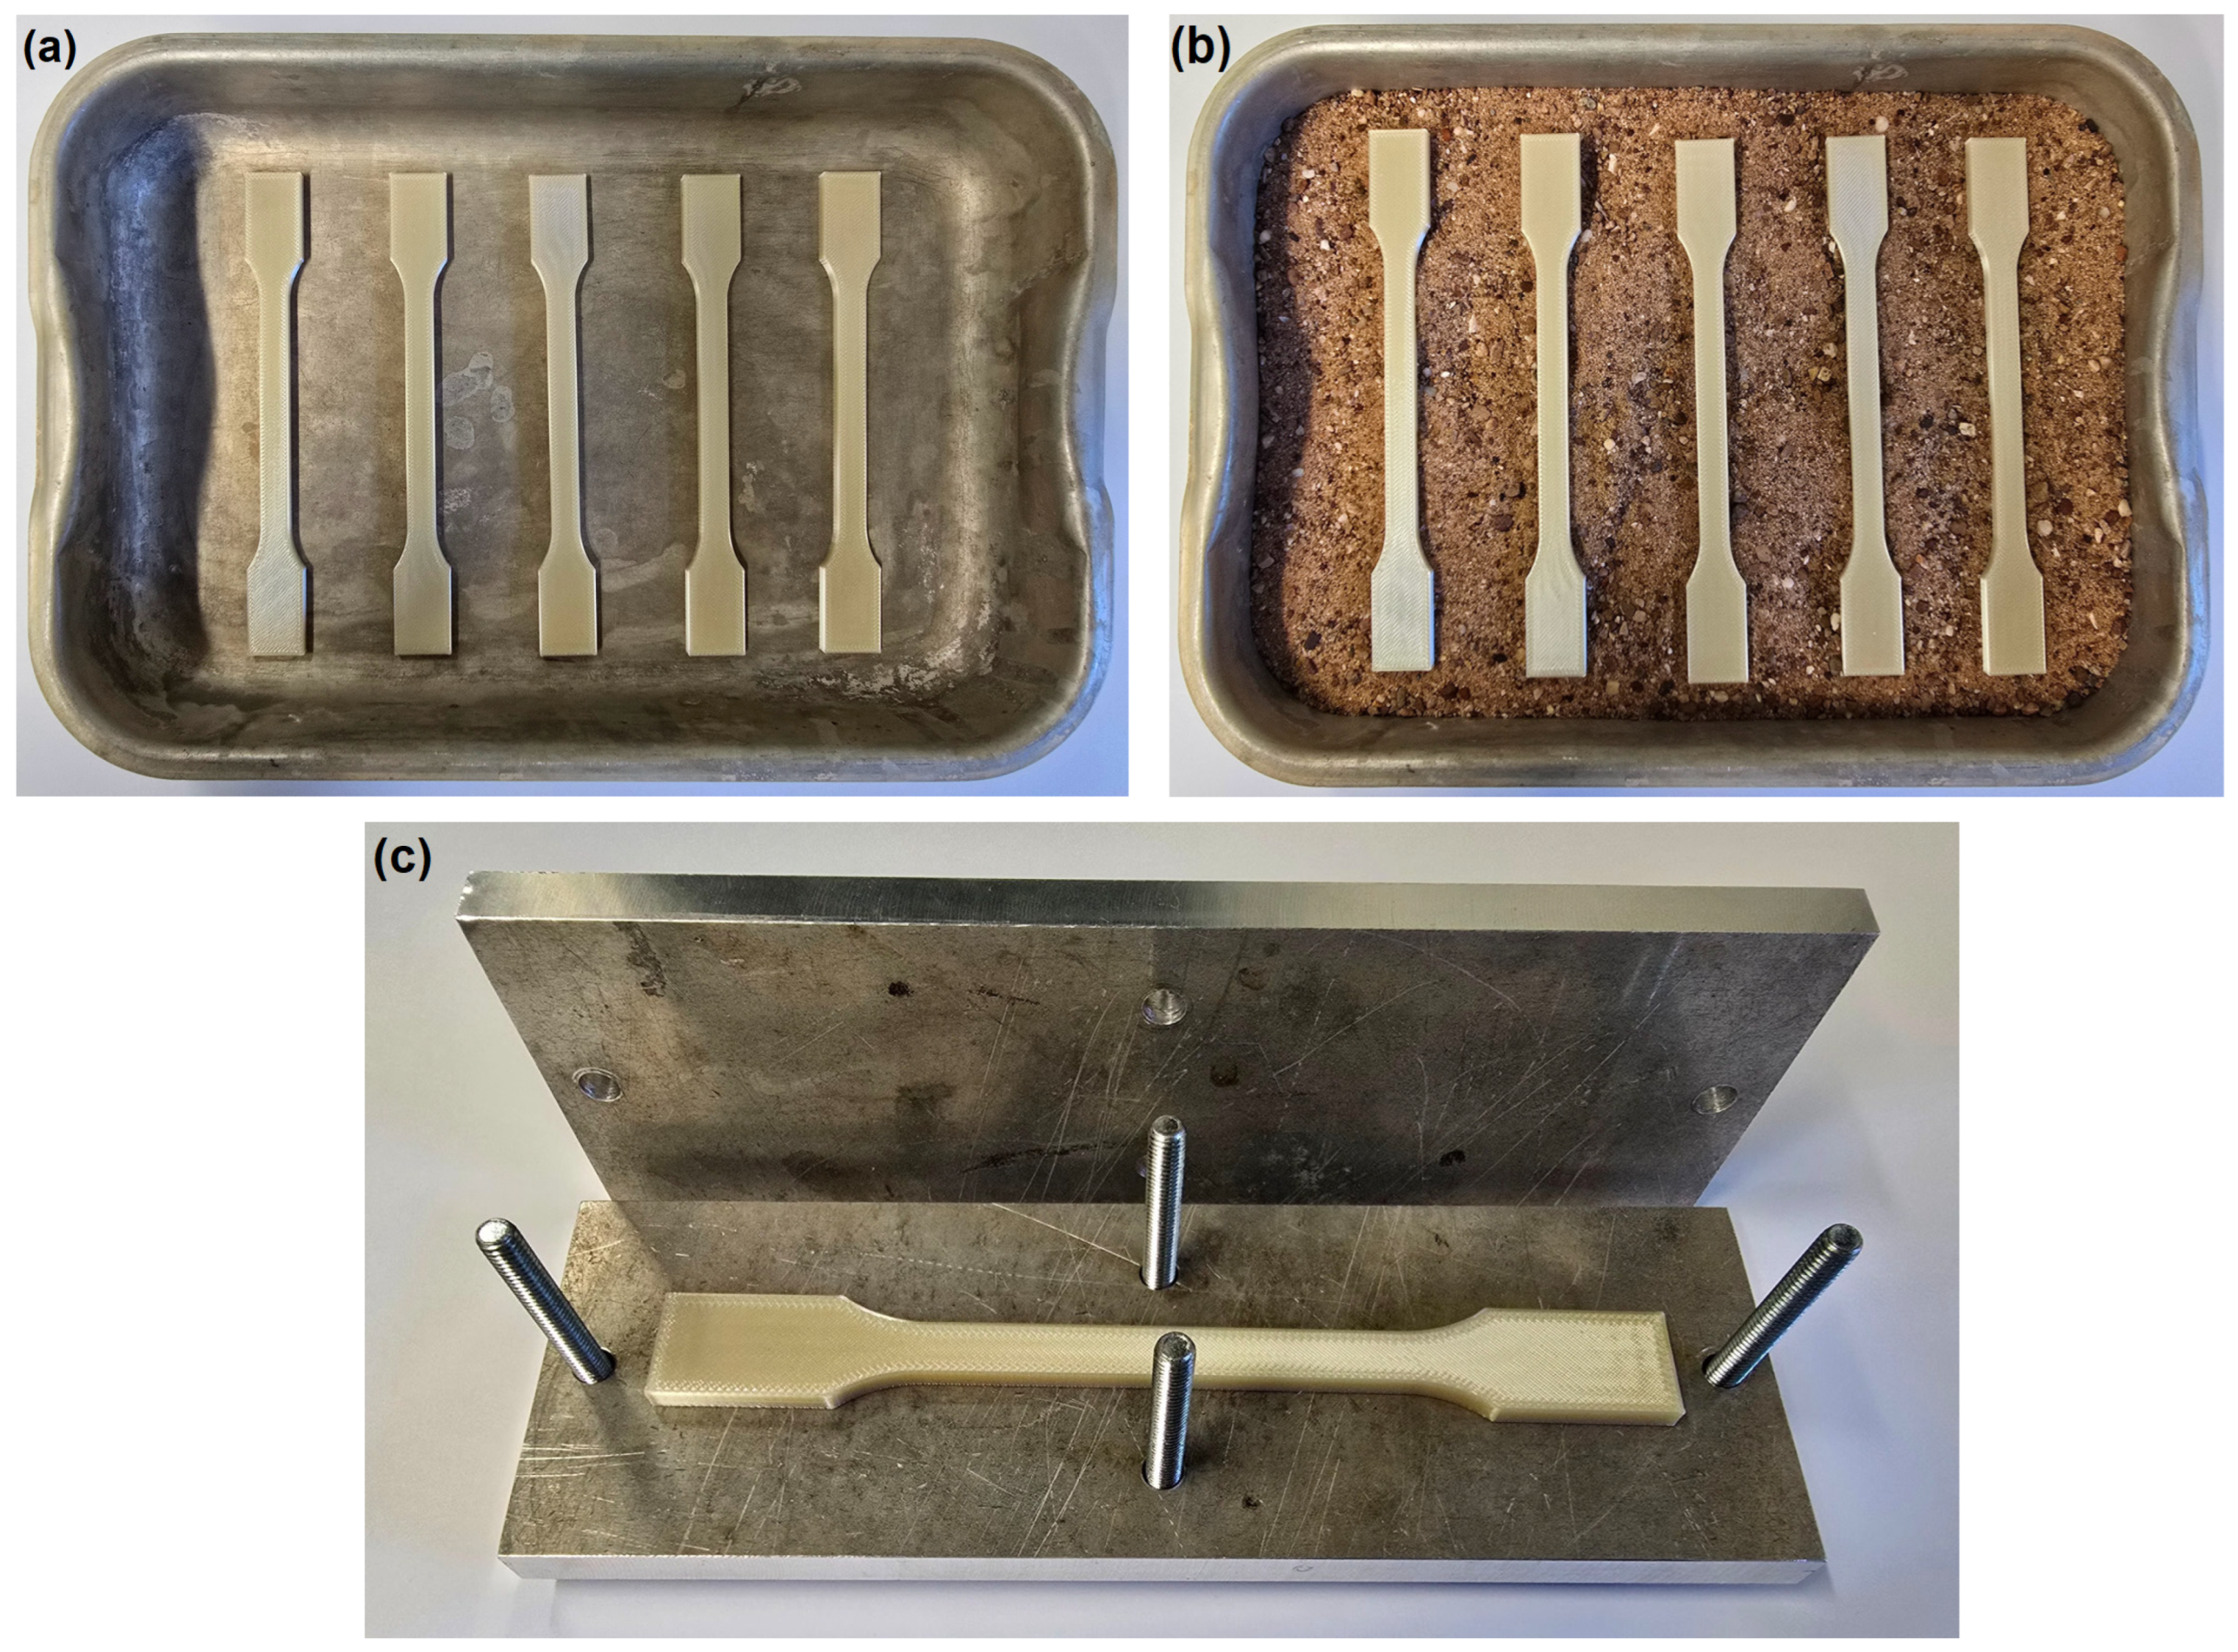
Figure 1. Dimensions and build orientation of the samples [22,23,24].
Jmmp 08 00258 g001
Figure 2. Annealing methods: (a) direct oven; (b) sand; (c) metal plate.
Jmmp 08 00258 g002
Figure 3. Surftest SJ-210 measuring the surface roughness of an ULTEM 9085 sample.
Jmmp 08 00258 g003
Figure 4. Temperature distribution on ULTEM 9085 samples at 200 °C for 1 h, followed by cooling.
Jmmp 08 00258 g004
Figure 5. Surface roughness measurements: (a) at 180 °C; (b) at 190 °C; (c) at 200 °C.
Jmmp 08 00258 g005
Figure 6. SEM micrograph of unannealed ULTEM 9085.
Jmmp 08 00258 g006
Figure 7. SEM micrographs of the three annealing methods: (a) lowest surface roughness for metal plate annealing; (b) highest surface roughness for metal plate annealing; (c) lowest surface roughness for direct oven annealing; (d) highest surface roughness for direct oven annealing; (e) lowest surface roughness for sand annealing; (f) highest surface roughness for sand annealing.
Jmmp 08 00258 g007
Figure 8. Tensile testing results: (a) tensile strength at 180 °C; (b) elongation at break at 180 °C; (c) tensile strength at 190 °C; (d) elongation at break at 190 °C; (e) tensile strength at 200 °C; (f) elongation at break at 200 °C.
Jmmp 08 00258 g008
Figure 9. Tensile testing results with the real cross-sectional area post-annealing: (a) at 180 °C; (b) at 190 °C; (c) at 200 °C.
Jmmp 08 00258 g009
Figure 10. Hardness testing results: (a) at 180 °C; (b) at 190 °C; (c) at 200 °C.
Jmmp 08 00258 g010
Figure 11. Three-point flexural testing results: (a) at 180 °C; (b) at 190 °C; (c) at 200 °C.
Jmmp 08 00258 g011
Figure 12. SEM micrograph for the fracture surface of unannealed ULTEM 9085.
Jmmp 08 00258 g012
Figure 13. SEM micrographs for the fracture surfaces of the three annealing methods: (a) lowest tensile strength fracture surface for direct oven annealing; (b) highest tensile strength fracture surface for direct oven annealing; (c) lowest tensile strength fracture surface for metal plate annealing; (d) highest tensile strength fracture surface for metal plate annealing; (e) lowest tensile strength fracture surface for sand annealing; (f) highest tensile strength fracture surface for sand annealing.
Jmmp 08 00258 g013aJmmp 08 00258 g013b
Figure 14. Surface plots: (a) average surface roughness; (b) average tensile strength; (c) average hardness; (d) average flexural strength.
Jmmp 08 00258 g014
Table 1. Annealing temperatures and times.
Annealing Time (h)Annealing Temperature (°C)
1180
1190
1200
2180
2190
2200
3180
3190
3200
Table 2. Dimensional analysis of ULTEM 9085 samples.
Annealing MethodsTime (h)Temperature (°C)Δ Length (%) (±SD)Δ Width (%) (±SD)Δ Thickness (%) (±SD)
Direct oven1180−0.524 (0.22)−0.106 (0.01)1.245 (0.02)
1190−0.995 (0.32)−0.153 (0.03)1.895 (0.02)
1200−1.937 (0.15)−1.226 (0.04)3.317 (0.03)
2180−0.455 (0.24)0 (0)1.656 (0.06)
2190−1.1 (0.31)−0.076 (0.01)2.369 (0.07)
2200−1.942 (0.15)−1.688 (0.06)3.309 (0.09)
3180−0.567 (0.21)−0.114 (0.03)1.176 (0.05)
3190−1.135 (0.23)−0.46 (0.05)2.432 (0.04)
3200−1.469 (0.25)−0.543 (0.05)3.095 (0.08)
Sand1180−0.128 (0.12)0 (0)0.943 (0.01)
1190−0.725 (0.15)−0.153 (0.03)1.654 (0.04)
1200−0.843 (0.21)−0.536 (0.05)1.418 (0.05)
2180−0.322 (0.16)−0.076 (0.01)0 (0)
2190−0.731 (0.19)−0.306 (0.04)1.176 (0.06)
2200−1.381 (0.27)−1.61 (0.05)2.117 (0.09)
3180−0.362 (0.35)−0.076 (0.01)0.235 (0.01)
3190−0.761 (0.28)−0.23 (0.02)0.705 (0.02)
3200−1.171 (0.38)−1.911 (0.06)2.619 (0.07)
Metal plate1180−0.304 (0.14)0.306 (0.04)−1.654 (0.05)
1190−0.433 (0.12)0.229 (0.03)−2.576 (0.08)
1200−0.362 (0.18)0.613 (0.04)−3.301 (0.09)
2180−0.403 (0.22)0.306 (0.02)−1.891 (0.04)
2190−0.357 (0.28)0.460 (0.02)−1.869 (0.04)
2200−0.333 (0.39)0.304 (0.02)−2.863 (0.06)
3180−0.374 (0.31)0.298 (0.01)−1.184 (0.04)
3190−0.316 (0.39)0.766 (0.04)−2.843 (0.08)
3200−0.292 (0.42)1.377 (0.05)−3.739 (0.09)
Table 3. Description of the optimal combinations.
Annealing MethodAnnealing
Temperature (°C)
Annealing Time (h)Surface Roughness (μm)Tensile Strength (MPa)Hardness (HD)Flexural Strength (MPa)
Direct oven190318.687.580.5104.8
Metal plate190115.985.881.6106.3
Disclaimer/Publisher’s Note: The statements, opinions and data contained in all publications are solely those of the individual author(s) and contributor(s) and not of MDPI and/or the editor(s). MDPI and/or the editor(s) disclaim responsibility for any injury to people or property resulting from any ideas, methods, instructions or products referred to in the content.