1. Introduction
During the last decade, an enhanced demand for lightweight materials in automotive applications has resulted in the growth of the use of thermoplastic-discontinuous fiber composites [
1]. The increased growth of the use of these thermoplastic matrix composite systems is due to the combination of mechanical properties and melt processability. Long-fiber (lengths > 1 mm) thermoplastic composites (LFTs) possess significant advantages over short fiber (<1 mm) composites in terms of their mechanical properties while retaining their ability to be injection molded [
2]. The goal of this research is to improve the stiffness properties predictions for injection molded LFTs. During the plasticating stage of injection molding, significant fiber attrition will occur leading to a broad fiber length distribution (FLD) [
3]. Fiber orientation distribution (FOD) is another highly anisotropic feature of the final injection molded parts induced by the mold filling process [
4]. Mechanical properties of LFTs are highly dependent on these microstructural variables imparted by the injection molding process [
5].
The computation of the elastic stiffness for the aligned and monodispersed short fiber composites was well studied by a large range of people. Tucker et al. [
6] reviewed the micromechanical models for this type of composite. By comparing the standard micromechanical models with their finite element method, the authors have shown that the Halpin-Tsai equation gives reasonable estimates for stiffness, but the best predictions come from the Mori-Tanaka model based on the Eshelby’s equivalent inclusion method. A similar conclusion was reached by Hine [
7]. Ingber and Papathanasiou [
8] found the variant of the Halpin-Tsai model is in very good agreement with their boundary element method (numerical simulation) for their entire range of fiber volume contents and aspect ratios, although they had no experimental data for comparison. These models for aligned and monodispersed fiber composites can predict the properties of a representative volume element that can subsequently be averaged to include effects of fiber length and orientation distributions of a real injection molded material. Hine et al. [
7] carried out a numerical simulation using a distribution of fiber lengths generated by the Monte-Carlo technique. Garesci et al. [
5] applied the fitted probability density function to get the averaged property from each single fiber length. A relatively concise way is to replace the FLD with some sort of mean fiber length [
7,
9,
10]. The most widely used orientation-averaging scheme is to use second and/or fourth order orientation tensors developed by Tucker and Advani [
4] to average the property constants. Hine et al. [
11] have shown that the results determined by the constant strain orientation averaging method (assuming the units have the same strain and average their stiffness constants) were in good agreement with their numerical simulations.
There exists very little modeling work for predicting stiffness properties on injection molded LFTs [
5]. The scenario of the LFTs is different from the works that studied short fiber composite. LFTs injection molding pellets prepared by the pultrusion technique have received much attention. In particular, the fibers are in the form of aligned fiber bundles coated by thermoplastic matrix, which produces pellets with much higher fiber contents than those of more conventional ‘short-fiber’ compounds. During the compounding process, filamentization of fiber bundles and fracture of the resultant monofilaments into elements of a lower aspect ratio lead to the dispersion of fibers into the polymer matrix [
12]. For high content fiber composites, the presence of fiber bundles seems to be unavoidable which could result in a reinforcement with a much lower aspect ratio and effective stiffness than well-dispersed fibers, consequently giving a lower and even decreasing stiffness [
13]. However, the existing stiffness models assume the fibers are fully and evenly dispersed in the matrix. The predicted values keep increasing with the fiber content, which is not true within commercial fiber concentration for injection molded LFTs [
13,
14]. In this paper, we report on the development of an empirical model to correct the fibers’ aspect ratio for the actual as-formed LFTs with fiber bundles under high fiber content. After the correction, the analytical predictions show good agreement with the experimental stiffness values from tensile tests on the LFTs for the whole fiber content range investigated. Our analysis shows that it is essential to incorporate the effect of the presence of fiber bundles to accurately predict the composite properties.
3. Materials and Methods
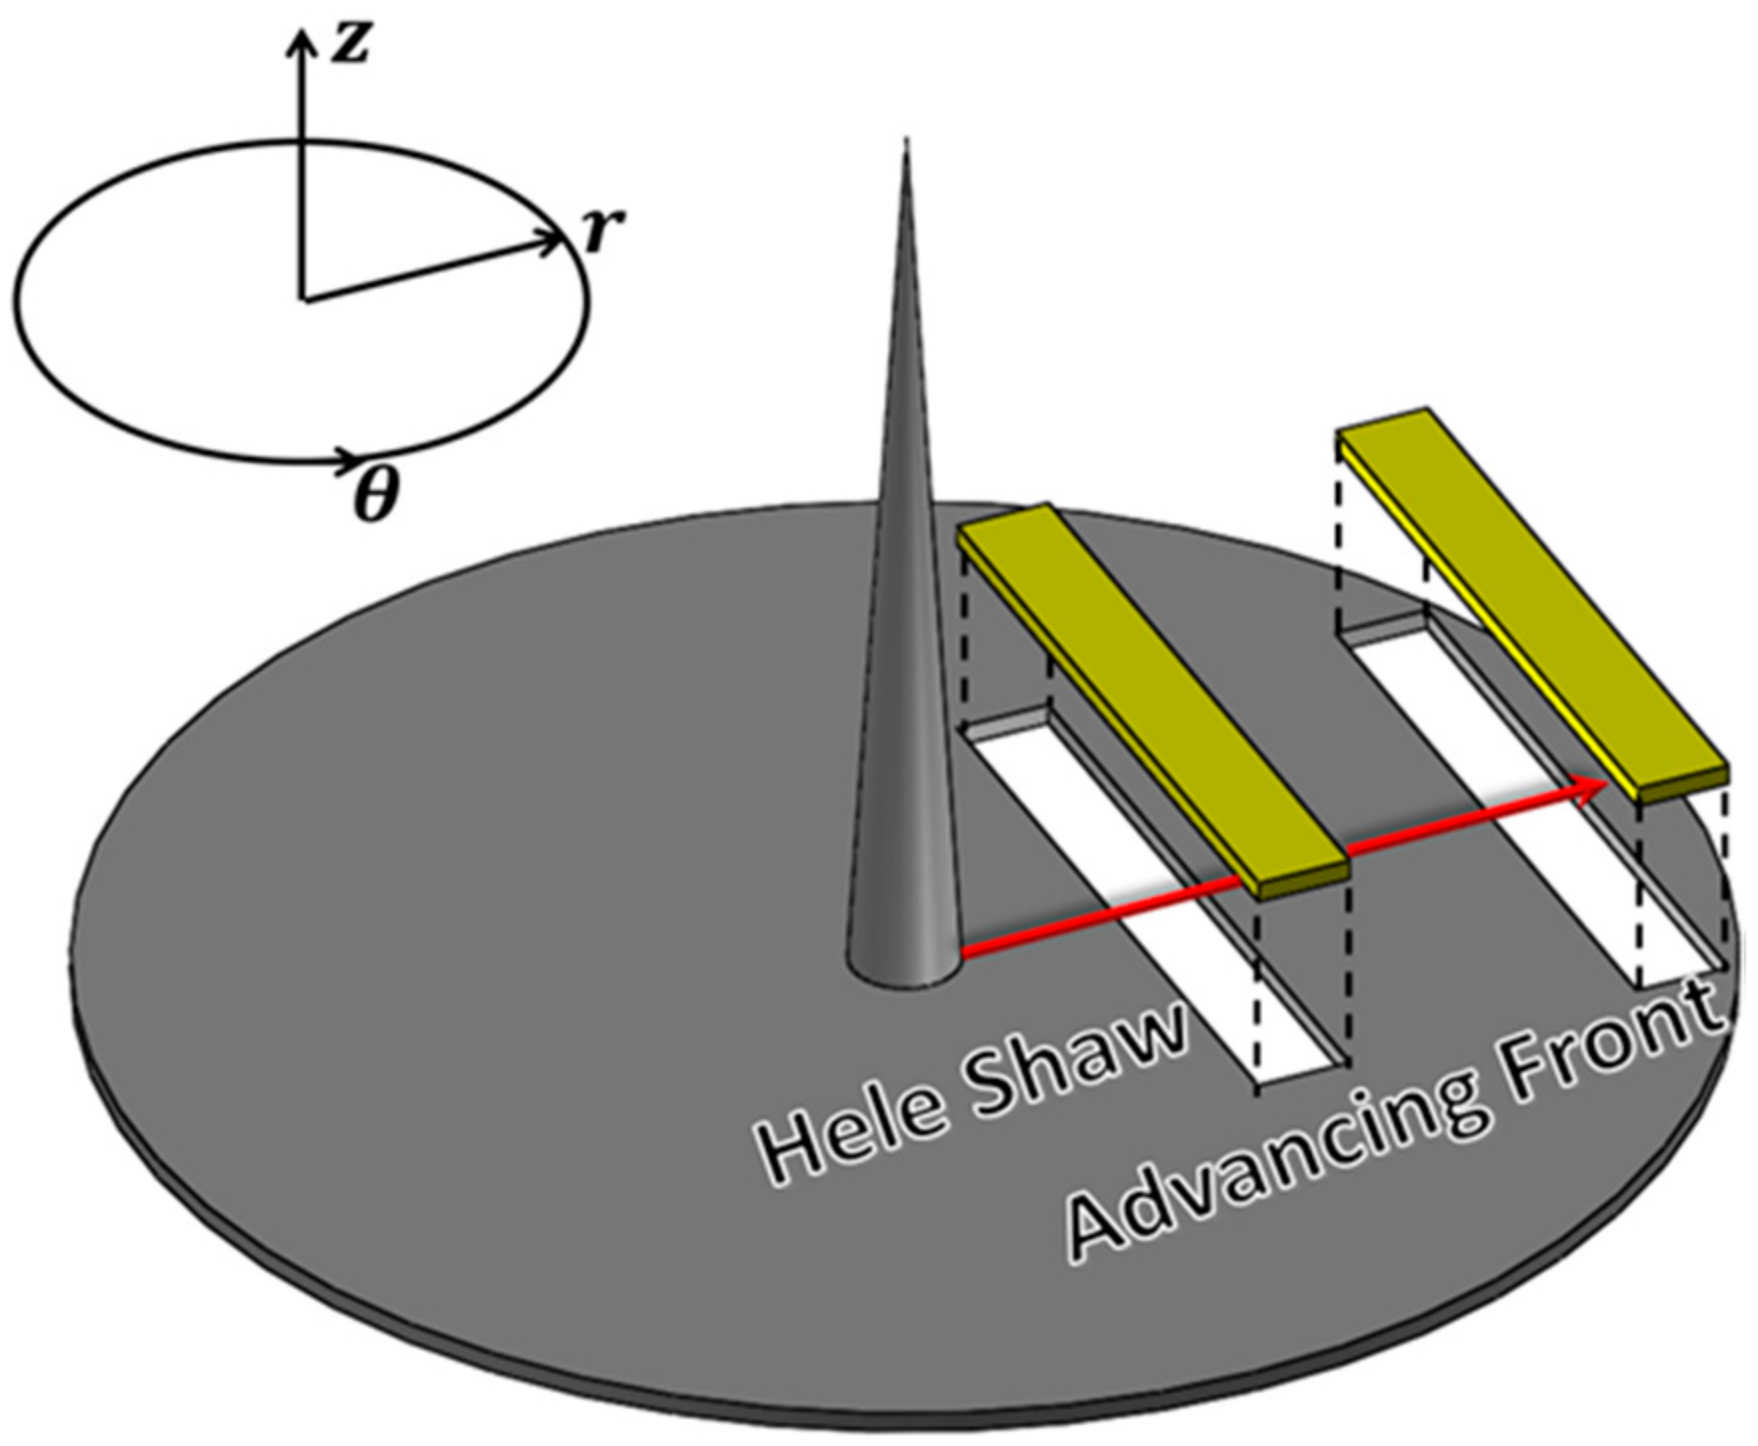
The composites under investigation were 10 wt%, 30 wt%, 40 wt%, and 50 wt% glass fibers in a polypropylene matrix. The material was received from SABIC Innovative Plastics (Ottawa, IL, USA) as 12.5 mm long pellets created through a pultrusion process in 30 wt% and 50 wt% formulations. Samples with 10 wt% fibers were diluted with neat polypropylene, while 30 wt% and 50 wt% pellets were used to create the 40 wt% composites. The pellets contain a unidirectional bundle of fibers that must be dispersed during the injection molding process, specifically in the plasticating unit. Center-gated disk geometries were formed by injection molding as shown in
Figure 1. In this study, the Hele-Shaw region (60% disk radius) and the advancing front region (85% disk radius) were investigated for fiber length, fiber orientation, and mechanical properties. Tensile specimens were cut from the injection-molded samples, and the young’s modulus was measured according to ASTM D3039 [
22] for polymer matrix composite materials.
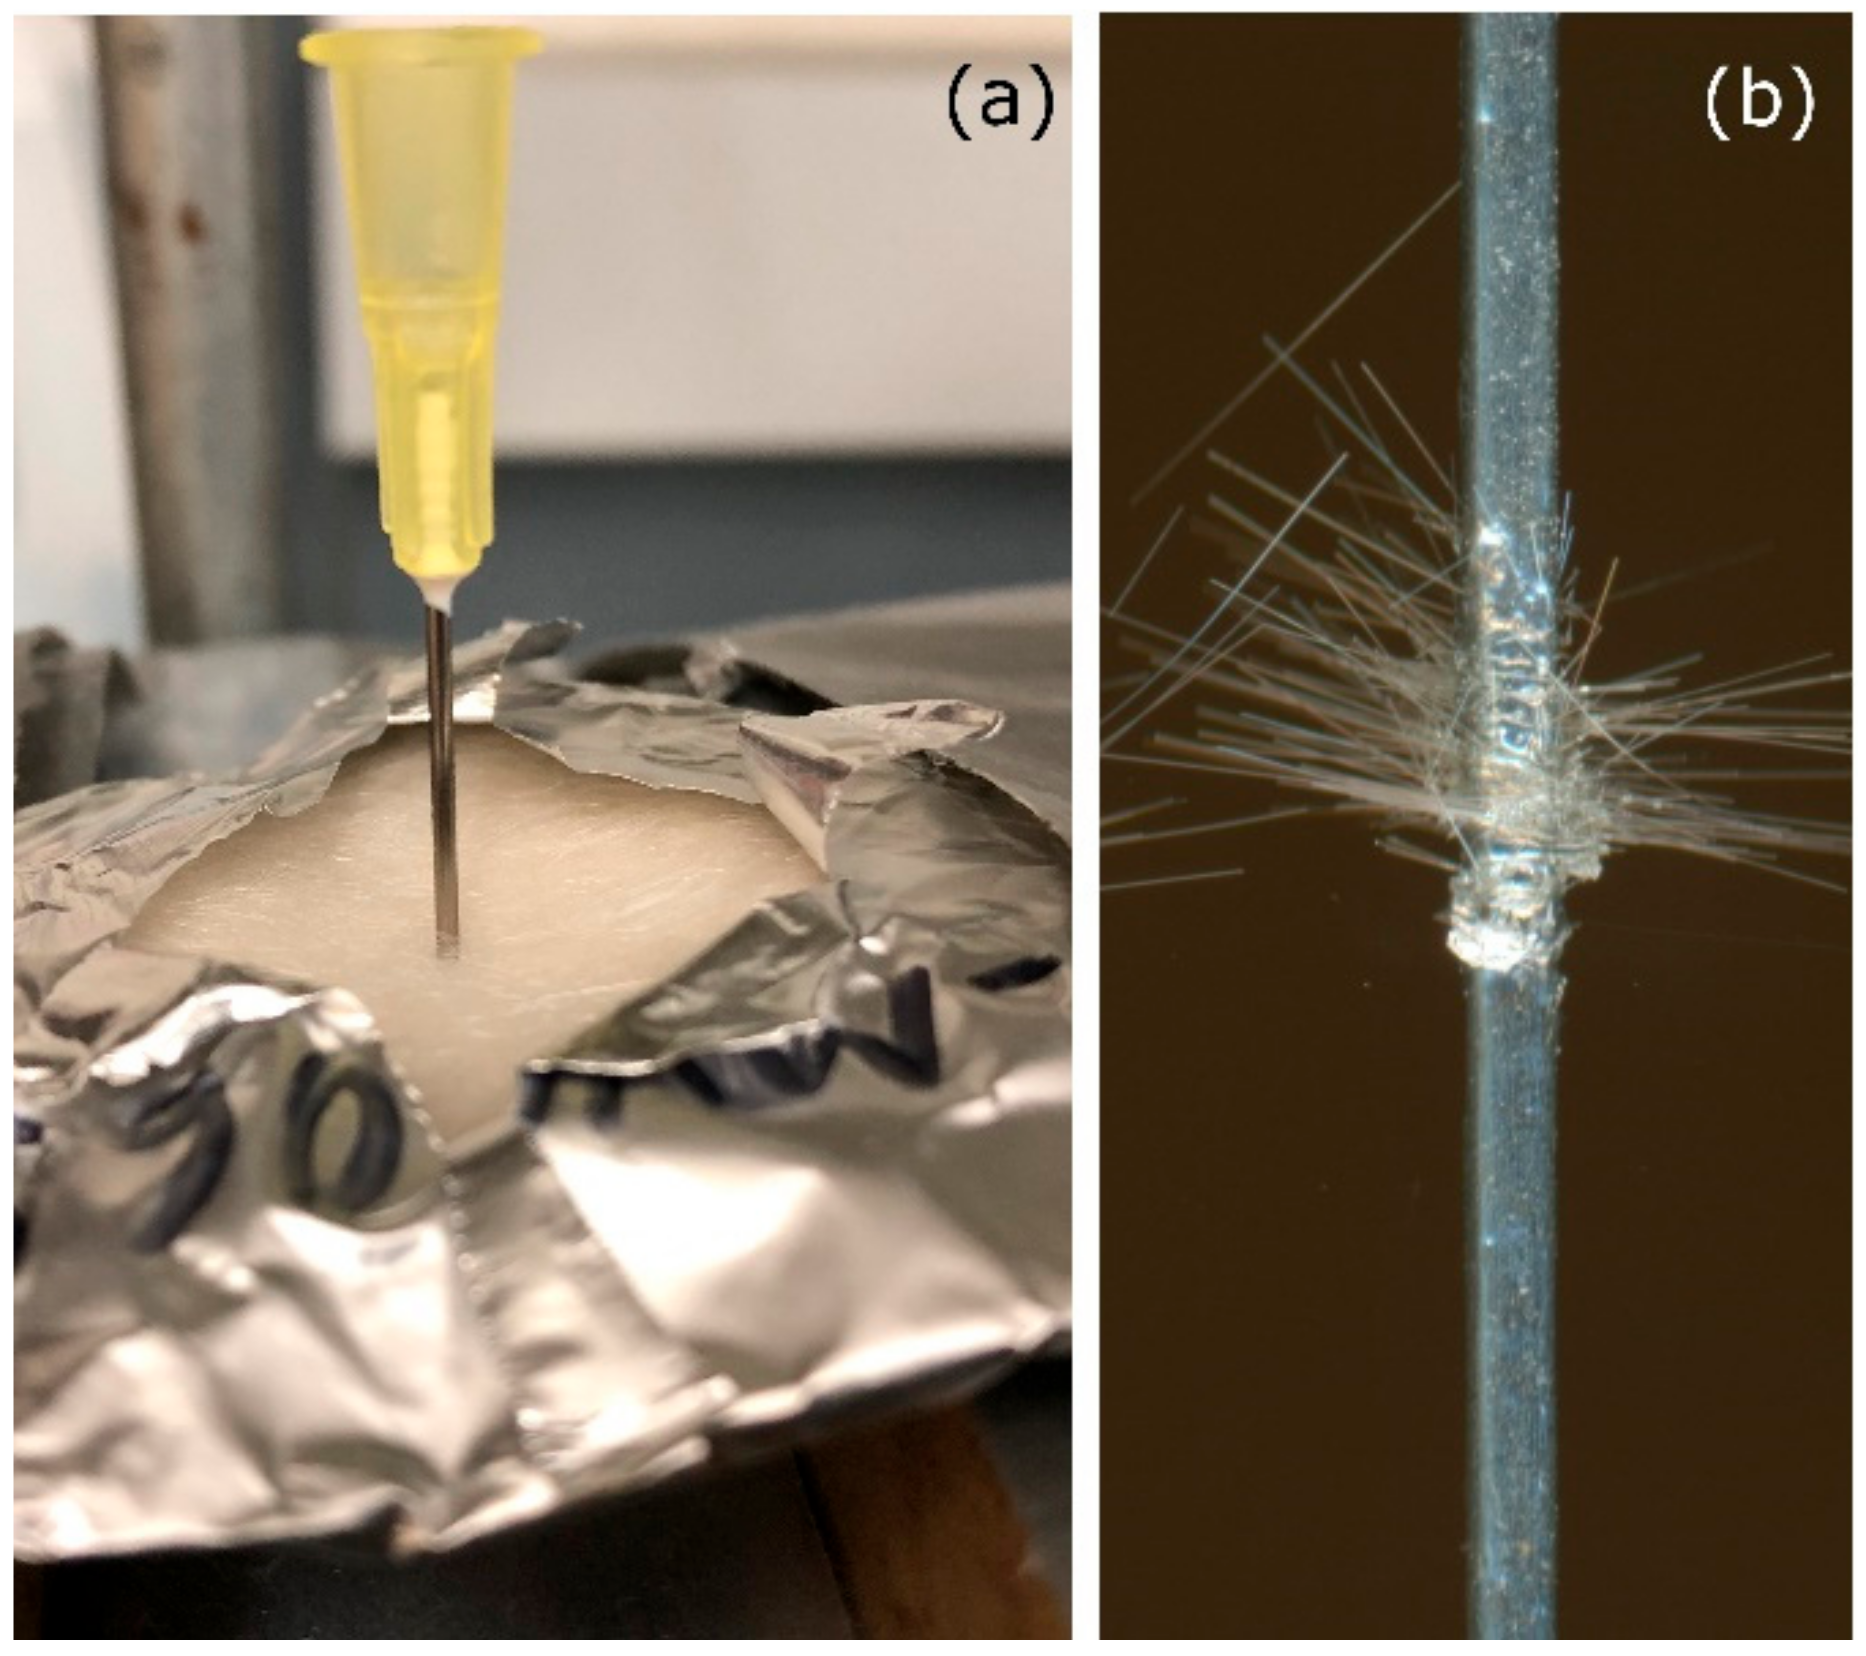
For fiber length measurement, a method based on Reference [
23] was modified as follows: Instead of directly injecting epoxy into the samples after the burning off of the polymer matrix, a needle coated with epoxy was inserted into the sample all the way through the thickness direction shown in
Figure 2a. As a result, fibers at this location were collected by the epoxy on the needle as shown in
Figure 2b. Due to this sampling method, there was biased toward longer fibers, and the measured fiber length was then corrected based on the length of each fiber and the diameter of the needle with epoxy coating. The needle with the fibers was re-burned to get rid of the epoxy. Loose glass fibers were then dispersed on a desktop scanner and imaged at 3200 dpi. At least 3000 fibers per sample were measured using our in-house developed MATLAB
® codes. The fiber length distribution followed the typical log-normal distribution commonly observed for fiber composites. Three samples were used to produce the averages in
Table 1. The number average (
) and weight average (
) fiber lengths were calculated according to Equations (4) and (5), respectively. It can be seen that the average fiber lengths in these samples are reduced with increasing fiber content.
Measurements of fiber orientation were also made to further investigate its relationship to the stiffness performance at the same locations. Orientation measurements were taken along the
-
plane, such that
denotes the flow direction with the velocity gradient in
. Samples were polished using modified metallographic techniques and oxygen plasma etched to enhance the contrast of the glass fiber and polypropylene matrix. Details of the sample preparation and orientation measurement procedure can be found in the References [
24,
25].
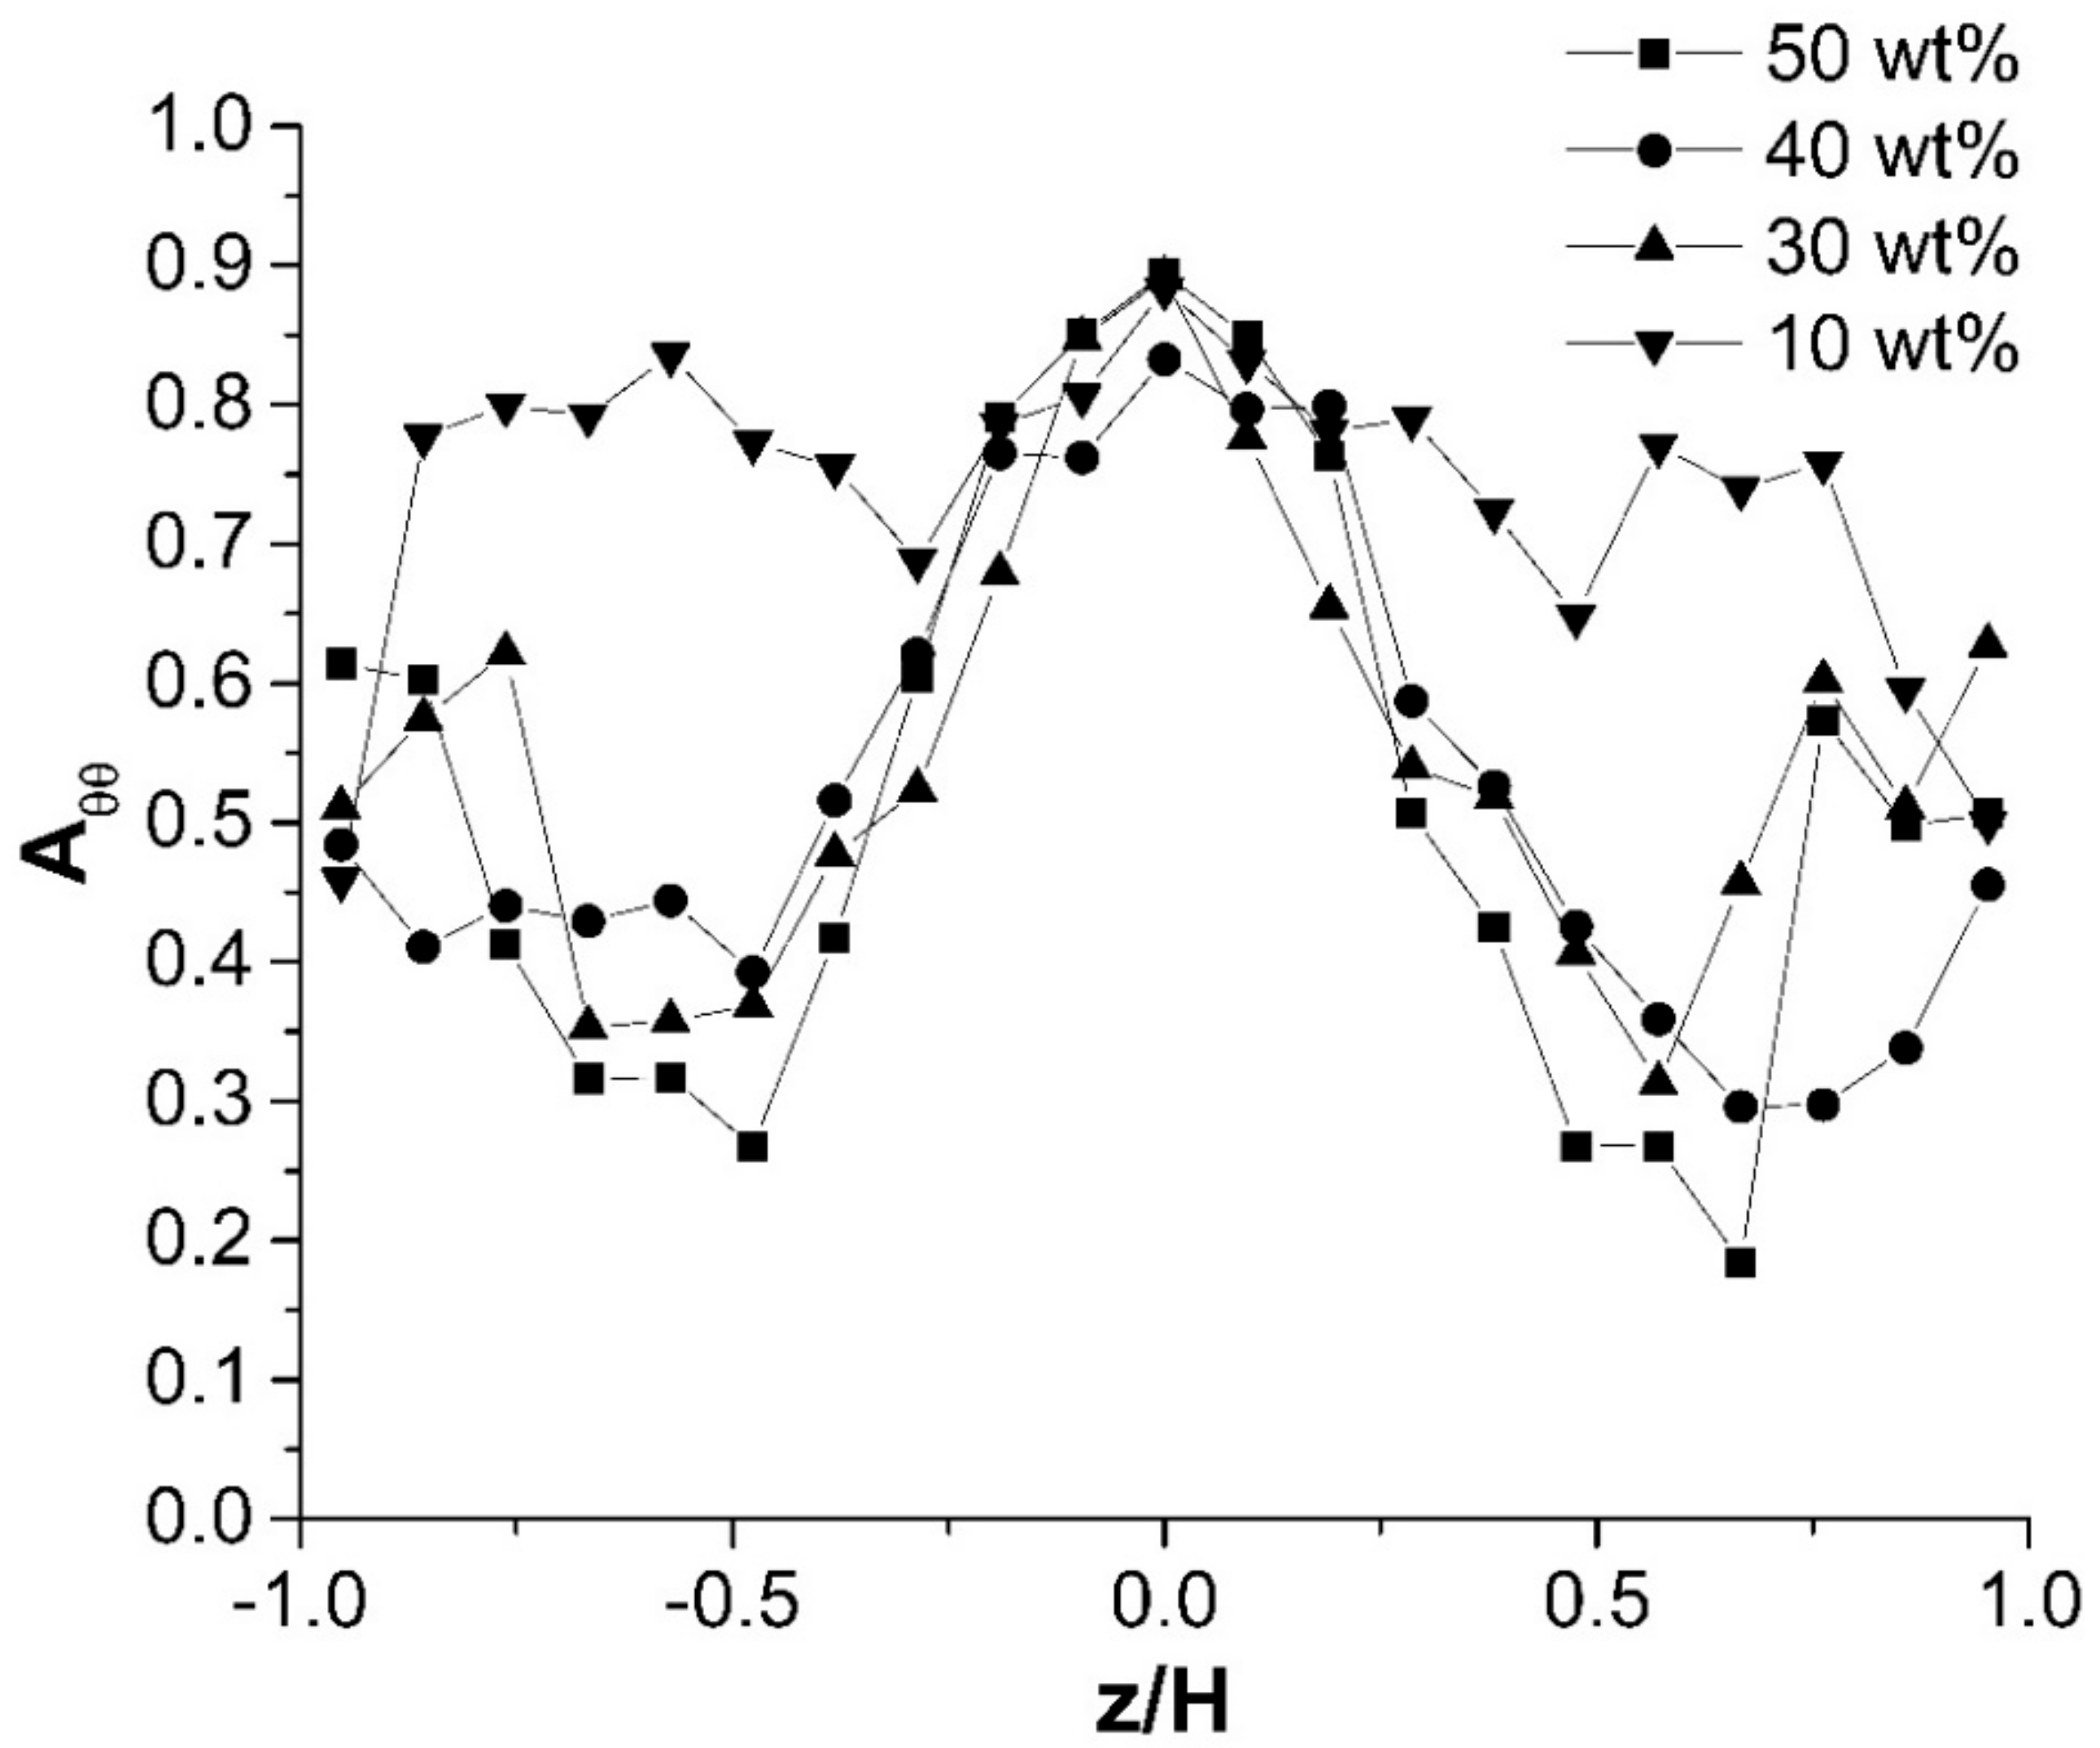
Figure 3 shows the measured through thickness fiber orientation for various glass fiber concentrations at the Hele-Shaw region. For the fiber orientation tensor,
A, the diagonal components are the most important. They describe the alignment of the population with respect to the axis of the coordinate system. A value that approaches one indicates increased alignment in that direction. Only the θ direction component is presented here, because the young’s modulus was measured along this transverse direction. At 30 wt%, 40 wt%, and 50 wt%, the through thickness fiber orientation distributions are very similar showing the characteristic shell–core–shell layer structures. Generally, the θ direction component reaches its largest value near the center of the disk, because that the center of the disk is dominated by extensional flow in this tangential direction. However, at 10 wt%, the distribution deviates significantly from the rest. The through thickness fiber orientation distribution is relatively ‘flat’ compared to those with higher fiber concentrations. This might be due to the concentration effects on the fiber orientation dynamics. At 10 wt%, the degree of fiber-fiber interaction is much less, that is to say, hindrance to fiber alignment is much less, as a result, the tangential direction alignment is quite dominant.
4. Results and Discussion
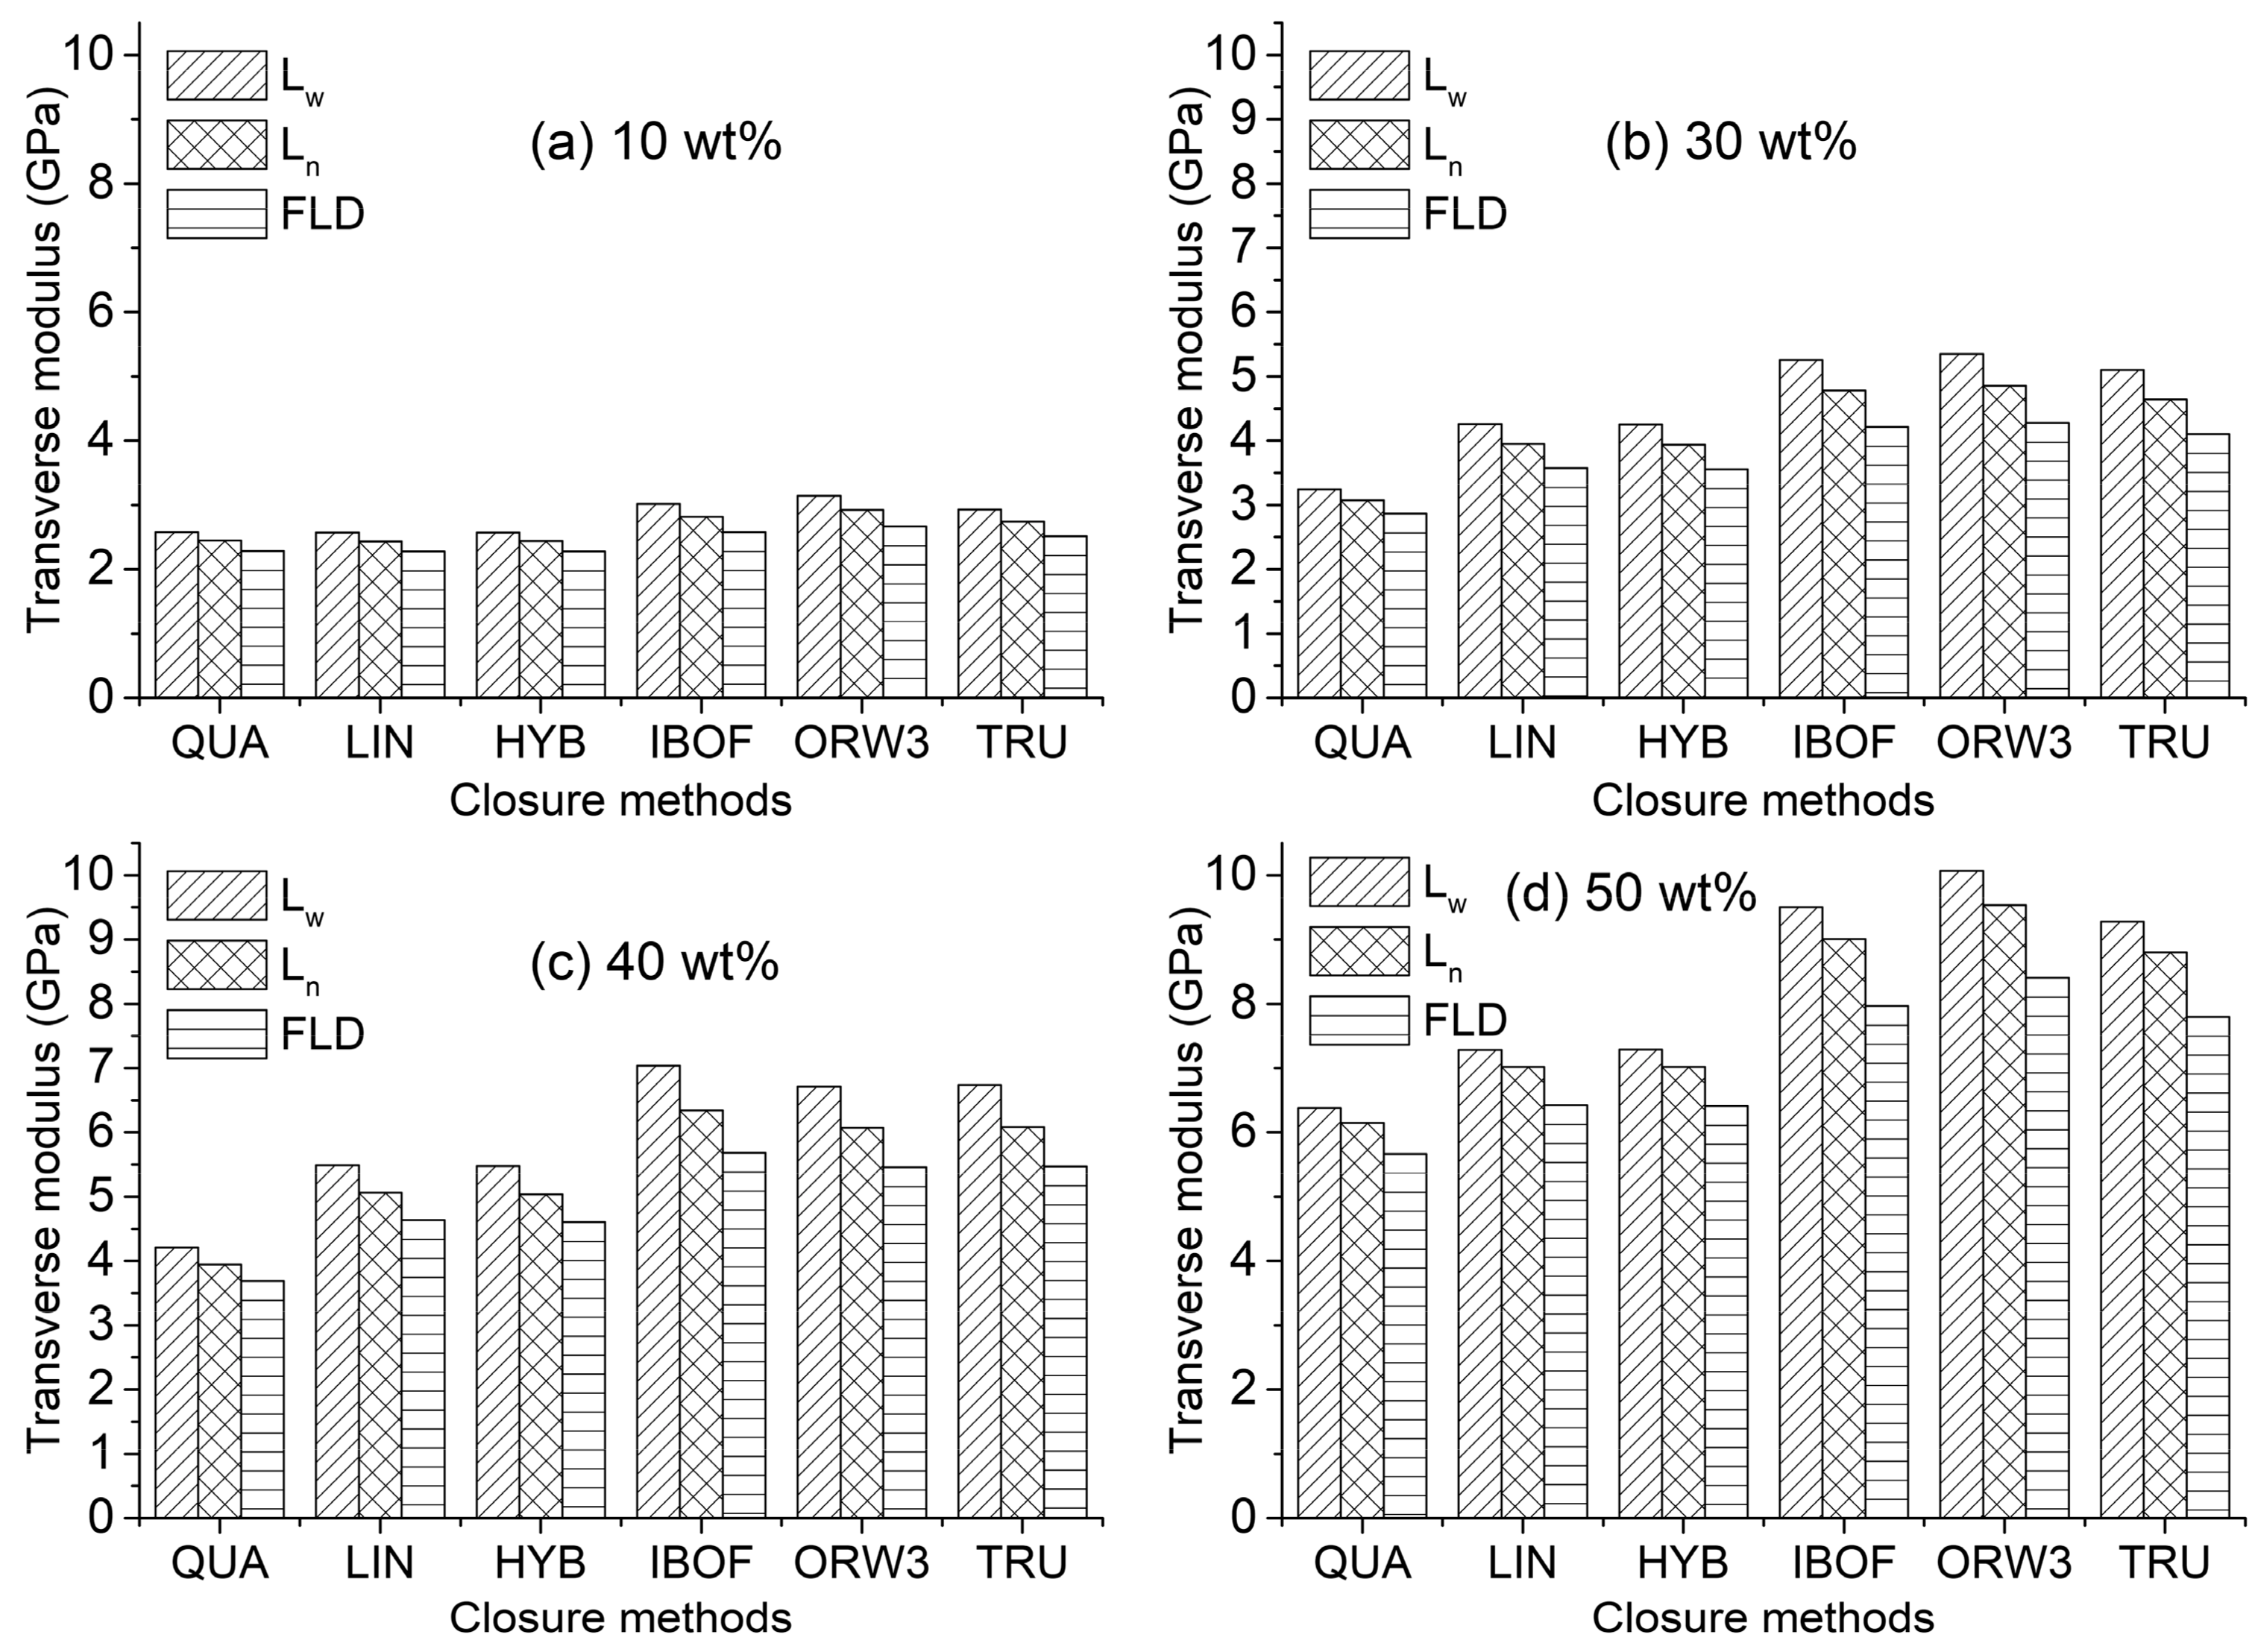
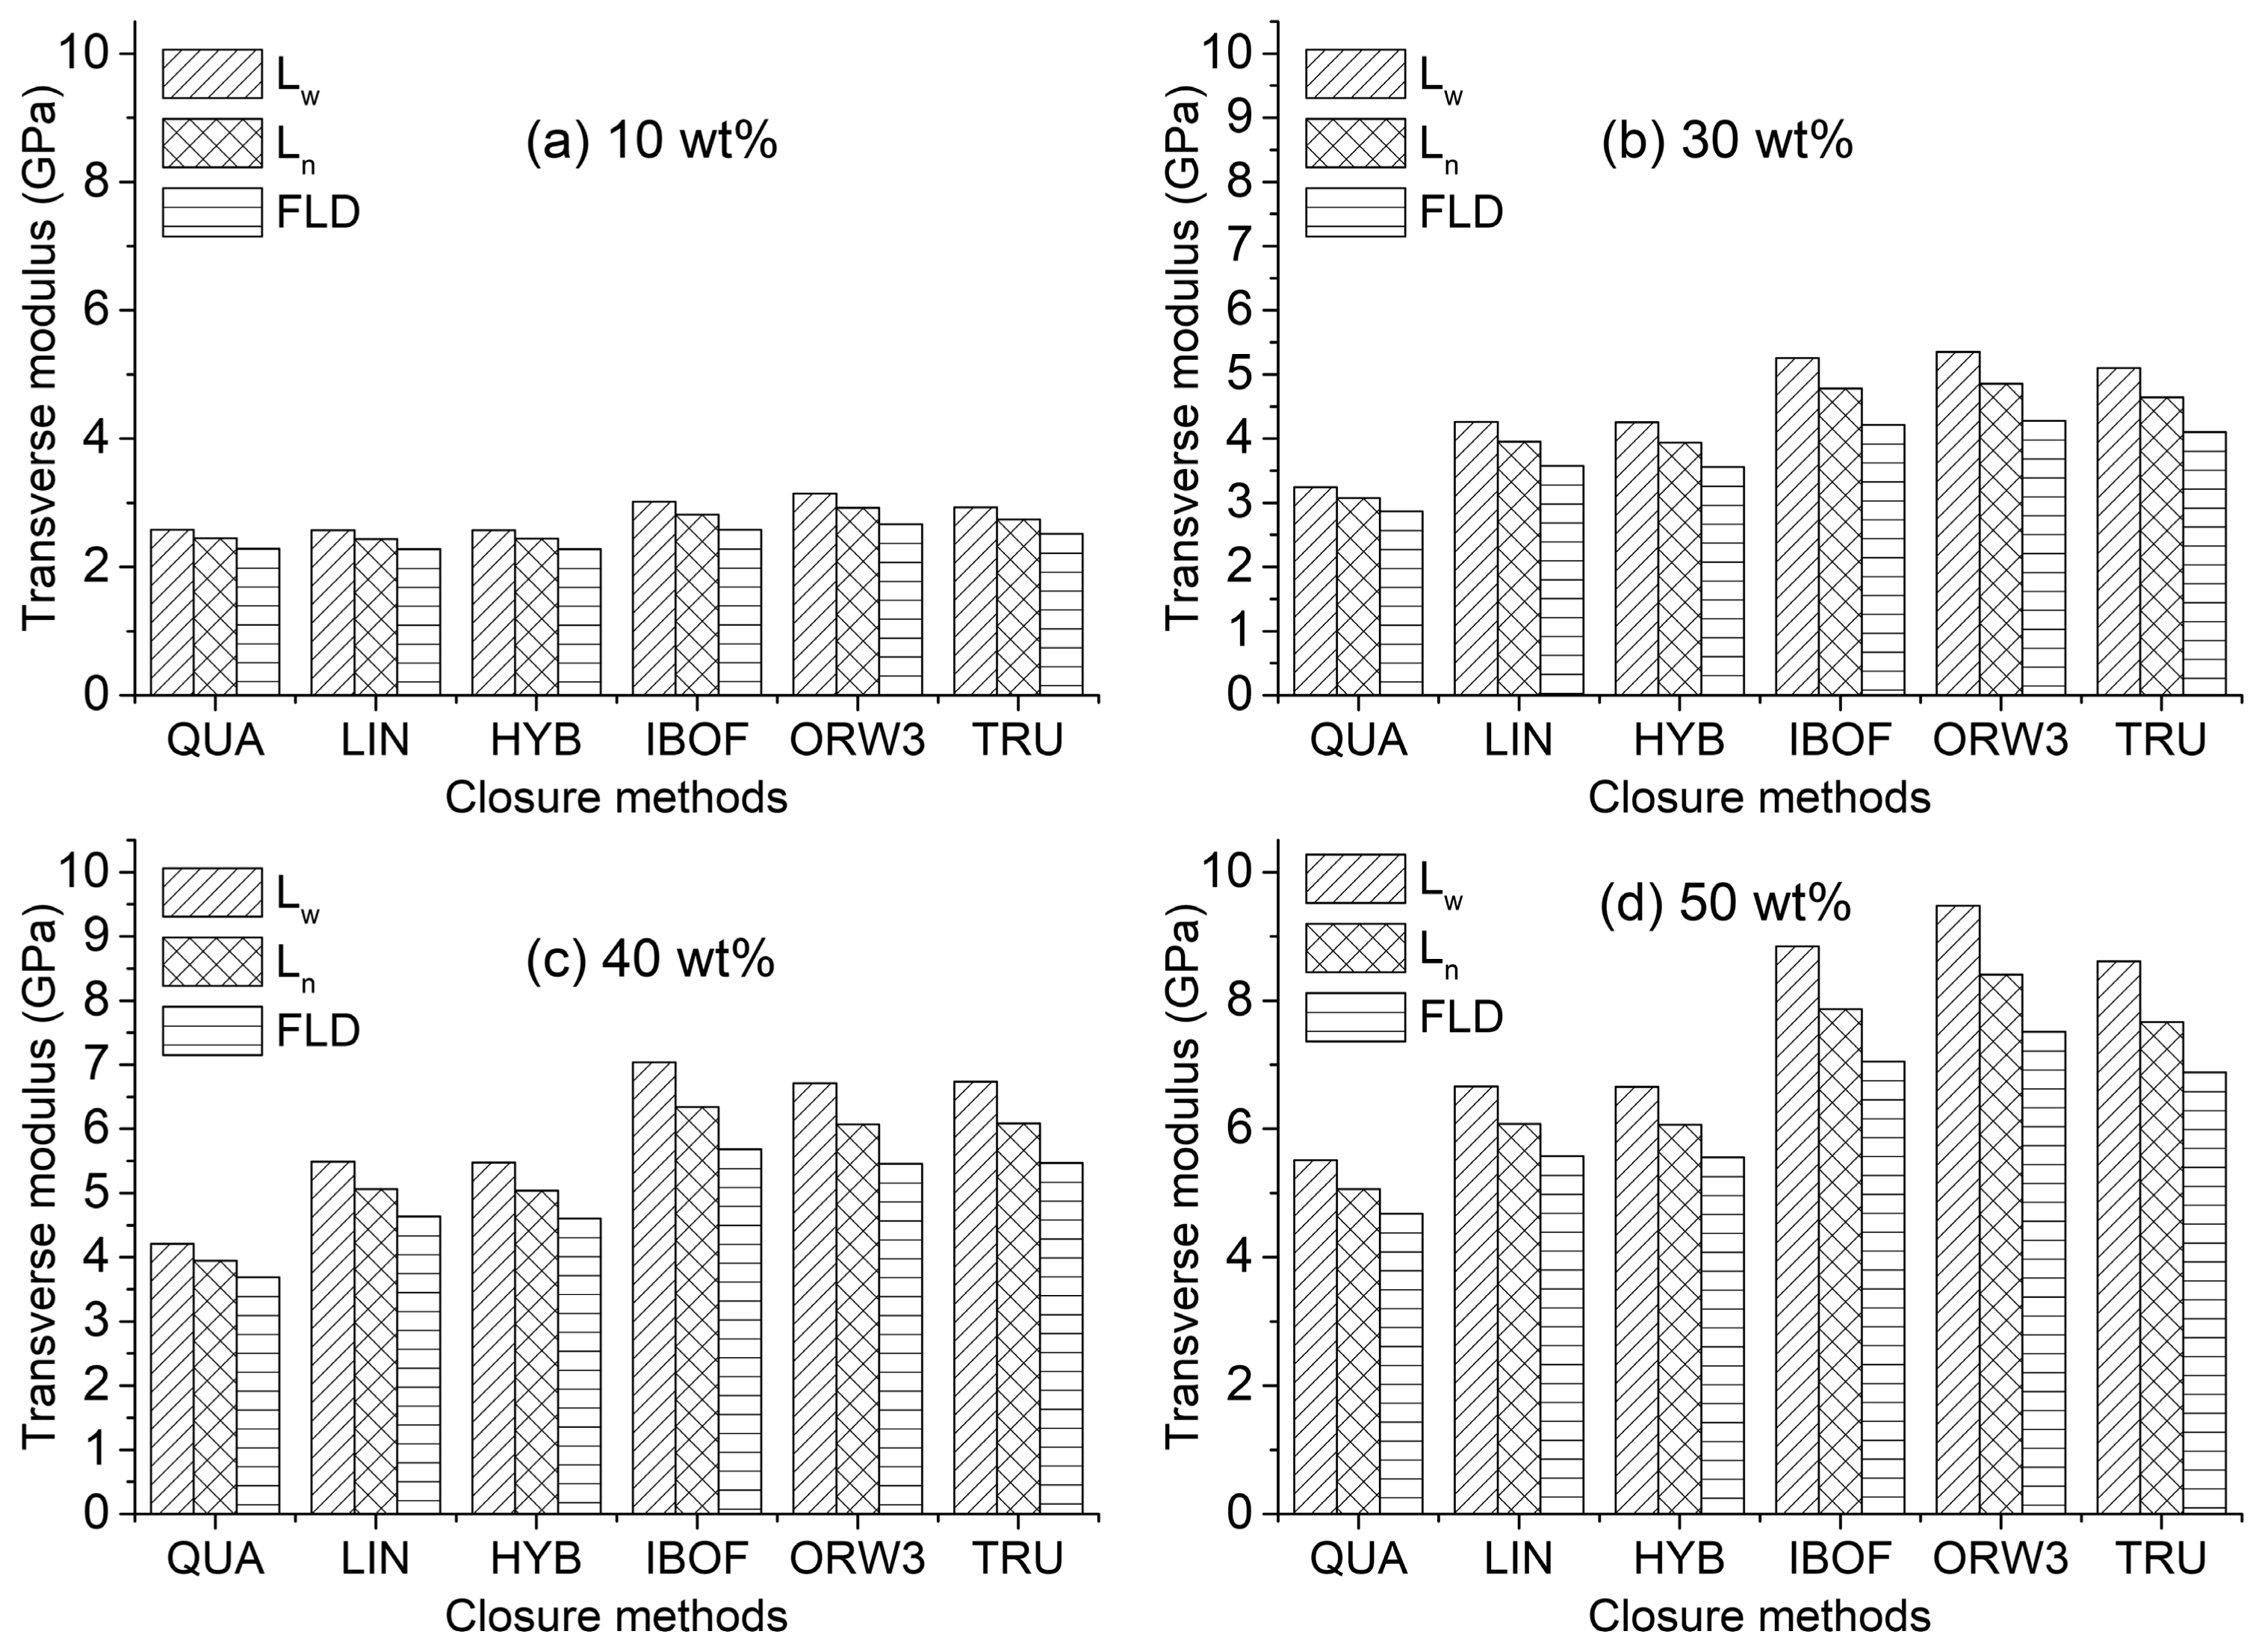
In all the calculations in this article, the measured FLD or the corresponding average fiber length (
) was input into Equations (6) or (7), while the experimental second-order tensors were used in Equation (8). To analyze the accuracy of various closure approximations for predicting the elastic properties, the fourth order orientation tensors were evaluated by the linear (LIN), quadratic (QUA), hybrid (HYB), Invariant-based optimal fitting (IBOF), and improved orthotropic (ORW3) closure approximations [
4,
18,
26,
27]. Then, the as-calculated elastic stiffness using each of these estimated fourth order tensors was compared with that using the original experimental ‘true’ fourth-order tensor (TRU) obtained from Equation (2). The comparisons of the effective engineering modulus along the tangential direction are presented in
Figure 4 and
Figure 5 applying the methods of EMT and HT, respectively. The predicted results and the general pattern with the HT and EMT methods in the studied fiber content range are very similar. Both models show a similar linear increase in the transverse modulus with increasing fiber content. However, all the values calculated from the EMT model, no matter what length parameter and closure approximation, are slightly greater than those from the HT model. Moreover, the differences between the two methods become more notable as fiber content increases. In Tucker and Liang’s [
6] review of the stiffness predictions for unidirectional fiber composites, for composites with an aspect ratio larger than 10, the EMT also has predicted greater values of the dominant modulus than the HT model. To answer the question which closure method or methods are the best for stiffness prediction purposes, the results calculated using the experimental fourth order orientation tensors are used as criteria. It seems that, for the entire fiber content range and all the scenarios using different fiber length parameters (FLD,
, and
), the magnitudes of IBOF and ORW3 predictions are the most comparable to the criteria. Another aspect of this paper is to examine the effects of the length parameters (FLD,
, and
) on the stiffness predictions for injection molded LFTs. It is seen that, the predictions of the
parameters lie between the largest values generated by the
parameters and the smallest predictions from the measured FLD. This result indicates that, for the purpose of replacing the FLD by an average fiber length in the computation, the
might outperform the
in terms of generating a better match with the FLD.
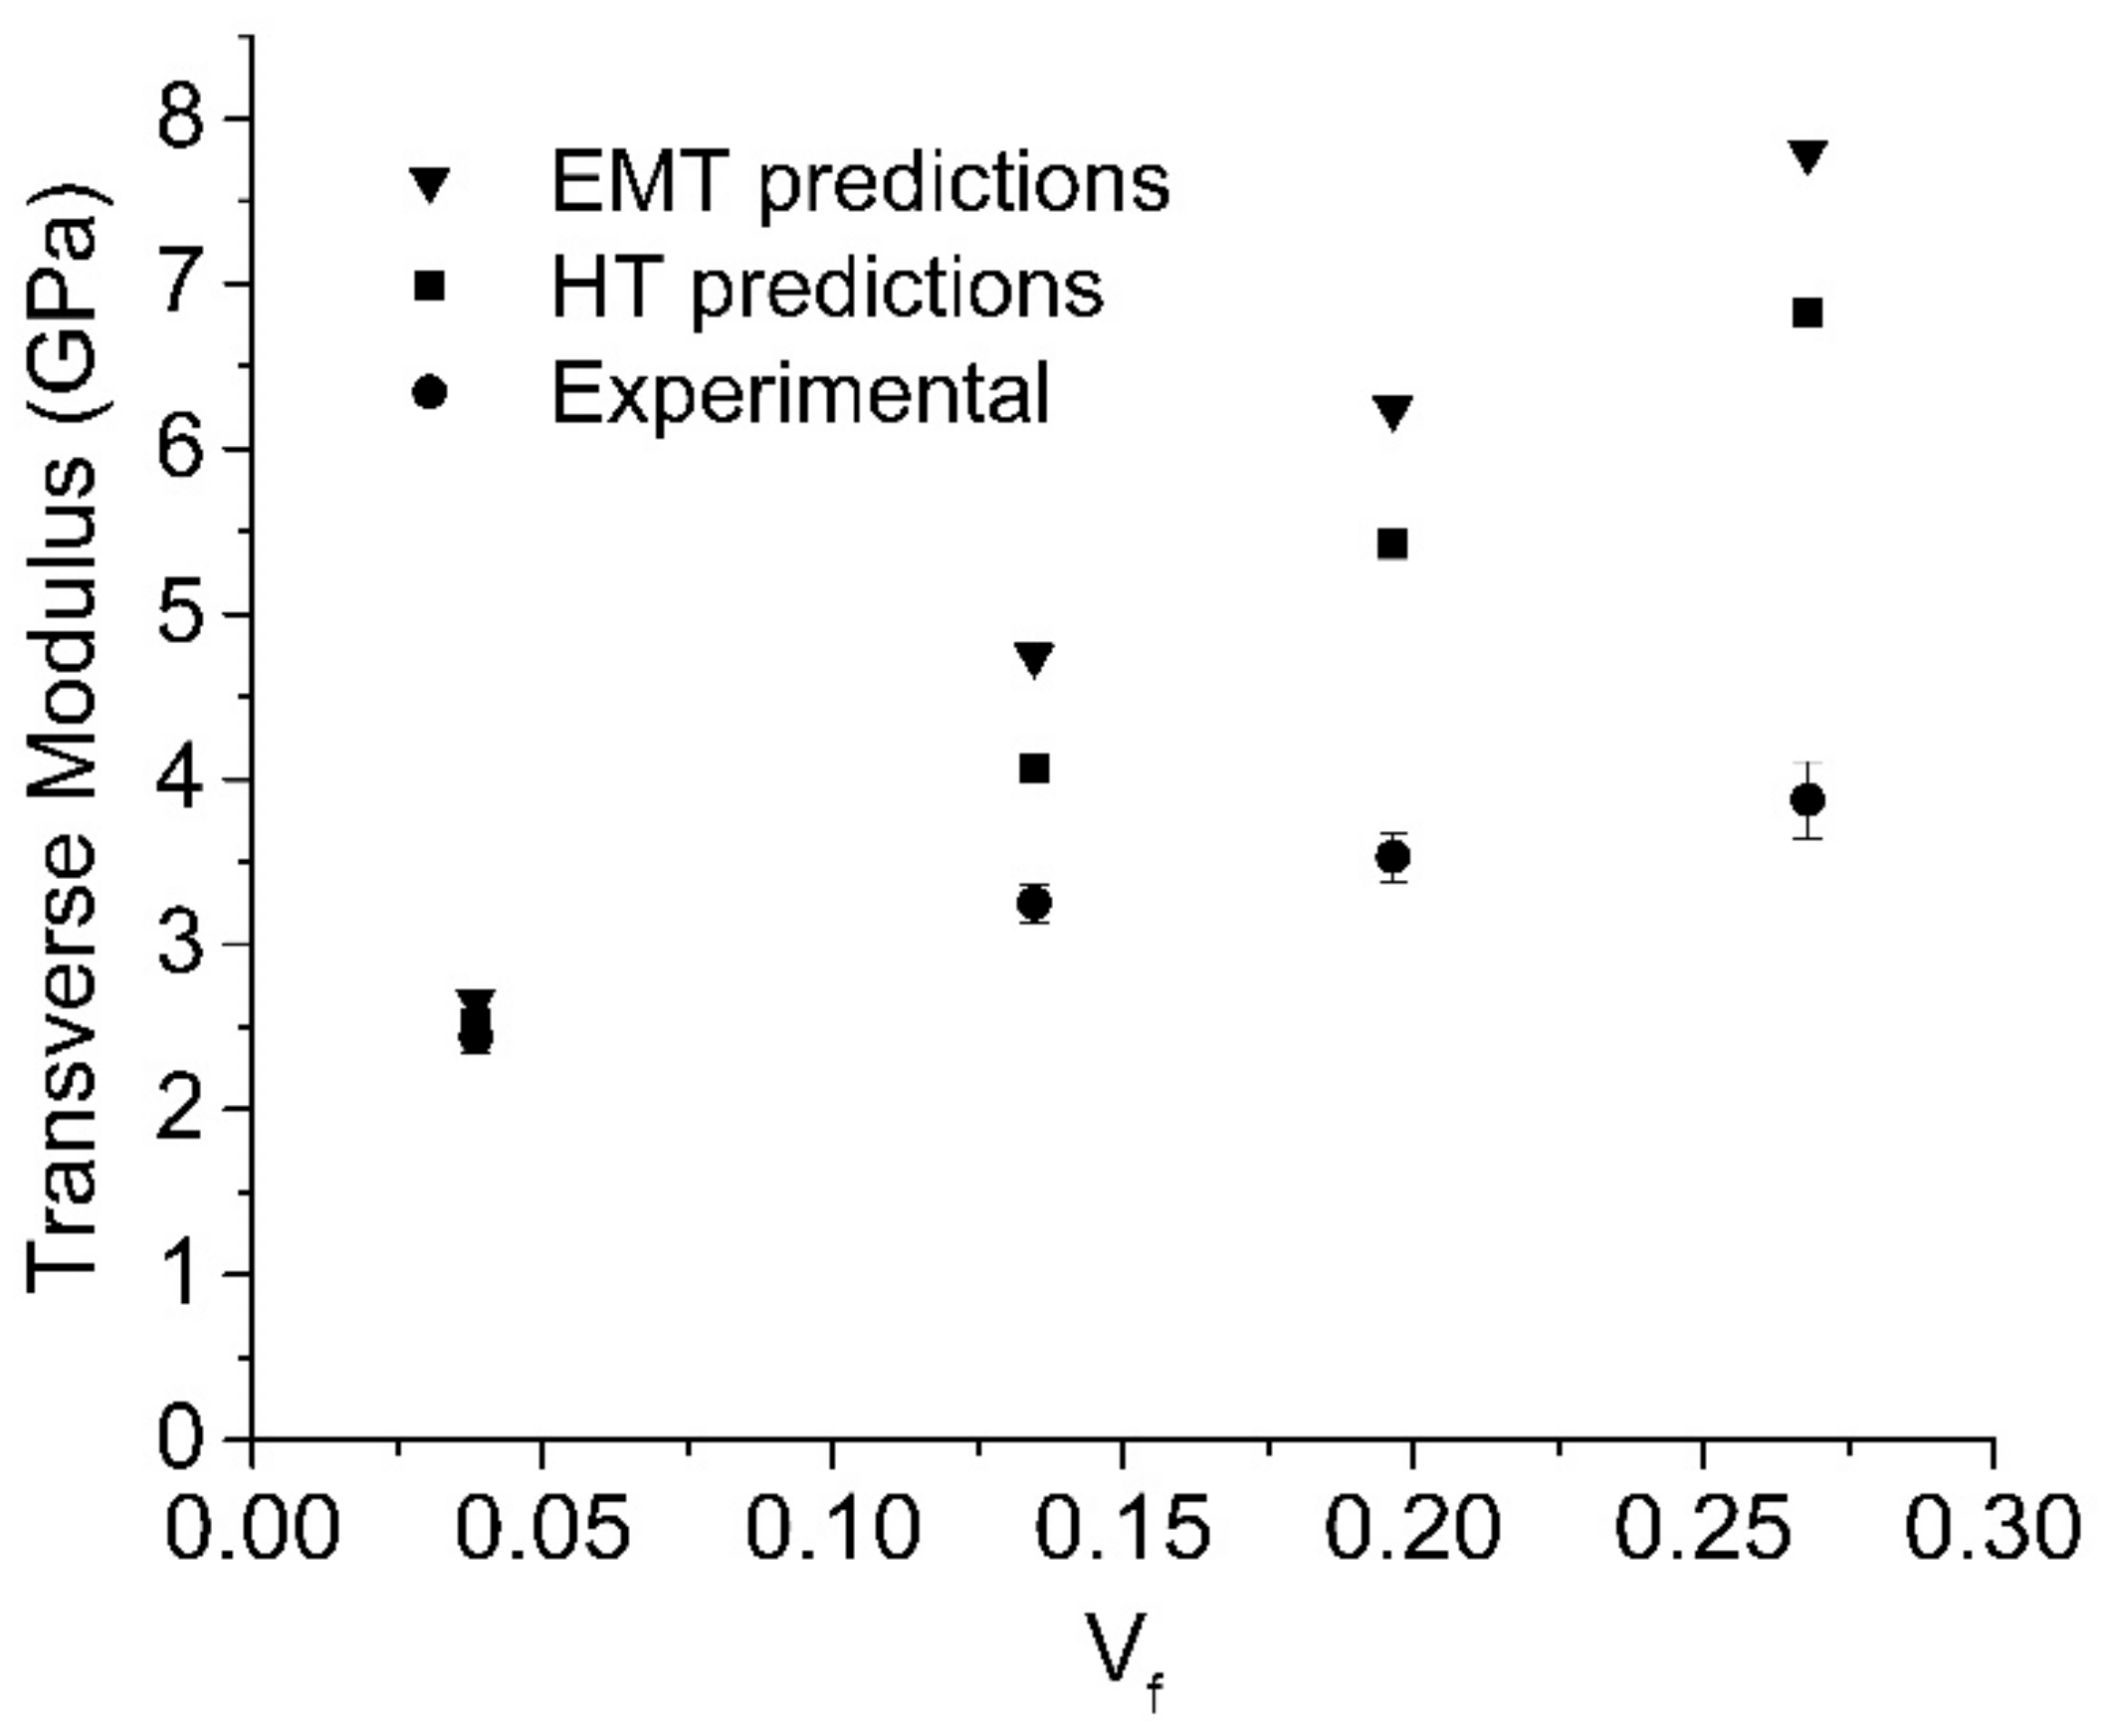
The predictions are also compared with the transverse (θ direction) tensile test results shown in
Figure 6. At most locations through the thickness, the fibers are predominantly oriented toward this direction as shown in
Figure 3. Here, both HT and EMT models are applied with the measured FLD and experimental fourth order orientation tensor. Only at the lowest 10 wt% (
) fiber concentration do the predictions match well with the experimental results. As concentration increases, the deviations of the predictions from the experimental data turn out to be more significant. Several authors [
13,
28] experimentally observed that any incremental increase in fiber content appears to bring a lower improvement in properties than the previous one. That is to say, the mechanical performance of the injection molded LFTs will reach a plateau or even decrease at very high fiber concentration range. There are several possible reasons for the degradation of the mechanical properties. First, due to the non-homogeneous nature of these materials, problems can arise during their manufacture, which result in void content/porosity in the final parts [
29]. Second, there is also a possibility of poor adhesion between the glass fibers and the matrix [
30]. Finally, at higher fiber content, fiber bundles are very common in the injection molded LFTs [
13]. There are two major effects of the presence of fiber bundles on the mechanical performance of the composites. First, the clumping of fibers will reduce the effective fiber aspect ratios in the reinforcement. Second, fiber bundles have an effect on stress concentration. Specifically, the failed fiber will induce stress concentration in those un-failed neighbor fibers within the bundles. This stress concentration occurs during the nonlinear stage of the tensile test [
19,
31]. Therefore, it is valid to ignore stress concentration and exclusively consider the effects of reduced aspect ratio on modulus. In this study, the density of the 50 wt% injection molded samples was measured by the pycnometry method described in Reference [
32]. The density given by the supplier is 1.33 g/mm
3 and the measured value of the injection molded center-gated-disk (CGD) is 1.327 ± 0.0175 g/mm
3, which means the void content/porosity in the final parts is negligible. There is no information about the adhesion between the glass fibers and the matrix from the supplier. In this study, we assume the adhesion is perfect to simplify the problem, which most likely not be true. However, the 10 wt%, 30 wt%, 40 wt%, and 50 wt% materials have the same surface treatments for the fibers (they are the same series using the same formulations). Therefore, it is legitimate to only include the effects of the clumping of fibers on the level-off of the elastic properties of the injection molded LFTs as fiber content increases.
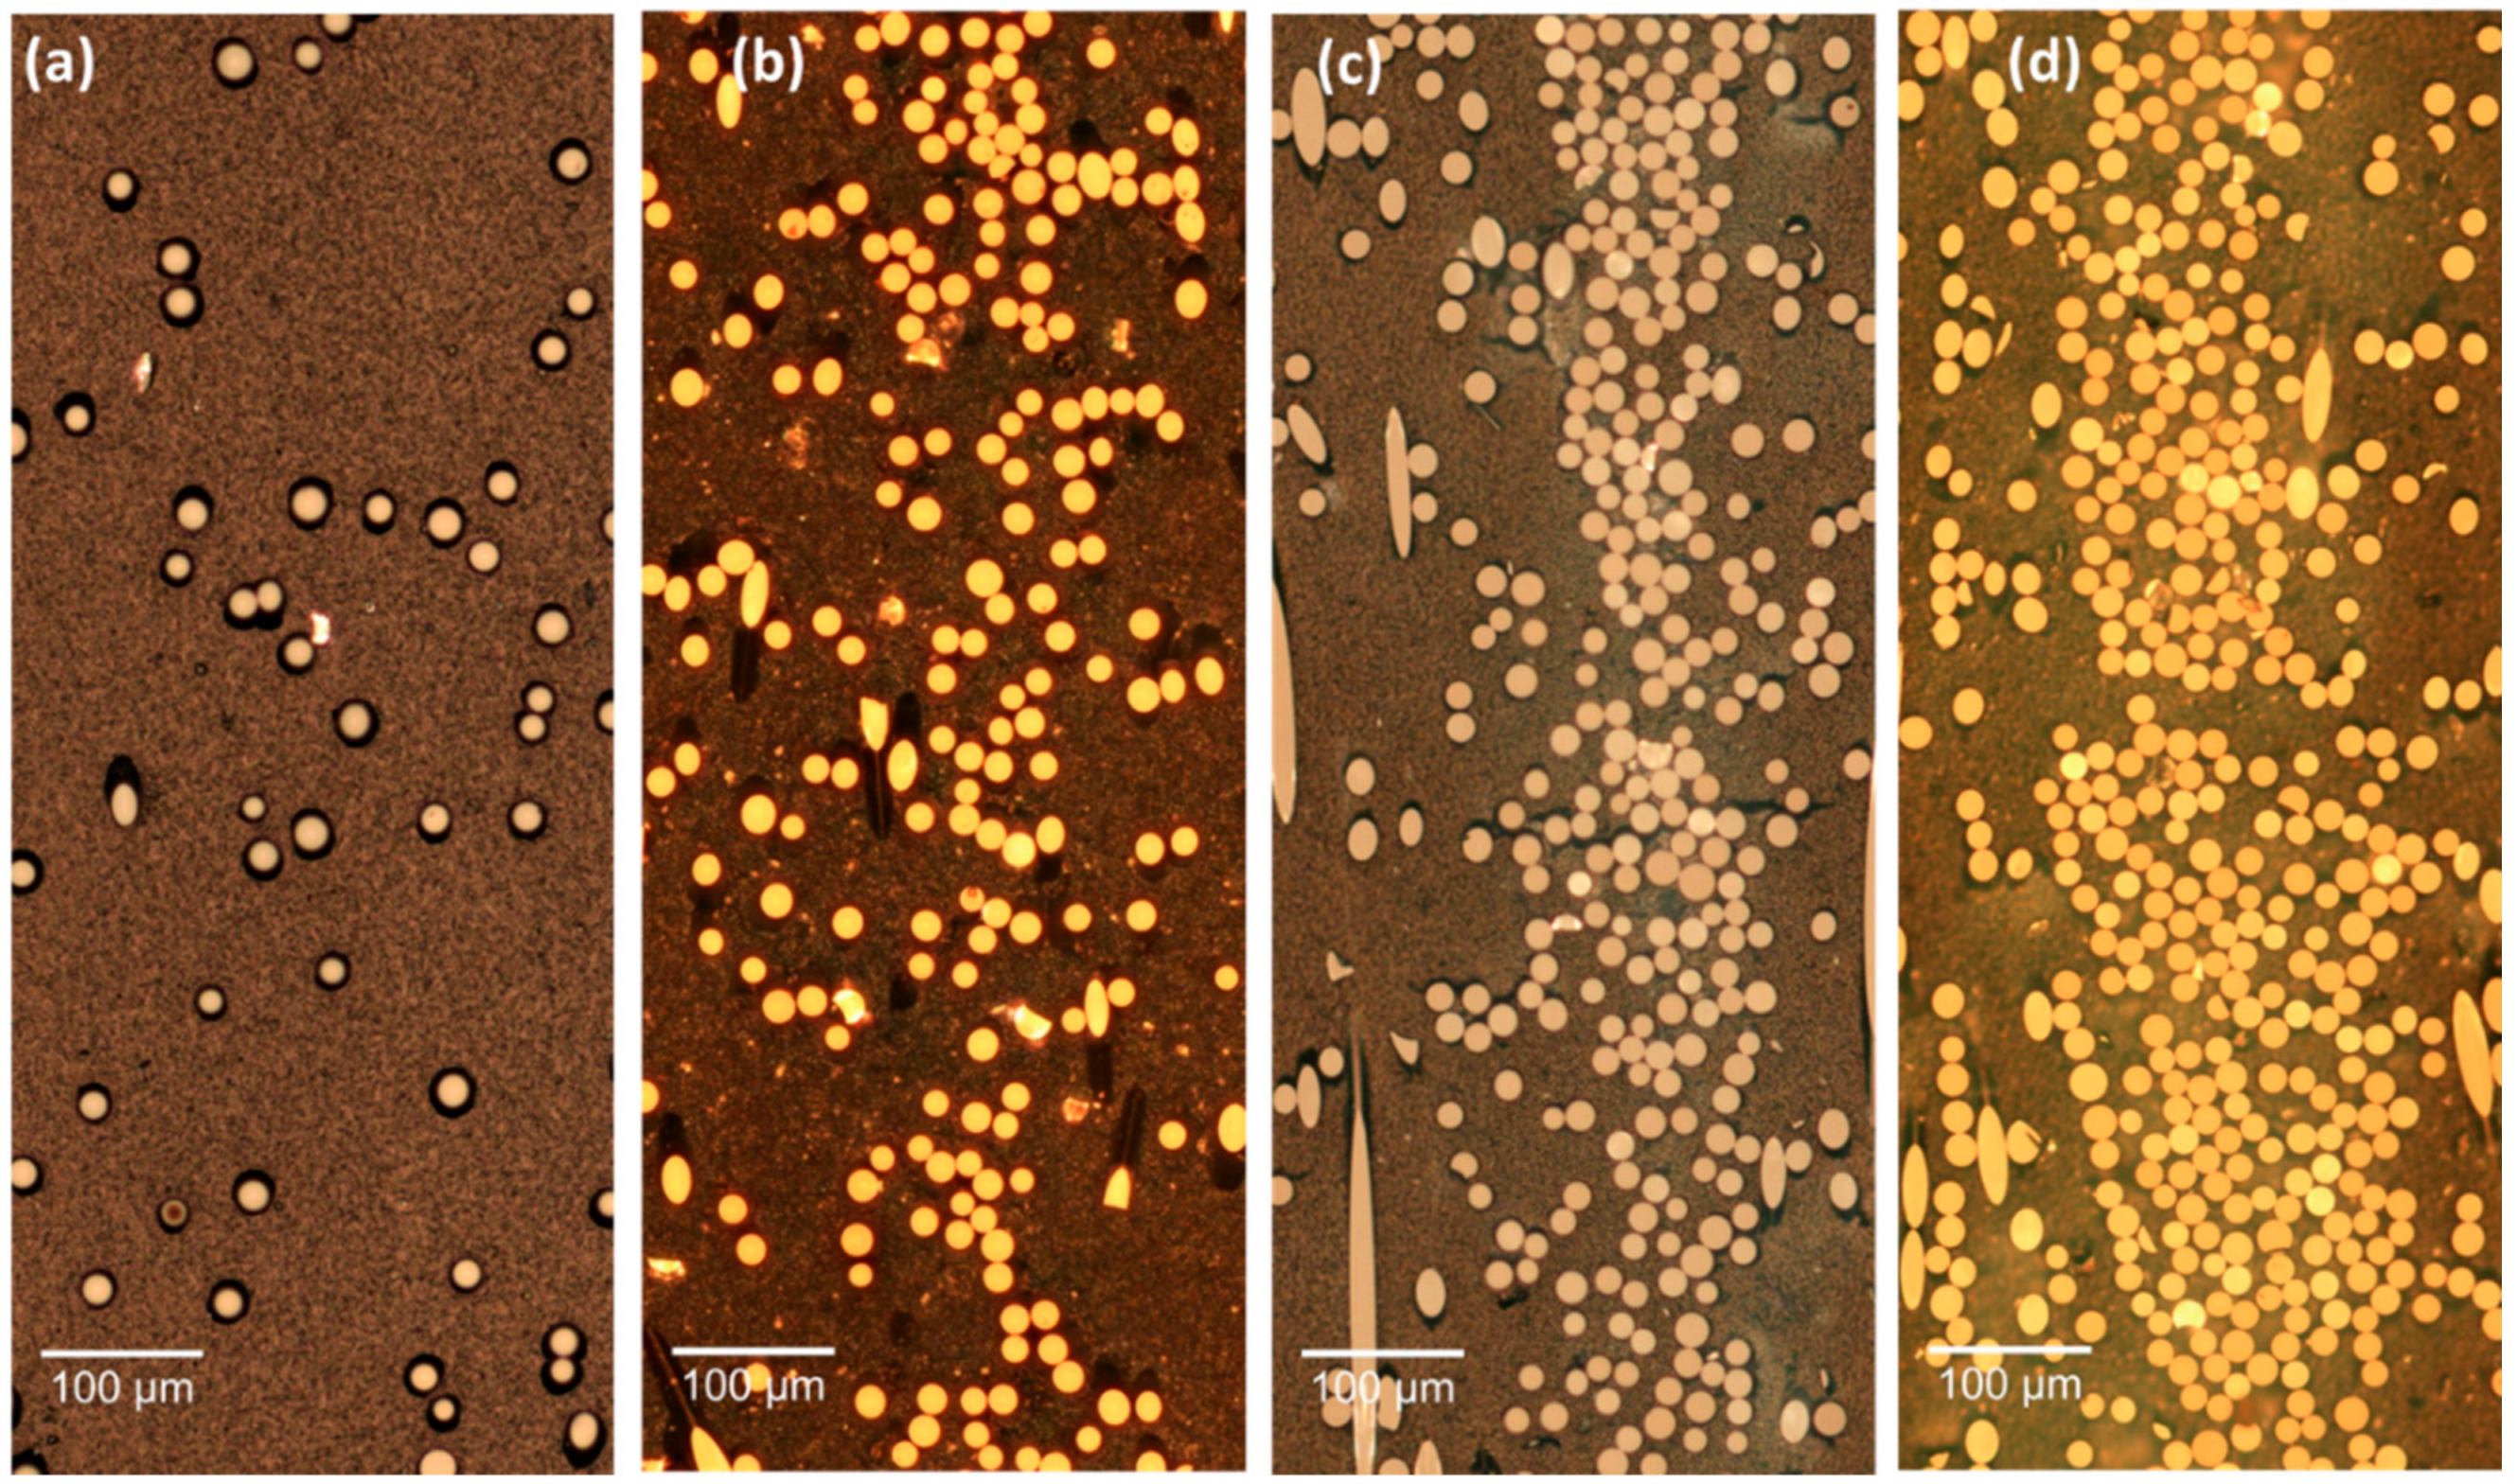
The cross-sectional microscopic images on the
-
plane with glass fiber foot-prints are shown in
Figure 7. It is seen that the clumping of fibers turned out to be worse as fiber concentration increased. To include the effects of reduced aspect ratio on the modulus due to the existence of fiber bundles, an empirical model was proposed to modify the effective fiber bundle diameter
in the stiffness computation.
where,
is the effective bundle diameter,
the single fiber diameter,
a correction coefficient,
the fiber aspect ratio,
the fiber length, and
the fiber volume fraction. There are two empirical parameters, which need to be determined:
is a critical volume fraction, and
is an exponent index. Both
and
can determine the slope and upper boundary of this empirical function. We believe the correcting coefficient
is a function of both fiber volume content and fiber length. At very low concentration (dilute concentration), the fibers have a much less chance to contact with each other and form bundles. The value of
should approach 1.0 at low fiber volume content. In addition,
should also keep increasing with
until reach an upper boundary. So, we modified the form of the logistic function or logistic curve (‘S’ shape) and proposed our empirical model in the form of Equation (10) [
33].
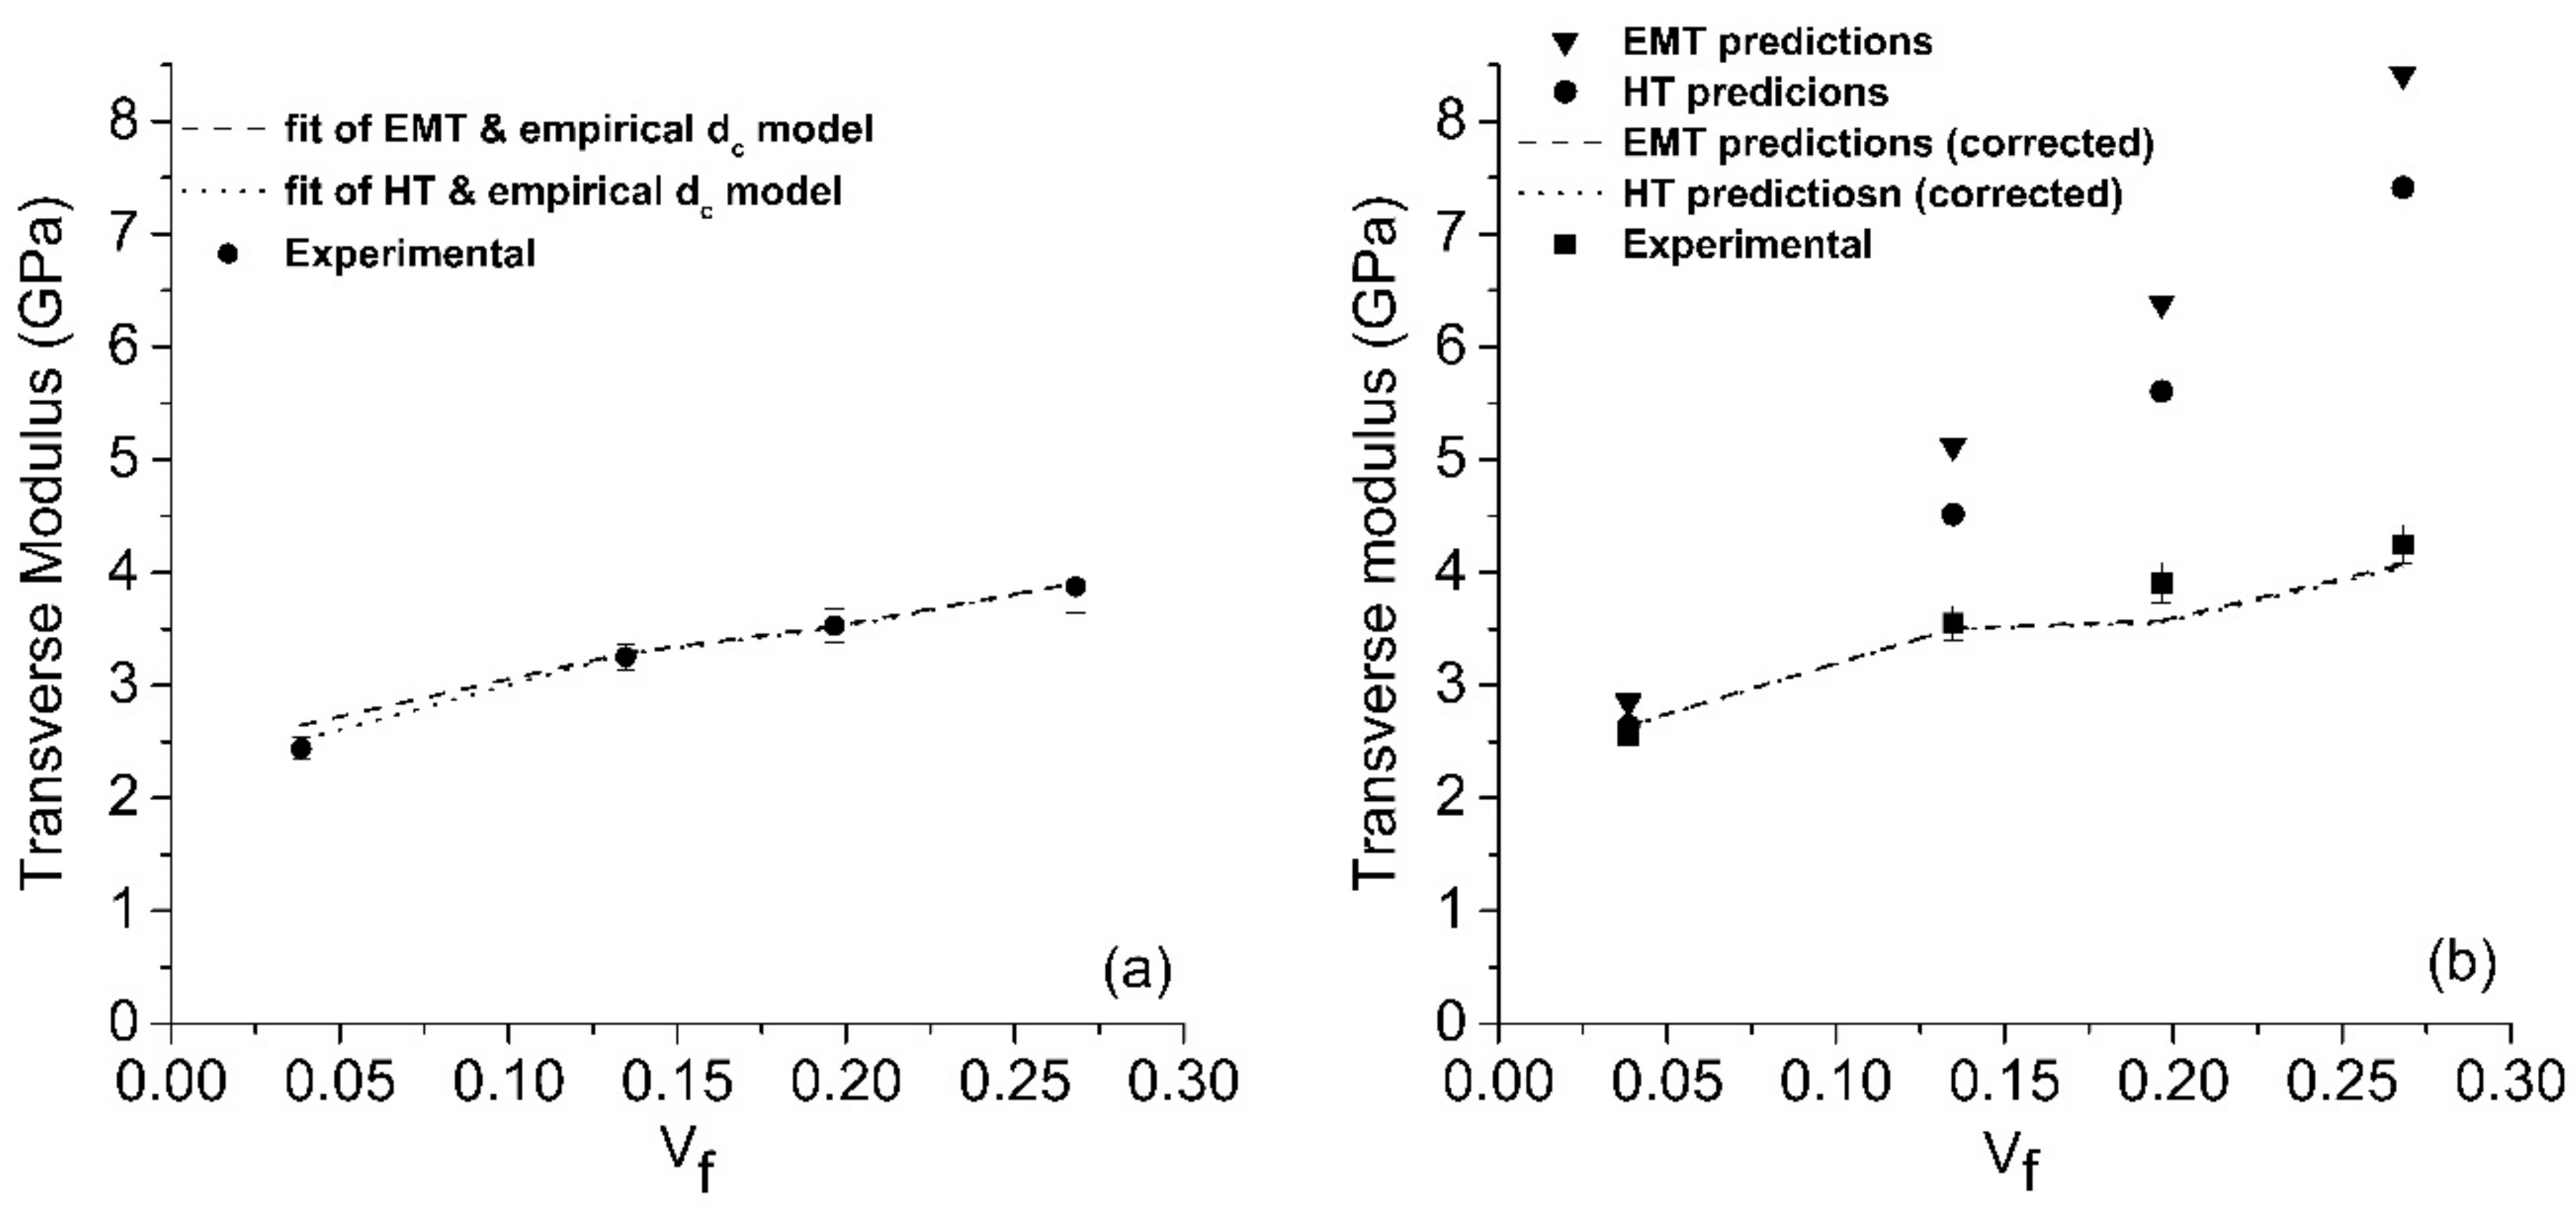
This empirical model was used to correct the bundles’ size and fit both HT and EMT models to the tensile test results in the Hele-Shaw region with the non-linear least squares fitting method. The measured FLD and experimental fourth order orientation tensor were also used in the calculation. The empirical parameters of the
obtained by the fitting of both HT and EMT models are shown in
Table 2. The comparisons of the fitted results with experiments at the Hele-Shaw region is shown in
Figure 8a. After the application of the empirical model, the predictions turns out to be much more accurate when compared with tensile test results. However, this model might over-predict the bundles’ size, because the perfect adhesion between glass fibers and matrix are assumed which might not be true. The empirical parameters obtained from the Hele-Shaw region were applied to calculate the modulus at the advancing-front. The comparisons among the as-calculated predictions, corrected predictions, and the experimental results are shown in
Figure 8b. The predictions also show significant improvement after the diameter correction.
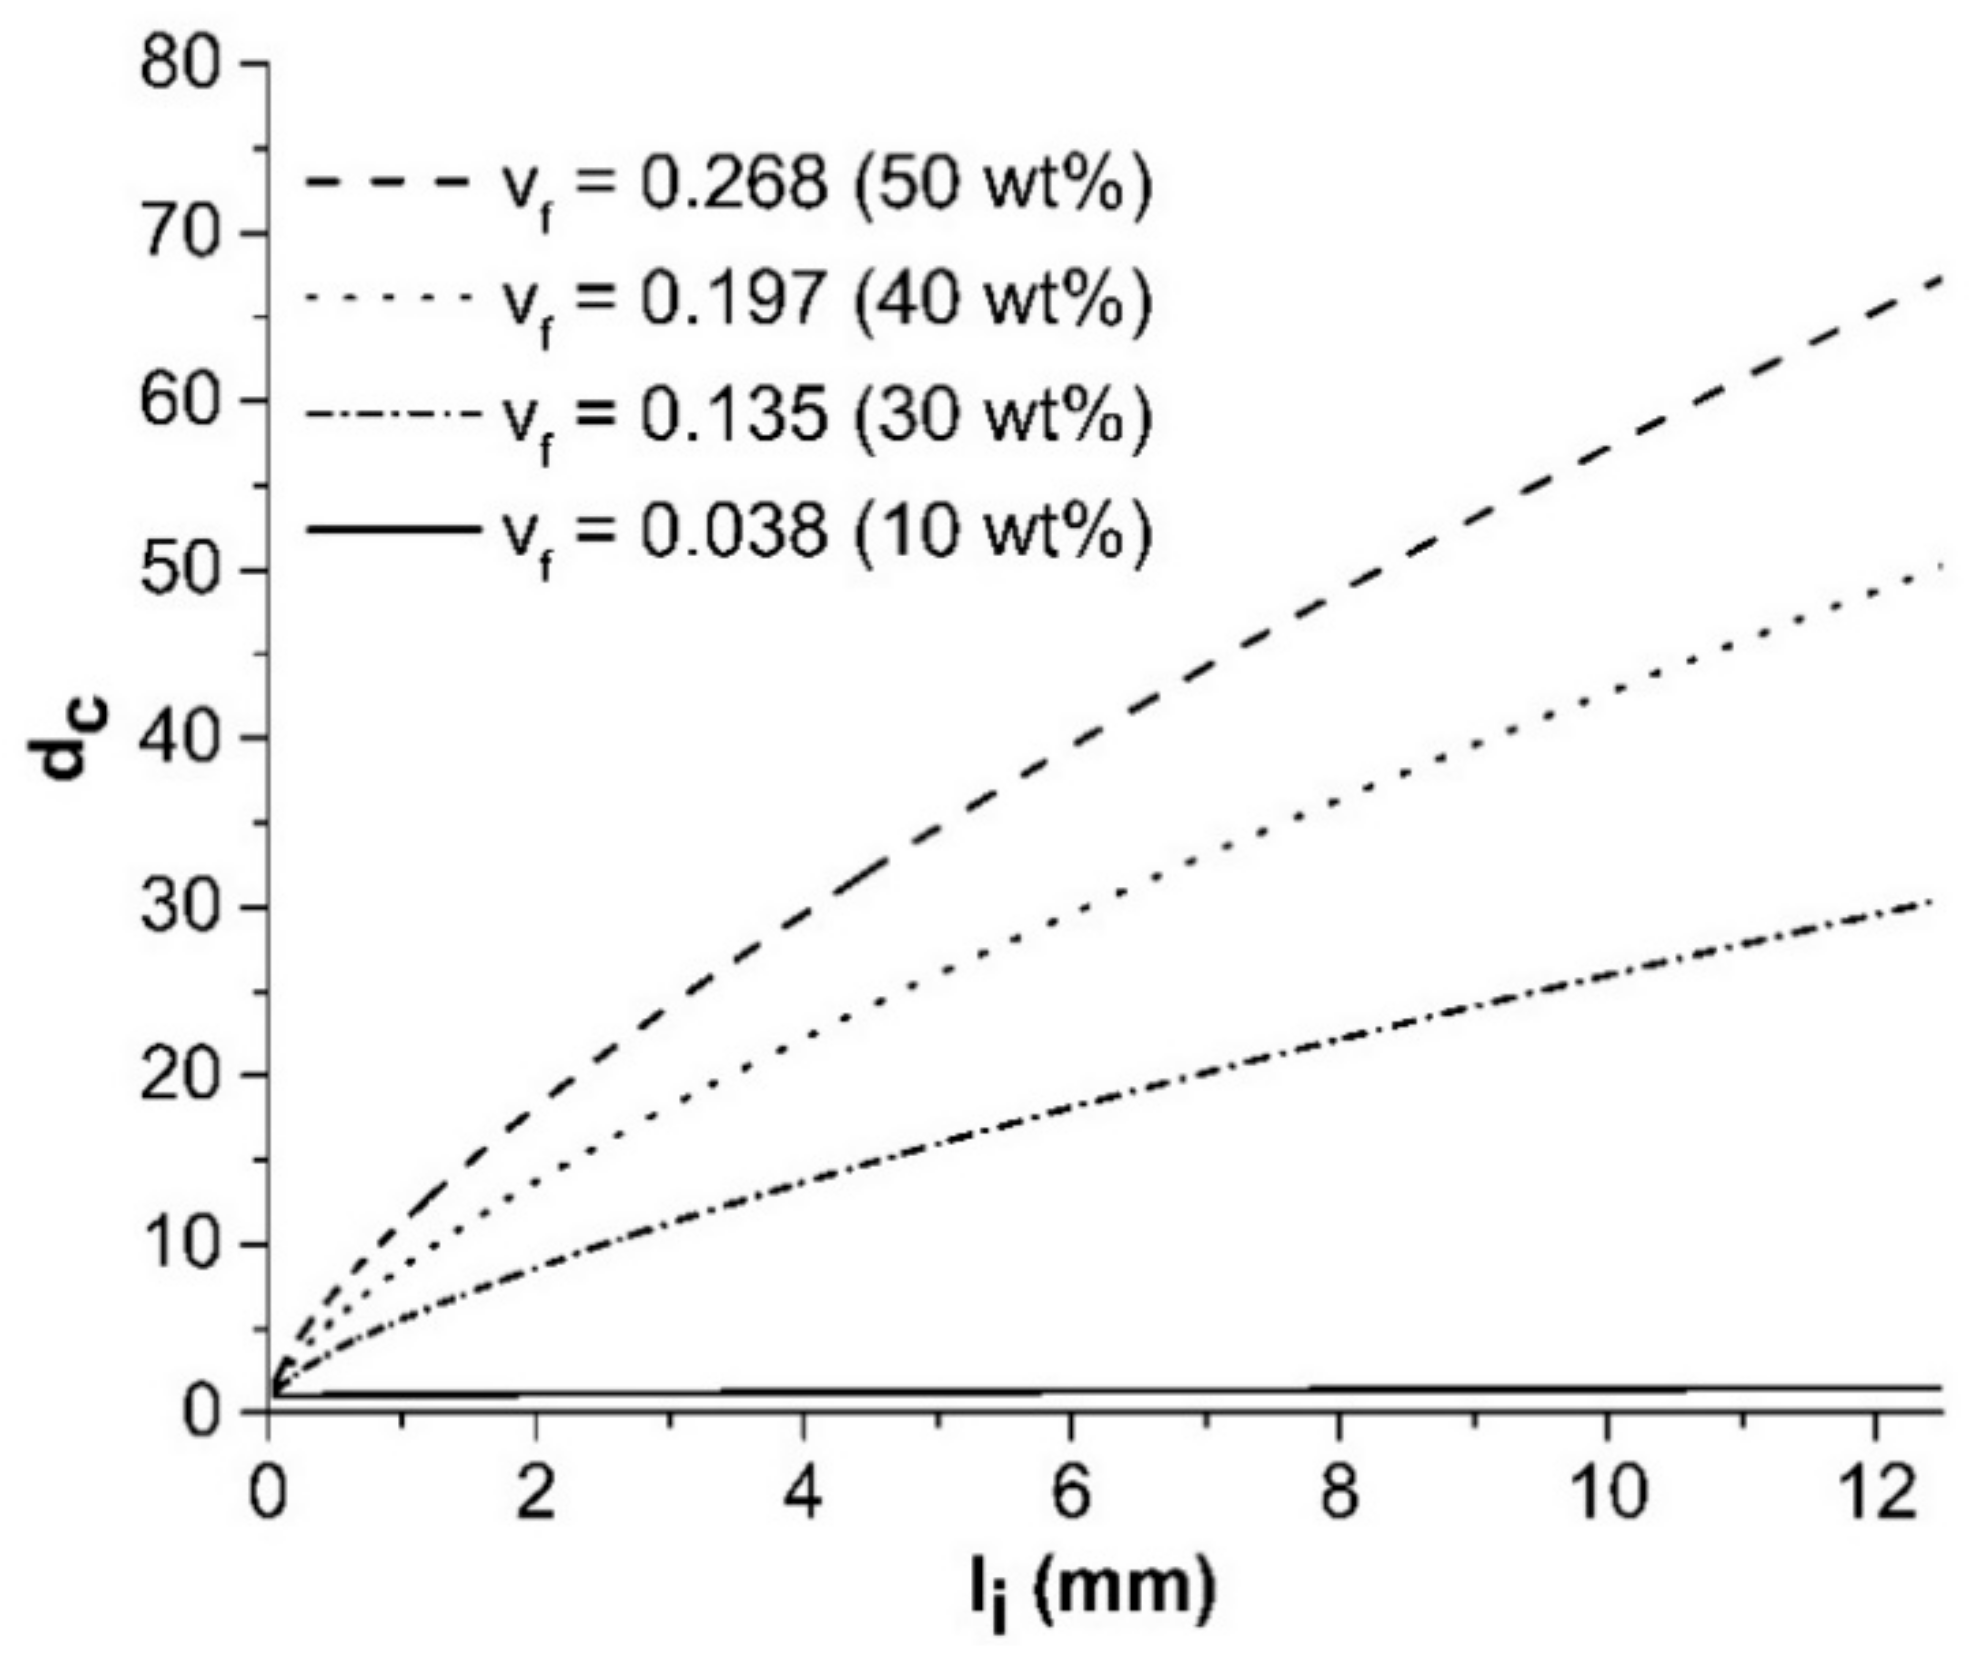
Figure 9 shows the fiber bundles’ size as a function of fiber length at various fiber concentration using Equation (10). The two empirical parameters were obtained by fitting the predictions from the EMT method to experimental tensile data. At low concentration (10 wt%), the magnitude of
barely increased in the length range from 0.06 mm to 12 mm. The slopes of the lines increase notably with concentration. At higher concentration (30, 40, 50 wt%) the values of
show a rapid increase with fiber length. The trends of
can be explained qualitatively from the fiber breakage aspect. At higher fiber content, the dominant fiber breakage mechanisms are fiber–fiber and fiber–machine interactions [
34]. The residual fiber length exhibited a linear decrease following an increase in the fiber content [
14,
35]. Several authors also suggested that the fiber breakage rate was proportional to the fiber length or fiber aspect ratio [
12,
36]. The calculated bundle size,
, for those longer fibers is very large, especially for the 50 wt% fiber content. Qualitatively, under high fiber content, those long fibers have a great chance to contact the neighboring fibers and the machine (screw and wall of barrel). Fiber bundles reduce the effective fiber length or aspect ratio, significantly, allowing the preservation of longer fibers for higher content fiber composites during the intensive injection molding process.


