1. Introduction
Long fiber-reinforced thermoplastics (LFTs) are increasingly being used in a number of industries and applications, mainly in the transportation industry, but also in electronics, durable consumer appliances, sporting goods, and even health care [
1]. LFTs have become an attractive design option due to their improved mechanical properties over short fiber-reinforced thermoplastics (SFTs) while still being suitable for injection molding (IM) [
2].
IM of discontinuous fiber composites imparts a microstructure on the molded material. This underlying structure controls the mechanical properties of the finished part [
2,
3,
4]. Von Bradsky et al. stated that there are three important microstructural variables for discontinuous fiber composites which control the mechanical properties: fiber orientation distribution (FOD), fiber length distribution (FLD), and fiber content (FC) [
5]. The characteristic flow pattern during mold filling and the no-slip condition on the mold walls cause fibers to re-orient, producing a distinctive configuration known as the core–shell structure [
5,
6]. In this structure, fibers near the mid-plane do not experience strong shearing deformations and usually align transverse to the flow direction (core); large shear strains in the regions adjacent to the core cause fibers to have strong alignment in the flow direction (shells). As the mechanical and physical properties of the final part highly depend on the microstructural variations along its thickness [
7,
8], great efforts have been made to accurately measure each important microstructural variable and its correlation with processing conditions [
9,
10,
11,
12,
13,
14].
Parallel to characterization work, many researchers have proposed mathematical models to predict the final fiber configuration in molded components. For example, attempts to characterize FOD date back as early as 1922, when Jeffery described the periodic motion of an ellipsoidal particle under the action of a simple shear flow [
15]. From then, complex models such as the Folgar–Tucker model [
16], the reduced strain closure (RSC), and the anisotropic rotary diffusion (ARD) [
17,
18] have evolved to better account for material characteristics such as anisotropy and fiber volume fraction effects. Comparatively fewer models have attempted predicting the process induced changes in FLD or FC. However, models such as the Phelps–Tucker model for fiber attrition [
19] and Morris–Boulay model for fiber migration have been successfully used in mold filling simulations [
20]. Much of the simulation efforts in IM of LFTs aim to provide mappable data that can be use in finite element analysis (FEA) for making mechanical property and dimensional stability predictions [
21,
22].
Modern measurement techniques such as image analysis of polished micrographs and micro-computed tomography (µCT) can accurately capture the local changes in FOD and FC through the thickness of molded parts [
23,
24]. However, current techniques to measure FLD for LFTs are limited to reporting the global fiber length over the whole part’s thickness. Various studies have reported FLD measurements via µCT (
Table 1); however, as high resolution is needed to differentiate individual fibers (four voxels per fiber diameter [
25]), the size of the evaluated volume is limited to a few millimeters. However, parts molded with LFTs can still have fibers in the 10–15 mm range [
14,
19,
26], far longer than what can be capture with µCT.
This work aims to determine FLD for the core and shell regions independently, by expanding on a currently used fiber length measurement technique [
26]. Mechanical design software can benefit from having through-thickness measurements of FLD, as this additional information means having a more accurate representation of the material. Process simulation software can also benefit, as detailed fiber length data provide a better point of comparison and validation for models predicting fiber damage.
This paper presents an approach for determining FLD in the core and shell regions of IM components. First, the reasoning behind the concept is explained. Second, the characterization methods are described, and an experimental validation of the new approach is presented. Finally, the proposed technique is used for an LFT injection molded plaque and the results are compared with simulation predictions.
2. Rationale
In moldings with 50% weight fraction (wt.%) long fiber reinforced PA66, Bailey and Kraft observed significantly higher fiber length in the core compared to the shell region (
= 1.46 mm,
= 0.55 mm) [
13]. O’Regan and Akay also identified longer fibers in the core region (
= 0.86 mm,
= 0.7 mm) for 60 wt.% long-fiber reinforced PA66 samples [
34]. The standard technique for sample isolation used in these studies involved selecting a small amount of fibers with tweezers after matrix removal. Aside from the risk of short fibers being dropped or fibers breaking, the fiber population in these studies was very low (800–3500 fibers). However, to have statistical confidence, large fiber populations are required, specifically when characterizing LFTs for which the fibers’ aspect ratio can vary over two orders of magnitude.
Since matrix removal is usually achieved through pyrolysis, the shortest fibers tend to fall towards the bottom as the matrix melts and burns-off [
14]. Therefore, to measure FLD in either the core or the shell, such region should be isolated from the complete sample before the pyrolysis step. As the shell is generally thicker than the core and more accessible [
24], we propose measuring fiber length in the shell and indirectly calculating the fiber length in the core. The extraction of the shell is addressed in
Section 3.3. Fiber length in the core can be determined as follows.
FLD data are often given as an average value. However, to properly describe this type of distributions both the number- and the weight-average should be reported.
Similar to the molecular weight distribution, the number-average fiber length
is expressed as
the weight-average fiber length
as
and the total fiber length is described as
For the arbitrary LFT sample A shown in
Figure 1, the averages are calculated from the complete population of fibers inside the sample’s volume. Thus, it is valid to re-formulate Equations (1) and (2) by grouping the addends into sub-volumes B (shells) and C (core). The number average of the entire sample
can then be expressed as
Assuming the sample’s width and length are constant, Equation (4) can be formulated in terms of the local number-average fiber length
where the index K represents individual layers along the thickness of the sample. The changes in fiber content (
) have to be accounted for in order to satisfy mass conservation; that is,
should remain unchanged. Since the objective is determining the length in the core (
), and both the global sample length (
) and the shell sample length (
) can be measured experimentally, Equation (5) can be solved for
The weight-average fiber length in the core () can be calculated in the same way. This approach requires knowledge of the thickness of each layer and the through-thickness fiber content. This information can be obtained from µCT analysis.
3. Materials and Methods
3.1. Material
The material employed in this study was a 20 wt.% long glass fiber reinforced polypropylene (PPGF20, SABIC
® STAMAX
TM). The constituent’s main properties are listed in
Table 2. The initial fiber length is uniform and equal to the nominal length of the pellets.
3.2. Microstructure Measurement Techniques
To calculate the FLD information in the core region of an injection molded sample, the fiber microstructure needs to be fully characterized, starting with the global fiber length. Through-thickness FOD data are needed to identify the thickness of the core region. Additionally, through-thickness FC is required to solve for the core FLD in Equation (6). Various methods exist to quantify each of these properties. The following sections describe the techniques used in the present study.
3.2.1. µCT Analysis
Until recently, the determination of FOD involved physically sectioning the sample and analyzing the cross section via optical microscopy [
9]. In the analyzed cross section, fibers are seen as ellipses and fiber orientation is quantified by measuring the aspect ratio and inclination of the ellipse’s major axis. Similarly, FC has been obtained by quantifying the area fraction of the cross section covered by fibers. Alternatively, through-thickness FC can also be determined by milling thin layers and quantifying the fiber weight fraction via pyrolysis [
24].
μCT technology has gained traction as a method to obtain FOD and FC in a fast and accurate way; it is a non-destructive testing method based on X-ray imaging to inspect the internal structure of a sample. For this study, FOD and FC were determined using an industrial μCT system (Metrotom 800, Carl Zeiss AG, Oberkochen, Germany). Since the fiber diameter is 19 μm, the μCT scan resolution needed to be high. Previous studies with the used material have shown that a voxel size of 5 μm adequately captures the fiber geometry [
24].
Table 3 summarizes the acquisition parameters for the μCT scan.
The X-ray projections were used to reconstruct the scanned sample in 3D, after which an analysis was performed using VG StudioMAX (Version 2.2, Volume Graphics GmbH, Heidelberg, Germany) to obtain through thickness values of fiber volume fraction and second-order orientation tensor components.
3.2.2. Fiber Length Measurement
Measuring the fiber length for discontinuous fiber composites is a time-consuming task since even small samples contain millions of fibers [
26]. The Polymer Engineering Center, UW-Madison, has developed a fiber length measurement technique adapting features from various measurement methods, aiming to reduce the manual input [
26]. The main steps of the technique are depicted in
Figure 2. A 30-mm diameter disk is cut out from the composite part and the matrix is removed via pyrolysis at 500 °C for 2.0 h. A representative subsample is extracted employing a variation of the epoxy-plug method described by Kunc [
14], where UV curable resin is used instead of an epoxy. The subsample is carefully removed with tweezers and a second pyrolysis is performed to remove the resin. The loose fibers are dispersed inside a chamber using an ionized air stream and fall onto an optical glass sheet. The sheet with the fibers is scanned using a flatbed scanner (Epson Perfection V750 PRO; Seiko Epson Corporation, Nagano, Japan). The obtained digital image is optimized in Photoshop and analyzed using a Marching Ball algorithm based on the work of Wang [
35]. The result is a FLD and its average values L
N and L
W. It is known that the down-sampling step skews the FLD since it preferentially captures longer fibers; thus, the Kunc correction is applied to the FLD data [
14].
3.3. Shell Extraction and Experimental Validation
The mathematical approach to determine the fiber length in the core is described above. However, experimental validation was required before the method could be used to measure the FLD in an actual injection molded part. Since the approach is based on extracting a single shell layer and measuring its FLD, it needs to be assured that the extraction method does not damage the fibers. For this purpose, plates with an artificial core–shell structure were fabricated via compression molding, the core FLD was determined with the mathematical approach, and the result was compared with reference samples.
First, PPGF20 pellets were extruded using a single screw extruder (Extrudex Kunstoffmaschinen, Mühlacker, Germany) and a circular 3-mm diameter die, as depicted in
Figure 3 (1). The extrudate was cut into 50-mm strands and placed on a rectangular mold with dimensions 50 mm × 75 mm × 1.1 mm. The strands were aligned parallel to the shorter side of the mold. The extrudate was compression molded using a hydraulic press (Carver 3889.1NE0, Carver Inc, Wabash, IN, USA) with heated platen at a temperature of 210 °C. The resulting thin plates correspond to the core layer of the artificial core–shell sample (
Figure 3 (2)).
To have different lengths for the core and shell, a fraction of the extrudate was pelletized to a length of 3.2 mm and re-extruded (3). The new extrudate was cut into 75 mm long strands, and compression molded using the same mold; in this case, the strands were aligned perpendicular to the shorter side of the mold. The resulting thin plates correspond to the shell layers of the artificial core–shell sample (4). Each core plate was stacked in between two shell plates (5), and compression molded into a 3-mm-thick plate (6). This small compression step aimed to fuse the layers together. For each molded plate variation, four specimens were manufactured in the hydraulic press. From each specimen, two samples were extracted and measured. The average fiber length of the core and shell plates and full stack was recorded to be used as a reference for the later validation (
Table 4). μCT orientation analysis was performed in four specimens, which showed that distinct core and shell layers in the full stack sample were obtained (
Figure 3).
Using the
tensor component as guide, the thickness of the shell layer that is to remain after the material removal can be determined (highlighted in red in
Figure 4a).
The material removal is a critical step since damage to the fibers in the remaining layer must be avoided. For this step, 30-mm disks were cut out of the full stack sample and mounted in resin, in similar fashion to metallographic samples. The mounted samples were carefully grinded in two stages using a polishing disk (Autopolisher Metprep 3 PH-3, Allied High Tech Products Inc., Compton, CA, USA). In the first stage, an aggressive grinding cycle with a 180-grit sanding paper disk was used to remove around 90% of the material. In the second stage, a 600-grit sanding paper disk was used to remove the remaining material until the desired shell layer had been isolated. After the sanding process, the sample was removed from the resin and underwent the fiber length measurement procedure.
Results from this experimental validation are shown in
Figure 4b. From these length values, it can be concluded that the material removal step does not affect the fiber length in a significant way. The reason the fibers are not excessively damaged is the highly planar fiber orientation in the sample (low
values) [
36,
37].
The main objective of this validation was to establish if the core length can be accurately determined with the approach described in
Section 2. With this approach, the orientation data are used to find the thickness of each layer. The fiber length of the full stack sample and the sanded shell layer are used in Equation (6) to calculate the length in the core layer.
Figure 4b shows the comparison between the fiber length of the original compression molded core layer and the calculated fiber length in the core layer. Based on these results, it can be concluded that the proposed approach can be used to measure fiber length in the shell and indirectly determine fiber length in the core, provided the off-plane orientation tensor component has a low value.
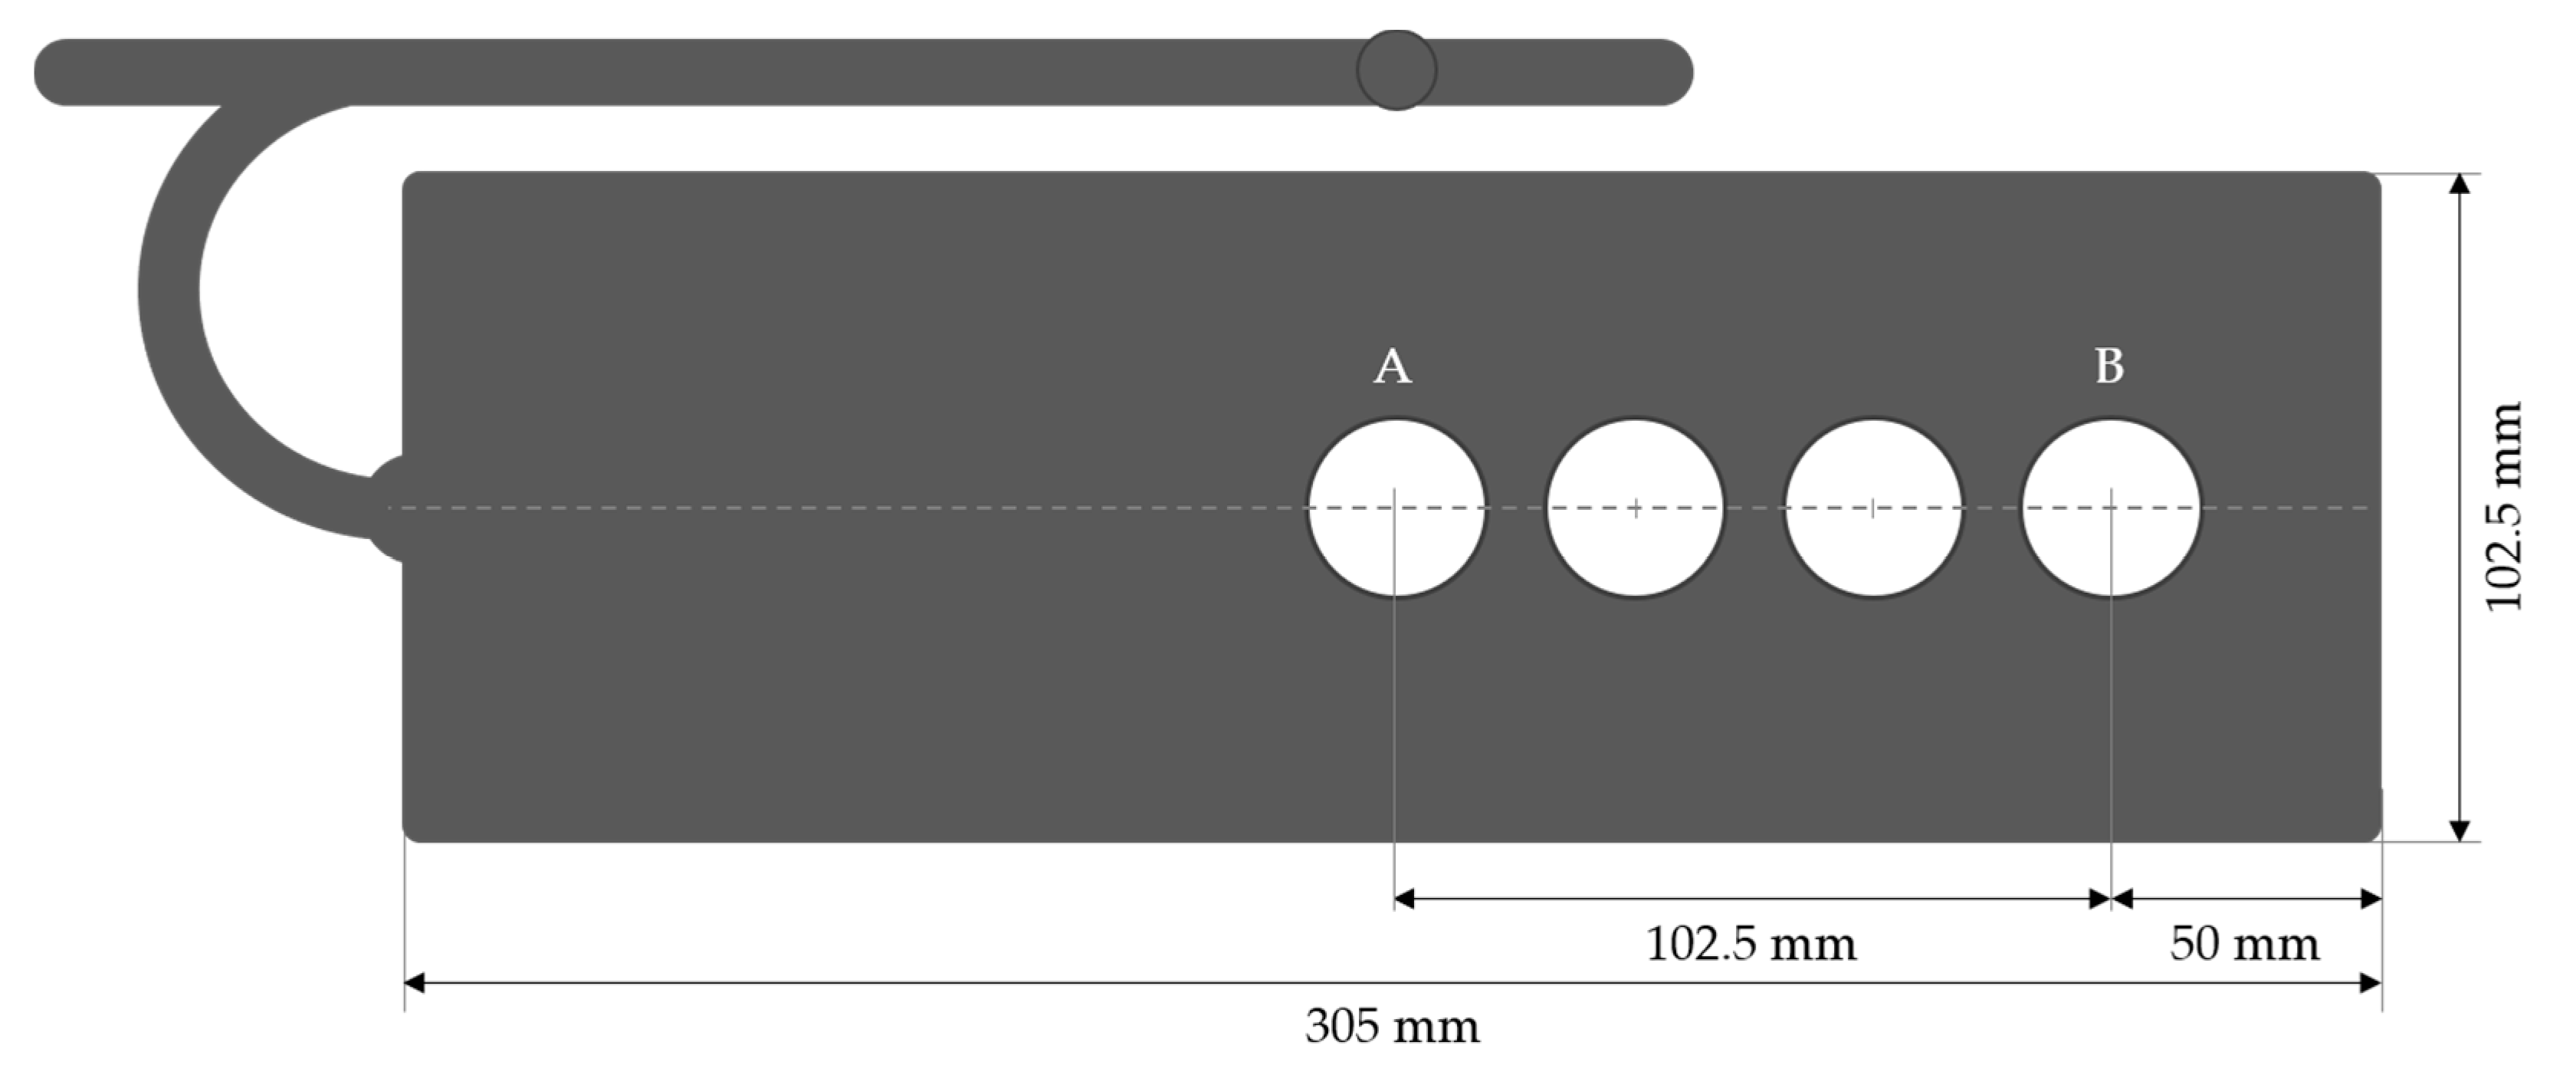
3.4. Injection Molding Plaques
A 130-ton IM machine (SM-130, Supermac Machinery, Gujarat, India) was used to mold a PPGF20 plaque with dimensions 102 mm × 305 mm × 2.85 mm (
Figure 5). The processing parameters followed the suggested processing guidelines by SABIC
® and are listed in
Table 5.
Preliminary analysis of microstructure showed well-defined core–shell layers away from the gate, between locations A and B [
38]. The FOD profile, FC profile, and global FLD remained unchanged between these two locations.
In total, 16 samples were extracted for length analysis (four samples per plaque, as shown in
Figure 5). Half of the samples were sanded to extract the shell layer. Additionally, μCT analysis of fiber orientation and fiber concentration was performed in locations A and B for each plaque.


